characterization of tcp genes in arabidopsis thaliana
TRANSCRIPT

Characterization of TCP genes in Arabidopsis thaliana
by
Rashida Abdulhusein Patel
A thesis submitted in conformity with the requirements for the degree of Doctor of Philosophy
Cell & Systems Biology
University of Toronto
September 7, 2011
© Copyright by Rashida Abdulhusein Patel 2011

ii
Characterization of TCP genes in Arabidopsis thaliana
Rashida Abdulhusein Patel
PhD
Department of Cell & Systems Biology
University of Toronto
2011
Abstract
TCP genes comprise a large family of genes that have been implicated in a diverse range of
plant developmental pathways ranging from lateral branching (Doebley et al, 1997) to organ
symmetry (Luo et al, 1999) and leaf curvature (Nath et al, 2003; Palatnik et al, 2003).
I studied three closely related Arabidopsis TCP genes, one of which was recovered in an
enhancer trap screen to identify downstream targets of the regulator of inflorescence
architecture, BREVIPEDICELLUS (Douglas and Riggs, 2005). The enhancer trap marker line
served as a reporter for TCP15 expression. Data mining has revealed a possible link between
TCP15 and the hormone auxin. Using the DR5::GUS molecular reporter for auxin accumulation
I found that TCP15 and the related TCP14 genes limit auxin maxima in seedling and
reproductive tissues and that auxin transport is necessary for correct TCP15 expression.
The closely related TCP8 gene was found to regulate leaf shape as demonstrated by
decreased leaf index values. The rounder leaves of tcp8 plants also exhibited increased adaxial
trichome and stomatal densities resulting in significantly decreased spacing between adjacent
cells. tcp8 leaves showed increased serration density suggesting that TCP8 limits marginal
outgrowth. Vein patterning was also perturbed in the mutants. Vein loops were rounder and
smaller, and decreased loop subdivision indicated that vein patterning is retarded in the mutant.
TCP8 evokes organ-specific effects on vascular patterning as mutant rosette leaves showed
iii
increased vascular complexity, whereas mutant cauline leaves showed decreased vein
complexity. These results suggest that TCP8 is necessary for correct leaf development.
The Arabidopsis genome contains 24 TCP genes, many of which have not been
characterized. Studies of these genes will lead to the identification of additional factors
necessary to control plant architecture and enable us to optimize plant growth and yield using
genetic engineering.

iv
Acknowledgements
The years that I have spent in the Riggs` Lab during my PhD have been happy ones. I have been
surrounded extremely bright, hardworking, enthusiastic fellow grad students, who I am proud
and honoured to call my friends.
I`d like to first thank my supervisor, Dan. He supported my ideas, and gave me the space to
`branch out` (pun intended), and test my theories. While he allowed me the freedom to explore
and creep into others aspects study often out of the realms of the lab, he always made the time to
talk and listen. There are numerous occasions that I can recall in which ``a brief meeting`` has
turned into an hour long conversation. His faith in me gave me the drive to work as hard as I
could, while enjoying every minute that I spent behind the bench.
No grad student is an island. I have had the privilege of working beside truly extraordinary
people. Najeeb Siddiqui and Scott Douglas set high standards of the type of research that comes
out of this lab. They were very helpful to me when I was starting out, and patiently guided me
through numerous laboratory experiments. I must especially thank Scott for being so gracious as
to share his project with me, and allow me to take over.
Joelle de la Paz, Stefan Rusyniak, Patti Stronghill, Amy Tsung, Paul Turgeon and Esther
Lesmana are dear friends and former lab mates. Joelle’s welcoming attitude made the lab more
of a second home than just a work place to me. I must apologize to her for commandeering
Najeeb`s bench, instead of obeying the natural hierarchical order of the lab bench assignment
order! Stefan’s dry wit and insightful anecdotes about the happenings in the teaching labs
always lightened my mood. Patti and Amy are always there to talk to and are very supportive.
Paul and Esther made the lab such a crazy and happy place, that there was a definite emptiness
when they graduated and left. You both listen to me, make me laugh, and always make time to
hang out with me. I am honoured that you count me as your friend. I miss you two both, and
wish you well in the future.
I`d also like to thank the following people: Dr. Christine Robson, Dr. Allison MacDonald, Dr.
Sasan Amirsadeghi, Dr. Wenzislava Churmoshovka, Dr. Nick Provart, Dr. Anne Gaelle
Rolland-Lagan, Dr. Nancy Dengler, Sandy Saravia, Michael Prouse, Robin Pinto, Raymond Or,
Dr. Clare Hasenkampf, Dr. Sonia Gazzarrini, Dr. Greg Vanlerberghe, Dr. Malcolm Campbell,
Mira Amin, Rebecca Assaf, Lauren Remmler, Valerie Tweedle and Ian Buglass. These people
have been very generous in providing technical expertise/training, use of equipment, use of lab
space, and hands on help to me. Without their help and support this thesis would remain
incomplete.
Last, but definitely not least, I would like to thank my dear parents Abdulhusein and Rukhsana
Patel and my husband Mohamedhusein Esmail. Their unwavering love, support and belief that I
can and will achieve anything my heart desires is the force that drives me daily. There are no
words to express my gratitude to them, and to say a simple ``thank you`` seems inadequate.

v
Table of Contents
List of Tables
List of Figures
List of Appendices
1.0 INTRODUCTION 1
1.1 Arabidopsis as a model organism 1
1.2 The Arabidopsis life cycle 2
1.3 Auxin 3
1.3.1 Auxin Structure 4
1.3.2 Transport route and mechanism 5
1.3.3 Auxin maxima visualization using DR5::GUS expression patterns 8
1.3.4 Auxin perception mutants 9
1.4 Leaf development 10
1.4.1 Parameters affecting leaf growth and development 11
1.4.2 Quantifying leaf shape 12
1.4.3 Cell proliferation versus cell expansion 12
1.4.4 The effect of hormones on leaf development 12
1.4.5 The general process of leaf growth 13
1.4.6 Leaf developmental mutants 13
1.4.7.1 Mutations affecting cell division within the leaf 13
1.4.7.2 Mutants showing altered leaf size due to cell expansion changes 14
1.4.8 Leaf margin type 15
1.4.9.1 The mechanism of serration formation 15
1.4.9.2 The effect of auxin on leaf margin serration 18
1.5 Vein Patterning 19
1.5.1 Quantifying vein pattern complexity 21
1.5.2 Observations of vein development 21
1.5.3 The timing of cotyledon and rosette leaf vein formation 22
1.5.4 Genes specifying vascular fate and the use of markers to track vascular patterning 23
1.5.5 Vein patterning theories 24
1.5.6 Changes in vascular patterning by manipulating auxin flux 26
1.5.7 Mutants affecting vascular patterning 27
1.5.7.1 Mutants forming discontinuous vascular networks/ vascular islands 27
1.5.7.2 Mutants displaying an under-proliferation of vasculature 29
1.5.7.3 Mutants producing an over-proliferation of vasculature 30
1.6 Stomata 31
1.7 Trichomes 33
1.7.1 Trichome initiation 33
1.7.2 The patterning mechanism underlying trichome spacing 35
1.8 TCP Proteins 36
1.8.1 The TB1 protein and closely related homologs in other species 37
1.8.2 The CYCLOIDEA and DICHOTOMA genes 38
1.8.3 The PCF1 and PCF2 proteins 40
1.8.4 The TCP domain structure and function 40
1.8.5 TCP Protein function and interaction 44

vi
1.8.6 Regulation of TCP gene expression 46
1.8.7 Targets of TCP action 47
1.9 Goals for this study: 49
2.0 MATERIALS AND METHODS 51
2.1 Arabidopsis ecotype and mutant origins 51
2.2 General plant growth conditions 51
2.2.1 Genetic crosses 52
2.2.2 Arabidopsis transformation 52
2.3 Hormone assays 53
2.3.1 Auxin inducibility assay 53
2.3.1.1 Auxin inducibility assay: In liquid culture 53
2.3.2 NPA treatment assays 54
2.3.3 Root elongation assays 54
2.3.4 Hypocotyl (light vs dark) length assays 54
2.3.5 The effect of NPA and IAA on leaf serration 54
2.4 Small-scale (mini-prep) plant leaf DNA extractions 55
2.5 Polymerase Chain Reaction (PCR) 55
2.6 RNA Work 57
2.6.1 Total RNA Isolation 57
2.6.2 DNase treatment of RNA and Reverse Transcription 58
2.6.3 Quantitative (Real-time) reverse transcription PCR 58
2.7 Histology 59
2.7.1 Vibratome sectioning and confocal microscopy 59
2.7.2 Histochemical GUS assays 59
2.7.3 Scanning electron microscopy (SEM) 60
2.8 WG335 GFP line 60
2.8.1 Identification of WG335 and GFP imaging 60
2.9 Leaf impressions for trichome, stomatal and epidermal cell density quantitation 60
2.10 Vascular pattern characterization (MATLAB) 61
2.10.1 Rosette leaf one studies 61
2.10.2 Cauline leaf studies 62
2. 11 Statistical Analyses 63
3.0 RESULTS PART 1: Examination of TCP15 and TCP14 function 64
3.1 Identification of the role of the TCP family gene At1g69690 (TCP15) 64
3.2 Characterization of the TCP15 and TCP14 mutants 71
3.3 The use of the enhancer trap line WG335 as a tool for TCP15 expression 73
3.4 Auxin inducibility of TCP genes 79
3.5 Regulation of auxin accumulation by TCP14 and TCP15 82
3.6 The effect of auxin transport inhibition on TCP15 gene expression 94
3.7 Root elongation of TCP15 mutants in the presence of auxin 98
3.8 Hypocotyl length differences as a function of light/dark treatment in tcp14 and tcp15
plants 99
RESULTS PART 2: Examination of TCP8 function in leaf development 101

vii
3.9 TCP8 identification and phenotype 101
3.10.1 Leaf size differences between wild type and tcp8 rosette one leaves 106
3.10.2 Leaf shape differences between wild type and mutant rosette one leaves 107
3.11 Epidermal cell density and spacing in rosette one leaves 107
3.11.1 Cell density and spacing quantitation in rosette one leaves 108
3.11.2 The effect of NPA on trichome density 110
3.12 Vascular patterning differences between Nossen and tcp8 leaves 112
3.12.1 Rosette leaf blade differences between Nossen and tcp8 112
3.12.2 Vascular differences between Nossen and tcp8 leaves 113
3.12.3 Petiole differences between Nossen and tcp8 leaves 114
3.12.4 Spatial patterns of vein loop differences between Nossen and tcp8 leaves 121
3.13 Cell density and spacing in cauline leaves 124
3.14 A developmental framework for vascular pattern formation in cauline leaves 1-3128
3.14.1 Cauline whole leaf parameters summary 128
3.15.1 Leaf margin serration in tcp8 cauline leaves 134
3.15.2 The effect of IAA and NPA on leaf serration 136
3.16 Leaf shape differences between Nossen and tcp8 cauline leaves 137
3.17 tcp8 developmental phase defects 138
3.17.1 Light and dark treatment affects seedling development in tcp8 plants 138
3. 18 Summary 139
4.0 DISCUSSION 141
4.1 TCP family members and potential functions 141
4.2 The nature of the interaction between TCP15 and BREVIPEDICELLUS 142
4.3 TCP15 may act as a boundary element 143
4.4 TCP15 expression occurs throughout plant development 145
4.5 A role for Auxin in TCP-mediated function in plant development 146
4.5.1 TCP14 and TCP15 are not regulated by the hormone auxin 146
4.5.2 TCP14 and TCP15 regulate auxin accumulation in seedling and adult tissue 147
4.5.3 NPA alters auxin accumulation and TCP15 expression in cotyledons and leaves 150
4.6 Rosette leaf morphology differences between wild type and tcp8 152
4.7 tcp8 leaves show changes in epidermal cell proliferation and expansion 153
4.8 Changes in cell densities in tcp8 cauline leaves results in cell spacing differences 155
4.9 TCP8 controls cauline leaf margin development 157
4.10 TCP8 regulates dark-mediated growth processes 161
4.11 TCP8 response to hormone treatment 162
4.12 TCP8’s possible role in regulation of the timing of organ development 163
4.13.1 tcp8 rosette one leaves show altered spatial patterns of vein and free vein density 164
4.13.2 tcp8 rosette one leaves exhibit changes in vein loop size shape and subdivision 165
4.13.3 tcp8 node three cauline leaves exhibited changes in leaf morphology and vascular
patterning 167
5.0 REFERENCES 169
6.0 APPENDIX 187
Copyright Acknowledgements 193

viii
List of Tables
Table 1. Arabidopsis mutants and constructs employed in this study.
Table 2. Primer pairs used to genotype TCP8, TCP14, and TCP15 T-DNA Insertion mutants.
Table 3. Primer pairs used to perform quantitative RT-PCR and the program parameters.

ix
List of Figures
1. The chemical structure of various auxins.
2. Active and passive transport of auxin across the cell membrane.
3. The canalization of signal flow hypothesis.
4. The diffusion-reaction pre-pattern hypothesis.
5. The genetic regulation of trichome spacing.
6. A comparison of plant architecture in maize and Teosinte.
7. The shape and morphology of petals in Antirrhinum.
8. The TCP domain is conserved among all family members.
9. The expression pattern of the enhancer trap line WG335.
10. The TCP family dendrogram.
11. TCP15 expression as shown by the eFP browser.
12. Multiple sequence alignment for the protein sequences of TCP15, TCP8 and TCP14.
13. The genetic maps of TCP15, TCP8 and TCP14.
14. Overall plant morphology of tcp15 and tcp14 plants.
15. Overall plant morphology of TCP double and triple mutants.
16. TCP15 and TCP8 single mutants are transcript null.
17. TCP15 reporter gene expression mirrors GFP expression by the enhancer trap line
WG335.
18. A comparison of At1g69680 and TCP15 gene expression using the EFP browser tool.
19. TCP15 expression shown by the WG335::GFP marker line during development.
20. Confocal microscopy showing WG335::GFP expression in developing plants.
21. The enhancer trap WG335 mirrors the expression pattern of the auxin accumulation
reporter DR5::GUS in leaves.
22. Quantitative RT-PCR results for auxin inducibility assay on wild type seedlings.
23. TCP15 is not auxin inducible.
24. DR5::GUS expression patterns in TCP single and double mutant seedlings
25. Altered auxin accumulation in reproductive tissues in TCP mutants. 26. The effect of NPA and TIBA treatment on auxin accumulation in 14 day old DR5::GUS
seedlings.
27. The effect of NPA and TIBA treatment on TCP15 gene expression in 14 day old WG335
seedlings.
28. The effect of 2,4-D on wild type, tcp15 and axr1-3 seedling root growth.
29. The effect of light and dark treatment on hypocotyl lengths of wild type, axr1-3, tcp14
and tcp15 seedlings.
30. A comparison of plant architecture in wild type and tcp8 plants.
31. The overall shape and morphology of tcp8 rosette leaves as compared to wild type
leaves.
32. A comparison of Nossen and tcp8 cauline leaf morphology.
33. Leaf area differences between wild type and tcp8 cauline leaves at nodes 1-3.
34. Leaf perimeter quantitation in wild type and tcp8 cauline leaves at nodes 1-3.
35. Cell morphology of Nossen and tcp8 leaves using scanning electron microscopy.
36. Leaf area and perimeter measurements in wild type and tcp8 rosette one leaves.
37. Leaf index values for fully expanded wild type and mutant rosette leaves.
38. Trichome density quantitation in fully expanded wild type and tcp8 rosette one leaves.
x
39. Pavement epidermal and stomatal cell density quantitation in wild type and tcp8 rosette
one leaves.
40. Trichome and stomatal index values in wild type and tcp8 rosette one leaves.
41. The effect of NPA on trichome density.
42. The effect of NPA on trichome density differences between wild type and tcp8 rosette
one leaves.
43. Whole leaf data for vascular analysis of wild type and tcp8 rosette one leaves.
44. Freely ending vein density and vein density differences between wild type and tcp8
rosette one leaves.
45. Regional division of warped leaf blades for statistical analysis.
46. Spatial maps showing various vein loop parameters in wild type and mutant rosette one
leaves.
47. Trichome density quantitation in wild type and tcp8 cauline leaves at nodes 1-3.
48. Changes in trichome spacing patterns using the trichome index.
49. Stomatal and pavement epidermal cell density quantitation in wild type and tcp8 cauline
leaves.
50. Changes in stomatal spacing patterns in wild type and tcp8 cauline leaves at nodes 1-3.
51. Whole leaf data for wild type and tcp8 node three cauline leaves.
52. Node three cauline leaf size distribution over the course of development.
53. A comparison of serration density in wild type and tcp8 cauline leaves.
54. Leaf index values for wild type and mutant cauline leaves.
55. A comparison of hypocotyl and root length differences in Nossen and tcp8 plants grown
under light or dark conditions.
56. Expression map of microarray gene expression in various TCP mutant backgrounds.
57. TCP8’s proposed role in regulating cell spacing patterns.

xi
List of Appendices
Appendix 1. PCR results of T-DNA single mutant genotyping.
Appendix 2. PCR results of double mutant genotyping.
Appendix 3. PCR results of TCP8 TCP14 TCP15 triple mutant genotyping.
Appendix 4. Leaf perimeter and area results for nodes 1-3 cauline leaves.
Appendix 5. Vein complexity results for nodes 1-3 cauline leaves

xii
List of Abbreviations
2,4-D 2,4-Dichloro phenoxyacetic acid
ABA abscisic acid
ACL5 ACAULIS5
AGO1 ARGONAUTE1
AN ANGUSTIFOLIA
ANT ANTEGUMENTA
ARF AUXIN RESPONSE FACTOR
AS1/2 ASYMMETRIC LEAVES1/2
AUX/IAA AUXIN/INDOLE 3-ACETIC ACID PROTEIN
AuxRE Auxin response element
AXR1-3 AUXIN RESISTANT1-3
AXR1-12 AUXIN RESISTANT1-12
BAP 6-benzylaminopurine
BFA Brefeldin A
bHLH basic helix-loop-helix
BLH2/SAW1 BELL-LIKE HOMEODOMAIN2/SAWTOOTH1
BLH4/SAW2 BELL-LIKE HOMEODOMAIN4/SAWTOOTH2
BP/KNAT1 BREVIPEDICELLUS/KNOTTED-LIKE IN ARABIDOPSIS THALIANA1
BRC1/2 BRANCHED1/2
cDNA complementary (first strand) DNA
CHE/TCP21 CCA1 HIKING EXPEDITION
CIN CINNCINATA
CCA1 CIRCADIAN CLOCK ASSOCIATED1
Col Columbia
CPC CAPRICE
CTD C terminal domain
CUC1/2 CUP SHAPED COTYLEDON1/2
CUP CUPULIFORMIS
CVP1/2 COTYLEDON VEIN PATTERN1/2
CYC CYCLOIDEA
CYCD3 CYCLIND3b
DAS days after sowing
DBD DNA binding domain
DICH DICHOTOMA
DMSO dimethyl sulfoxide
dpg days post germination
dpi days post imbibing
DR5::GUS Direct Repeat 5::β-glucuronidase
FKD1/2 FORKED1/2

xiii
Fv freely ending veins
FUS3 FUSCA3
GA gibberellic acid
GFP Green Fluorescent protein
GH3 GRETCHENHAGEN-3
GL1 GLABRA1
GN GNOM
GUS β-glucuronidase
HIS3 HISTONE3
HVE/CAND1 HEMIVENATA
IAA Indole 3-acetic acid
ICK1 INHIBITOR OF CYCLIN DEPENDENT KINASE1
JAG JAGGED
KAN1/2 KANADI1/2
KNOX KNOTTED-LIKE HOMEOBOX
LEC1/2 LEAFY COTYLEDON1/2
LFY LEAFY
MAX MORE AXILLARY BRANCHING
MP MONOPTEROS
Nos Nossen
NAA 1-napthaleneacetic acid
NAM NO APICAL MERISTEM
NLS nuclear localization sequence
NPA 5’-Azido-[3,6-3
H2 ]-1-napthylphthalamic acid
PIN1 PIN-FORMED1
PCR Polymerase Chain reaction
PCF PROLIFERATING CELL NUCLEAR ANTIGEN FACTOR
PCNA PROLIFERATING CELL NUCLEAR ANTIGEN
PHAN PHANTASTICA
PHB PHABULOSA
PHV PHAVOLUTA
RAM root apical meristem
REV REVOLUTA
RT reverse transcription
RT-PCR Reverse transcription polymerase chain reaction
RON2/LUG ROTUNDA2/LEUNIG
ROT3 ROTUNDIFOLIA3
ROT4 ROTUNDIFOLIA4
RTN/ER REDUCED TRICHOME NUMBER/ERECTA
SAM shoot apical meristem
SD stomatal density
SDS Sodium dodecyl sulfate

xiv
SEM Scanning electron microscopy
SER SERRATE
SFC SCARFACE
SI stomatal index
STM SHOOTMERISTEMLESS
SMP SWELLMAP
SYT SYNOVIAL SARCOMA TRANSLOCATED
TB1 TEOSINTE BRANCHED1
TCP TEOSINTE BRANCHED2 CYCLOIDEA PCF1/2
TI trichome index
TIBA 2,3,5-triiodobenzoic acid
TIC TCP INTERACTING WITH CUPULIFORMIS
TKV THICKVEIN
TTG TRANSPARENT TESTA GLABRA
TRN1/2 TORNADO1/2
TRY TRYPTICHON
URF unique residue frequency
WG335 Enhancer trap line WG335
YAB3 YABBY3

1
1.0 Introduction
Plant growth and development is governed by a variety of biotic and abiotic factors. Unlike the
animal body whose final body fate is determined and generated by the end of embryogenesis,
plants have retained the ability to generate their final body forms post-embryonically. This may
be the evolutionary result of being constrained to their environments as sessile organisms.
While the time frame and plasticity of development are two factors that distinguish members of
the animal and plant kingdoms, many of the basic mechanisms for growth are conserved.
Apical-basal body patterning, circadian rhythms, hormone perception and signal transduction,
and basic mechanisms of ion transport, gene expression, regulation, and macromolecule
catabolism and anabolism are a few examples of fundamental processes that occur in most
organisms, and can be studied with ease in a plant model organism such as Arabidopsis. Even
the study of more plant specific processes, such as leaf morphogenesis can be applied to organ
development in animal systems, as the basic principles underlying development such as cell
proliferation, expansion and differentiation are essentially the same.
1.1 Arabidopsis as a model organism
Arabidopsis thaliana is an ideal model organism to study development (Meinke et al. 1998). It
has a small genome of about 120 megabases, which codes for about 27 000 genes (Swarbreck et
al. 2007). The Arabidopsis genome contains very little repetitive DNA, in contrast to a large
amount of transposon derived repetitive DNA found within the maize genome. A large
percentage of the genes found in the Arabidopsis genome are putative homologues to genes
found in a wide range of organisms including bacteria, yeast, and humans. Arabidopsis was
chosen as the candidate plant model organism for two reasons: the relative ease of
transformation to generate transgenic organisms, and the small size of the genome which is
amenable to detailed molecular analysis. This plant is very convenient to study given its small
stature, short life cycle (approximately six weeks from seed germination to production of the
first seeds), ease of mutagenesis, and high fecundity. It is easily propagated on soil or in tissue
culture.
Highly conserved biological processes and pathways common to higher eukaryotes have been
elucidated in Arabidopsis. Some examples include detailed work characterizing ion transport
and fatty acid biosynthesis (Meyerowitz and Somerville, 1994). Other milestones in
Arabidopsis research include the identification of the first hormone receptor (ethylene) in plants

2
and elucidation of the associated signal transduction pathway (Chang et al. 1993), the
identification of factors important in developmental transition to flowering, the identification of
factors necessary to pattern floral organ development (Coen and Meyerowitz, 1991) and the
generation of the model describing how these genes determine floral organ identity.
Arabidopsis has many applications to the biological and agricultural fields. This plant has been
used to elucidate biological pathways involved in the identification of a human retinal
photoreceptor, based on similarity to the phytochrome receptor CRYPTOCHROME 2 (CRY2)
(Miyamoto and Sancar, 1998). Arabidopsis has the potential to further advances in crop
engineering. Ongoing research has identified the genes involved in producing disease and cold
resistant plants (Bent et al. 1994; Xin and Browse, 1998), boosting seed production, and in the
production of designer plants that are resistant to pathogen infection.
1.2 The Arabidopsis life cycle
The plant life cycle can be divided into discrete stages of development. These are the
embryonic, juvenile vegetative, adult vegetative, and reproductive stages (Poethig, 1990).
During embryogenesis, both the apical-basal body plan of the plant is determined, in addition to
the generation of the root and shoot apical meristems (RAM and SAM, respectively). The RAM
and SAM contain two centres of stem cells which are groups of slowly dividing pluripotent
cells. The RAM and SAM are the progenitors of all below ground and above ground tissue,
respectively (Barton and Poethig, 1993).
Germination marks the onset of juvenile vegetative development. Rosette leaves are initiated
about the central axis of the plant in a spiral phyllotaxy (Furner and Pumfrey, 1992). Very little
internode growth occurs between successive leaves, thus leaves appear to be formed in one
plane. The leaves produced in this stage of development are rounded, have a relatively smooth
leaf margin, and an elongated petiole. Rosette leaves are distinguished from cotyledons by the
formation of trichomes on the adaxial (upper) leaf surface, whereas cotyledons are glabrous
(smooth, free from trichomes). Trichomes are unicellular hairs that form on leaf and stem
surfaces.
The type of lateral organ formed about the meristem is determined by the phase of growth and
the meristem type. During vegetative growth, leaves are formed about the meristem. During the

3
reproductive stage of development, the meristem adopts inflorescence and floral meristem
identity, forming flowers and floral organs about the respective meristems.
The onset of adult vegetative development is marked by the production of adult leaves (later
formed rosette and cauline leaves). A hallmark of adult leaf development is the appearance of
trichomes on the abaxial (lower) surface of leaves. Rosette leaf seven and onwards are more
elongate, exhibiting decreased petiole lengths, and display a more serrated leaf margin and are
therefore classified as adult leaves. Cauline leaves have a reduced petiole and a serrated margin.
Adaxial trichome number decreases with increasing leaf number in this stage (Marks, 1997).
Another feature of this stage of development is the production of lateral branches through the
activation of axillary meristems which form in the axils of rosette and cauline leaves.
The switch to reproductive development is marked by an increase in internode length (a
phenomenon called bolting). As a consequence of this, the plant increases in height. Also in this
stage of the development the transition of vegetative meristems to inflorescence meristems
occurs, from which floral meristems are produced. Floral meristems give rise to flowers and
ultimately to fruit and seeds. The onset of this stage is marked by the induction of floral identity
genes, which determine organ identity (Bowman et al. 1989, 1991). Environmental factors such
as photoperiod length govern the timing of this transition. Short days delay the onset of
flowering whereas long days promote early onset of flowering in Arabidopsis (Chien and
Sussex, 1996; Telfer et al. 1997; Clarke et al. 1999). Arabidopsis produces radially symmetric
flowers that are comprised of four sepals, four bilaterally symmetrical petals, five-six stamens,
and two fused carpels that make up the central gynoecium (Smyth et al. 1990). Self fertilization
results in developing embryos located in the ovules within the gynoecium. The ovules become
the seeds of the plant, which will be later dispersed.
1.3 Auxin
Hormones play a critical role in plant growth and development. Most often, they are part of a
regulatory loop in which their accumulation patterns affect gene expression and plant
physiological responses, and in turn plant gene expression modulates hormone synthesis,
transport, accumulation and perception. The hormone auxin has been implicated in a wide
variety of plant processes (Fujita and Syono, 1996; Mattsson et al. 1999; Sieburth, 1999;
Stirnberg et al. 1999; Rashotte et al. 2000; Reinhardt et al. 2000, 2003).

4
The term „auxin‟ was coined by Fritz Went to refer to a group of compounds that impact
growth (Went, 1935). The hormone auxin has a number of roles in plant development ranging
from mediating gravi and phototropism to predicting sites of lateral organ initiation about the
SAM (Benjamins and Schere, 2008), as well as contributing to vein patterning and leaf shape
development which will be discussed in later sections.
1.3.1 Auxin Structure
Molecules defined as auxins do not have a unifying structure. Some auxins have indole-like
structures, whereas others have phenoxy acid or benzoic acid like skeletons (Figure 1). The
main naturally occurring free auxins are indole-3 acetic acid (IAA), and indole-3-butyric acid
(IBA). The two commonly used synthetic auxins are 2, 4-dichlorophenoxyacetic acid (2,4-D)
and 1-napthaleneacetic acid (NAA) (Ferro et al. 2010).
Figure 1. The chemical structure of various auxins. The two naturally occurring auxins (IAA and IBA) are illustrated on the left hand side of the figure. The two most commonly used synthetic auxins used (2,4-D and 2-NAA) are shown on the right hand side of the figure.
Auxins exist in two forms within plants. Unconjugated or free auxins are the biologically active
form of auxin (Normanly, 1997). Conjugated auxins represent the storage form of auxin. IAA
conjugates exist when IAA is chemically linked to sugars, amino acids, peptides, or proteins via
ester or amide linkages (Normanly, 1997). Conjugated auxin is converted to free auxin either by
slowly occurring hydrolysis which occurs continually, or by rapid enzymatic conversion
(Normanly, 1997). Thus the rate of conjugation and hydrolysis is one mode of regulation of free
auxin levels which ultimately impacts plant physiology in addition to auxin biosynthesis and
transport.
IAA IBA 2-NAA 2,4-D
N H
OH
O
OH
N H
O
Cl Cl
O OH
O
OH
O
5
1.3.2 Transport route and mechanism
There are two main methods of auxin transport. One is fast and non-directional (phloem
transport) which facilitates conjugated auxin transport. The other mode of auxin flux is based
on the chemi-osmotic hypothesis and is known as polar auxin transport (Friml and Palme,
2002). This means of auxin movement is slow, directional, energy requiring, and uses carrier
mediatated transport proteins such as the PIN-FORMED (PIN) proteins. Polar auxin flux
facilitates the transport of free auxins (Lomax et al. 1995).
Polar auxin transport has been demonstrated within differentiated xylem elements by tracking
the movement of radiolabelled IAA (Rashotte et al. 2000). Hypocotyl stem sections
demonstrate that IAA transport in wild type plants is basipetal, even when the stem section is
inverted against the gravity vector. Auxin moves first basipetally from the shoot system into
the root, and then acropetally within the root, from the root tip up into the elongation zone of
the root through the root epidermis.
Auxin movement across the cell membrane occurs by both passive diffusion-mediated and
protein carrier-mediated transport (Figure 2). The hypothesis that an active transporter for auxin
exists is based on the chemi-osmotic hypothesis (Rubery and Sheldrake, 1974; Raven, 1975).
The apoplast is relatively acidic at a pH of 5.5. Thus, a percentage of free auxin exists in its
non-polar protonated form, which can diffuse across the lipid membrane. Cellular influx of
polar auxin is mediated by the AUX1 protein (Marchant et al. 1999). In the relatively basic
environment of the cytoplasm (pH 7.5), auxin is deprotonated, and trapped within the cell. To
facilitate export of deprotonated auxin, PIN proteins mediate directional export of this
compound from the cell across the lipid barrier. The PIN1 protein functions as an auxin efflux
channel protein to polarly transport auxin in a basipetal manner from the shoot to the root
(Okada et al. 1991; Gälweiler et al. 1998; Geldner et al. 2001).

6
Figure 2. Active and passive transport of auxin across the cell membrane. (figure courtesy of Petrasek
and Friml, 2009).
PIN1 functions very early in development to drain auxin out of the cotyledons (Benkovà et al.
2003). This is necessary to maintain appropriate auxin gradients, which mediates proper
vascular and embryo apical-basal patterning (Benkovà et al. 2003). PIN1 is expressed in narrow
cell files in emerging leaves and inflorescence meristems, which correspond to the pro-
vasculature of these structures. This expression is gradually polarly localized to the basal ends
of cells in xylem tissue, through which auxin is transported (Galweiler et al., 1998; Reinhardt et
al. 2003).
pin1 plants are defective in basipetal transport and this causes auxin to accumulate at the basal
ends of cells (Okada et al. 1991; Galweiler et al. 1998). Both polar auxin transport and free
auxin levels are reduced in the mutant, in addition to cell patterning and cell identity defects
(Okada et al. 1991; Galweiler et al. 1998; Mattsson et al. 1999; Benkova et al. 2003). pin1 plant
defects include naked inflorescences, fused cotyledons (Okada et al. 1991), a more highly
branched leaf vasculature in the midvein and adjacent to the leaf margin (Mattsson et al. 1999)
and disrupted tissue organization (Galweiler et al. 1998). Transverse sections of mutant stem
tissue reveal overproliferation of xylem tissue in regions adjacent to leaf attachment points.
Overproliferation of this tissue occurs as a result of poor drainage of auxin from the source
tissue (Galweiler et al. 1998).

7
The PIN proteins are constantly cycling between an endosomal compartment within the cell to
the plasma membrane (Geldner et al. 2001). PIN1 is targeted to the basal ends of cells by
vesicle mediated trafficking (Geldner et al. 2001). GNOM (GN) encodes a protein involved in
vesicle mediated trafficking of the PIN1 protein (Geldner et al. 2001). gn plants show defective
PIN1 protein trafficking to the plasma membrane at the basal end of cells. As a result, PIN1 is
internalized to an endosomal compartment. This phenotype can be mimicked by addition of the
fungal toxin brefeldin A (BFA) which disrupts vesicle cycling. Vesicle-mediated PIN protein
cycling occurs along actin filaments of the cytoskeleton. Vesicle mediated PIN protein cycling
is shared by other membrane bound proteins, as BFA inhibition of protein trafficking also
occurs with plasma membrane H+ ATPases. Cycling of the PIN proteins is also regulated by
auxin itself, such that it prevents the endocytosis step (Paciorek and Friml, 2006). Thus, in the
presence of high levels of auxin, a greater number of PIN proteins are located at the plasma
membrane to facilitate polar auxin transport. This shows that auxin regulates its own transport.
Inhibitors for polar auxin transport exist, such as NPA (5‟-Azido-[3, 6-
H2 ]-1-
napthylphthalamic acid) and TIBA (2,3,5-triiodobenzoic acid). They are proposed to function
by binding the NPA-binding protein which is hypothesized to be part of the protein complex
that binds auxin to mediate its efflux from cells (Zettl et al. 1992). pin1 plant defects are
phencopied in wild-type plants that have been treated NPA, demonstrating that these defects in
pin1 plants are due to a disruption of polar auxin flux (Okada et al. 1991; Galweiler et al. 1998).
Polar auxin transport inhibitors have been demonstrated to cause multiple physiological effects
in wild type plants. Among these are abolishing basipetal transport of auxin (Casimiro et al.
2001), root agravitropism (Rashotte et al. 2000), defects in primary root elongation and lateral
root formation (Fujita and Syono, 1996), formation of needle-like naked infloresces (Okada et
al. 1991; Galweiler et al. 1998), increase in trichome number (O‟Donnell et al. 2004), decrease
in leaf size, reduction in epidermal cell expansion, decrease in petiole length (O‟Donnell et al.
2004), and changes in leaf vasculature patterning (Mattsson et al. 1999; Sieburth, 1999).
Auxin is an important factor in vascular patterning and disruption of auxin transport causes
changes in the vascular pattern of leaves (Mattsson et al. 1999; Sieburth, 1999). Inhibiting
auxin flux perturbs normal auxin accumulation within the leaf. This was observed in rosette
leaves treated with the auxin transport inhibitor NPA (Mattsson et al. 2003). NPA application in

8
early stages of leaf development resulted in a progressive confinement of auxin accumulation to
the leaf margin.
1.3.3 Auxin maxima visualization using DR5::GUS expression patterns
Auxin gradients have been extensively characterized in root and shoot development (Sabatini et
al. 1999; Casimiro et al. 2001; Aloni et al. 2003). The three main tools used to detect auxin are
immunolocalization (Aloni et al. 2003), gas chromatography/mass spectrometry (Cohen et al.
1986; Edlund et al. 1995), and the reporter gene DIRECT REPEAT5::GUS (DR5::GUS,
Ulmasov, 1995). The molecular reporter DR5::GUS is a synthetic construct consisting of
multiple, tandem repeats of a naturally occurring auxin response element (AUXRe) found in the
promoter of the auxin inducible soybean gene named GRETCHENHAGEN3 (GH3) (Ulmasov
et al. 1995). Rapid, transient up-regulation of GH3 expression occurs in response to addition of
the auxin NAA. This AUXRe is used to drive expression of a reporter gene, such as β-
glucuronidase (GUS). Reporter gene expression is indicative of auxin response. The level of
GUS expression is correlated to relative auxin concentrations, hence the DR5::GUS expression
patterns observed have been used as an indicator of auxin accumulation. The validity of this
usage has been verified by detection of actual concentrations of free auxin by
immunocytochemistry work using antibodies directed to IAA and gas chromatography-mass
spectrometry (Sabatini et al. 1999; Casimiro et al. 2001; Aloni et al. 2003; Benkovà et al. 2003)
in order to test the correlation of the strength of the DR5::GUS reporter expression and actual
auxin levels. An advantage of the DR5::reporter system is that it is a quick and simple method
to detect auxin gradients. DR5::GUS has been used to observe auxin gradients in the root and
shoot (Sabatini et al. 1999; Casimiro et al. 2001; Mattsson et al. 1999; Aloni et al. 2003).
Root derived auxin comes from two sources: apically (within the shoot) synthesized and
basipetally transported auxin, as well as de novo auxin synthesis in the root. DR5::GUS
expression has shown that an acropetal gradient of auxin exists in roots of intact seedlings
(Sabatini et al. 1999; Aloni et al. 2003). An auxin maximum forms in the root meristem. This
occurs specifically in the columella initial cells of lateral roots, and the primary root (Sabatini et
al. 1999). There is a proximo-distal and radial gradient of auxin accumulation within the root;
auxin accumulation is highest within the centre of the root, and decreases laterally. The lowest
level of auxin is found at the region farthest from the root tip (Sabatini et al. 1999; Casimiro et
al. 2001; Benkovà et al. 2003; Ljung et al. 2005).

9
The auxin concentration and synthesis gradients formed within the root are influenced by the
addition of auxin (Benkovà et al. 2003). Addition of exogenous IAA results in increased auxin
accumulation within the root, however the spatial pattern of expression remains unchanged.
Addition of the poorly transported auxin 2, 4-D however, results in a diffuse expression pattern
in all root primordium cells.
Similar studies have been performed using the DR5::GUS reporter to examine auxin maxima in
leaves (Aloni et al. 2003). Young leaf primordia show strong DR5::GUS expression in the
stipules, followed by weaker staining at the leaf tip. This pattern is reiterative in later formed
leaves. The youngest set of leaves always shows an absence of GUS staining. Older leaves
show GUS expression about the leaf margin. A basipetal gradient of auxin concentration exists
in leaf tissue. Staining in leaves is more intense in the apical region of the leaf compared to the
basal part of the leaf (hydathodes located more basally stain less than more apically positioned
hydathodes). Later, expression extends from hydathodes into connected veins of all orders.
Expression is also detected at the base of trichomes, which are thought to be secondary sites of
auxin synthesis.
DR5::GUS expression has been studied in greater detail in developing rosette one leaves
(Mattsson et al. 2003). Auxin accumulation was initially found to occur in a discrete region at
the leaf apex which marked the presumptive primary vein. This is termed the distal focus. At
three days post germination, auxin was observed in the presumptive secondary veins, along
with decreased expression in the incipient primary vein. DR5::GUS expression gradually
disappeared from mature veins in the apical region of the leaf and appeared in lobes in the basal
region of the leaf.
This expression pattern of auxin coincides with the timing of vein development, strongly
suggesting a role for auxin in directing vascular patterning. The changes in vascular patterning
upon inhibition of auxin transport (Mattsson et al. 1999, Sieburth, 1999) reinforce the idea that
auxin is the key molecule regulating leaf vascular development.
1.3.4 Auxin perception mutants
Many mutants manifesting auxin defect associated phenotypes occur by mutations in genes
involved in auxin signal transduction and perception. Members of this class of mutants occur in
the AUXIN RESPONSE FACTOR (ARF) and AUXIN RESISTANT/INDOLE-3-ACETIC ACID

10
INDUCIBLE (AUX/IAA) family of genes. These mutants display a variety of defects ranging
from altered auxin gradients, to abnormal vascular and body axis patterning, to changes in cell
identity.
Mutations in some auxin-inducible genes result in a lack of sensitivity of plants to the addition
of auxin. Such plants exhibit altered physiological responses in the presence of auxin compared
to their wild-type counterparts. One common physiological response of plants to auxin is the
formation of lateral roots (Bao et al. 2004). Auxin perception mutants show reduced or no
lateral root formation in the presence of auxin.
Mutants in auxin signal transduction genes show a variety of developmental defects. The
MONOPTEROS (MP) gene is a member of the ARF family. MP has been demonstrated to be an
important regulator of auxin inducible genes, such as AthB20, provascular cell markers
(Arabidopsis thaliana HOMEOBOX GENE8 AthB8), AUX/IAA proteins (IAA1 and IAA19),
and regulators of adaxial leaf identity (PHABULOSA and PHAVOLUTA) (Mattsson et al. 2003).
Defects in mp include auxin insensitivity (Mattsson et al. 2003), defective apical basal axis
patterning in the embryo (Berleth and Jurgens, 1993) and reduced cotyledon vasculature
(Berleth and Jurgens, 1993).
AXR1 (AUXIN RESISTANT1) encodes a subunit of the RUB1 activating enzyme that functions
in the ubiquitin proteosome pathway regulating protein degradation (Dharmasiri et al. 2007).
AXR1 functions in repressing outgrowth of axillary meristems in an auxin-dependent pathway
(Stirnberg et al. 1999). axr1-12 plants are deficient in auxin perception, and display
insensitivity to auxin regulation of apical dominance. Wild-type excised stem nodes are capable
of forming lateral branches due to outgrowth from axillary meristems because of the absence of
the apically derived repressing factor auxin. This outgrowth is repressed if wild-type excised
nodes are exposed to auxin. In contrast, axr1-12 excised nodes showed lateral branching in the
presence of applied auxin.
1.4 Leaf development
Leaves make up a large portion of the plant biomass. They are the main site of photosynthesis
and carbohydrate production. Therefore, it is important to understand how leaf development
occurs and how leaf vascular patterning is regulated, as this is the principal mode of transport of
water, photoassimilates and other molecules throughout the plant body.

11
The leaf is made up of two basic structures; the petiole and the leaf blade. The petiole a narrow
structure located at the base of the leaf blade that attaches the blade to the plant stem.The blade
is the expanded surface of the leaf where gas exchange, light harvesting for photosynthesis and
transpiration occurs. This structure serves a critical role in the plant. In order to facilitate
transport of photoasmiliates, water and minerals from leaves to other parts of the plant, a
complex network of veins is generated. It is through seamless vascular connections within the
plant main body and the petiole that this transport can occur.
While leaves appear to be flat structures, they are composed of multiple layers of tissue (Taiz
and Zeiger, 1997). The outer epidermal layers serve to promote gas exchange through stomata.
A waxy cuticle often exists on top of the the adaxial leaf surface to prevent excess water loss.
The palisade mesophyll layer is rich in chloroplasts, and is where the majority of
photosynthesis occurs within the leaf. The spongy mesophyll layer contains loosely packed
cells to permit temporary storage of water, gases and sugars. Veins are found within the spongy
mesophyll layer.
Several characteristic surface structures are associated with leaves. These include stipules,
hydathodes, trichomes and stomata. Stipules are outgrowths formed in the leaf base region
(Nelson and Dengler 1997). Hydathodes are thought of as modified stomata (Nadeau and Sack,
2008), and are regions of water release (guttation) from the leaf. hydathode number increases
with leaf number (Candela et al. 1999). Rosette leaf number one has three hydathodes, rosette
leaf three has five, and rosette leaf eight has seven. Trichomes are unicellular projections
emanating from the cell surface, with a diverse range of functions including preventing plant
herbivory, water release, and water uptake (Esau, 1977). Stomata are pores formed by the space
between paired guard cells that mediate gas and water exchange. The aperture size of this pore
can be regulated based on water availability and humidity (Nadeau and Sack, 2002; Casson and
Gray, 2007).
1.4.1 Parameters affecting leaf growth and development
Sunlight levels regulate organ growth by stimulating cell expansion and differentiation
(Stoynova-Bakalova et al. 2004). Increases in petiole and leaf blade length show antagonistic
responses to light treatment (Tsukaya et al. 2002). Petiole tissue elongates in response to low
light conditions, exposing the leaf blade to sunlight, which results in blade expansion. This

12
behavioural response of plants is known as shade avoidance. Leaf blade surface area increases
are greatest in white light and least in darkness. A multitude of genetic factors interact to
orchestrate leaf primordia growth. Some aspects of leaf development that are under genetic
regulation include the balance in cell proliferation and cell expansion, and cell and tissue
patterning (such as dorso-ventrality).
1.4.2 Quantifying leaf shape
Leaf shape has been quantitatively defined using the leaf index. It is the ratio of the leaf blade
length to the blade width (Tsuge et al. 1996). In Arabidopsis, early formed rosette leaves have
rounded leaf blades (a ratio of 1). Later formed leaves are more elongate, thus leaf indices
increase with increasing rosette leaf position. The leaf index is under genetic and abiotic control
(Tsukaya et al. 2002). Leaf shape changes are due to alterations in the level and location of cell
division and cell expansion.
1.4.3 Cell proliferation versus cell expansion
All organ growth is dependent on the processes of cell proliferation and cell expansion. While
organ growth in cotyledons and hypocotyls is mainly attributed to cell expansion, the balance of
these two processes determines the final size and shape of the leaf organ (Tsukaya et al. 2002).
Several mutants have demonstrated that plants are able to remain unaltered in organ shape due
to compensatory mechanisms allowing for adjustments in the levels of cell proliferation and
expansion (Mizukami and Fischer, 2000; Kang and Dengler, 2002). An example of a gene that
alters both cell size and number is the Arabidopsis CYCLIN D2;1 gene (Qi et al. 2007).
Transgenic plants ectopically expressing CYCLIN D2;1 display increased cell number, however
individual cells have decreased area compared to wild type. This shows compensation by the
plant, so that the final organ shape is unaltered in the transgenics.
1.4.4 The effect of hormones on leaf development
Hormones affect leaf growth by either regulating cell proliferation or cell expansion. Cell
expansion deficiencies have been noted in brassinolide-deficient mutants (Bohmert et al. 1998).
Another such hormone is cytokinin, which functions to promote cell division by stimulating
cyclin D3 expression (Li et al. 2005). The hormone auxin plays an important role in the
regulation of both leaf margin serration (Hay et al. 2006; Nickovics et al. 2006; Kawamura et

13
al. 2010), and in leaf vein patterning (Sachs et al. 1989; Mattsson et al. 1999; Sieburth, 1999,
Benkova et al. 2003) and will be discussed in greater detail later.
1.4.5 The general process of leaf growth
Leaf development can be described as a two step process (Cnops et al. 2004). The first step
entails leaf primordia formation, whereby the indeterminate cells of the SAM undergo a
transition to a developmental fate of a leaf cell. This involves the upregulation of genes such as
ASYMMETRIC LEAVES1/2 (AS1/2), YABBY family members (YABBY, FILAMENTOUS
FLOWER, etc) and the downregulation of the KNOX (SHOOT MERISTEMLESS, KNOTTED-
LIKE IN ARABIDOPSIS THALIANA1/BREVIPEDICELLUS) family and other meristem
maintenance genes (WUSCHEL, CLAVATA1/2/3) within these cells (Lincoln et al. 1994; Long
et al. 1996; Bryne et al. 2000; Ori et al. 2000). The second step is leaf morphogenesis, which
entails the processes of patterning, cell proliferation, cell expansion and cell differentiation
(Donnelly et al. 1999; Kang and Dengler, 2002, 2004; Tsukaya et al. 2002). It is during the
latter stage when the emerging leaf defines dorso-ventral, medio-lateral and proximo-distal
polarities (Poethig, 1997).
1.4.6 Leaf developmental mutants
Mutations in genes regulating leaf morphology are of great value. They are useful tools in
deciphering the normal stages of leaf growth and provide landmarks as to critical processes
required for acquiring the ultimate leaf shape. A variety of leaf mutants exist. Some genes alter
leaf shape due to alterations in the pattern of cell division within the leaf. Other mutants alter
leaf shape by affecting the pattern of cell expansion. These different classes of mutants are
discussed in the following sections.
1.4.7.1 Mutations affecting cell division within the leaf
Cell division mutants alter cell number in a specific plane of the leaf blade, altering leaf blade
shape. Some mutants exhibit rounder leaves, compared to wild-type plants. This is due to a
decrease in cell number in the proximo-distal plane (or leaf length direction) of the leaf blade.
An example of this is the ROTUNDIFOLIA (ROT4) dominant mutant which develops short
rounded leaves (Narita et al. 2004). Polar reduction in organ length in ROT4 dominant mutant
plants is due to a decreased cell number in the leaf length direction. ROT4 encodes a novel
small peptide of unknown function.

14
Other leaf genes function to promote cell proliferation in the leaf width direction. Two
examples of such genes are the ANGUSTIFOLIA3 (AN3) and GROWTH-REGULATING
FACTOR5 (AtGRF5) genes (Horiguchi et al. 2005). AtGRF5 encodes a putative transcription
factor, and AN3 encodes a homolog of the human transcription coactivator SYNOVIAL
SARCOMA TRANSLOCATED (SYT). Mutant leaves are narrow, due to a polar reduction of leaf
cell number in the leaf-width direction. This polar reduction in cell number along different leaf
axes results in the change in shape of an3 and Atgrf5 leaves.
1.4.7.2 Mutants showing altered leaf size due to cell expansion changes
Leaf size and shape can also be altered by mutations in genes that govern cell expansion. These
genes alter leaf shape by regulating polar expansion along a specific plane of growth. Several
mutants that exhibit rounder leaves compared to wild type plants occur by an increase in cell
expansion in the medio-lateral plane (or leaf width direction) of the leaf blade. Two examples
of this are the ROTUNDA2/LEUNIG (RON2/LUG) and the ROTUNDIFOLIA (ROT3) genes.
RON2/LUG is a transcriptional corepressor that functions late in leaf development to restrict
cell expansion (Cnops et al. 2004). ron2 plants of Arabidopsis have wide serrated rosette
leaves.
The ROT3 gene is responsible for polar cell elongation in the leaf length direction (Tsuge et al.
1996). ROT3 is a member of the cytochrome p450 gene family encoding a steroid hydroxylase
involved in polar cell elongation (Kim et al. 1998). rot3 leaves exhibit selectively reduced
longitudinal cell expansion, decreased petiole length, decreased leaf blade length, and increased
leaf blade width. The short and wide leaf phenotype manifested by the mutant is due to rot3
leaves increasing faster in blade width growth than length early in development. rot3 leaves
appear rounder than wild type leaves regardless of rosette leaf number. This is due to a constant
leaf index at all leaf positions (Tsuge et al. 1996). Normally, successive wild-type rosette leaves
are longer and more elongate than earlier formed leaves due to a decrease in leaf index value
with increasing leaf number.
Other genes function to promote cell expansion in the leaf width direction. One example of
such a gene is the AN gene (Kim et al. 2002). The narrow leaf phenotype in an plants is due to
decreased cell expansion in the leaf width direction. This occurs by regulating the arrangement
of cortical microtubules in the palisade mesophyll cell layer (Tsuge et al. 1996).

15
1.4.8 Leaf margin type
Leaf shape can be sub-classified according to the extent of leaf margin serration. Simple leaves
posess smooth or slightly toothed margins (serrations), whereas compound leaves produce more
dissected margins forming leaflets. Arabidopsis produces simple leaves, whereas pea and
tomato produce compound leaves. Compound leaves require the expression of class I
KNOTTED-LIKE HOMEOBOX (KNOX) genes in leaf tissue. KNOX genes such as
BREVIPEDICELLUS (BP) and SHOOTMERISTEMLESS (STM) function in meristem
maintenance and maintence of undifferentiated cells (Lincoln et al, 1994; Long et al. 1996).
Simple leaf morphology requires the repression of class I KNOX genes by AS1, AS2,
SAWTOOTH1 (SAW1) and SAW2 (Bryne et al. 2000; Kumar et al. 2007) in leaf tissue. KNOX
gene misexpression or mutations such as as1-1, or as2-1 that derepress KNOX genes produce
lobed leaves (Chuck et al. 1996; Bryne et al. 2000).
The presence of leaf teeth (serrations) serves several functions in plants (Feild et al. 2005).
Earlier leaves in Arabidopsis do not form serrations until leaf five (Tsukaya and Uchimiya,
1997) and margin serratedness increases with later formed leaves (Clarke et al. 1999). In
Populus, the secreted resin exuded by leaf teeth prevents caterpillar herbivory. In Spinose, leaf
teeth prevent insect herbivory along the leaf margin. Lastly, leaf teeth serve as a means to
release water to prevent tissue death in regions that are not well vascularised.
Hydathodes are sites for water release (guttation) on leaves and often form upon serrations.
This is beneficial to the plant as serrated leaves have a better ability to shed water droplets from
hydathodes than hydathodes not associated with marginal teeth (Feild et al. 2005). This
decreases necrosis or tip burn, which occur when water is retained on the leaf surface. The
presence of marginal teeth facilitates water release from hydathodes and increases transpiration
which is vital to prevent plant overheating under conditions of low humidity and high sunlight
(Feild et al. 2005). Transpiration is also necessary to maintain adequate photosynthetic rates
within the plant, and to prevent flooding of intercellular spaces with water. Leaf photosynthetic
rates decrease when intercellular spaces are flooded with water (Feild et al. 2005).
1.4.9.1 The mechanism of serration formation
The formation of a serrated margin requires differential amounts of cell proliferation and
expansion at discrete locations about the leaf margin. A serration can be thought of as a

16
localized region of outgrowth from the leaf margin. Flanking these are cavities, or sinuses
where cell proliferation and expansion are diminished. This creates an irregular margin of
varying depths at different positions about the leaf blade periphery.
Serration formation and outgrowth has been studied in Arabidopsis (Kawamura et al. 2010).
Tooth development was analyzed by examining cell size, division frequency, and leaf margin
pattern in rosette leaf six. The earliest sign of tooth formation occurs at a leaf length of 400µm,
whereby two teeth have formed. The tooth area is comprised of the tip, the sinus, and the area
in between. There are no obvious cell proliferation differences in these regions at this stage, but
as the leaf and tooth enlarge, the marginal cells in the intervening space between the tip and
sinus elongate more. A greater number of marginal cells are present on the lower part of the 2nd
tooth (about five cells) versus the upper part (about 1.5 cells). At a leaf length of 400-600µm,
differences in cell elongation became apparent. Cell elongation occurs basipetally from the
adjacent tooth, starting at the tip and moving downwards towards the sinus (sinus cells are the
last to elongate at a later stage of development).
Genetic regulation of leaf margin development has been studied. Several gene families have
been shown to affect leaf lobing and tooth formation including the NAC gene family, the KNOX
gene family, and the BLH gene family (Lincoln et al. 1994; Bryne et al. 2000; Nikovics et al.
2006; Hay et al. 2006; Kumar et al. 2007; Kawamura et al. 2010). In addition, these gene
families regulate each other`s expression.
The Petunia NAM and Arabidopsis ATAF1, ATAF2, and CUC2 (NAC) family of transcription
factors has been implicated in leaf margin serration, lobing and leaflet production (Blein et al.
2008). They are thought to regulate boundary formation and organ separation by local
repression of cell proliferation, as NAC family genes have an identical expression pattern to cell
division markers, such as histone H4 (Blein et al. 2008). Plants that form compound leaves
show a specific pattern of NAC gene expression in a narrow strip of cells at the boundary of a
leaflet prior to leaflet outgrowth. This suggests a role for NAC genes in leaflet production in
plants producing compound leaves.
Members of the NAC family include the CUP SHAPED COTYLEDON genes (CUC1-3) in
Arabidopsis (Aida et al. 1997, 1999). CUC2 transcript levels are elevated in serrated leaf
margins, further substantiating the claim that CUC2 is responsible for leaf margin serration.

17
cuc2 plants and transgenic lines over-expressing the CUC2 expression regulator MICRORNA
164a (MIR164a) (Laufs et al. 2004) both display decreased leaf margin serration (Nikovics et
al. 2006). Thus CUC2 may promote tooth formation either by activation of growth at the tooth
apex or by growth repression at the sinus. Recent evidence has demonstrated that CUC2
promotes tooth formation by enhancing tooth outgrowth. This was shown by overlaying similar
sized/aged wild type and cuc2-3 leaves, and measuring distances from the tip and sinus to the
mid vein (Kawamura et al. 2010).
The formation of a serrated margin is a two step process (Nikovics et al. 2006). The first step
involves determination of the location of serration formation. This step is independent of CUC2
and mIR164a action. The second step involves the determination of the extent of tooth/sinus
formation, and this is dependent on relative levels of CUC2 and mIR164a; smooth margins
form as a result of low CUC2 levels. More pronounced (deep) serrations predominate when
there are low levels of miR164 or the presence of a miR164 insensitive CUC2 gene. Normal
leaf margin serration is conditioned by an equal balance of CUC2 and mIR164a levels
(Nikovics et al. 2006).
KNOX family genes (such as BP) regulate compound leaf development (Lincoln et al. 1994).
Leaf serrations and lobing have been observed in KNOX gene mis-expressing or in as1 plants
(Lincoln et al. 1994; Bryne et al. 2000). This is due to ectopic BP gene expression in leaves
(Lincoln et al. 1994; Chuck et al. 1996; Bryne et al. 2000). A feed-forward regulatory loop
exists between KNOX and NAC family genes (Kawamura et al. 2010). KNOX family genes
regulate NAC gene expression, which in turn regulates leaflet formation (Nikovics et al. 2006;
Blein et al. 2008). NAC genes also influence the expression of KNOX genes during compound
leaf development. However, BP transcript levels were not found to be elevated in transgenic
plants expressing the MIR164a resistant CUC2 transgene. This suggests that enhanced serration
in these leaves is not due to ectopic BP expression, and that CUC2 mediated BP gene
repression is not dependent on mIR164a activity (Nikovics et al. 2006).
The BELL-LIKE HOMEODOMAIN (BLH) family members BLH2/SAWTOOTH1 (SAW1) and
BLH4/SAW2 are also important in leaf margin development (Kumar et al. 2007). SAW1 and
SAW2 show preferential expression on adaxial leaf surfaces, with strong expression in the leaf
vasculature and hydathodes. saw1 saw2 leaves exhibit greater serration depth and number than

18
wild type. These serrations occur on earlier formed leaves compared to wild type. Ectopic BP
expression is found in hydathodes and serration tips of saw1 saw 2 plant leaves. This suggests
that SAW1 and SAW2 may function to regulate leaf margin serration by repressing BP
expression in leaves.
1.4.9.2 The effect of auxin on leaf margin serration
Ectopic expression of KNOX genes in leaves has not only been associated with altered leaf
morphology but also with changes in auxin inducible gene expression (Tsiantis et al. 1999;
Scanlon et al. 2002; Zgurski et al. 2005). This was demonstrated by the change in expression of
BP in the auxin perception mutant axr1 and in the AS1 mutant (Hay et al. 2006). BP expression
was not detected in wild type leaves, however, it is found in the tips of serrations in axr1-3
leaves, in the midrib, petiole and tips of serrations in as1-1 leaves, and in the margin cells of
sinuses of all lobes in axr1 as1 leaves. This suggests that BP expression is excluded from leaves
by the independent action of AXR1 and AS1. This finding also suggests that BP gene expression
affects the pathway in which auxin gradients pattern leaf shape, but the manner of this
interaction has not been defined.
The interaction of auxin and AS1 on leaf shape was examined by generating a double mutant in
the auxin perception mutant axr1-12 and as1. The double mutant shows an enhancement of the
single mutant phenotypes, in addition to a novel phenotype of ectopic stipules formed in
positions of sinuses of lobes. Thus, AS1 and auxin may act in overlapping pathways to direct
leaf development (Hay et al. 2006).
While AS1 negatively regulates BP (Bryne et al. 2000), there are other pathways regulating BP
expression independent of AS1 levels. Normal polar auxin transport is necessary for appropriate
expression of KNOX genes. Plants treated with the polar auxin transport inhibitor TIBA
exhibited ectopic BP expression in leaves. Therefore exclusion of KNOX gene expression (such
as BP) from the leaf prevents alterations to leaf shape, such as lobing. This mode of KNOX
gene regulation is dependent on correct auxin transport. Mutants in the polar auxin transport
protein PIN1 showed elevated levels of BP transcript compared to wild-type plants, however
AS1 levels remain unchanged (Hay et al. 2006). Thus PIN1 and AS1 function independently to
repress BP expression.

19
A recent study has demonstrated that the hormone auxin marks sites for tooth initiation
(Kawamura et al. 2010). Wild-type leaves showed isolated expression of the auxin reporter
DR5::GUS in 1-2 marginal cells prior to tooth formation. This was followed by expansion of
DR5::GUS expression into the neighbouring epidermal and mesophyll cells of the tooth tip.
This expression pattern was altered in cuc2 leaves, where DR5::GUS expression is expressed in
a broad domain around the leaf margin. Previous studies have demonstrated that auxin maxima
and location are dependent on normal CUC2 activity (Vernoux et al. 2000; Aida et al. 2002;
Furutani et al. 2004). Therefore it appears that CUC2 is required to maintain the discrete
expression domain of auxin which will determine sites of tooth initiation.
In addition to its role in leaf margin development, auxin has been shown to be important for
vascular patterning (Mattsson et al. 1999; Sieburth, 1999). Therefore, both vascular patterning
and tooth formation was examined simultaneously in wild-type leaves. Tooth formation was
found to precede procambium tissue formation (Kawamura et al. 2010). While both auxin
maxima and leaf margin serratedness were decreased in cuc2-3 leaves, vascular patterning was
not disrupted. This may be due to the maintenance of the auxin maxima at the distal leaf tip in
the mutant, which may be sufficient for vein patterning. Thus, serration formation occurs
independently of vascular patterning and correct auxin accumulation is necessary for leaf
margin serration formation.
1.5 Vein patterning
The procambium is the precursor of vascular tissue. Vascular tissue can be distinguished from
surrounding tissue due to its plane of cell division (parallel to the plane of growth compared to
anticlinal in protoderm and ground meristem tissue) (Nelson and Dengler, 1997; Kang and
Dengler, 2002), and due to its increased staining ability caused by increased cell vacuolation
compared to ground tissue (Kang and Dengler, 2002). Vascular tissue pattern formation is
genetically regulated spatio-temporally to give rise to the mature vein pattern. This pattern
varies with plant tissue type and plant species.
The leaf vein pattern of dicots such as Arabidopsis thaliana is relatively simple, consisting of a
single primary vein, from which secondary veins emanate laterally to form a closed, reticulate
pattern (Nelson and Dengler, 1997). Vein order increases with decreasing vein diameter
(Nelson and Dengler, 1997). The primary vein has the largest vein diameter, although it is not a

20
constant width throughout the leaf blade; it is thickest at the base of the leaf in the petiole, and
becomes narrower apically at junctions where secondary veins branch off from it (Candela et al.
1999). Secondary veins have the next largest vein diameter. Vein orders are initiated
sequentially, such that the primary vein forms before secondary veins. Higher order veins
emanate from lower order veins. These higher order veins intercalate within the confines of the
lower order veins to produce a regularly spaced nextwork of vasculature. True leaves produce
about 5-6 orders of veins, with the highest vein order terminating freely within the leaf blade.
This type of vein is called a freely ending vein, or a veinlet. The area enclosed by a vein loop is
referred to as an areole.
The arrangement of vasculature varies for different plant organs (Nelson and Dengler, 1997).
Within the root, the vasculature is organized in a central cylinder. Stem vasculature displays
radial symmetry whereby vascular bundles of collateral arrangement (xylem tissue on the
outside, and phloem tissue on the inside of each bundle) are arranged in a ring about the stem
periphery. In the relatively flat leaf, a two-dimensional arrangement of vasculature exists,
whereby xylem tissue is arranged on the adaxial side and phloem is arranged on abaxial side of
the leaf.
Heteroblasty is seen in vascular patterns between leaf orders (Nelson and Dengler, 1997).
Cotyledons exhibit a reduced vein pattern compared to true leaves, however the mechanism for
formation is the same. Rosette leaves exhibit a greater amount of vasculature, with more loops,
and more higher order veins. Vasculature is reduced in floral organs, such as sepals and petals,
which can be thought of as modified leaves (Kim et al. 2001). Although the arrangement of
vasculature differs amongst plant organs, it is a continuous system that facilitates transport of
water, mineral and photoassimilates from one end of the plant to the other.
A notable feature of the vascular pattern of all plants is the regularity of spacing between veins
in mature leaves (Kang and Dengler, 2002). This is a feature conserved among veins of all
orders, suggesting that a complex regulatory pathway exists to ensure new vascular strands are
intercalated amongst pre-existing veins at defined distances subsequent to organ growth. This
also suggests that vein formation is a gradual process that occurs simultaneously with blade
morphogenesis.

21
1.5.1 Quantifying vein pattern complexity
Two parameters are used to measure vein complexity: vein density and vein branching point
density (Candela et al. 1999). Vein density is defined as the mean vein length per unit area.
Similarly, vein branch point density is defined as the mean number of vein branch points per
unit area. These factors have been found to decrease with leaf blade expansion. High vein
density and vein branch point density values are indicative of a more complex vein pattern than
leaves with low values. Adult leaves show greater vein density and branching point values than
juvenile leaves, confirming that adult leaves show a more complex vein pattern than juvenile
leaves. Venation density increases with leaf plastochron number, and is lower in shade grown
versus full sun grown leaves, suggesting that sunlight stimulates vascular production (Esau,
1977). Leaf venation density also increases with water availability, increased wind speed,
nutrient deficiency, and increased humidity (Roth-Nebelsick et al. 2001).
1.5.2 Observations of vein development
There are similarities in the pattern in which veins form in cotyledons and rosette leaves
(Nelson and Dengler, 1997). Both initiate the primary vein first in an acropetal manner from the
leaf base to the leaf tip. The primary vein is continuous with stem vasculature. Leaf lamina
growth and primary vein growth are occurring simultaneously. During this time, secondary
veins form basipetally, beginning with the formation of distal secondary vein loops. Distal
secondary vein provasculature emanates from the primary vein at the leaf tip, extends around
the leaf margin, and connects with the midrib in the centre of the leaf blade. This is followed by
the formation of proximal secondary vein loops. Tertiary, quaternary and higher order veins are
initiated sequentially and occur during intercalary growth of the leaf. Initiation of tertiary and
quaternary veins also proceeds basipetally along the leaf blade from the leaf tip to the petiole
(Nelson and Dengler, 1997).
Several differences exist between the vein patterns of cotyledons and rosette leaves. The
processes of cotyledon vascular tissue formation and differention are separated temporally.
Procambial tissue is formed during embryogenesis, whereas differentiation occurs after
germination (Dharmawardhana et al. 1992). This differs from the timing of vascular tissue
development and maturation in true leaves. In true leaves, both vein initiation and
differentiation are occurring within the same phase of development, but are separated spatially
within the leaf blade. Xylem differentiation occurs according to vein order; the primary vein

22
differentiates first, followed by apical secondary vein loops, followed by basal secondary vein
loops, and subsequently tertiary and higher order veins differentiate. Primary vein
differentiation occurs acropetally from the leaf base to the leaf tip. Secondary vein
differentiation occurs basipetally, and later formed veins differentiate in either direction (Kang
and Dengler, 2002).
Another difference between cotyledon and true leaf vasculature is the amount of vasculature
formed. Cotyledons exhibit a reduced vascular pattern compared to true leaves (Candela et al.
1999). All cotyledons form a midrib and 2-4 closed loops, with 1-2 per apical and basal half of
the leaf blade. Rosette leaves form five orders of veins in addition to freely ending veinlets.
1.5.3 The timing of cotyledon and rosette leaf vein formation
Vascular differentiation has been characterized in cotyledons (Candela et al. 1999; Sieburth,
1999; Steynen and Schultz, 2003). The midvein provasculature has formed by one day post
germination (dpg). Differentiation of the midrib is complete by two dpg. Distal secondary veins
are initiated by one dpg and have formed connections to the midvein at the end of one dpg.
These veins have completed differentiation by three dpg. Proximal secondary provasculature is
initiated at one dpg. Differentiation of both proximal secondary loops is complete by three dpg.
The time frame for true leaf vein patterning has also been characterized (Sieburth, 1999;
Candela et al. 1999; Steynen and Schultz, 2003). The primary vein provasculature begins to
appear at four days post imbibing (dpi) in the leaf (Steynen and Schultz, 2003). It is continuous
with the stem vasculature, and extends acropetally into the leaf blade. At five dpi this
provascular tissue becomes organized into a vein containing tracheary elements organized into
a single file, and is completed at 5-6 days post germination (dpg). Two secondary provascular
strands begin to form in the distal leaf at the tip at five dpg, forming closed loops that connect
to the midrib by six dpi, and they are joined to the midvein proximally at 6-7 days post
germination. Two proximal provascular tissue strands are initiated and form towards the base of
leaf in a basipetal manner by seven dpi. Tertiary veins begin to form from eight dpi and
quaternary veins from nine dpi. By 11 dpi, most of the leaf vasculature has been established
(Sieburth, 1999; Steynen and Schultz, 2003).

23
1.5.4 Genes specifying vascular fate and the use of markers to track vascular patterning
Molecular markers of vascular cell identity have been characterized and are commonly used
tools in studies of vascular development and patterning. One marker for provascular cell
identity is the Arabidopsis thaliana HOMEOBOX8 (AtHB8) gene (Baima et al. 1995). AtHB8
belongs to the HD-ZIPIII homeobox gene family and is one of the earliest markers of
procambial cell identity. Expression of AtHB8 during the preprocambial stage of vein
development marks a narrow strand of cells that are not yet anatomically different from
neighbouring cells. Later, AtHB8 expression is observed in the primary vein (Kang and
Dengler, 2004).
Other cell-type markers have also been utilized in the study of leaf development. One such
example is the Arabidopsis AtCyclin1A (AtCYC1A) gene, which is a marker of cell proliferation
(Ferreira et al. 1994). Examination of cell cycling using CYC1A along with AthB8 expression
illustrates patterns of cell proliferation in vein development. Cell division activity forms a
longitudinal gradient with the greatest amount of cell division initially in the leaf apex, and
lower amounts in the basal region of the leaf (Kang and Dengler, 2002). Cell cycling frequency
decreases in a basipetal manner over time. Cell proliferation is evident in all tissue types, but
highest in the procambium over leaf development. The extent of time for which cell cycling
exists is inversely proportional to the vein order; cell cycling ceases first in tertiary veins, then
in secondary veins, and finally in the primary vein. This results in vein orders having
differential thickness.
The combined use of these two molecular markers illustrates the role of cell proliferation in
vascular pattern formation during leaf morphogenesis (Kang and Dengler, 2002). The pattern of
AtHB8 expression mirrors that of CYC1A, suggesting that the pattern of cell division activity
within the leaf blade dictates the pattern, timing and size of veins produced in the leaf (Kang
and Dengler, 2002).
Leaf venation pattern formation occurs in a gradient mirroring that of cell division. Both
proceed basipetally, with both terminating first in the apical regions of the leaf, and continuing
in the basal regions of the leaf. Lignification of veins also proceeds basipetally (Candela et al.
1999).

24
1.5.5 Vein patterning theories
Although the type of vein pattern that forms in plant leaves has been characterized in a spatio-
temporal manner, the identity of the signalling molecules responsible for generating this pattern
and the mechanism for generating it remains unclear. The pattern formed by veins is thought to
be created by the presence of a chemical substance acting as a morphogen which is the signal to
induce vascular formation in a given region. Two main theories have been proposed to explain
how this signal molecule functions to generate a controlled spacing pattern for vasculature.
They are the canalization of signal flow and the diffusion-reaction pre-pattern.
1) Canalization of signal flow
This theory arose from experiments whereby mechanical damage was applied to tissue, and the
pattern of vascular regeneration was observed. Vascular differentiation occurs within this
tissue at the site of damage. Vascular regeneration is polar and progressive, such that a
continuous strand of vasculature is formed and emanates away from the site of damage. A local
signal is thought to be inducing the site and pattern of vein formation.
Auxin is thought to be a key molecule in directing the pattern of vein formation. Application of
auxin can induce new vascular strand formation from differentiated parenchyma cells (Jacob,
1952). This newly formed vascular strand has polarity and directionality, such that the new
vascular strand forms linearly, and away from the source of auxin (Sachs, 1991). Auxin
transport is known to be polar and auxin induces the progressive differentiation of vascular
strands in wounded tissues, indicating that this plant growth hormone may act as the signal for
vascular pattern formation (Sachs, 1981, 1989, 1991a, 1991b). Therefore, it is possible that
auxin acts as a morphogenic signal to direct spatial and temporal vascular patterning within the
leaf (Mattsson et al. 1999). From these observations the canalization of signal flow hypothesis
was formulated (Figure 3).
The premise of this theory is as follows. Initially, all cells possess equal capabilities in
transporting auxin. Cells in the wounded tissue begin to transport auxin more efficiently than
neighbouring cells. Auxin begins to drain out of the neighbouring cells and into the damaged
cells which begin to serve as a conduit for auxin transport. Auxin acts as a morphogen and
increased auxin flux triggers vascular differentiation within these cells. Thus increased auxin
accumulation delimits the location of vascular strand formation. Since all the auxin is drained

25
from neighbouring cells into those that have an enhanced ability to transport it, neighbouring
cells cannot differentiate into vasculature as they have lost the signal for differentiation. The
direction of auxin flow is polar, and results in vascular strand formation originating from the
source of auxin (Sachs, 1981, 1989, 1991a, 1991b; Nelson and Dengler, 1997).
Figure 3: The canalization of signal flow hypothesis (Courtesy of Nelson and Dengler, 1997). The first
panel illustrates a severed vein denoted by a V. Initially all neighbouring cells possess equal
competency to transport the signalling molecule (auxin) shown by a black dot. The middle panel shows
that the cells that are adjacent to the severed end of the vein begin to accumulate and transport auxin
with greater frequency than neighbouring cells (denoted by a higher number of black dots within these
cells). This leads to vascular differentiation of cells at the site of the severed vein (shown by the
extension of the vein segment).
Support for this theory comes from expression profiles of provascular markers such as AtHB8,
expression patterns of the polar auxin transport protein PIN1, and auxin accumulation patterns
using the reporter DR5::GUS. PIN1 expression in embryogenesis is restricted to provascular
cells even before these cells are morphologically distinct from surrounding cells (Reinhardt et
al. 2003). PIN1 later shows polar subcellular localization to aid in auxin transport (Galweiler et
al. 1999; Geldner et al. 2001). Vascular mutants show perturbations in both auxin accumulation
patterns and in AthB8 expression (tornado: Cnops et al. 2006; hemivenata/cand1: Alonso-Peral
et al. 2006; forked1: Steynen and Schultz, 2003), strongly suggesting that auxin is the
morphogenic signal that dictates when and where veins form.
2) Diffusion-reaction pre-pattern
The second theory proposed to explain how the vein architecture pattern and spacing is
generated is called the diffusion-reaction pre-pattern (Figure 4). Random increases in fast
diffusing molecules, establishes local maximas of activator molecules. Enhancement of these
maximas occurs through positive feedback. These pockets of high concentration of a molecule
prevent similar accumulation in neighbouring regions by interaction of activator molecules and

26
inhibitor molecules, thus preserving spacing patterns between regions of molecule action (Koch
and Meinhardt, 1994; Meinhardt, 1996). The activator molecules regulate inhibitor molecules
which can function over long distances, and prevent similar accumulations of activator
molecules.
Figure 4: The diffusion-reaction pre-pattern hypothesis (courtesy of Nelson and Dengler, 1997). This set
of figures illustrates the generation of a spacing pattern of molecules such that the maxima of these
molecules lies maximally away from other maxima.
Scientists have exploited conditions and mutants in which leaf vein pattern is altered in order to
understand the mechanisms of pattern formation and the identity of chemical and biological
molecules involved in regulating this process. The role of the hormone auxin in defining the
leaf vascular pattern is strongly supported by experimental work demonstrating changes in this
pattern upon perturbations in auxin transport.
1.5.6 Changes in vascular patterning by manipulating auxin flux
Based on the canalization of signal flow hypothesis, auxin is predicted to play an important role
in vascular patterning. The role of auxin transport and auxin accumulation in vascular
patterning can be addressed by examining the changes in vascular patterning upon disruption of
auxin flux by using polar auxin transport inhibitors, such as NPA. Changes in auxin
accumulation patterns have been documented in NPA treated leaves (Mattsson et al. 1999,
2003; Sieburth, 1999), and the observations confirm that the changes in auxin accumulation
reflect a change in the level and location of vascular patterning.
Wild-type leaves have one continuous file of tracheary elements comprising the midvein.The
midvein shows increased vascularization upon auxin transport inhibition (Mattsson et al. 1999).
NPA application causes the formation of multiple parallel strands of vasculature in the midrib
area, most of which are not continuous with hypocotyl vasculature.

27
NPA treatment also affects higher order vein patterning (Mattsson et al. 1999). Broader veins
are formed in a thick band at the leaf margin due to increased xylem and phloem. Many of the
tracheary elements comprising these vascular strands are improperly aligned. An increased
number of secondary veins are formed, originating from the midrib and extending to the thick
vascular band at the leaf margin. While vascular differentiation is increased in the leaf margin
area, vascular differentiation is decreased in the leaf base area. This suggests that apically
produced auxin is effectively trapped near the leaf tip, thus restricting vascular patterning to this
region. This results in a change in the direction of vascular pattern formation from acropetal to
basipetal.
Staged application of NPA revealed that midvein patterning occurs very early in development
(Mattsson et al. 1999). NPA treatment at germination or one day post germination results in
broadening of the midvein, and formation of multiple strands. However this does not occur if
NPA treatment occurs at a later time point. Secondary veins display broadened margin
vascularization if NPA treatment is initiated at four days post germination. NPA treatment
initiated at six days post germination increases tertiary and quaternary vein number. These
results reinforce previous findings that formation of higher order veins occurs after that of
primary vein formation and is progressive.
1.5.7 Mutants affecting vascular patterning
Numerous vascular patterning mutants have been characterized. The defects range from
incomplete loop formation, vascular island production, twisted bifurcated midveins, as well as
under and over proliferation of vasculature. Many of these mutants show alterations in auxin
gradients, or changes in auxin perception and AthB8 expression, suggesting that these genes
function in a pathway whereby auxin accumulation patterns are instrumental in early patterning
events. Maintenance of normal auxin gradients allows vascular markers to be expressed and
lead to cell differentiation.
1.5.7.1 Mutants forming discontinuous vascular networks/ vascular islands
Vascular discontinuities are a result of incomplete vein loop formation or the formation of
vascular islands (discontinuous stretches of vein tissue that do not connect with any other
veins). Many genes have been found to be part of the pathway(s) regulating vein junction
formation. Plants that are mutated in the VASCULAR NETWORK DEFECTIVE3 (VAN3) gene

28
do not form closed loops in cotyledons (Koizumi et al. 2005). It seems that auxin is necessary
for closed loop formation as auxin levels are reduced in the mutant. Furthermore, VAN3
expression can be stimulated by the addition of auxin.
Open loops are also observed in TORNADO1 and TORNADO2 (TRN1 and TRN2) mutant
leaves, where apical secondary vein loops are incomplete at the distal end of the leaf. trn1 and
trn2 leaves also produce vascular islands and show decreased vascular complexity (Cnops et al.
2006). These mutants lack higher order (tertiary and quaternary veins) veins, and decreased
vein branch point number (Cnops et al. 2006). The decreased vascular complexity in trn1 and
trn2 cotyledons may be due to decreased auxin accumulation. TRN1 and TRN2 mutant
cotyledons display no auxin accumulation in the secondary and emerging tertiary veins
compared to the wild type at six days post germination (Cnops et al. 2006). Comparisons of
AtHB8 expression in wild-type and trn leaves revealed that this gene may be responsible for the
formation secondary vein loops, and the formation of tertiary and quaternary veins, as the vein
pattern for wild-type and mutant leaves diverged at six days post germination (Cnops et al.
2006). This suggests that TRN is important in later vascular patterning events.
Disconnected veins are also found in the COTYLEDON VASCULAR PATTERN1/2 (CVP1/2)
mutants. Lack of vein connectivity is due to abnormally oriented cell divisions within
provascular cells of lateral veins. This causes defects in cell elongation and misalignment of
cells within a vascular file (Carland et al. 1999). CVP2 encodes an inositol polyphosphate 5‟
phosphatase that dephosphorylates IP3, suppressing downstream IP3 mediated signalling
(Carland and Nelson, 2004). cvp2 plants have increased levels of IP3, which decreases ground
cell recruitment to vascular fate. This results in an increased number of lateral veins, and a
decrease in vein connections. Secondary veins do not connect to the primary vein in the distal
part of the leaf blade, creating open loops. Tertiary veins terminate prematurely, and quaternary
veins form vascular islands instead of veinlets (freely ending veins).
Examination of AtHB8 expression in wild type and cvp2 embryos revealed that wild-type
AtHB8 expression pattern diverged from that of the mutant during embryogenesis. Reduced
AtHB8 expression was observed in the mutant along with a decrease in loop number during the
walking-stick stage of embryogenesis onwards. As noted previously, vein patterning
(procambium tissue formation) occurs during embryogenesis, and differentiation into xylem

29
and phloem occurs 36 hours after germination (Dharmawardhana et al. 1992). This suggests
that CVP2 is involved in procambial cell patterning, and loss of this gene results in defects in
vein patterning (Carland et al. 1999). Auxin accumulation was detected in discontinuous spurs
of preprocambial cells in the CVP2 mutant. This suggests that CVP2 action occurs before the
acquisition of preprocambial identity to allow for appropriate auxin gradients to form and
pattern cells to acquire procambial cell identity and later differentiate into mature veins
(Carland and Nelson, 2004).
Lastly, plants that are mutated in the FORKED1 and FORKED2 (FKD1/2) genes also exhibit
vein connection abnormalities (Steynen and Schultz, 2003). Mutant cotyledon and rosette
leaves display an increased number of freely ending veins, a decreased number of areoles
(closed loops), and a decreased number of branch points. This is due to a loss of distal
connections between secondary veins and the midvein. Also, fkd leaves display an increased
number of vascular islands in the mature leaf. This is a result of increased free initiation of
secondary veins in developing leaves. Auxin accumulation at the distal leaf tip is lower in fkd1
leaves. NPA treatment of fkd1 leaves improved distal vein meetings at margins by decreasing
the number of distally open loops. Thus, it appears that a minimum threshold of auxin is
required to form distal vein connections, resulting in closed loops. The FKD1/2 genes appear to
mediate this (Steynen and Schultz, 2003).
1.5.7.2 Mutants displaying an under-proliferation of vasculature
Many mutants have been documented to exhibit decreased vasculature production. One such
example is the SFC mutant (Sieburth et al. 2006). sfc plants display decreased cotyledon areole
number, and decreased vein branch point number. sfc plants also show reduced auxin transport.
SFC encodes an ADP ribosylation factor that functions in opposing the GNOM-mediated
cycling of PIN1 from endosomal compartments to the basal cell membrane (Sieburth et al.
2006). In these mutants, auxin transport and PIN1 localization were perturbed, however BFA
treatment restored PIN1 localization, confirming that SFC functions in PIN1 protein cycling
(Sieburth et al. 2006).
The temperature sensitive mutant varicose (vcs) displays reduced cotyledon and rosette leaf one
vasculature at elevated growth temperatures (Deyholos et al. 2003). Growth at elevated
temperatures results in decreased areole numbers produced in the mutant compared to growth at

30
normal temperatures. The severity of the vascular defects in vcs leaves is directly dependent on
the amount of time the plant was exposed initially to higher temperatures.
HVE/CAND1 mutants also display reduced vein complexity and a simpler cotyledon and rosette
leaf vein pattern than wild type (Alonso-Peral et al. 2006). hve cotyledons form only two
areoles compared to four in wild type. hve rosette leaves produce less secondary veins, and no
tertiary and quaternary veins. This results in lower vein density in mutant leaves. In contrast,
the vascular pattern of mutant cauline leaves was unperturbed, however both sepal and petal
vascular patterns are less complex than in wild type. Expression of HVE and AtHB8 were
tracked in parallel over leaf development. Both genes are expressed in similar domains,
however HVE expression occurs earlier, marking cells that will acquire procambial tissue
identity, followed by AtHB8 expression. The AtHB8 marker is normally expressed in both
mature and differentiating vascular strands, such that it demarcates the complex reticulate vein
pattern of leaves. However in hve rosette leaves, AtHB8 expression is reduced, marking the
simpler vein pattern, and only being expressed in fully differentiated veins. This suggests that
AtHB8 requires functional HVE to mark cells destined to vascular fate (Alonso-Peral et al.
2006). hve leaves show auxin accumulation was absent from locations that normally mark sites
of tertiary vein differentiation in wild type. Not only does HVE mark the sites at which ground
tissue is recruited to vascular fate, but its expression is necessary to maintain auxin gradients
such that differentiation of higher order veins can occur. HVE/CAND1 is a member of the
Arabidopsis SCF complex of ubiquitin E3 ligases (Alonso-Peral et al. 2006). This is important
as the SCF complex is an important regulator of auxin signal transduction. Loss of SCF
complex functioning results in a dampening of auxin induced signalling.
1.5.7.3 Mutants producing an over-proliferation of vasculature
A few mutants have been documented to exhibit increased vasculature production. One such
example is that of the THICKIVEIN/ ACAULIS5 (tkv/acl5) gene (Clay and Nelson, 2005). tkv
leaves are smaller than wild type, with increased vasculature and vein density. The reduction in
tkv adult leaf size (rosette leaves five +) is due to decreased cell expansion. This mutant is
intriguing because normally mutants that have decreased vasculature are coupled with
decreased organ size such as: lopped1 (lop1) (Carland and McHale, 1996), cvp1 (Carland et al.
1999), and hve (Alonso-Peral et al. 2006). In the case of tkv plants however, an increased vein
density is observed in adult leaves that are smaller than wild type. This shows a decoupling of

31
the processes of organ growth and vein production in this mutant. Parallel expression of AtHB8
and of TKV using reporter gene expression and in situ hybridization experiments revealed that
TKV shows procambial cell (precursors of vascular tissue) specific expression. This suggests
that this gene may be important in early vascular patterning events (Clay and Nelson, 2005).
The vein pattern of tkv leaves resembles that of plants treated with polar auxin transport
inhibitors which is consistent with the mutant phenotype of reduced auxin transport (Clay and
Nelson, 2005).
Plants have evolved a highly branched network of vasculature to service the plant‟s needs for
water, minerals and carbohydrates. This system is continuous along the entire length of the
plant and is capable of solute/water distribution in an efficient manner. The process of vein
formation has been carefully documented, and similarities in the pattern and manner of
formation are evident between cotyledon and rosette leaves. The process of vein pattern
formation is dependent on carefully regulated levels and location of auxin accumulation, cell
proliferation and differentiation programs, all of which are under complex genetic regulation.
1.6 Stomata
Stomata are pores located on the surfaces of leaves. They are flanked by two guard cells
surrounding the pore through which gas exchange of water, O2 and CO2 occurs. The rate at
which transpiration (water vapour release) and CO2 uptake occur are controlled by biotic and
abiotic factors, such as temperature, light intensity, and CO2 levels.
Stomata are generated through a cell-lineage mechanism from asymmetric cell divisions of
stomatal precursors in the following order: the meristemoid mother cell (MMC), the
meristemoid, and the guard mother cell (GMC) (Nadeau and Sack, 2008). The MMC undergoes
an asymmetric cell division in order to generate the meristemoid. The meristemoid either
converts directly into the GMC, or undergoes 1-3 more rounds of asymmetric cell division
before conversion to the GMC (Nadeau and Sack, 2008). Finally the GMC undergoes a
symmetric cell division in order to generate the two guard cells that comprise the mature
stomata.
Stomata differentiate in a basipetal (tip to base) manner (Larkin et al. 1996; Pant and Kidwai,
1967), such that they form first at the leaf tip, and subsequently form progressively towards the
base of the leaf. At least one nonstomatal epidermal cell separates two neighbouring stomata.

32
This minimum spacing pattern is thought to be important for efficient gas exchange (Nadeau
and Sack, 2008).
The position at which stomata form is genetically regulated (Nadeau and Sack, 2008).
Mutations in genes such as TOO MANY MOUTHS (TMM) and FOUR LIPS (FLP) (Yang and
Sack, 1995) are just two genes that are necessary for regulating stomatal spacing. When these
genes are mutated, the minimum one cell spacing pattern is disrupted, and stomata form
adjacent to one another. Cotyledons and leaves of tmm plants form clusters of stomata of
varying sizes at different stages of development (Yang and Sack, 1995). This is due to
meristemoids forming in contact with the stomata (Yang and Sack, 1995). tmm plants also show
an alteration in the orientation of the plane of cell division, such that meristemoids fail to divide
away from each other. The hypothesis that stomatal cell spacing pattern is generated through
lateral inhibition of MMC‟s has been disproven, as the formation of one MMC does not prevent
formation of an MMC adjacent to the pre-existing one (Nadeau and Sack, 2008).
Stomata are important for CO2 uptake and water release. Plants strive for the optimization of
gas exchange, whereby CO2 uptake is maximized and water loss is minimized. This can be
done by controlling stomatal number. Thus their presence on leaves has been quantified using
the parameters of stomatal density (SD), number of stomata per area of leaf blade and the
stomatal index (SI, defined as the ratio of stomatal density to the sum of the stomatal and
epidermal cell densities) (Ceulemans et al. 1995; Royer, 2000). It is beneficial to examine SI
values as a function of a treatment condition or genetic background, as SD depends on cell
size/expansion, whereas SI normalizes for this effect (Royer, 2000).
Two abiotic factors affecting SD and SI are light and carbon dioxide (CO2) levels (Schoch et al.
1980). SI is directly proportional to light intensity; increasing light intensity increases SI. This
effect is so sensitive that successive leaves on a plant can have different SI values, as one leaf
may shade another.
SD decreases with increasing CO2 levels (Ceulemans et al. 1995; Royer, 2000; Lake et al.
2001). The effect of increased CO2 levels occurs via feedback signalling from mature to young
leaves. Mature leaves serve as CO2 sensors and influence stomatal level in young leaves.
Decreased SD is found in young leaves when mature leaves are exposed to higher levels of CO2
than younger leaves. Younger leaves have increased SD if mature leaves are exposed to lower

33
levels of CO2 than younger leaves. The consequence of alteration of stomata number is altered
levels of photosynthesis and water use.
The stomatal index is dependent on the extent of cell division of meristemoid mother cells,
symmetric pavement epidermal cell divisions, and the amount of asymmetric meristemoid cell
divisions (Nadeau and Sack, 2008), as this will affect the numbers of both stomata and
pavement epidermal cells formed.
1.7 Trichomes
Trichomes are unicellular structures that are formed on the surface of epidermal cells of leaves
and stems in plants (Larkin et al. 1996). Trichomes have multiple functions. One primary
function is to decrease the rate of transpiration. This occurs by aiding in reflecting solar
radiation and increasing the boundary layer on the leaf surface (Esau, 1977). Some plant species
utilize trichomes to absorb water and minerals. Other plants utilize trichomes to remove salts
from the leaf to prevent toxicity. Trichomes also function in protecting the leaf from damage by
ultraviolet radiation and insect herbivory by serving as both physical barriers and generators of
chemical defense responses (Esau, 1977).
1.7.1 Trichome initiation
Trichome initiation occurs during protoderm development (the precursors of leaf epidermal
cells) and cell elongation occurs perpendicular to the leaf blade plane. This is followed by
branch formation and trichome cell wall maturation. Wild-type plants first initiate trichomes on
the adaxial leaf surface of rosette leaves during the juvenile vegetative stage of development.
The first trichomes are formed at the leaf tip, followed by basipetal production of subsequent
trichomes (Hulskamp et al. 1994; Marks, 1997). Later initiated trichomes intercalate in between
mature trichomes. As the leaf blade grows, trichomes are separated from one another by
intervening pavement epidermal cells. The adaxial trichome distribution on later formed leaves
becomes progressively confined to the leaf tip. Adaxial trichomes are abdundant in rosette
leaves, and are less abundant in cauline leaves.
Trichome initiation begins on leaf primordia that are at least 100µm long (Larkin et al. 1996).
Leaves that are between 140-200µm in length have a minimum of 1-5 developing trichomes on
their surface. The observed occurrence of two adjacent trichomes on the leaf surface occurs

34
rarely, at a frequency much lower than expected by chance. This strongly suggests a biological
mechanism is functioning to actively regulate the minimum distance that separates trichomes.
In Columbia ecotype plants, there appears to be definite time points in development where
trichome initiation in the leaf blade ceases. The commencement of stomatal mother cell
formation coincides with a cessation of trichome initiation for a given region within the leaf
blade (Marks, 1994; Larkin et al. 1996). Therefore in leaf organ development, organ expansion,
vascular patterning and differentiation occur simultaneously. This is followed by trichome
formation and lastly stomata formation.
The transition to the adult phase of vegetative development is marked by trichome production
on both the adaxial and abaxial leaf surfaces. Adult leaf identity is associated with abaxial
trichome formation. Abaxial trichomes are initiated on rosette leaf seven and onwards (Chien
and Sussex, 1996). Abaxial trichome distribution is initially confined towards the leaf base at
the petiole midrib, and with successive leaf number expands to cover the entire leaf blade
uniformly. Abaxial trichomes increase with increasing plastochron number, while adaxial
trichome number decreases with increasing plastochron number (Chien and Sussex, 1996;
Marks, 1997).
Several genes play a role in adaxial trichome formation. FUSCA3 (FUS3), LEAFY
COTYLEDON1 (LEC1) and LEC2 function to suppress formation of adaxial trichomes on
cotyledons (Chien and Sussex, 1996). Cotyledons are normally glabrous, however fus3 plants
show ectopic trichomes on the adaxial surface of cotyledons marking a change in tissue identity
(Keith et al. 1994).
The timing of abaxial trichome formation can be manipulated by genetic, environmental and
chemical factors (Chien and Sussex, 1996). Mutants that exhibit altered phase transition
timings, such as the SERRATE mutant show precocious development of abaxial trichomes;
abaxial trichome initiation in these mutants occurs on leaf 2-3 (Prigge and Wagner, 2001). This
implies that SE functions in regulating the timing of the shift from juvenile to adult vegetative
development.
Two other gene families that regulate this process are the SQUAMOSA PROMOTER BINDING
LIKE PROTEINS (SPL) (Usami et al. 2009) and two AP2-like genes (TOE1 and TOE2). SPL

35
genes are regulated by the microRNA miR156. Perturbations in SPL9 and SPL10 or miR156
levels results in the production of abaxial trichomes. The production of abaxial trichomes can
be accelerated to two plastochrons earlier than normal by over-expression of the microRNA
miR172 that specifically targets TOE1 and TOE2 (Aukerman and Sakai, 2003, Schmid et al.
2003). Conversely, T-DNA insertions within the gene encoding miR172 delay abaxial trichome
formation by three plastochrons.
Longer photoperiods stimulate abaxial trichome formation on earlier formed leaves, as does the
application of the hormone gibberellic acid (GA) (Chien and Sussex, 1996; Clarke et al. 1999).
GA application can induce abaxial trichome formation as early as in leaf three in wild-type
plants and leaf one in se plants. GA biosynthesis inhibitors prevent abaxial trichome formation
but have no effect on adaxial trichome formation.
1.7.2 The patterning mechanism underlying trichome spacing
Pattern formation can be defined as the spatial arrangement of differentiated cells during
development of higher organisms. Stomatal cell spacing occurs by cell lineage (Marx and
Sachs, 1977), whereas trichome pattern formation is determined by cell-cell interaction (Larkin
et al. 1997). In wild-type plants, there is a minimum of three cells between developing
trichomes (Hulskamp, 2004). Trichome spacing is under genetic regulation by both positive and
negative regulators (Hulskamp, 2004, Figure 5). GLABRA3 (GL3), ENHANCER OF GLABRA3
(EGL3) (a homolog of GL3), GLABRA1 (GL1), and TRANSPARENT TESTA GLABRA1 (TTG1)
are genes that belong to the positive regulator group. TTG1, GL1 and GL2 promote trichome
specification in shoot tissue (Kirik et al. 2004).
TTG1 promotes trichome patterning in two ways. It promotes trichome initiation and it causes
lateral inhibition of neighbouring cells (Schnittger et al. 1999). TTG1 is a WD40 protein
family member that does not show transcriptional regulatory activity. The GL3, EGL3, and
GL1 proteins are all transcription factors. GL3 and its homolog EGL3 are BHLH family
members, whereas GL1 is a MYB family transcription factor (Larkin et al. 1993). gl1 and ttg1
leaves are glabrous (Schnittger et al. 1999). Studies have demonstrated that the TTG1 protein
binds to the GL3 and EGL3 proteins through one domain, and the GL1 protein binds the GL3
and EGL3 proteins through a different domain. This protein complex stimulates the GL2
protein, which mediates transcriptional activation, and trichome formation. The formation of

36
the protein complex also stimulates transcription of negative regulators that suppress trichome
formation. These include the MYB family proteins TRIPTYCHON (TRY), CAPRICE (CPC),
and ENHANCER OF TRIPTYCHON CAPRICE (ETC) (Kirik et al. 2004). These proteins
mediate lateral inhibition of trichome formation in neighbouring cells, thus maintaining an
appropriate spacing pattern between trichomes (Schnittger et al. 1999). CPC and TRY are
partially redundant and repress neighbouring cells from adopting trichome fate. This
mechanism occurs by non-cell autonomous action whereby these proteins move to adjacent
cells and bind to the GL3 and EGL3 proteins. This disrupts the binding between the GL3 and
EGL3 proteins with the GL1 protein. The consequence of this is no activation of the GL2
protein, thus trichome development is impeded.
Mutations in these three genes have additive effects; try plants display small trichome clusters
(2-3 trichomes/cluster). try cpc double mutants display large trichome clusters, consisting of up
to 40 trichomes per cluster. The try cpc etc triple mutant displays extremely large trichome
clusters, consisting of up to several hundred trichomes per cluster.
Figure 5. The genetic regulation of trichome spacing. The negative regulators TRY, CPC and ETC1
suppress trichome formation by moving to adjacent cells and binding to the positive regulators of
trichome formation TTG1, GL3 and GL1 (figure courtesy of Hulskamp, 2004).
1.8 TCP Proteins
The TCP family is a class of genes that regulates multiple aspects of plant structure in a variety
of monocots and dicots. This class of genes derives its name from the three founding members:
TEOSINTE BRANCHED1 (TB1) in maize, CYCLOIDEA (CYC) in Antirrhinum, and the
PROLIFERATING CELL NUCLEAR ANTIGEN FACTORS 1 and 2 (PCF1 and PCF2) in rice.
There are 22 TCP genes present in rice and 24 genes in Arabidopsis (Yao et al. 2007). The
presence of so many TCP genes in Arabidopsis and rice has been suggested to be due to
genome-wide and tandem gene duplication of TCP family members (Yao et al. 2007). These

37
gene duplication events have been thought to occur before the split between monocots and
dicots according to phylogenetic analysis and multiple sequence analysis of primary protein
sequences.
1.8.1 The TB1 protein and closely related homologs in other species
The maize TEOSINTE BRANCHED1 (TB1) gene derives its name from the maize ancestor
teosinte. Maize and teosinte exhibit dramatic differences in shoot architecture. Maize displays
apical dominance (growth along a single axis), while teosinte displays growth along multiple
branches (Figure 6). tb1 plants exhibit a loss of apical dominance and adopt a plant architecture
resembling teosinte (compare 6c and 6d). Outgrowth from axillary meristems is derepressed,
and lateral branches are formed (Doebley et al. 1997). The number of buds formed in tb1 plants
remains unaltered, however outgrowth from these buds is derepressed, thus TB1 functions to
suppress outgrowth from axillary meristems. This prevents lateral branches from forming, so a
distinct primary inflorescence architecture is maintained in the wild-type maize plant.
Figure 6. A comparison of plant architecture in maize and teosinte. (A) (courtesy of Doebley, 2003) shows a cartoon schematic of branching and inflorescence patterns in maize and teosinte. (B) inflorescence architecture of a wild-type maize plant. (C) inflorescence architecture of a wild type teosinte plant. (D) inflorescence architecture of a maize TB1 mutant plant. (Panels B-D courtesy of Hubbard et al. 2002)
D B C
A

38
The rice OsTB1 gene is a functional orthologue of TB1. It was identified based on high
sequence similarity and conserved genome synteny between rice and maize (Takeda et al.
2003). Like TB1, OsTB1 represses lateral branching in rice (Takeda et al. 2003). OsTB1
overexpression causes a decreased number of lateral branches. Repression of branch outgrowth
may be due to either enhanced auxin levels or sensitivity, preventing axillary bud outgrowth, or
by a direct repression of cell proliferation, as other TCP genes regulate expression of cell cycle
associated genes.
The Arabidopsis TCP gene TCP18/BRC1 is another functional orthologue of TB1 with regards
to regulation of lateral branching (Finlayson, 2007; Aguilar-Martinez et al. 2007). TCP18
suppresses outgrowth from axillary buds. tcp18 plants exhibit a loss of apical dominance and
form multiple branches. TCP18 acts in a pathway downstream of auxin and the MORE
AXILLERY BRANCHING (MAX) genes (Finlayson, 2007). Branch outgrowth has been shown
to be strongly derepressed in the 4 MAX gene mutants (Stirnberg et al. 2002; Sorefan et al.
2003; Booker et al. 2004). Functional interactions between TCP18 and lateral branching
pathways involving auxin, AXR1 and the MAX genes have been tested. The expression of
TCP18 is down-regulated in max backgrounds. Also, the resultant phenotype of max brc1
double mutants resembles the max phenotype, suggesting that TCP18 functions in a lateral
branching pathway downstream of MAX genes.
While auxin does not regulate TCP18 transcriptionally, TCP18 activity is necessary for the
auxin-induced control of apical dominance (Aguilar-Martinez et al. 2007). Another important
mode of regulation exists in a negative feedback loop between TCP18 and TCP12/BRC2,
whereby TCP18 seems to negatively regulate TCP12 transcript levels, as TCP12 expression is
up-regulated in tcp18 plants. These findings show that auxin regulation of lateral branching is
dependent on functional TCP (BRC1) activity, and that TCP expression is regulated by other
closely related TCP family members.
1.8.2 The CYCLOIDEA and DICHOTOMA genes
TCP genes also function in the regulation of petal asymmetry. Mutations in the TCP genes
CYCLOIDEA (CYC) and DICHOTOMA (DICH) result in radially symmetric (peloric) flowers
in Antirrhinum (Luo et al. 1999, Figure 7).

39
Antirrhinum flowers produce five petals; two in the dorsal position, two in the lateral position,
and one ventral petal (Luo et al. 1999). The dorsal and lateral petals are individually
asymmetric, while the ventral petal has bilateral symmetry. The flower itself displays bilateral
symmetry through an axis that bisects the ventral petal.
The peloric flowers of the cyc dich double mutant result from all the petals having adopted
ventral petal identity (Luo et al. 1999). cyc plants form semi-peloric flowers, whereby the
lateral petals have adopted ventral petal identity, and dorsal petals have an identity that is a
combination of dorsal and lateral petals.
The specific expression patterns of CYC and DICH in the dorsal region function to make the
dorsal petal asymmetric. The CYC and DICH genes are expressed during early development in
the dorsal region of the floral meristem (Luo et al. 1999). As development continues, the CYC
expression domain is maintained, while DICH gene expression is confined to the dorsal half of
the dorsal petal. DICH functions to render the dorsal petal asymmetric by restricting cell
cycling in the dorsal region of the dorsal petal.
CYC dominant mutants show expanded CYC expression in the lateral and ventral petal regions.
Since DICH (the factor that makes dorsal petals asymmetric) is not expressed here, lateral and
ventral petals adopt bilateral symmetry with all petals adopting the shape of the lateral half of
the dorsal petal.
Figure 7. The shape and morphology of petals in Antirrhinum. (A) shows a cross-section cartoon schematic of Antirrhinum petal. D represents the dorsal petals, L represents the lateral petals, and V represents the ventral petal. Dd denotes the dorsal half of the dorsal petal, and Dl denotes the lateral half of the dorsal petal. (B) shows cartoon schematic of morphology of all 5 petals in wild type (WT), dich and cyc flowers. (C) cross section (left hand side) and side view (right hand side) of Antirrhinum flowers of wild type (top panel), dich (middle panel), and cyc (lower panel) plants. (Panels A-C courtesy of Luo et al. 1999)
cyc
B C
40
In addition to promoting dorsal petal asymmetry, CYC functions to arrest dorsal stamen
development (Gaudin et al. 2000). This occurs by repression of the D-type cyclin CYCLIND3b
(CYCD3b) in the dorsal region of the floral meristem. Reduction of CYCD3b expression
coincides with early termination of cell cycling. CYC mutants derepress CYCD3b, extending
cell cycling in the dorsal region of the flower. This results in the formation of a functional
dorsal stamen. Thus CYC functions to promote organ development by negatively regulating
cell proliferation.
One putative cognate of CYC in Arabidopsis is TCP1 (Cubas et al. 2001). Whereas Antirrhinum
flowers are bilaterally symmetric due to the function of CYC, Arabidopsis flowers are radially
symmetric. TCP1 shows a similar domain of expression to CYC in the dorsal (adaxial) region of
the axillary meristem, but its expression is delayed until later in flower development (Cubas,
2004). Polar expression is found in the dorsal regions of lateral shoots during outgrowth.
Despite the sequence similarity, and similar expression profiles of these two genes, a definitive
role for TCP1 in flower asymmetry has not been established, due to maintence of radial
symmetry in tcp1 flowers.
TB1 and CYC show parallel modes of action on plant development (Doebley et al. 1997). Both
regulate the development of an axillary structure, in the case of CYC it is flowers, and lateral
branches in the case of TB1. Both of these genes have a negative effect on growth; CYC
suppresses CYCD3b –mediated cell division in the dorsal region of the flower. TB1 represses
cell division in the axillary meristems that would otherwise lead to lateral branches being
produced by the plant.
1.8.3 The PCF1 and PCF2 proteins
The third founding member of the TCP family is represented by the PCF genes of rice. The
PCF1 and PCF2 proteins bind to specific sequences (referred to as Site IIa and IIb) in the
promoter of the PROLIFERATING CELL NUCLEAR ANTIGEN (PCNA) gene, whose
expression regulates cell proliferation (Kosugi and Ohashi, 1997).
1.8.4 The TCP domain structure and function
TCP proteins form two subfamilies based on their overall sequence similarity to the TB1, CYC
or PCF proteins. TCP proteins that are more similar to CYC and TB1 form one subfamily, and

41
those proteins that are more similar to the PCF1/2 proteins form the other subfamily (Figure 10,
Cubas et al. 1999).
Bioinformatics analysis has revealed that all TCP proteins share a domain encoding a novel
basic helix-loop-helix (bHLH) motif (Kosugi and Ohashi, 1997). This motif has been dubbed
the TCP domain, and has been suggested to be responsible for protein-DNA interactions.
Mutations within this motif abolish binding of the PCF proteins to the PCNA promoter
sequence, demonstrating that the bHLH motif is necessary for DNA binding specificity (Kosugi
and Ohashi, 1997). Protein truncation studies on the TCP4 protein have revealed that the basic
region of the TCP domain is necessary for DNA binding. Competition assays have revealed that
the TCP4 protein binds to the major groove of DNA (Aggarwal et al. 2010).
The DNA sequence to which TCP proteins bind has been determined. The sequence is slightly
different for each family, with class I (PCF1/2 subfamily) binding to the GGNCCCAC
sequence, and class 2 (CYC/TB1 subfamily) binding to the GTGGNCCC sequence (Kosugi and
Ohashi, 2002). The bHLH motif that is found in all TCP proteins is unrelated to the bHLH
motif found in the plant bHLH family of transcription factors. No primary amino acid sequence
homology exists between the core DNA binding motifs of TCP and bHLH families. bHLH
family transcription factors bind to the E box sequence (CANNTGN where N = any base)
(Toledo-Ortiz et al. 2003).
Figure 8 illustrates a multiple sequence alignment and the conserved residues making up the
TCP domain in family members from rice, maize and Arabidopsis (from Cubas et al. 1999).
Members of both subfamilies are included in this alignment, showing the slightly different
alignment of subfamily members within the TCP domain. There is a high degree of residue
conservation in the various motifs comprising the TCP domain (Cubas et al. 1999). Within the
TCP domain are residues that make up a putative bipartite nuclear localization sequence (NLS)
(Cubas et al. 1999).
Several TCP proteins have been shown to be nuclearly localized. The Lotus japonicas
CYCLOIDEA-like1 (LjCYC1) gene shows nuclear localization in protoplast assays (Qin et al.
2004). In Arabidopsis, several TCP proteins have also been shown to be nuclearly localized.
TCP10-GFP fusion proteins have been localized to nuclei in onion epidermal cells (Suzuki et
al. 2001). TCP18/BRC1 and TCP12 /BRC2 are nuclearly targeted (Aguilar-Martinez et al.

42
2007). The TCP21/CHE protein was found to be nuclearly localized using GFP tagged proteins
in Arabidopsis protoplasts (Pruneda-Paz et al. 2009). TCP3 has been found to mediate
transcriptional activation of IAA3 and SHY2 (Koyama et al. 2010). Recently, TCP8 was
demonstrated to be nuclearly localized and to mediate transcriptional regulation of the PPR1
gene (Hammani et al. 2011). This lends weight to the proposed role of TCP proteins in
transcriptional regulation.
The TCP domain is close to the N-terminus of the protein. The basic motif is enriched in
positively charged lysine and arginine residues. The helices are rich in hydrophobic residues
such as alanine, leucine and tryptophan. The loop contains 7 conserved residues including the
helix breaking glycine. Acidic, polar, non-charged and non-aliphatic residues predominate in
the loop region (Yao et al. 2007). Several differences exist in structure between the two TCP
subfamilies. The CYC/TB1 subfamily members contain a putative bipartite nuclear localization
signal (NLS), whereas PCF sub-family members only have a partial NLS (Cubas et al. 1999).
Residue composition of the loop differs between subfamily members. Helix 2 in the CYC/TB1
subfamily is longer than the PCF1/2 subfamily (Cubas et al. 1999). Also, members of the
CYC/TB1 subfamily have another conserved motif called the „R‟ domain (due to the high
number of Arginine residues in this region).

43
Figure 8. The TCP domain is conserved among all family members. (A) shows a multiple sequence alignment from TCP proteins from rice, Antirrhinum, maize and Arabidopsis. Underlined circles represent the putative bipartite nuclear localization sequence. Members of subfamily (I) and (II) are denoted by the brackets. The Red box denotes the conserved Lysine residue at the N-terminal domain in both family members and the green box denotes the conserved Leucine residue in subfamily (II) members based on the findings of Aggarwal et al (2010). (B) shows the conserved ‘R’ domain found in CYC/TB1 subfamily members. (C) shows the members and the division of the two sub-family members of the TCP family. (D) The consensus sequence of the TCP domain. (Panels A-D are courtesy of Cubas et al. 1999)
Recently, another study was performed to identify the consensus sequence for the TCP domain
(Aggarwal et al. 2010). An 80 amino acid stretch encompassing the previously characterized
TCP domain was examined within 206 annotated TCP proteins. The frequency of occurrence of
specific amino acids at each position, called the URF (unique residue frequency) was examined.
This analysis identified a lysine as the N-terminal residue of the TCP domain, as it was
conserved in 93% members of TCP family (Figure 8, red box).
The determination of the C-terminal residue was performed separately for each of the two sub-
groups of the TCP family, as residue composition in this region of the TCP domain is poorly
conserved between TCP sub-family members. Class I makes up the PCF1/2 subfamily, and
(d)
(I)
(II)
44
class II makes up the TB1/CYC subfamily. The C-terminal TCP domain residues were
identified as alanine and leucine for class I (Figure 12, results section) and class II (Figure 8
green box), respectively (URF‟s of 85% and 91%, respectively). The consensus sequence for
the TCP domain of subfamily I was predicted to be 62 amino acids in length and 58 amino
acids for subfamily II (Aggarwal et al. 2010). A multiple sequence alignment of TCP8, TCP14,
and TCP15 proteins and the conserved residues of the TCP domain was performed based on
the findings of Aggarwal et al. 2010 (Figure 12, results section).
1.8.5 TCP protein functions and interaction
TCP proteins interact with other proteins. Several examples exist of TCP proteins forming
homo and heterodimers with other TCP proteins of the same sub-family. PCF1 and PCF2 are
capable of forming both homo and heterodimers (Kosugi and Ohashi, 1997, 2002). TCP15 and
TCP14 form heterodimers and TCP8 forms homodimers in yeast (Riggs and Prouse, personal
communication). Size exclusion chromatography revealed that the TCP4 protein binds DNA as
a dimer (Aggarwal et al. 2010). The Arabidopsis TCP15 protein has recently been shown to
form a TCP15-TCP11 heterodimer (Viola et al. 2011).
In addition to forming interactions with other TCP family members, several proteins belonging
to different protein families have been identified as interacting with TCP proteins
(Tremousague et al. 2003; Weir et al. 2003; Crawford et al. 2004; Aggarwal et al. 2010). The
Arabidopsis TCP10 protein was found to directly interact with histidine-aspartate signal
transducers (AHPs) AHP2 and AHP3 via yeast 2 hybrid assays during a screen of proteins
interacting with AHPs (Suzuki et al. 2001). TCP10, AHP2 and AHP3 proteins show
overlapping expression domains within lateral organs (leaves, buds, flowers) (Suzuki et al.
2001). AHP proteins are part of an evolved bacterial 2-component signalling mechanism that is
used in plants for signal transduction of the hormone cytokinin (Werner and Schmülling, 2009).
This finding suggests that some TCP proteins may mediate effects on plant architecture through
a cytokinin-dependent pathway.
The Antirrhinum TCP protein CINNCINATA (CIN) interacts with the MYB family
transcription factor MIXTA (MIX) to establish conical cell identity in petals (Crawford et al.
2004). This suggests that the TCP-MYB protein interaction functions to regulate cell type
identity. The Antirrhinum TCP protein TCP INTERACTING WITH CUPULIFORMIS (TIC)

45
has been demonstrated to interact with CUPULIFORMIS (CUP) by yeast 2 hybrid experiments
(Weir et al. 2003). CUP is a NAC-domain transcription factor, whose orthologues include NO
APICAL MERISTEM (NAM) in Petunia, and CUP SHAPED COTYLEDON1, 2 and 3
(CUC1-3) in Arabidopsis (Aida et al. 1997, 1999; Vroemen et al. 2003). Mutations in NAC
family proteins show abnormalities in organ separation, often forming continuous rings of
cotyledon tissue around the SAM (Aida et al. 1997, 1999; Vroemen et al. 2003). This suggests
that the interaction of NAC and TCP proteins may function to maintain boundaries between
lateral organs.
The function of the CUP/TIC interaction was tested by examining the phenotype of cup plants
(Weir et al. 2003). cup plants exhibit a variety of boundary defects in all stages of development.
cup embryos display a ring of continuous cotyledon tissue at the hypocotyl apex. During
vegetative development cup plants form leaf petioles that are fused to vegetative nodes, and the
blades of individual leaves are fused. In reproductive development, mutants rarely form
flowers, and if they do they are fasciated and exhibit fused organs. Therefore, the function of
CUP/TIC protein interaction is to promote physical separations between lateral organs.
The phenotype exhibited by cup plants is more severe than that exhibited by its orthologues
NAM and CUC1/2, due to the decreased redundancy of NAC family genes in Antirrhinum
(Weir et al. 2003). In Arabidopsis, CUC1 or CUC2 single mutants appear relatively normal, and
display a phenotype of partial cotyledon fusion (Aida et al. 1997, 1999). These genes function
to promote the separation of cotyledons and establish boundary formation between the SAM
and cotyledon primordia. This occurs due to the maintenance of a bilateral and radial pattern of
STM, CUC1 and CUC2 expression in and about the SAM; STM is expressed within the SAM
(Long and Barton, 1996), while CUC1 and CUC2 are expressed between the presumptive SAM
and cotyledon primordia (Aida et al. 1999). The boundary regions between the SAM and the
cotyledons are areas of low cell proliferation and differentiation, thus the CUC genes may
function to form boundaries by restricting cell proliferation and cell differentiation (Vroemen et
al. 2003). CUP may promote boundary formation by interacting with different TCP proteins at
various stages of development. This results in decreased levels of cell division between organs
to promote boundary formation.

46
TCP proteins have been shown to interact with a wide variety of other proteins to mediate
control of various aspects of plant architecture, including boundary formation, organ identity,
and lateral branching. These effects on plant architecture have been shown to be exerted by
TCP proteins through direct regulation of cell proliferation in specific tissue/organ types at all
stages of development.
1.8.6 Regulation of TCP Gene Expression
Gene expression occurs at multiple levels. One common mode of controlling gene activity in
eukaryotes is to regulate the mRNA transcript level (Meister & Tuschl, 2004). Mature mRNAs
can be targeted for cleavage by short interfering RNAs (siRNAs) or by microRNAs (miRNAs).
miRNAs are naturally occurring endogenous molecules. Genes that encode microRNAs
produce short, single-stranded RNA molecules that are complementary to the mRNA of
interest. A double stranded RNA complex is produced which undergoes enzymatic cleavage by
DICER and other RISC complex proteins (Meister & Tuschl, 2004). This prevents translation
of the mRNA of interest.
Regulation of Arabidopsis TCP genes involved in leaf morphogenesis has been shown to occur
by the expression of the microRNA JAW (Palatnik et al. 2003). The JAW locus encodes a
family of microRNAs such as miR159a/b/c which are also known to target members of the
MYB family of transcription factors (such as MYB33 and MYB65 mRNA). JAW also encodes
a 20 nucleotide microRNA (miR319a) that specifically targets TCP family members TCP2,
TCP3, TCP4, TCP10, and TCP24, which promote cell proliferation (Palatnik et al. 2003). The
region of complementarity between JAW RNA and affected TCP RNA encodes a 7 amino acid
motif found outside the TCP domain, not present in TCP genes unaffected by JAW action.
Reduced levels of TCP4 transcript are found when elevated levels of JAW are produced, such
as in jaw-D and 35S::JAW transgenic plants (Palatnik et al. 2003, 2007). Microarray analysis
has also identified TCP2, TCP3, TCP4, TCP10 and TCP 24 to be significantly down-regulated
in jaw-D plants.
The level of microRNA expression is crucial for appropriate down-regulation of TCP transcript
to occur. The result of this is to limit cell division and cue cell differentiation. The balance of
cell cycling and differentiation is a fundamental part of leaf morphogenesis. Normal TCP
expression is guided by miRJAW activity in order to control leaf morphology. Two examples of

47
such TCP genes are TCP2 and TCP4 (Palatnik et al. 2003). tcp2 and tcp4 plants lack JAW-
mediated down-regulation of their transcript level due to mutations within the miRJAW binding
site. TCP2 and TCP4 are the Arabidopsis orthologues of the Antirrhinum TCP gene
CINNCINATA (CIN) (Nath et al. 2003). CIN is expressed in the leaf, and promotes leaf growth
by enhancing cell division. The front of cell division moves in a proximo-distal direction along
the leaf blade. Prolonged duration of cell proliferation results in excess tissue production in the
leaf blade. This results in a wrinkled/uneven leaf surface forming in cin plants (Nath et al.
2003). JAW is expressed in a basipetal longitudinal gradient, paralleling the expression of cell
proliferation markers (Palatnik et al. 2003). jaw-D and 35S::JAW transgenic plants exhibit
aberrant cell division, causing a serrated and crinkly leaf margin phenotype, due to negative leaf
curvature. These leaves cannot be flattened without cutting the leaf margins (Palatnik et al.
2003). The jaw-D phenotype can be partially recovered by over-expression of either TCP2 or
TCP4.
TCP3 has also been shown to be a bona fide target of JAW activity as JAW-resistant TCP3
over-expressing mutants display cotyledon fusion defects, in addition to defects in shoot
formation and an elongated hypocotyl (features reminiscent of cuc1 cuc2 double mutant)
(Koyama et al. 2007). The Arabidopsis TCP3 gene is proposed to function antagonistically to
CUC1 and CUC2 in limiting boundaries between lateral organs (Koyama et al. 2007). This
theory of TCP3 action is supported by the finding that expression of the CUC regulator miR164
is suppressed in tcp3 plants. tcp3 plants show multiple defects in shoots and lateral organs.
These include serrated cotyledons with ectopic trichomes, and serrations at the base of rosette
leaves. Ectopic CUC, BREVIPEDICELLUS (BP), BLADE-ON-PETIOLE (BOP1/2),
SHOOTMERISTEMLESS (STM) and LATERAL SUPRESSOR (LAS) gene expression was found
in leaves and cotyledons of tcp3 plants.
1.8.7 Targets of TCP action
Identification of putative targets of TCP protein action has revealed potential pathways in
which TCP proteins act, including cell proliferation, metabolism, respiration, germination, and
hormone responses. Identification of downstream targets of TCP proteins has proven easy since
the identification of conserved TCP protein binding elements found within the rice genome.
These sequences are functionally conserved in the Arabidopsis genome as well.

48
The PCF1 and PCF2 proteins in rice have been documented to bind to the promoter of the rice
PROFLIFERATING CELL NUCLEAR ANTIGEN (PCNA) gene through binding of site IIa and
IIb sequences (Kosugi and Ohashi, 1997). PCNA encodes a clamp functioning as part of the
DNA polymerase complex, thus promoting DNA replication (Raynaud et al. 2006). Two
Arabidopsis homologues of the rice PCNA gene were recovered in a screen of potential targets
of TCP transcriptional activity (Kosugi and Ohashi, 2002; Tremousaygue et al. 2003). The
Arabidopsis TCP protein AtTCP20, binds to a site II consensus sequence in the promoter of
PCNA2 (Tremousaygue et al. 2003). This sequence is very similar to the site II element
recognized by the PCF1/PCF2 proteins. This demonstrates that site II sequences in found in
Arabidopsis, function identically to their homologues in rice.
An initial screen of the Arabidopsis genome for TCP protein binding elements recovered
known auxin inducible genes in addition to the PCNA genes (Kosugi and Ohashi, 2002). Some
potential targets that were revealed were Arabidopsis thaliana GRETCHENHAGEN3 (AtGH3),
and the AtPTS2 genes. These genes are auxin inducible and have roles in auxin and methyl-
jasmonate conjugation, root elongation, and hypocotyl growth (Khan and Stone, 2007a, b).
AtGH3 is homologous to the soybean GH3. AtPTS2 encodes a homologue of the 26S
proteosome subunit S2, which may be auxin-inducible, as there are several AuxRE-like
elements around the TCP binding site. These observations imply that the class 1 (PCF1/2
subfamily) TCP proteins are likely to be involved in upregulation of several growth-associated
genes including auxin-induced genes.
Several subsequent screens of the Arabidopsis genome have identified other binding targets of
AtTCP20. One such screen showed an enrichment of the site II sequence in a large number of
annotated ribosomal protein encoding genes in the Arabidopsis genome, specifically identifying
promoters of genes encoding CYCLINB1;1, AtPCNA2, ribosomal protein gene L24, and
ribosomal protein gene S27 (Li et al. 2005). A similar study revealed an enrichment of site II
elements within the promoters of CYTOCHROME-C dependent respiration genes and genes
involved in cellular respiration (Welchen and Gonzalez, 2005). This study also demonstrated
that AtTCP20 binds the site II elements of the CYTOCHROME C-1/2 promoters in vitro.
A transcription profiling experiment to identify factors important in bud outgrowth revealed an
enrichment of the site II element within the promoters of genes upregulated in response to
decapitation (Tatematsu et al. 2005). Therefore, TCP proteins in Arabidopsis may function to

49
promote axillary meristem outgrowth in response to decapitation. TCP genes could be
regulating this aspect of plant development (lateral branching) in one of two ways; firstly, TCP
proteins could be functioning as TB1 orthologs and exerting repression on axillary meristem
outgrowth. The other alternative is that they could be functioning like PCF1/2 orthologs to
promote outgrowth given the appropriate conditions.
TCP-binding elements were also found to be enriched in the promoters of 72 genes up-
regulated in transcription profiling experiments examining factors regulating germination
(Tatematsu et al. 2006). These genes may be targeted for up-regulation through binding of this
consensus sequence by the TCP14 protein based on its germination-specific expression profile.
A recent study has demonstrated the role TCP proteins in the regulation of diurnal gene
expression. TCP15 and TCP3 were shown to bind to site II elements that were enriched in the
promoters of diurnally expressed mitochondrial genes (Giraud, et al. 2010). Diurnal expression
of these genes was abolished by mutations within site II elements. Furthermore, a role for
TCP15 in the regulation of circadian clock proteins was established through the specific
decrease in PRR1 expression in a tcp15 background and the protein-protein interaction of
TCP15 and PRR1 (Giraud et al. 2010).
In summary, TCP genes affect cell division and cell differentiation, and play a role in
establishing boundaries between lateral organs. TCP proteins have been shown to regulate gene
expression by physically interacting with known DNA regulatory sequences. Numerous targets
of TCP action have been suggested. These include genes involved in lateral branching, protein
synthesis, organ boundary formation, germination, and control of circadian rhythms. These are
all aspects of plant architecture for which some knowledge of pathways at work is known, but
the whole picture is far from clear.
1.9 Goals for this study:
This study was undertaken to characterize three members of the TCP gene subfamily I in
Arabidopsis thaliana and to better understand the developmental pathways in which they
function. Much work has been done characterizing TCP subfamily II members in other plant
species and has shown that these proteins regulate multiple aspects of plant development
ranging from lateral branching (Doebley et al. 1997) to organ symmetry (Luo et al. 1999) and
leaf curvature (Nath et al. 2003; Palatnik et al. 2003). The Arabidopsis genome contains 24
50
TCP genes, of which only two TCP subfamily I members have been studied. Based on
information from the literature it is possible to make logical testable hypotheses about TCP
gene function. TCP subfamily I members, to which TCP8, TCP14 and TCP15 belong have
been shown to promote cell proliferation through DNA binding ability (Kosugi and Ohashi,
2002).
The main hypotheses of this thesis are that the Arabidopsis thaliana TCP subfamily I members
TCP8, TCP14 and TCP15 modulate cell proliferation levels, thereby exerting an effect on plant
development.
Aims: The main aim of this study was to examine the function of TCP8, TCP14 and TCP15 by
mutant analysis, more specifically in the following manner.
1. To verify a relationship between TCP15 and TCP14 expression and the hormone auxin.
2. To quantify differences in leaf morphology in the TCP8 mutants by comparing leaf size
and shape to wild type.
3. To examine adaxial leaf epidermal cell spacing patterns by measuring pavement
epidermal, stomatal and trichome cell densities.
4. To examine if tcp8 leaves display altered leaf vein patterning due to changes in cell
proliferation levels. This will be done by tracing leaf vasculature and comparing spatial
patterns of freely ending and vein density, and loop shape parameters across the leaf
blade of wild-type and mutant leaves.
5. To assess if specific phases of the photoperiod are important for TCP mediated effects
on seedling development (such as hypocotyl elongation) by comparing hypocotyl and
root elongation of wild type plants grown under continuous light or continuous dark
conditions to that to TCP mutants.

51
2.0 Materials and methods
2.1 Arabidopsis ecotype and mutant origins
The wild -type Arabidopsis ecotypes Columbia (Col; lab stock) and Nössen (ABRC; seed stock
CS1394) were utilized in this project as described in the results. T-DNA insertion mutant lines
were obtained for the three TCP genes studied in this project (Table 1).
Table 1. Arabidopsis mutants and constructs employed in this study. Gene ID/ Ecotype/Construct AGI
designation/
Vector
name
Source obtained from T-DNA insertion/
line # / Selectable
marker
Columbia Ecotype COL-0 N/A Lab Stock N/A
Nossen Ecotype NOS-0 N/A ABRC CS1394
TCP8 (NOS Background) At1g58100 RIKEN 15-4779-1
TCP14 (COL Background) At3g47620 GABI-KAT 611CO4
TCP15 (COL Background) At1g69690 Salk 011491
TCP15 (COL Background) At1g69690 Berleth Lab; U of T WG335; Kanamycin
DR5::GUS (COL Background) pBI101 Berleth Lab; U of T Kanamycin
TCP15::GUS (COL
Background)
pBI101 Lab stock Kanamycin
2.2 General plant growth conditions
Seeds were surface sterilized as with growth on solid tissue culture media (see below), and
then sown on soil (Premier Pro-mix PGX, Canada). Seeds were sown at a maximum density of
20-25/ 10 x 10 cm square pot. The pots were covered with saran wrap or a plastic dome lid
and allowed to stratify for three nights in a darkened room at 4oC. The pots were then placed
under a light stand with 16 hour light, 8 hour dark cycle, light intensity at 75µE, at 22oC.
For plants propagated on selective media the following protocol was used. Seeds were
surface sterilized by immersion in distilled water and agitated on a mechanical tipper for 20
minutes. Following this, the water was removed and replaced with 1mL of 70% ethanol, and the
seeds were agitated for five minutes. The alcohol was then replaced with 1mL of 10% bleach
(Chlorox) and 0.05% SDS (Bioshop) solution to kill any insect eggs on the seed coat. The seeds
were agitated for a further 5 minutes. This solution was removed and the seeds were washed
seven times with sterile distilled water. The final rinse of water was replaced with 1mL of
autoclaved 1% agar solution (Bioshop) to facilitate seed dispersal in plating.

52
For plant media, the following reagents were combined in the following manner.
Murashige-Skoog salts (Sigma) at a concentration of 2.2g/L were dissolved in deionized water
along with 1.5% sucrose (Bioshop), and 0.5g/L MES (Sigma). The pH was adjusted to pH 5.7
and the solution was autoclaved. For solid media, 0.8% phytagar (Sigma) was added to the
mixture prior to autoclaving.
2.2.1 Genetic crosses
This technique was adapted from (“Arabidopsis, A Practical Approach”, Edited by Z.A.
Wilson, Oxford University Press). Briefly, a Leica MZ75 stereomicroscope was used to select
female flowers on the basis of bud sizes of >5mm (approximately stage 12 of flower
development according to Smyth et al. 1990), and buds in which the sepals and petals remained
tightly closed around the central gynoecium, although the stigma was visible from the top of the
bud. Younger buds surrounding the prospective female were dissected away from the
inflorescence to allow greater access to the gynoecium for manual pollination. The outer floral
organs (sepals, petals and stamens) were carefully removed from the prospective female using
watchmaker needle-nosed forceps (Inox5 FST by Dumont Electronic, Switzerland). The
prospective male flower was chosen based on the following criteria: the flower should be at
stage 12 or greater of floral development, the petals should be opened, but not bent away from
the central axis of the flower, and the anthers of the flower should not appear dried out. The
sepals and the petals of the prospective male were carefully dissected away from the flower.
The flower was then grasped firmly at the base and the anthers were gently brushed back and
forth upon the stigma of the female flower to deposit pollen onto it. This was done until the
stigma appeared to change in colour from whitish-cream, to bright yellow, indicating a
sufficient amount of pollen had been transferred to the female‟s stigma to allow fertilization to
occur. The female flower was then marked by tying a piece of string around the pedicel. The
gynoecium was monitored for silique formation, and seeds were collected from mature dry
siliques.
2.2.2 Arabidopsis transformation
Transgenic plants harbouring the auxin accumulation reporter DR5::GUS (Berleth lab;
Ulmasov et al. 1997) were generated by Agrobacterium mediated plant transformation. Plant
transformation with Agrobacterium tumfaciens strain GV3101 (carrying the desired binary
plasmid) was performed using the modified protocols of Clough and Bent (1998) and Martinez-

53
Trujillo et al. (2004). Fifty mL of Luria-Bertani (LB, Bioshop 25g/L) broth containing a final
concentration of 50µg/mL Kanamycin-sulfate (GIBCO) and 10µg/mL of Gentamycin was
inoculated with the appropriate Agrobacterium clone, and allowed to shake at 110 rpm at room
temperature for two days. Cells of the Agrobacteria culture were pelleted in a Sorval centrifuge
(Sorval RC5Cplus) at 6000 rpm for 10 minutes at 4oC. The cells were resuspended in 10mL of
infiltration media (2.2g/L Murashgie-Skoog salts (Sigma), 5% sucrose (Bioshop), 0.5g/L MES
(Sigma), pH 5.75), and the optical density at 600nm was measured using a spectrometer (LKB
Biochrom ultraspec II). The absorbance was adjusted to > 1.5 with more infiltration media.
Silwet (Vis-01 Lehle Seeds, Texas) was added at a concentration of 0.5µL/mL infiltration
media. Plants selected for transformation were grown according to general growth conditions
(see above). The plants were thinned to approximately four plants/ 10x10 cm square pot. After
the plants bolted, they were clipped below the primary inflorescence and allowed to grow for 3-
4 more days prior to transformation. This allows for production of axillary meristems. The night
before transformation, the plants were thoroughly watered to open up their stomata, which aids
in increased transformation efficiency. Inflorescences of these plants were infused with the
Agrobacterium solution using pasteur pipettes (Martinez-Trujillo et al. 2004). The plants were
laid on their sides, and covered. The plants remained in darkness overnight, and were returned
to upright position the following day. The plants were allowed to mature and seeds were
collected and subsequently screened on solid media supplemented with the appropriate
selective agent (Kanamycin, 50µg/mL, or BASTA, 10µg/mL).
2.3 Hormone assays
2.3.1 Auxin inducibility assay
The phytohormone auxin Indole-3-acetic acid (IAA, Sigma) was dissolved in DMSO, filter
sterilized (Milipore) and then added to autoclaved solid or liquid media. Changes in gene
expression and physiological responses were monitored in control and IAA treated plants and
documented.
2.3.1.1 Auxin inducibility assay: In liquid culture
This protocol was adapted from Tatematsu et al. 2004. Briefly, wild-type seedlings were grown
in two 50mL cultures of liquid MS media (see recipe above). These cultures were propagated
on a rotary orbital shaker (Labline orbit shaker) shaking at 110 rpm, under constant light (about
75µE) at room temperature. After one week, hormone induction was conducted in the following

54
manner. To one flask, dimethyl sulfoxide (DMSO, Caledon Laboratories Ltd, Georgetown
Ontario) was added to give a final concentration of 0.1 % (v/v) and the culture was agitated for
one hour. DMSO was the solvent for hormone resuspension and served as the negative control.
To the other flask, IAA dissolved in DMSO was added to give a final concentration of 100nM
and. After one hour of shaking the seedlings were harvested and powdered in liquid nitrogen
and RNA was extracted (Section 2.6) and subsequently used for quantitative RT-PCR.
2.3.2 NPA treatment assays
Wild-type (Columbia) and transgenic line seeds (WG335 and DR5:GUS) were surface
sterilized and sowed on 0.5X MS media supplemented with 0.1% DMSO, 10µM N-1-
Naphthylphthalamic Acid (NPA, Chem Service, West Chester, PA), 25µM NPA, or 50µM
NPA. Plates were stratified for three days at 4oC in the dark. At 14 days post sowing, seedlings
were either GUS stained or imaged using a Leica MZ75 stereomicroscope to assess plant
morphology or GFP expression (using a Curtis fluorescent lamp).
2.3.3 Root elongation assays
Wild-type and mutant seeds were surface sterilized and plated on 0.5X MS media containing
the auxin 2,4-D (GIBCO, NY) in varying concentrations from 100nM to 10µM or 0.1%
DMSO. Plates were stratified for three days at 4oC in the dark. Seedling root length was
measured and recorded seven days post sowing.
2.3.4 Hypocotyl (light vs dark) length assays
To examine if there were any differences in the skotomorphogenic effect (McNellis and Deng,
1995) wild-type and TCP mutant seedlings were surface sterilized and plated on solid plant
media. Half the plates were wrapped in foil to simulate dark growth conditions. After the
radicale had emerged from the plates (about two-three days post sowing) plates were positioned
upright so that seedlings could grow parallel to the gravity vector. After seven days of growth,
the seedlings were scored for root and hypocotyl length.
2.3.5 The effect of NPA and IAA on leaf serration
This protocol was modified from Hay et al. (2006). Briefly, wild-type and tcp8 plants were
grown for 3-4 weeks in magenta boxes until plants bolted and produced cauline leaves. First
node cauline leaves were dissected in a sterile manner and placed in liquid 0.5X MS media
supplemented with 0.1% DMSO or NPA or IAA (5 µM to 10µM). After 7 days on

55
supplemented media, leaves were imaged using a Leica MZ75 stereomicroscope with digital
image capture system.
2.4 Small-scale (mini-prep) plant leaf DNA extractions
A small (approximately 5mm in length) leaf was selected from desired plants, and placed in a
sterile 1.5mL microcentrifuge tube. The leaf was mascerated using a plastic pestle. To this,
100µL of plant DNA extraction buffer (2% sodium dodecyl sulphate, 0.1M sodium chloride,
0.2M Tris-HCl pH8, 2.5mg/mL proteinase K, 20mM ethylene diamene tetraacetic acid
(EDTA)) was added, and tissue grinding was repeated until a homogeneous green solution
resulted. This mixture was incubated in a 370C water bath for 30 minutes. To this sample 50µL
each of Tris-buffered phenol and 25:1 Chloroform: isoamyl alcohol were added sequentially
followed by vigorous vortexing. The mixture was centrifuged in a Sorval microcentrifuge
(Sorval MC12V) for three minutes at 13,000 rpm. The top layer was recovered and precipitated
with 1/10 volume of 3M sodium acetate (pH 5.2) and two volumes of ice-cold 100% ethanol,
and incubated on ice for 15 minutes. The mixture was centrifuged for five minutes at 13,000
rpm to recover the DNA. The DNA pellet was washed once with 1mL of 70% ethanol, followed
by centrifugation for two minutes. The washed pellet was dried using a vacuum pump
centrifuge (Savant Speed Vac SVC100) for five minutes. The pellet was then resuspended in
50µL of 1X TE (10mM Tris, 1mM EDTA, pH8).
2.5 Polymerase Chain Reaction (PCR)
Unless otherwise stated, 37 cycle PCR was carried out in the following manner. Reactions with
a final volume of 50µL were set up containing sterile deionized water, 0.2mM dNTP mix
(Fermentas), 0.2µM each of forward and backward primers (Invitrogen), 5µL of PCR buffer
(final concentrations of 50mM KCl, 20mM Tris, pH 8.4), two units of Taq polymerase and
2mM MgCl2. Finally, 200-500ng DNA template was added to the other PCR components. The
standard program set up for DNA amplification was as follows. The first step consisted of a
long denaturation step at 94oC for 90s followed by a short denaturation step for 15s. The
annealing temperature (between 50-60oC, based on primer Tm) was carried out for 15s,
followed by extension at 72oC (1min/Kb of amplicon size). The steps from the short
denaturation to extension were repeated 36 times, followed by a final long extension step at
72oC for 10 min. PCR reactions were carried out in either a 60 well PTC-100 Programmable
thermal cycler (MJ Research Inc) or a MJ Mini Personal Thermal-cycler (BioRad). The

56
amplified products were visualized by subjecting the PCR samples to electrophoresis on a 1%
agarose 0.5X TBE gel (45mM Tris, 44mM boric acid, 1mM EDTA) containing 2.5μg/ml
ethidium bromide, and subsequent scanning of the gel using a Gel Doc (Syngene G-box) image
capture system. Table 2 contains the primer sequences and PCR parameters used in order to
genotype TCP mutants.
Primer pairs were designed for housekeeping genes and TCP gene sequences in addition to
T-DNA sequences (Table 2). These primers pairs were used to perform PCR on DNA from
putative mutants. Two primer pairs per TCP locus were tested in order to confirm whether a
plant was mutant for that particular gene; a primer pair using both forward and backward
primers to the gene of interest (gene specific primers also referred to as GSP‟s), and a primer
pair using one of the primers from the GSP‟s along with the primer complementary to the T-
DNA sequence of interest. If samples failed to amplify with the TCP GSP‟s and amplified with
the GSP/T-DNA specific primer pair, then a plant was designated as mutant for that particular
TCP gene.
Table 2. Primer pairs used to genotype TCP8, TCP14, and TCP15 T-DNA mutants.
Primer Name Primer Sequence (5‟-3‟) Predicted
Amplicon
size (bp)
PCR
parameters
control primers ACT7forward ACT7backward
TGGTGAGGATATTCAGCCACTTGTC TGTGAGATCCCGACCCGCAAGATCA
gDNA=762* cDNA=562*
30s Annealing@54oC 1min extension @ 72oC
control primers SMCRTPCR forward SMCRTPCR backward
GATACATGCAAAGATGAAGGAATG TATCATTCTTCCTATGATTCTGTGTGTG
gDNA=1500* cDNA=762*
30s Annealing@54oC 1.5min extension @ 72oC
TCP14 GSP’s TCP14baitforward TCP14preybackward
CACGAATTCATGCAAAAGCCAACATCAAGTATCTTAAATGTC GTCTCGAGGTGTGTCTAATCTTGCTGATCCTCCTCATCAC
1475
30s Annealing@54oC 1.5min extension @ 72oC
TCP14 T-DNA primers Gabi Kat T-DNA primer TCP14 GSP
CCCATTTGGACGTGAATGTAGACAC AAATGAGAAGGAAGAGACATGGAA
757
30s Annealing @55 oC 1min

57
extension @ 72oC
TCP15 GSP’s At1g69690 5’forward BOB3’genotyping backward
ATCCGGATCCGGATCATAACCATC GGACTCTGACTCGTAGGTAAAGATCC
600
30s Annealing @54 oC 1min extension @ 72oC
TCP15 T-DNA primers Salk LbA primer BOB3’genotyping backward
TGGTTCACGTAGTGGGCCATCG GGACTCTGACTCGTAGGTAAAGATCC
700
30s Annealing @54 oC 1min extension @ 72oC
TCP8 GSP’s At1g58100 5’ forward At1g58100 3’ backward
AATGGATCTCTCCGACATCCGAAAC AAGTGTTCCCAGCACCAGACCTACT
770
30s Annealing @51 oC 1min extension @ 72oC
TCP8 T-DNA primers At1g58100 3’ backward Riken DS3-4 primer
AAGTGTTCCCAGCACCAGACCTACT CCGTCCCGCAAGTTAAATATG
440
30s Annealing @55 oC 45s extension @ 72oC
*Housekeeping gene primers were designed to span an intron, thus amplicon size is given for both
amplification of genomic DNA (gDNA), and complementary DNA (cDNA).
2.6 RNA Work
2.6.1 Total RNA Isolation
Approximately 200-400mg of the desired plant tissue (roots, rosette/cauline leaves, stem,
inflorescences) was dissected from the plant and flash frozen in liquid nitrogen. This tissue was
transferred to an autoclaved, pre-cooled ceramic mortar and pestle (Corning) containing
autoclaved sand to aid in tissue masceration. The tissue was ground under liquid nitrogen
several times until a fine powder was achieved. The ground tissue was then promptly
transferred to an autoclaved pre-cooled 1.5mL microcentrifuge tube. This tube was placed on
ice for 30 seconds to allow for liquid nitrogen to evaporate from the sample before proceeding.
RNA was isolated from the tissue using Trizol Reagent (GIBCO, New York), according to the
manufacturer‟s protocol, with the following modifications. The RNA pellet was air dried in a
fume hood for 5-15 minutes depending on pellet size, then resuspended in 20µL of autoclaved

58
distilled water. The sample was flash frozen in liquid nitrogen and stored in a -70oC freezer
until further use.
2.6.2 DNase Treatment of RNA and Reverse Transcription
Frozen RNA was thawed on ice. DNase1 treatment was conducted using the DNase1 kit
(Invitrogen). Reverse transcription was conducted on 1-2µg of DNased RNA using the
Superscript III Reverse transcription Kit (Invitrogen) according to the manufacturer‟s protocol.
cDNA was stored at -20oC until further use in PCR.
2.6.3 Quantitative (Real-time) reverse transcription PCR
This procedure was performed according to the protocol suggested by BioRad. Briefly, primers
were designed using the Primer3 program (http://frodo.wi.mit.edu/cgi-
bin/primer3/primer3_www.cgi) according to BioRad specifications, such that the melting
temperature (Tm) of the primers is between 50-65oC, the target amplicon size is short (between
75-200 nucleotides long), and that the GC content be about 50%. A serial dilution series was
made (no template control, 1X, 10x dilution, 100x dilution, 1000x dilution, 10 000x dilution
and 100 000x dilution), to generate a six point standard curve from the melt curve data
according to BioRad specifications. From this data, PCR efficiency was calculated. Primer sets
which yielded PCR efficiencies between 95-100% were used for real-time PCR on
experimental samples. Table 3 lists the details for the primer sets used.
Table 3. Primer pairs used to perform quantitative RT-PCR and the program parameters.
Primer Name Primer Sequence (5‟-3‟) Predicted
Amplicon
size (bp)
PCR parameters (oC)
(At3G15540)
qrtIAA19forward
qrtIAA19backward
GTGAAAGTGAGCATGGATGG
ACCCATCTTTCAAGGCCACAC
gDNA=727
cDNA=135
20 s Annealing @55 oC 20s extension @ 72oC
qrtTCP15forward
qrtTCP15backward
AGCCTCCTCCTAAACGAACC
GAGCTGAAAGACACGTGCAG
gDNA=107
cDNA=107
20 s Annealing @55 oC 20s extension @ 72oC
qrtTCP14forward
qrtTCP14backward
TATTCTCTCCGGCTTGAACC
CTTGCTGATCCTCCTCATCAC
gDNA=95
cDNA=95
20 s Annealing @55 oC 20s extension @ 72oC
qrtACT2forward
qrtACT2backward
GCTCCGTATTGCTCCTGAAG
CACCATCACCAGAGTCCAAC
gDNA=292
cDNA=197
20 s Annealing @55 oC 20s extension @ 72oC
qrtRUBPforward
qrtRUBPbackward
CCACTATGGTCGCTCCTTTC
TTCGGAATCGGTAAGGTCAG
cDNA=188
20 s Annealing @55 oC 20s extension @ 72oC

59
The volume for each qPCR reaction was 25µL. The BIO-RAD iQ TM SYBR Green Supermix
kit was used. Reaction components were assembled as follows. 12.5µL of iQ SYBR Green
Supermix, 0.5µL each of 10mM forward and backward primers, 11µL of sterile water, and
0.5µL of DNA template at a concentration of 0.5-1ng/µL For each experimental condition,
biological duplicates were generated, and technical triplicates for each biological condition. The
parameters of the program were as follows: Step 1: denaturation at 94oC for 1min step 2:
Annealing (temp between 55-65oC based on Tm of primers) for 20s Step3: Plate read (optical
density reading taken by the thermal cycler) Step 4: Incubation at 72oC for 1min Step 5: loop to
step 1 39 more times Step 6: melting curve from annealing temperature to 90oC, plate reading
taken every 1oC, hold for 10s.
2.7 Histology
2.7.1 Vibratome sectioning and confocal microscopy
Fresh unfixed stem tissue was quickly trimmed and embedded in 4% Phytagar (Sigma) using
rubber moulds. Moulds were placed in the freezer for 10-15 minutes prior to sectioning for ease
to sectioning and to produce better sections. Blocks were affixed to the vibratome (Leica
VT1000S) base using Motormaster brand super glue (Motormaster Brand, Canada). Glue was
allowed to set for 5min at room temperature and then agar blocks were covered with water and
sectioned with a razor blade (Gillette). The vibratome speed and frequency were both set to 8.
Section width ranged between 20-80µm. Sections were transferred to slides using a paint brush,
and mounted in 50% glycerol.
For fluorescent imaging of WG335 expression, sections were immediately visualized using a
confocal microscope with an argon laser set to excitation at 488nm, and a band pass filter
between 500 and 520nm. The pinhole aperture was set to 1 airy unit, detector gain for the GFP
path was set to 1000 and for the red path (autofluorescence of chlorophyll) was set to 700.
2.7.2 Histochemical GUS assays
The procedure for histochemical GUS assays was modified from Jefferson et al. (1987). The
desired tissue was dissected from the plant and placed directly in 1mL of the GUS staining
solution (made of 800µL of GUS staining buffer: [100mM Phosphate buffer pH 7.0, 0.5mM
K3Fe3(CN)6, 0.5mM K4Fe2(CN)6, 10mM EDTA, 0.1% Triton X-100], 200µL of methanol, and
12µL of 50mg/mL X-gluc [5-bromo-4-chloro-3-indolyl-β-D-glucuronic acid

60
cyclohexylammonium salt] dissolved in dimethylformamide]. Samples were incubated in a
37oC water bath overnight. To stop the reaction, the sample was washed several times with 70%
ethanol, followed by several washes in 100% ethanol. The sample was then incubated in a
saturated chloral hydrate solution of 26.7g Chloral hydrate (Sigma), 1mL glycerol (Bioshop),
and 9mL deionized water according to Carland et al. 1999 to render the sample transparent.
Images were captured using a Zeiss Axiophot microscope with a digital imaging system, or a
Nikon SMZ1500 stereomicroscope with a digital imaging system (Nikon Digital Signal).
2.7.3 Scanning electron microscopy (SEM)
Tissue was fixed in FAA (0.5ml glacial acetic acid, 1ml 37% formaldehyde, 5ml 100% ethanol
and 3.5ml de-ionized water) overnight at 4˚C, washed twice for 30min in 70% ethanol and
passed through a graded alcohol series of 85%, 95% and two 100% ethanol solutions for 30min
each. Dehydrated tissue was washed three times with 100% acetone for 10min each. Tissue was
transferred in acetone to a CO2 critical point dryer (Polaron E3000) and dried for 2h. Dried
tissue was mounted on double-sided tape on 0.5” aluminum studs, gold coated in a Polaron
E5000C sputter coater and viewed with a Hitachi S-2500 scanning electron microscope at 20 or
25kV.
2.8 WG335 GFP line
2.8.1 Identification of WG335 and GFP imaging
A GFP-based Arabidopsis enhancer trap insertion collection established by J. Haseloff
(http://www.plantsci.cam.ac.uk/Haseloff/) was previously screened for nodal/pedicel expression
patterns (Douglas and Riggs, 2005). Transgenic seeds of the WG335 enhancer trap line were
grown and selected on MS media containing 25μg/ml kanamycin and resistant individuals
transplanted to soil. GFP expression patterns were examined using a Leica MZ75 dissecting
microscope and Curtis ebq 100 isolated fluorescent lamp.
2.9 Leaf impressions for trichome, stomatal and epidermal cell density
quantitation
Leaves were selected (rosette leaf 1 samples were >24dpg and cauline leaves were chosen from
six week old plants) and dissected from plants and placed on a solid media plate with a ruler
and photographed using a Leica MZ75 steromicroscope. These pictures were later used to
calculate leaf area and perimeter using the ImageJ software (ImageJ at NIH url:

61
http://rsb.info.nih.gov/ij/). The nail polish leaf impression protocol was kindly provided by Dr.
Nancy Dengler, University of Toronto. The leaves were coated with layer of clear nail polish
(Rimmel 60s vinyl shine #581 clear, Maybelline Express finish advanced wear #10 base & top
coat) and allowed to dry for 15 minutes. The leaf was transferred to a glass slide and the dried
impression was carefully peeled off using a pair of watchmaker needle-nosed forceps. The leaf
impression was coverslipped (VWR) and the edges were sealed with Scotch Magic tape (3M) to
prevent sample drying. The impression was then viewed on a Zeiss axiophot microscope and
cells were counted using Northern Eclipse software. Stomatal, epidermal, and trichome
densities were calculated by counting the number of stomata/epidermal/trichome cells in one
field of view (at 10x magnification) and dividing this number by the area of the field of view.
The density for each cell type was calculated in four different regions of the leaf impression and
averaged. A minimum of 25 individual leaves per genotype and per nodal position were used.
Stomatal Index (SI) was calculated according to (Dyer, 2001; Schoch et al. 1980; Ceulemans et
al. 1995) using the formula:
SI = Stomatal density X 100
Stomatal density + epidermal cell density
Similarly, the trichome index (TI) was defined as:
TI = trichome density X 100
trichome density + epidermal cell density
2.10 Vascular pattern characterization (MATLAB)
2.10.1 Rosette leaf one studies
Wild-type Columbia, tcp15, wild-type Nossen, and tcp8 plants were propagated on soil after
seed sterilization and stratification under 16/8 hour light dark conditions. After 15 days, rosette
leaf one from 15 individual plants per genotype was dissected from the plants and placed in a
saturated chloral hydrate solution to render the tissue transparent. Cleared tissue was imaged
using a Zeiss axiophot microscope under darkfield illumination (at 2.5x magnification). The
leaf shape was traced using a tablet and stylus (Wacom). Using programs written by Dr. Anne
Gaelle Rolland-Lagan (University of Ottawa) for the Matlab Software (The Mathworks Inc.,
http://www.mathworks.com versions R2208a, R2009a) from each leaf outline the area,
perimeter, length and width were calculated for the leaf petiole, the leaf blade, and the entire

62
leaf. The mid/centre point of the leaf blade was recorded, as well as the outline and leaf
orientation. Leaf vasculature was then digitized using a tablet and stylus. A matrix was
generated that recorded all the points comprising each digitally traced vein segment for each
leaf using the Digitize Veins V4 program written by Dr. Anne Gaelle Rolland-Lagan
(University of Ottawa) for use in the Matlab (R2008a, R2009a) software. Within this matrix,
the coordinates for the points comprising each vein segment were stored, thus allowing
reconstruction of the topology of the vein network in each leaf. From this matrix, the position of
all veins was recorded, enabling me to determine to number and position of vein
junctions/branch points (defined as the occurring when one vein segment intersects another vein
segment), and the number and position of freely ending veins (defined as a vein that freely
terminates within the leaf blade and does not intersect another vein). Similarly, number and
position of freely ending veins and vein branch points was stored within a matrix. This allowed
for identification of loop position, size (area, length and width), shape and orientation along the
proximo-distal axis of the leaf blade. From vein branch point, freely ending vein and the vein
loop information, spatial maps were generated to illustrate heterogeneities across the leaf blade.
To do this mean leaf pattern information was generated for leaves of each genotype. The
average leaf shape per genotype was calculated, and all leaf shapes and vein patterns were
warped to that of the average shape. Accordingly, vein segments and loops were reassigned
new positions and spatial information was extracted from warped data to generate maps
detailing spatial distribution of free vein endings and branch points. The warped data allowed
calculation of mean loop shape, size, and subdivision size as a function of leaf position
displayed on contour maps. Loops were also classified relative to subdivision level. This was
determined by the presence of freely ending vein segments within the loop (subdivided) or not
(non-subdivided). A sectored grid dividing up the warped mutant and wild type leaf blades
was generated. The grid sectors were grouped into regions and Excel spreadsheets were
generated parsing vein density and free vein density for each leaf into the appropriate number
of groups. These spreadsheets were then opened in the statistical software program SPSS and a
Kruskal-Wallis one-way analysis of variance (ANOVA) was performed to determine if
differences in free vein and vein density existed between these regions in the leaf blade.
2.10.2 Cauline leaf studies
A detailed study of cauline leaf development was undertaken of leaves at node positions one-
three in wild-type Nossen and tcp8 plants. Plants were propagated as mentioned above and
63
carefully monitored for time to bolting. The day when plants showed bolting was labelled day
zero and cauline leaves from nodes one to three were harvested from the plant (this was done
for day zero time point tissue, for later stage tissue, plants labelled at day zero had tissue
harvested the following day for day one time point tissue, and harvested two days later for day
two time point tissue), and stored in saturated chloral hydrate to clear the tissue. Sample size
was 15 leaves per node per day per genotype. Tissue was processed and analyzed as mentioned
above for rosette leaf one tissue, however leaf warping was not performed due to variation in
size and serration number in the leaf samples. Thus, freely ending vein density, vein density and
loop parameters were not calculated as a function of position across the leaf blade. Tissue
imaging was performed using a Nikon SMZ1500 stereomicroscope with a digital imaging
system and a Zeiss axiophot microscope under darkfield illumination.
2. 11 Statistical Analyses
For all morphometrics and quantitative assays, statistical analysis was performed. Graphs were
made in Microsoft Excel or SPSS, and Student‟s T-Test or non-parametric analysis of variance
(ANOVA) tests (specifically Mann-Whitney U test and Kruskall-Wallis test for variance) were
performed. The threshold for significance was p < 0.05. Error bars on graphs reflect standard
deviation for Excel-based graphs, and +/- 2 SEM for SPSS derived graphs.

64
3.0 Results Part 1: Examination of TCP15 and TCP14 function
3.1 Identification of the role of the TCP family gene At1g69690 (TCP15)
To identify genes which might play roles in meristem function and plant architecture an enhancer
trap library screen was performed in order to identify candidate lines exhibiting a nodal signature.
One such line, named WG335 (Columbia ecotype) was recovered (Douglas and Riggs, 2005; Figure
9). This enhancer trap displays expression at vegetative nodes and within the pedicels (Figure 9a).
Mapping revealed that the location of the WG335 line is upstream of the At1g69690 gene on
chromosome one (Douglas and Riggs, personal communication; Figure 9b). This gene has been
annotated to belong to the TCP gene family and has been given the designator AtTCP15 (Cubas et
al. 1999) and will henceforth be called TCP15.
Figure 9. The expression pattern of the enhancer trap line WG335. Node and pedicel specific GFP expression of WG335(A). The genetic map of the region of chromosome one to which the insertion of WG335 was mapped (B). (Panel A courtesy of Douglas and Riggs, 2005)
TCP genes are found in both monocot and dicot plants. There are multiple gene members within
individual plant species. This is thought to be the result of large scale genome duplication before the
evolutionary split of monocotyledonous and dicotyledonous plants (Yao et al. 2007). To examine
the evolutionary relationship of Arabidopsis TCP proteins to family members in other species, a
phylogenetic analysis was conducted using the PHYLIP DRAW tree program
(http://bioweb2.pasteur.fr/docs/phylip/phylip.html, http://mobyle.pasteur.fr/cgi-
bin/portal.py?form=bionj) (Figure 10).

65
The TCP family is divided into two subfamilies (Cubas et al. 1999) one of which is more similar
to the CYC/TB1 founding members (the class II TCP subfamily). Five TCP genes are regulated by
the microRNA MIR319/JAW and control leaf curvature (Nath et al. 1999 Palatnik et al. 2003; Figure
10). TCP proteins that have been shown to be nuclear localized are denoted by an asterisk next to
the TCP identifier.
The other TCP subfamily is made up of members which are more similar in sequence to the
PCF1/2 proteins. This has been classified as the TCP Class I subfamily (Cubas et al. 1999,
Aggarwal et al. 2010). The brown box illustrates the TCP Class I subfamily members. TCP15
belongs to this sub-family. The TCP15 single mutant was isolated from the Salk line T-DNA
mutants obtained from ARBC (Table 1; Figures 13 and 14). Segregation analysis confirmed the
presence of a single insertion within this line. The null mutant manifested no visible phenotype
presumably due to functional redundancy, however Kieffer et al (2011) have recently reported
decreased inflorescence height and decreased pedicel length in tcp15 and tcp14 tcp15 plants. Thus
two closely related TCP genes were selected for further study and to generate higher order mutants
that may reveal a phenotype previously masked by redundancy within this gene family. TCP14 was
selected as it is the TCP gene most closely related to TCP15 within Arabidopsis. Due to the lack of
availability of mutant lines for the more closely related genes TCP7 and TCP21 at the time of this
study, TCP8 was selected as the second closest relative.

66
0.225At5g60970
0.217At5g08070
0.122
0.362At3g02150
0.025
0.299At4g18390
0.300At1g30210
0.067
0.016
0.193At1g53230
0.178At3g15030
0.098
0.284cincinnati
0.057
0.342At2g31070
0.053
0.029
0.353At1g67260
0.328cycloidea
0.028
0.389At1g68800
0.017
0.384At3g18550
0.009
0.370teosinte branched
0.037
0.046
0.333At3g45150
0.025
0.277At3g27010
0.303At5g41030
0.085
0.014
0.323At2g37000
0.300At2g45680
0.300At5g51910
0.047
0.017
0.004
0.273At1g35560
0.272At1g72010
0.057
0.312At1g58100
0.011
0.190At5g08330
0.183At5g23280
0.130
0.010
0.335rice PCF3
0.009
0.287rice PCF1
0.336rice PCF2
0.022
0.010
0.254At3g47620
0.235cotton AiHLH
0.223TCP-cupuliformis
0.038
0.046
0.292At1g69690
0.042
Figure 10. The TCP family dendrogram. Text in green highlights the founding members of this gene family.
Members within the brown box belong to the PCF1/2 subfamily, whereas members residing outside the box
belong to the CYC/TB1 subfamily. The TCP genes examined in this study are highlighted in blue, yellow and
purple text. Asterisks denote gene products confirmed to show nuclear localization.
A search of online sequence databases using the BLAST
(http://blast.ncbi.nlm.nih.gov/Blast.cgi) tool revealed TCP15 to be highly similar to an expressed
sequence tag in cotton predicted to encode an auxin-inducible basic helix-loop-helix transcription
factor. TCP15 is also highly similar the Antirrhinum gene TCP INTERACTING WITH
TCP INTERACTING WITH CUPULIFORMIS
TCP5
TCP17
TCP13
TCP2
TCP24
TCP3
TCP4
TCP12/BRC2* TCP18/BRC1*
TCP16
TCP20
TCP6
TCP9
TCP11
TCP19
TCP23
TCP22
TCP8*
TCP21*
TCP7
TCP14
TCP15
PCF 1 & 2
TB1
CYC
TCP15
TCP14
TCP8
TCP10*
TCP1

67
CUPULIFORMIS (TIC) (Weir et al. 2003). TIC has been demonstrated to be important in regulating
lateral organ boundaries by interaction with the NAC family gene CUPULIFORMIS (Weir et al.
2003). Thus it seemed plausible that TCP15 may be acting in a similar manner. Examination of
online bioinformatics expression databases revealed that TCP15 is strongly expressed within
vegetative nodes and pedicels, as reported by gene expression using the EFP browser (Winter et al.
2007; http://bar.utoronto.ca/efp; Figure 11).
Figure 11. TCP15 expression as shown by the eFP browser (Courtesy of Winter et al, 2007). Relative
expression for various tissue types and developmental stages is illustrated by different colours which
correspond to the heat map legend shown in bottom left hand corner.
The TCP domain is a conserved sequence shared among all TCP family members. It encodes
a basic helix-loop-helix motif that is responsible for nuclear localization of TCP proteins and
exhibits DNA binding ability (Cubas et al. 1999). TCP14 and TCP8 were chosen for subsequent
study due to high sequence similarity to TCP15 (Figure 10). A multiple sequence alignment for
the protein sequences of TCP15, TCP8 and TCP14 was constructed using new TCP domain
sequence information (Aggarwal et al. 2010; Figure 12), the Phyllip T-coffee program
(http://tcoffee.vital-it.ch/cgi-bin/Tcoffee/tcoffee_cgi/index.cgi) and information from the TAIR
(www.arabidopsis.org) and Prosite (http://www.expasy.ch/prosite/ ) websites. Domain identity
is based on a stretch of 80 residues that encode the basic helix loop helix motif shared by all
TCP family members. Areas highlighted in yellow show the conserved TCP domain based on
predicted sequence information from Cubas et al. 1999, and the TAIR and Prosite websites.

68
Areas highlighted in purple show conserved residues shared by all three TCP family members
that lie outside the TCP domain. Residues highlighted in turquoise show regions of the proteins
conserved between two of the featured TCP family members.
The denoted TCP domain within this multiple sequence alignment (blue arrow) differs from
the previously characterized TCP domain (Cubas et al. 1999), which is predicted to be 58 amino
acids long, starting with a conserved N-terminal K residue and ending with a variable residue at
the C-terminus (A for class I subfamily members, C for class II subfamily members). More
recent TCP domain sequence analysis (Aggarwal et al. 2010) has predicted this sequence length
to vary based on subfamily type. This is because of varying lengths of TCP proteins belonging
to the two subfamilies. The TCP domain for class I sub-family members is predicted to be 62
amino acids long. This modification to the TCP domain have been noted in the figure, and
delimited by the blue arrow. The conserved N-terminal and C-terminal residues are identical to
that predicted by earlier analyses (Cubas et al. 1999). The multiple sequence analysis of TCP8,
TCP14 and TCP15 was performed in order to identify novel conserved motifs present in all 3
proteins that lie outside the TCP domain. Identification of these sites may prove useful by
analysis of secondary structures formed by these residues and allow prediction and testing of
putative protein function.
The genetic maps for the TCP15 (A), TCP8 (B) and TCP14 (C) genes were generated using
sequence information from the TAIR website (http://www.arabidopsis.org; Figure 13), the Salk
institute (http://signal.salk.edu/cgi-bin/tdnaexpress), the Riken institute
(http://rarge.psc.riken.jp/), the GABI-Kat Centre (http://www.gabi-kat.de/) and NCBI-BLAST
(http://blast.ncbi.nlm.nih.gov/Blast.cgi), in addition to genotyping data generated. One key
feature that is apparent for all three genes is the lack of introns. The location of the T-DNA
insertion is listed along with gene length and positions of the start and stop codons, and the
chromosome number upon which each gene resides (listed as “Ch #” in the figure). In addition,
the map for TCP15 illustrates the location of the enhancer trap insertion WG335. For TCP15,
the T-DNA insertion line Salk 011491 is within the 5‟untranslated region, whereas in the other
two TCP genes, the T-DNA insertion falls within the protein coding region of the genes. The
TCP8 T-DNA line Riken 15-4779-1 has its insertion within the TCP domain. The TCP14 T-
DNA line Gabi-Kat 611CO4 has its insertion upstream of the TCP domain.

71 TCP15 MDPDP--D-- ---------- ---------- --HNHRPNFP LQLLDSS--- -------TSS SSTSLA---- ---------- II--------
TCP8 MDLSD--IRN NNNDTAAVAT GGGARQ---- L-----VDAS LSIVPRS--- -------TPP EDSTLA---- ---------- ----------
TCP14 MQKPTSSILN VIMDGGDSVG GGGGDDHHRH LHHHHRPTFP FQLLGKHDPD DNHQQQPSPS SSSSLFSLHQ HQQLSQSQPQ SQSQKSQPQT
TCP15
------STTS EPN-SEPKKP PPKRTSTKDR HTKVEGRGRR IRMPAMCAAR VFQLTRELGH KSDGETIEWL LQQAEPAVIA ATGTGTIPAN
TCP8
---------- TT--SSTATA TTTKRSTKDR HTKVDGRGRR IRMPALCAAR VFQLTRELGH KSDGETIEWL LQQAEPAIVA ATGTGTIPAN
TCP14
TQKELLQTQE ESAVVAAKKP PLKRASTKDR HTKVDGRGRR IRMPALCAAR VFQLTRELGH KSDGETIEWL LQQAEPSVIA ATGTGTIPAN
TCP15 FTSLNISLRS SRSSLSAA-H LRTTPSSY-- ---------- ---------- -YFHSPH--- ---------- ---------- QSMTHHLQ--
TCP8 FSTLSVSLRS SGSTLSAP-P SKSVPLYG-- ----ALGLTH HQYDEQGGGG VFAAH----- ---------- ------TSPL LGFHHQLQHH
TCP14 FTSLNISLRS SGSSMSLPSH FRSAASTFSP NNIFSPAMLQ QQQQQQRGGG VGFHHPHLQG RAPTSSLFPG IDNFTPTTSF LNFHNPTKQE
TCP15 ---HQHQ--V RP--KNE--- --SHSSSSS- -SSQLLDHNQ MGNYLV-QST -AGSLPTSQS PATAP----- ---FWS---- ----------
TCP8 QNQNQNQDPV ETIPEGENFS RKRYRSVDLS K--ENDDRKQ NENKSLKESE TSGPTAAPMW AVAPPSRSGA GNTFWMLPVP TTAGNQMESS
TCP14 GDQDSEE--L NS--EKK--- RRIQTTSDLH QQQQQHQHDQ IGGYTL-QSS NSGSTATAAA AQQIP----- -GNFWMVAAA AAAGGG---G
TCP15 ---------- ------SGDN TQNLWAFN-I NPHHSGVVAG DVYNPNSGGS GG---GSGVH LM---NFAAP IALFSGQP-L AS--------
TCP8 SNNNTAA--- -------GHR APPMWPF--V NSA------- ------GGGA GG-GGGAATH FMAGTGFSFP MDQYRGSP-L QL--------
TCP14 GNNNQTGGLM TASIGTGGGG GEPVWTFPSI NTAAAALYRS -----GVSGV PSGAVSSGLH FM---NFAAP MAFLTGQQQL ATTSNHEINE
TCP15 ----GYG--- ----GGGGGG GEHSHYGVLA ALNAAYRPVA ---------E T-GNHNNNQQ NRDGDHHHN- ---------- --HQE-----
TCP8 ----GSFLAQ PQPTQNLGLS MPDSNLGMLA ALNSAYSRGG NANANAEQAN NAVEHQEKQQ --QSDHDDD- ---------- --SRE-----
TCP14 DSNNNEG--- ----GRSDGG GDHH------ ---------- ---------N T-QRHHHHQQ --QHHHNILS GLNQYGRQVS GDSQASGSLG
TCP15 --DGSTSHHS
TCP8 --EN-SNSSE
TCP14 GGD-EEDQQD
Figure 12. Multiple sequence alignment for the protein sequences of TCP15, TCP8 and TCP14.
Yellow represents the conserved residues that make up the TCP domain (according to TAIR and Prosite)
Purple represents conserved residues in all 3 TCP protein sequences found outside the TCP domain
Turquoise represents other conserved residues found in two of the 3 TCP protein sequences
represents the modified classification of the TCP domain according to Aggarwal et al, 2010
69

70
Figure 13. The genetic maps of TCP15 (A), TCP8 (B) and TCP14 (C). Panels A-C illustrate the coding region of the three TCP genes (denoted as CDS), as well as the locations of the TCP domain and the T-DNA insertions.
TCP15: At1g69690
ATG TAG
CDS 978nt
gDNA 1628nt
(1) (226) (1628) (1203) (382) (544)
(-1840)
Salk 011491 T-
DNA insertion (100)
5’
(a)
Ch.1
TCP8: At1g58100
ATG TGA
CDS 1206nt
gDNA 1630nt
(1) (129) (1630) (1334) (409) (571)
TCP DOMAIN
Riken 15-4779-1
T-DNA insertion (557)
3’
(b)
Ch.1
TCP14: At3g47620
ATG TAG
CDS 1470nt
gDNA 1575nt
(1) (106) (1919) (1575) (357) (619)
TCP DOMAIN
Gabi-Kat 611CO4 T-
DNA insertion (182)
3’
Ch.3
WG335::GFP
TCP DOMAIN

71
3.2 Characterization of the tcp15 and tcp14 mutants
Based on sequence similarity to TIC, it was hypothesized that TCP14 may function in
regulation of boundary formation (Weir et al. 2003), therefore tcp15 mutants may exhibit
defects in boundary formation that may manifest in abnormalities in pedicel and node
development (locations in which TCP15 was first found to be expressed using the WG335
enhancer trap line. A homozygous null mutant in the Salk T-DNA insertion line 01149 was
identified (Figures 13 and 15), however no phenotype was associated with the null mutant
(Figure 14). Since the TCP family in Arabidopsis contains 24 members, it was reasoned that
redundancy may be masking the function of this gene. The most closely related family member
in Arabidopsis is At3g47620/TCP14 (Figures 10 and 13). A T-DNA mutant line (GABI-KAT
line 611C04) for this gene was obtained from the GABI-Kat institute (Figure 13) and shows no
phenotype (Figure 14). A double mutant was generated for both of these genes (Appendix 2), as
well as with a third TCP family gene, TCP8 (Riken T-DNA line 15-4779-1), however no
phenotype was detected (Appendix 3 Figure 15).
Figure 14. Overall plant morphology of wild type, tcp15 and tcp14 plants. Plants were 50 days old at time of image capture.
A triple mutant was generated with the highly similar TCP family member TCP8 (Appendix
3). The triple mutant appeared shorter than Columbia or the pair-wise double mutants,
however this difference in height was not quantitatively assessed (Figure 15).
Columbia tcp15 tcp14

72
Figure 15. Overall plant morphology of TCP double and triple mutants. Plants were 50 days old at time of image capture.
RT-PCR was performed on TCP15 and TCP8 single mutant cDNA using ACTIN7, TCP8 GSP
primers and TCP15 GSP primers sets in order to confirm that these mutants are transcript nulls
(Figure 16). tcp8 cDNA failed to amplify when PCR was conducted with TCP8 gene specific
primers (Figure 19, white dot in Panel B). tcp15 cDNA also failed to amplify when PCR was
conducted with TCP15 gene specific primers (Figure 19, white dot in Panel C). Thus, these
results suggest that the tcp8 and tcp15 plants chosen for study are transcript null.
Figure 16. TCP15 and TCP8 single mutants are transcript null. Panel A shows PCR results using the control primers for the ACTIN7 gene as a housekeeping reference gene. Panel B shows the PCR results using the TCP8 GSP primers. Panel C shows the PCR results using the TCP15 GSP primers. White dots indicating that the null mutant cDNA did not amplify with the primers for the gene in which it contains a T-DNA insertion. White bar over samples in panel A indicates all cDNA samples amplified with the control primers. Lanes labelled “col” and “DR5” reflect samples in which genomic DNA from wild type (Columbia ecotype) or DR5::GUS transgenic plants (Columbia background) was used for PCR. The “-“ lane reflects a no template control, “-RT” reflects the negative control from cDNA synthesis used as template, “col RT” and “nRT” are cDNA templates synthesized from Columbia and Nossen RNA, respectively, “15RT” and “8RT” are cDNA templates synthesized from tcp15 and tcp8 RNA, respectively.
Columbia tcp14/15 tcp8/15 tcp8/14 tcp8/14/15
ACTIN TCP8
TCP15

73
3.3 The use of the enhancer trap line WG335 as a tool for TCP15 expression
The proximity and location of the insertion in the WG335 enhancer trap line to TCP15
suggested that the expression of the GFP in this insertion line may reflect TCP15 expression. A
1.5 Kbp promoter::reporter fusion of TCP15 using β-glucuronidase was previously constructed
(S. Douglas, unpublished results) and found to have an expression pattern consistent with that of
the WG335 line (Figure 17). Both the WG335 line and the TCP15::GUS reporter line show
expression in the emerging true leaves (A-C), and in the leaf vasculature (D-E). To further
reinforce the reporter expression patterns, semi-quantitative reverse transcription PCR was
employed to determine tissue specific expression patterns of TCP15 (Figure 17f,g). RT-PCR
results confirmed TCP15 expression in the tissues in which GFP was detected in the WG335
line (Figure 17). From the RT-PCR results, it was observed that TCP15 mRNA was present in
all tissues examined. This pattern generally tracks expression as gauged by reported gene
expression using the EFP browser (Winter et al. 2007; http://bar.utoronto.ca/efp; Figure 11).
Figure 17. TCP15 reporter gene expression mirrors GFP expression by the enhancer trap line WG335. TCP15::GUS reporter gene expression is seen in panels A and D. Insets in panels A and D shows no GUS staining of wild type (control) plants. GFP expression in WG335 is seen in panels B, C and E. Inset in panel B shows no GFP fluorescence of wild type (control) plants. (F) RT-PCR results with TCP15 and the control ACTIN7 (G). Root tissue (lane 1), cauline leaves (lane 2), rosette leaves (lane 3), stem tissue (lane 4), seedling tissue (lane 5), inflorescence tissue (lane 6), and silique tissue (lane 7).
1 2 3 4 5 6 7
1 2 3 4 5 6 7
D

74
The other gene whose expression WG335 may plausibly track is located about 8.5kbp
upstream of the WG335 line insertion. This gene has the AGI identifier At1g69680. Gene
annotation information from the TAIR website and BLAST analysis suggested that this gene
encodes a photosystem II reaction center PsbP family protein. According to the eFP browser
gene expression pattern (Winter et al. 2007; http://bar.utoronto.ca/efp; Figure 18), overall gene
expression of At1g69680 is lower than that of TCP15. A comparison of expression levels in
three specific tissue types between these two genes suggests that WG335 expression patterns
reflect that of TCP15 and not At1g69680. Firstly, cotyledon expression is much lower in
TCP15 compared to At1g69680. The WG335 line shows very little transient expression in this
tissue. Secondly, the expression of TCP15 within 1st node tissue is greater than that for
At1g69680. Lastly, TCP15 expression in flower pedicels is almost 4-fold higher than that of
At1g69680 expression in comparable tissue. Expression data from other publicly available
microarray data sets supports strong TCP15 expression in pedicels
(https://www.genevestigator.com/gv/user/serveApplet.jsp). Vegetative nodes and pedicel tissue
(as mentioned earlier) are two locations of strong expression in WG335 line plants. Thus, taken
with reporter gene expression, RT-PCR results, and careful observations of WG335 line
expression throughout development (figures 19-20) WG335 appears to track TCP15 expression
and not that of At1g69680.
At1g69680 TCP15 A B

75
Although T-DNA mutations in TCP15 did not manifest any phenotype (Figure 14), it was
reasoned that the examination of spatio-temporal expression of this gene may reveal possible
developmental paths in which TCP15 could function. The WG335 line was used to track
expression of TCP15 throughout plant development (Figure 19). Intense GFP fluorescence was
observed in the primary and emerging lateral roots of young seedlings (data not shown).
Expression was apparent in young seedlings, at the tips of the first true leaf pair primordia
(Figure 19, panel 1 arrows). Transient expression was observed in epidermal cells on the adaxial
surface of the cotyledons (Figure 19, panel 1). As the first true leaf emerged, expression
extended in a basipetal fashion from the leaf tip to the petiole down the leaf midrib (Figure 19,
panel 2). Expression was observed in a punctuate fashion at the leaf margin (figure 19, panels
10-11).
As rosette leaves expanded, expression was detected in the stipules (Figure 19, panel 9
arrows), hydathodes (Figure 19, panel 3, arrow), base of trichomes (Figure 19, panel 8 arrow,
Figure 20, panels 3, 4 arrows showing GFP in trichome support cells) and the leaf vasculature,
marking primary (Figure 19, panel 7 arrow), secondary (Figure 19, panel 7 arrowhead), tertiary
(Figure 19, panel 7 swirly arrow), and quaternary veins. This pattern of expression in leaves was
reflected in all rosette leaves, as well as in cauline leaves (Figure 19, panels 4, 5, 7 and 14).
Figure 18. A comparison of At1g69680 and TCP15 (At1g69690) gene expression using the eFP browser tool. (A) Heat map expression of At1g69680. (B) Heat map expression of TCP15. (C) graphical display of tissue specific At1g69680 expression. (D) graphical display of tissue specific TCP15 expression. (Figures courtesy of Winter et al, 2007).
Rel
ativ
e Ex
pre
ssio
n C D
Rel
ativ
e Ex
pre
ssio
n
*cotyledon 75
*stage 15 flower –
petals 250
*1st node 75-80
*shoot apex various 75-100
*stage 15 flower – pedicel 100
*stage 15 flower – pedicel 370
*cotyledon 50
*1st node 115
*shoot apex various 150-225

76
Younger rosette leaves and cauline leaves are more serrated about their leaf margin than the first
few rosette leaves produced by the plant. GFP marked the tip of each serration in these adult
leaves (Figure 19 panel 5). Upon transition to adult vegetative development, GFP fluorescence
persists at the vegetative nodes (Figure 19 panel 15, arrow).
The transition to reproductive development in plants is marked by production of the primary
inflorescence. As the primary inflorescence emerged (Figure 19, panel 11 arrow) intense
florescence was associated with the buds (Figure 19, panels 12-3). The vegetative meristem
starts producing floral meristems that give rise to buds, which mature into flowers and set seed.
Fluorescence was detected in entire young buds, and in the underlying floral meristem. Older
buds had fluorescence confined to the pedicel (Figure 19, panels 14-15 swirly arrows) and the
underlying meristem (Figure 19, panel 13 swirly arrow).
As floral development proceeded, fluorescence was detected in the stigma, the valve
margin/replum of the gynoecium (Figure 19, panel 16, arrow) and the abscission zone (the
boundary between the base of the flower and the pedicel) (Figure 19, panels 16 arrowhead). In
fully mature flowers, WG335 expression was absent from the pedicel (Figure 19, panel 15).
Transverse sections of vegetative nodes revealed expression in the epidermal cell layer, the
cortical tissue, and in the attachment point to the lateral organ (leaf) as well as in the leaf tip
(Figure 20, panel 6). Also, the expression in leaves showed polarity such that greater expression
is seen on the adaxial side of leaves (Figure 20, panel 4 where expression was detected in
trichome support cells and in epidermal cells) compared to that in the abaxial side of leaves
(Figure 20, panel 3 expression is detected only in trichome support cells).
Based on the observations of the spatio-temporal expression pattern of TCP15 as observed in
the WG335-GFP line plants, it is observed that this gene could function in regulating lateral
organ boundaries as it shows expression at vegetative nodes, pedicels, sepal-pedicel junctions,
pedicel-gynoecium junctions, the valve margin of gynoeciums, within the leaf vasculature and
the base of trichomes. The basipetal leaf expression of this gene mimics that of known reporters
of cell proliferation and differentiation such as CYCB1::GUS and AthB8::GUS (Donnelly et al.
1999; Kang and Dengler, 2002), which also suggests a role for this gene in these processes
during leaf development.

77
Figure 19. TCP15 expression shown by the WG335::GFP marker line during development. Expression is first detected in the tips of the emerging leaf primordia (panel 1, arrows). Expression at the leaf tip and petiole (panel 2 top and bottom arrows, respectively). Hydathode specific expression (panels 3 and 5, arrows). Vascular specific expression is observed in the mid rib (panel 6, arrow) and all vein orders of fully expanded leaves (Panel 7, arrow-secondary vein, arrowhead- tertiary vein, swirly arrow- quaternary vein). The bases of trichomes exhibit GFP fluorescence (panel 8, white arrow). GFP expression is also detected in the stipules (panel 9, white arrows) and in a punctate pattern about the leaf margin (panel 10). The primary inflorescence shows strong GFP expression (panels 11 and 12, swirly arrows). This fluorescence was found to come from the underlying meristem (panel 13, swirly arrow). Strong fluorescence is seen in both pedicels and young buds (panel 14, swirly arrow). As flowers formed, GFP was detected in vegetative nodes (panel 15, bottom arrow), the sepal-pedicel junction

78
(panel 15, swirly arrow), in a concentrated band at the abscission zone (panel 16, arrowhead), which separates the gynoecium from the pedicel, and in the valve margin (panel 16, arrow).
Figure 20. Confocal microscopy showing WG335::GFP expression in developing plants. GFP expression is observed during juvenile vegetative (panels 1-5), and adult vegetative (panel 6) development. Confocal microscopy confirms GFP expression in the emerging tips of true leaves (panel 1). GFP is detected in rectangular cells of the leaf petiole midrib (panel 2). Polarity in GFP expression is seen along the dorsi-ventral plane of the leaf. Leaf abaxial surfaces show lower GFP expression, marking only the trichome support cells (panel 3), whereas adaxial leaf surfaces show greater expression both in trichome support cells and in epidermal cells (panel 4). GFP is detected in a leaf hydathode (panel 5). Transverse sections through a vegetative node llustrate a radially symmetric GFP expression pattern within the stem in the epidermal and cortical cell layers, as well as expression within the central and marginal cells of the lateral organ (leaf) attached to this node (panel 6). Scale bars reflect 100µm in panels 1, 5, and 6, 50µm in panels 2 and 3, and 20µm in panel 4. Arrows point to trichome support cells (panel 3), pavement epidermal cells (panel 4) and hydathodes (panel 5).

79
3.4 Auxin inducibility of TCP genes
Several lines of evidence suggested the auxin inducibility of TCP15. The first was the BLAST
search producing a top hit of a cotton helix-loop-helix like protein that was induced by auxin
application. Bioinformatics analysis revealed the presence of an auxin response element within
the proximal (within 1.5Kbp upstream of the transcription start site) TCP15 promoter
(http://www.bioinformatics2.wsu.edu/Athena/motifs/13009998471300999899.txt) suggesting
that TCP15 gene expression may be transcriptionally regulated by the hormone auxin. In
addition there is remarkable similarity in domains of TCP15 gene expression shown by WG335
GFP fluorescence patterns and auxin accumulation patterns revealed by the reporter DR5::GUS
(Aloni et al. 2003, Figure 21). Thus, it was hypothesized that the TCP15 and the highly
homologous TCP14 genes‟ expression may be regulated by auxin.
Figure 21. The enhancer trap WG335 mirrors the expression pattern of the auxin accumulation reporter DR5::GUS in leaves. GUS staining pictures (courtesy of Aloni et al. 2003) are shown in A, C, E. GFP pattern of the WG335 line is shown in B,D,F. Expression is detected at the base of trichomes (A, B, arrows), hydathodes (C, D, arrows, E, F, arrowheads), and veins (C, D, arrowheads ).

80
In order to test this hypothesis, wild type seedlings were propagated in a liquid culture.
After one week of growth, a one hour incubation was conducted using 100nM of the auxin
indole-3-acetic acid (IAA) for the experimental condition and DMSO as the mock treatment.
Quantitative PCR was performed upon cDNA, using primers to assess expression of TCP14 and
TCP15 in both treatments relative to two housekeeping genes (ACTIN2 and RUBISCO) and a
positive control for auxin inducibility (IAA19) (Tatematsu et al. 2004). IAA19 exhibited an 11
fold increase following incubation as compared to the mock-treated sample (Figure 22). Neither
TCP14 nor TCP15 showed an induction upon treatment with auxin. Therefore, addition of auxin
to seedlings does not cause an increase in TCP14 or TCP15 transcription.
Figure 22. Quantitative RT-PCR results for auxin inducibility assay on wild type seedlings. These results were normalized using ACTIN2 and RUBISCO expression as housekeeping controls. Error bars reflect standard deviation. Biological duplicates were tested along with technical triplicates.
Auxin inducibility of TCP15 was also tested cytologically. WG335 seedlings and seedlings
containing the auxin accumulation reporter DR5::GUS were propagated on media supplemented
with IAA to examine if changes in TCP15 expression were occurring (Figure 23). DR5::GUS
seedlings showed enhanced auxin accumulation reflected by GUS staining on media
supplemented with increasing concentrations of auxin, as shown previously by Sabatini et al.
(1999). This test also confirmed that auxin was being taken up by seedlings in this manner.
WG335 seedlings however did not show any change in GFP pattern until 50µM IAA treatment,
whereby WG335 expression was observed in cotyledons, and true leaves remained unexpanded.
This change in expression may be due to gross morphological changes in the seedling due to
TCP gene expression in response to auxin
treatment
-2.00
0.00
2.00
4.00
6.00
8.00
10.00
12.00
14.00
TCP14 TCP15 IAA19
Gene
Exp
ress
ion
DMSO
100µM IAA

81
application of high concentrations of auxin. Thus, auxin does not seem to be directly influencing
TCP15 expression.
Figure 23. TCP15 is not auxin inducible. A-C: DMSO, D-F: 10µM IAA, G-I: 25µM IAA, J-L: 50µM IAA. Panels A,B,D,E,G,H,J,K show GFP expression in WG335 seedlings. Arrows in panels A,D,G, and J indicate maintenance of GFP in the confined strip region of the hypocotyl that is continuous with GFP expression in the midrib of the 1st rosette leaf. GFP expression is maintained in the midrib (E,H, arrows), hydathodes (B, H, arrowheads), and base of trichomes (E arrowhead). Panels C,F,I,L show the effects of auxin accumulation and root hair frequency in roots of DR5:GUS seedlings. Red dots indicate increased root hair frequency as a result of increasing IAA concentration. Scale bars in panels C, F, I, L reflect 500µm.
82
3.5 Regulation of auxin accumulation by TCP14 and TCP15
Although the exogenous application of auxin does not seem to directly regulate TCP14 and
TCP15 gene expression, the effect of auxin efflux inhibitors on WG335 expression and the
striking overlap in WG335 and DR5::GUS expression patterns suggests an intimate relationship
between TCP proteins and this hormone. Thus it was hypothesized that the expression of TCP15
and TCP14 may be guiding auxin accumulation patterns. If this is correct, then in the absence of
one or both of these TCP genes, auxin accumulation patterns should change.
Several independent transgenic lines were generated in which the DR5::GUS reporter was
transformed (using Agrobacterium tumefasciens) into a tcp14 (single mutant), tcp15 (single
mutant), or a tcp14 tcp15 (double mutant) background. Two independent lines were generated in
wild-type, tcp15, and tcp14 tcp15 backgrounds. Only one line was generated for the tcp14
background. The DR5::GUS reporter was used to examine auxin accumulation patterns because
it has been documented to detect the concentration of free auxins such as IAA, NAA and 2,4-D
(Sabatini et al. 1999; Aloni et al. 2003). Transgenic plants were propagated and the staining
pattern of the DR5::GUS reporter was evaluated in a developmental series from one to six days
post germination (Figure 24 panels 1-6). DR5::GUS expression was examined in early
development because auxin plays an important role in many developmental processes, some of
which occur early on in the plant‟s life.
Wild-type cotyledons showed auxin accumulation at the distal leaf tip in a region termed
the “distal focus” (Mattsson et al. 1999, 2003). This accumulation pattern was maintained
throughout the first 6 days of growth after germination (Figure 24, panels 1-6, A).
Accumulation during the first three days of post germinative growth was several layers deep
until the initiation of the primary vein (Figure 24, panels 1-3, A). By day 4, this expression
retracted apically, and became progressively closer to the tip until staining was only seen in the
most apical 1-2 layers of the cotyledon tip at six days post germination (dpg) (Figure 24, panels
4-6, A).
Auxin accumulation in the cotyledons of mutant transgenic lines was expanded compared
to wild type, resembling the staining pattern of a cotyledon of a plant subjected to auxin
transport inhibition (compare Figure 27 panels E, I, M, G, K, O to Figure 24, panels 1 C,E, G,
and panels 2-6, D,G, J).

83
Cotyledons of 1dpg transgenics showed uniform diffuse expression across the entire
cotyledon blade (Figure 24, panel 1, C, E, G). The intensity level was greater in the double
mutant transgenics than in single mutant transgenics (compare Figure 24, panel 1 G and C, E).
Entire blade staining persisted until 3dpg, at which point auxin accumulation was focused to the
leaf margin (Figure 24, panel 3, D, G, J). All 3 tcp mutant genotypes showed expanded staining
around the margin of the leaf blade as compared to the restricted distal tip accumulation
observed in wild type seedlings.
By 4dpg, the cotyledon staining pattern in tcp15 transgenics had reverted back to the wild-
type pattern, although the intensity and the area of staining was still increased at the distal leaf
tip (Figure 24, panel 4, G). The tcp14 and tcp14 tcp15 transgenics showed enhanced GUS
staining about the perimeter of the leaf margin. This pattern was maintained up to 6dpg (Figure
24 panels 4-6, D, J). Thus, it appears that TCP14 functions to limit auxin maxima within
cotyledons to the distal leaf tip.
Auxin accumulation in the root also showed elevated and altered expression in the mutant
transgenic lines. Normal auxin accumulation within the root is confined to the root meristem
(Figure 24, panel 2, C arrow). The change in pattern was observed as early as 2dpg, where both
single and double mutant transgenics showed elevated GUS staining in the root meristem
region, and ectopic staining in all cell files of the root, with a concentration in the central
vascular cylinder in the double mutant transgenics (Figure 24, panel 2, F, I and L). The
enhanced auxin accumulation was maintained over the course of development, however by
6dpg, the overall level of auxin accumulation was reduced for all lines; however the transgenic
lines still displayed greater levels than the wild type (Figure 24, panel 6, compare C to F, I, and
L). Thus, it appears that TCP14 and TCP15 function to actively limit the region and extent of
the auxin maxima to within the root meristem of young seedlings. This may be to promote
aspects of primary root growth, and prevent precocious formation of lateral roots.
tcp14 and tcp14 tcp15 transgenics showed the emergence of adventitious roots at about
5dpg from the hypocotyl-root junction (Figure 24, panel 5, E and K black dot). Normally, in the
absence of applied auxins, lateral roots are initiated in an acropetal sequence (Laskowski et al.
1995), thus lateral root formation at the root-hypocotyl junction was unusual. This was not
observed in 5dpg wild-type seedlings (Figure 24, panel 5, B black dot). The finding of

84
increased lateral root formation in transgenic seedlings could be due to increased root auxin
accumulation. This finding suggests that loss of TCP14 function may stimulate physiological
changes in the seedling as a consequence of altered auxin gradients, however quantitation of
lateral root density in tcp14 and tcp15 backgrounds yield no difference from wild type (data not
shown).
Hypocotyl, hypocotyl-root junction and true leaf expression was also examined in these
seedlings (Figure 24, panels 1 B, D, F, H, panels 2-6, B, E, H, K arrows). Wild-type seedlings
showed faint auxin accumulation at the root-hypocotyl junction (Figure 24, panel 1, B arrow)
and no expression in the hypocotyl at 1dpg. This was sharply contrasted in the mutant
transgenic lines. Strong expression existed in the root-hypocotyl junction of tcp14 and tcp14
tcp15 transgenic lines (Figure 24, panel 1, D and H, arrows) The tcp15 transgenic lines
displayed a lower level of auxin within the hypocotyl and the hypocotyl-root junction
compared to the tcp14 and tcp14 tcp15 transgenic lines (Figure 24, panel 1, F). By day 5,
DR5::GUS expression at the root-hypocotyl boundary was only observed in tcp14 and tcp14
tcp15 transgenic lines, whereas expression disappeared from the wild-type and tcp15 transgenic
lines (Figure 24, panel 5 B, E, H, K black dots).
Hypocotyl staining was not detected at all in the wild-type lines over the course of the time
scale studied (Figure 24, panels 1-6, B). All mutant transgenic lines exhibited hypocotyl
staining within the first two days of germination (Figure 24, panel 1 D, F, H, panel 2, E, H, K).
The double mutant lines showed intense staining about the entire length and width of the
hypocotyl, with more concentrated expression within the central vasculature that terminated in
greater staining in the hypocotyl-root junction (Figure 24, panels 1-2, K). By day 2, hypocotyl
staining was absent in the tcp15 lines but persisted in the tcp14 and tcp14 tcp15 lines (Figure
24, panel 2, E, H and K). Staining was diffuse in the apical half of the hypocotyl and confined
to the vasculature of the basal half of the hypocotyl, with staining more concentrated in the
root-hypocotyl junction. Thus, it appears that TCP14 and TCP15 function to actively exclude
auxin accumulation within the hypocotyls of young seedlings, and limit accumulation at the
root-hypocotyl boundary.
tcp transgenic lines also displayed enhanced auxin accumulation in true leaves. At 2dpg the
double mutant lines showed diffuse staining about the entire true leaf primordium (Figure 24,

85
panel 2, K black dot). This staining was more intense in double mutants and tcp14 transgenic
lines compared to the staining level in tcp15 lines (Figure 24, panel 2, E, H, K black dots), and
no staining was observed in wild-type seedlings (Figure 24, panel 2, B, black dot).
By 3dpg, the 1st leaf primordium had expanded in size. Faint staining was seen at the distal
tips of the wild-type leaf blade (Figure 24, panel 3, B swirly arrow). Uniform strong staining
was seen in double mutants and tcp15 lines in the 1st set of true leaves. The tcp14 line showed
distal tip staining of the 1st set of rosette leaves, but the level of staining was greater and the
domain of expression was broader than in wild type (Figure 24, panel 3, E, H, K swirly arrows).
At this stage, both tcp14 and tcp14 tcp15 lines showed auxin accumulation in the emerging 2nd
true leaf pair (Figure 24, panel 3, E, K black dots).
At 4dpg, faint staining was still evident in the distal leaf tips of 1st set of true leaves in wild
type (Figure 24, panel 4 B swirly arrow). No staining was detected in the 2nd
true leaf pair
primordium (Figure 24, panel 4 B black dot). This agrees with earlier finding of Aloni and
coworkers (2003) who demonstrated that the youngest set of leaves formed at any given time
show an absence of DR5::GUS staining. Both the tcp14 and tcp14 tcp15 transgenic lines had
the 2nd
pair of true leaf primordia clearly visible at this point and intense staining of the entire
primordia was observed (Figure 24, panel 4, E, K black dots). Expression in the 2nd
true leaf
pair primordia leaves of tcp15 transgenics was much lower (Figure 24, panel 4, H black dot).
At 5dpg, no staining was detected in the emerging leaf primordia of wild-type leaves
(Figure 24, panel 5, B swirly arrow). This again agrees with earlier findings by Aloni and
coworkers (2003). This is notable, as tcp14 and tcp14 tcp15 transgenic lines showed intense
staining in the unexpanded sets of emerging leaf primordia (Figure 24, panel 5, E, K swirly
arrows). tcp15 lines showed this to a lesser extent (Figure 24, panel 5, H swirly arrow).
At 6dpg, all leaf primordia had expanded and showed a punctate staining pattern (at the
leaf tips and hydathodes) in tcp14 tcp15 double mutant transgenic leaves (Figure 24, panel 6
K). This was slightly evident in tcp14 transgenic leaves (Figure 24, panel 6, E). tcp15 leaves
however, showed an absence of staining for the expanded 1st set of leaves and the 2
nd set of leaf
primordia (Figure 24, panel 6 H).

86
Auxin accumulation patterns were assessed in adult tissues (Figure 25). The domain of
auxin accumulation was expanded in cauline leaves and in reproductive tissue in the mutants.
Normally in wild-type plants auxin accumulation is only found in the anthers (Figure 25, panel
A), whereas in tcp14 plants, auxin accumulation is observed in the ovules of the gynoecium of
mature flowers (Figure 25, panel B). tcp15 plants showed ectopic auxin accumulation within the
sepals and gynoecium of younger buds (Figure 25, panel C). The effect of mutation in both
TCP14 and TCP15 was additive; auxin accumulation was detected in young buds and the
gynoecium of mature flowers (Figure 25, panel D). In cauline leaves, the auxin maxima was
expanded from the normal, punctate pattern observed in a wild type background plants, to
tracing the entire leaf margin, as well as expansion in the medio-lateral plane of the leaf inwards
from the leaf margin (data not shown).
Thus, it appears that the TCP14 and TCP15 genes function to restrict auxin accumulation
either by promoting auxin transport or by limiting auxin synthesis, or by promoting conjugation
or catabolism, as these results demonstrate that in TCP mutant backgrounds the level of free
auxin is elevated and spatially expanded in reproductive tissue.
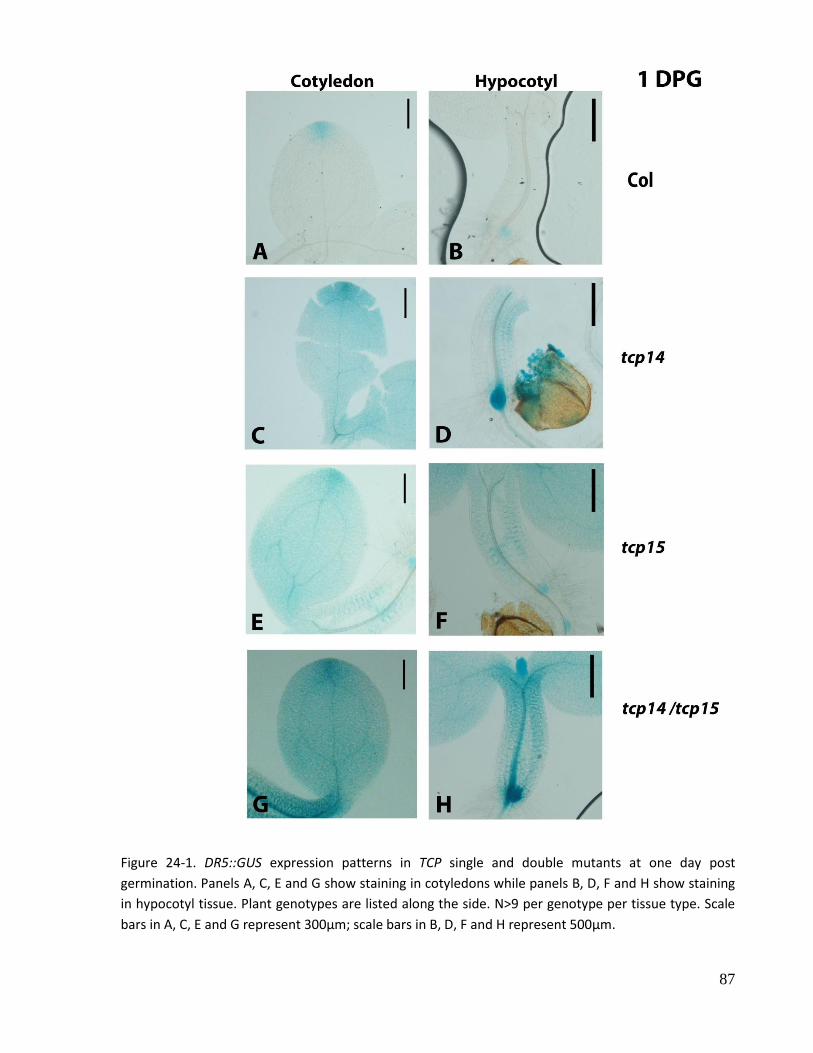
87
Figure 24-1. DR5::GUS expression patterns in TCP single and double mutants at one day post
germination. Panels A, C, E and G show staining in cotyledons while panels B, D, F and H show staining
in hypocotyl tissue. Plant genotypes are listed along the side. N>9 per genotype per tissue type. Scale
bars in A, C, E and G represent 300µm; scale bars in B, D, F and H represent 500µm.

88
Figure 24-2. DR5::GUS expression patterns in TCP single and double mutants at two days post
germination. panels A-C show DR5::GUS staining in a wild type background. Panels D-F show DR5::GUS
staining in a tcp14 background. Panels G-I show DR5::GUS staining in a tcp15 background. Panels J-L
show DR5::GUS staining in a tcp14 tcp15 background. Panels A, D, G, J show staining in cotyledons,
Panels B, E, H, K show staining in hypocotyls and true leaves. Panels C, F, I, L show staining in primary
roots. N>9 per genotype per tissue type. Scale bars in A, B, D, E, G, H, J and K represent 500µm; scale
bars in C, F, I and L represent 50µm.

89
Figure 24-3. DR5::GUS expression patterns in TCP single and double mutants at three days post
germination. panels A-C show DR5::GUS staining in a wild type background. Panels D-F show DR5::GUS
staining in a tcp14 background. Panels G-I show DR5::GUS staining in a tcp15 background. Panels J-L
show DR5::GUS staining in a tcp14 tcp15 background. Panels A, D, G, J show staining in cotyledons,
Panels B, E, H, K show staining in hypocotyls and true leaves. Panels C, F, I, L show staining in primary
roots. N>9 per genotype per tissue type. Scale bars in A, B, D, E, G, H, J and K represent 500µm; scale
bars in C, F, I and L represent 50µm.

90
Figure 24-4. DR5::GUS expression patterns in TCP single and double mutants at four days post germination. panels A-C show DR5::GUS staining in a wild type background. Panels D-F show DR5::GUS staining in a tcp14 background. Panels G-I show DR5::GUS staining in a tcp15 background. Panels J-L show DR5::GUS staining in a tcp14 tcp15 background. Panels A, D, G, J show staining in cotyledons, Panels B, E, H, K show staining in true leaves. Panels C, F, I, L show staining in primary roots. N>9 per genotype per tissue type. Scale bars in A, D, G and J represent 1mm; scale bars in B, E, H and K represent 500µm; scale bars in C, I, F and L represent 50µm.

91
Figure 24-5. DR5::GUS expression patterns in TCP single and double mutants at five days post
germination. panels A-C show DR5::GUS staining in a wild type background. Panels D-F show DR5::GUS
staining in a tcp14 background. Panels G-I show DR5::GUS staining in a tcp15 background. Panels J-L
show DR5::GUS staining in a tcp14 tcp15 background. Panels A, D, G, J show staining in cotyledons,
Panels B, E, H, K show staining in hypocotyls and true leaves. Panels C, F, I, L show staining in primary
roots. N>9 per genotype per tissue type. Scale bars in A, D, G and J represent 1mm; scale bars in B, E, H
and K represent 500µm; scale bars in C, I, F and L represent 50µm.

92
Figure 24-6. DR5::GUS expression patterns in TCP single and double mutants at six days post
germination. panels A-C show DR5::GUS staining in a wild type background. Panels D-F show DR5::GUS
staining in a tcp14 background. Panels G-I show DR5::GUS staining in a tcp15 background. Panels J-L
show DR5::GUS staining in a tcp14 tcp15 background. Panels A, D, G, J show staining in cotyledons,
Panels B, E, H, K show staining in hypocotyls and true leaves. Panels C, F, I, L show staining in primary
roots. N>9 per genotype per tissue type. Scale bars in A, D, G and J represent 1mm; scale bars in B, E, H
and K represent 500um; scale bars in C, I, F and L represent 50µm.

93
Figure 25. Altered auxin accumulation in reproductive tissues in TCP mutants. Comparable age tissue
was obtained from wild type (panel A), tcp14 (panel B), tcp15 (panel C), and tcp14 tcp15 double
mutants (panel D) all harbouring the DR5::GUS reporter. Inset in panel B shows specific GUS staining in
the style and ovules of tcp14 plants containing the DR5::GUS reporter. Scale bar represents 1000µm in
panels A and D, 500µm in panel C and 100µm in panel B. N=6 per genotype.

94
3.6 The effect of auxin transport inhibition on TCP15 gene expression
The effect of polar auxin transport inhibitors on auxin accumulation and plant morphology
have been examined (Sabatini et al. 1999; Mattsson et al. 1999; Benkova et al. 2003). To
examine the effect of polar auxin transport inhibition, wild-type seedlings containing the auxin
accumulation reporter DR5::GUS were also propagated on media containing NPA or TIBA for
14 days, then auxin maxima patterns were observed (Figure 26).
In order to examine the effect of disrupting auxin transport on TCP15 expression,
DR5::GUS and WG335 transgenic seedlings were propagated on media containing DMSO or
increasing concentrations of the polar auxin transport inhibitors NPA and TIBA. TCP15
expression and auxin accumulation patterns were examined after 14 days (Figures 26 and 27).
Auxin accumulation patterns reflected previous studies with NPA (Mattsson et al. 1999,
2003, Figure 26). The normal auxin maxima at the tip of the cotyledon was expanded around the
leaf margin and below the tip (Figure 26 panels A, E, I, M, C, G, K, O).
In true leaves, the staining pattern changed from punctate around the leaf margin at
hydathodes (Figure 26 panels B, D) to a broader distribution around the apical part of the leaf
margin (Figure 26 panels F, J, N) in the case of NPA treatment, and an absence of staining in the
case of TIBA treatment (Figure 26 panels, H, L, P). Staining was also evident in the entire distal
root tip/bulge (data not shown).

95
Figure 26. The effect of NPA and TIBA treatment on auxin accumulation in 14 day old DR5::GUS
seedlings. Panels A, C, E, G, I, K, M, and O show staining in cotyledons. Panels B, D, F, H, J, L, N, and P
show staining in the 1st set of true leaves. Panels A-D show DR5::GUS expression in DMSO (mock)
treated samples. Panels (E-H show DR5::GUS expression in 10µM NPA treated (panels E,F), and 10µM
TIBA (panels G, H) treated seedlings. Panels I-L show staining in 25µM NPA (I, J) and 25µM TIBA (K, L)
treated seedlings. Panels M-P show staining in 50µM NPA (M, N) and 50µM TIBA (O,P) treated
seedlings. Scale bars reflect 500µm.

96
Cotyledons of DMSO supplemented (mock treatment) WG335 seedlings showed no GFP
fluorescence (Figure 27, panels A and C), whereas cotyledons of seedlings treated with NPA or
TIBA showed ectopic TCP15 expression in the vasculature (Figure 27, panels E, I, M, G, K, and
O, arrows). This ectopic expression seemed to be enhanced with increasing concentrations of
NPA or TIBA. True leaves of WG335 seedlings propagated on DMSO media showed GFP
fluorescence in the midrib of the leaf blade (Figure 27, panels B arrow and D, arrowhead), in
stipules and hydathodes (Figure 27, B arrows, D left arrowhead). The true leaves of WG335
seedlings propagated on NPA or TIBA supplemented media showed decreased fluorescence,
which is confined to the broadened midrib of these leaves (Figure 27, panels F, H, J, L and N
arrowheads). GFP fluorescence had completely disappeared in 50µM TIBA treated true leaves
(Figure 27, panel P).
From these results it appears that disrupting normal auxin transport causes ectopic expression of
TCP15 in cotyledon vasculature and attenuation of TCP15 expression in true leaf tissue.

97
Figure 27. The effect of NPA and TIBA treatment on TCP15 gene expression in 14 day old WG335 seedlings. Panels A, C, E, G, I, K, M, and O show GFP expression in cotyledons. Panels B, D, F, H, J, L, N, and P show GFP fluorescence in the first true leaf pair. Insets in panels G, J, L, N, and P show bright field illumination of tissue in the larger panel. Panels A-D show DMSO treatment, 10µM NPA treatment (panels E and F), 10µM TIBA treatment (panels G and H), 25µM NPA treatment (panels I and J), 25µM TIBA treatment (panels K and L), 50µM NPA treatment (panels M and N), and 50µM TIBA treatment (panels O and P). N=12 per tissue type, per concentration. scale bars reflect 1mm.

98
3.7 Root elongation of TCP15 mutants in the presence of auxin
Altered gradients of auxin are observed in TCP14 and or TCP15 mutants yet there were no
observable effects of elevated auxin levels (Figures 24-25). I therefore wanted to examine if
TCP mutants display altered sensitivity to auxin. To determine if auxin perception was altered in
tcp15 plants, a root elongation assay was performed. Wild-type, tcp15, and seeds of a known
auxin perception mutant (axr1-3) were sown on media containing increasing concentrations the
auxin (2,4-D) and grown for 14 days. This auxin was used instead of IAA as IAA tends to be
labile (Wilson et al. 1990). Auxin perception mutants show decreased sensitivity to the addition
of 2,4-D (Leyser et al. 1993; Stirnberg et al. 2002). Root length as a function of hormone
concentration was noted and plotted as a function of percent root elongation inhibition relative
to no hormone treatment (Figure 28). Wild-type seedlings showed an inverse relationship
between root length and concentration of auxin. The tcp15 seedlings behaved in an identical
manner to wild-type seedlings, showing that there is no altered sensitivity of the mutant with
respect to root elongation. Both wild-type and tcp15 seedlings exhibited complete (100%)
inhibition of root elongation at auxin concentrations of 10-7
M and higher. axr1-3 required a 10-
fold greater concentration of hormone (10-6
M), compared to wild-type seedlings in order to
completely inhibit root elongation. Thus the TCP15 mutant does not appear to be compromised
in its ability to detect and respond to 2,4-D.
Figure 28. The effect of 2,4-D on wild-type, tcp15 and axr1-3 seedling root growth. Error bars represent standard error. N=50 per genotype, per concentration.
Extent of primary root growth inhibition as a
function of increasing auxin (2,4-D)
concentration
0
20
40
60
80
100
120
10 -̂8M 10 -̂7M 10 -̂6M 10 -̂5M 10 -̂4M
2,4-D concentration (M)
Perc
ent
Root
Gro
wth
inhib
itio
n Columbia
tcp15
axr1-3

99
3.8 Hypocotyl length differences as a function of light/dark treatment in
tcp14 and tcp15 plants
Plants undergo hypocotyl elongation in response to dark treatment. This is one of three
responses a normal seedling exhibits in the dark [the other two responses are apical hook
formation and etiolation of the seedling] (McNellis and Deng, 1995). Auxin perception mutants
show a reduction in hypocotyl elongation in response to dark treatment, as is observed in axr1-3
seedlings (Lincoln et al. 1990; Leyser et al. 1993). It was hypothesized that if defects in auxin
perception occur in tcp14 or tcp15 plants, they may be specific to certain developmental
processes or stages in the photoperiod cycle, thus the extent of hypocotyl elongation in light and
dark treated plants was evaluated (Figure 29). axr1-3 seedlings were also used because they
have been documented to exhibit altered hypocotyl elongation as a result of reduced auxin
sensitivity (Lincoln et al. 1990; Leyser et al. 1993). Wild-type samples produced short (about
0.4cm) hypocotyls when subjected to light treatment, and long hypocotyls (about 1.7cm) when
subjected to dark treatment. axr1-3 seedlings behaved in a similar fashion, however they
exhibited reduced hypocotyl length under both treatment conditions compared to the wild type
(0.2cm in the mutant compared to 0.4cm in wild type under light treatment conditions, and
1.45cm in the mutant and 1.7cm in wild type under dark treatment conditions) due to reduced
auxin sensitivity (Lincoln et al. 1990; Romano et al. 1995). The tcp15 seedlings showed a
similar hypocotyl length comparable to the wild type, but a reduced hypocotyl length in the dark
(1.5cm in tcp15 seedlings compared to 1.7cm in wild type). The differences between wild type
and tcp15 seedlings were found to be significant for the dark treatment conditions. tcp14
seedlings showed identical hypocotyl elongation under both treatments as wild-type seedlings.
One possible cause of decreased hypocotyl length in the dark grown TCP15 mutant seedlings
could be elevated auxin levels, as this physiological response has been previously demonstrated
to be altered by reduced auxin sensitivity in AXR1 mutant seedlings (Lincoln et al. 1995;
Romano et al. 1995).
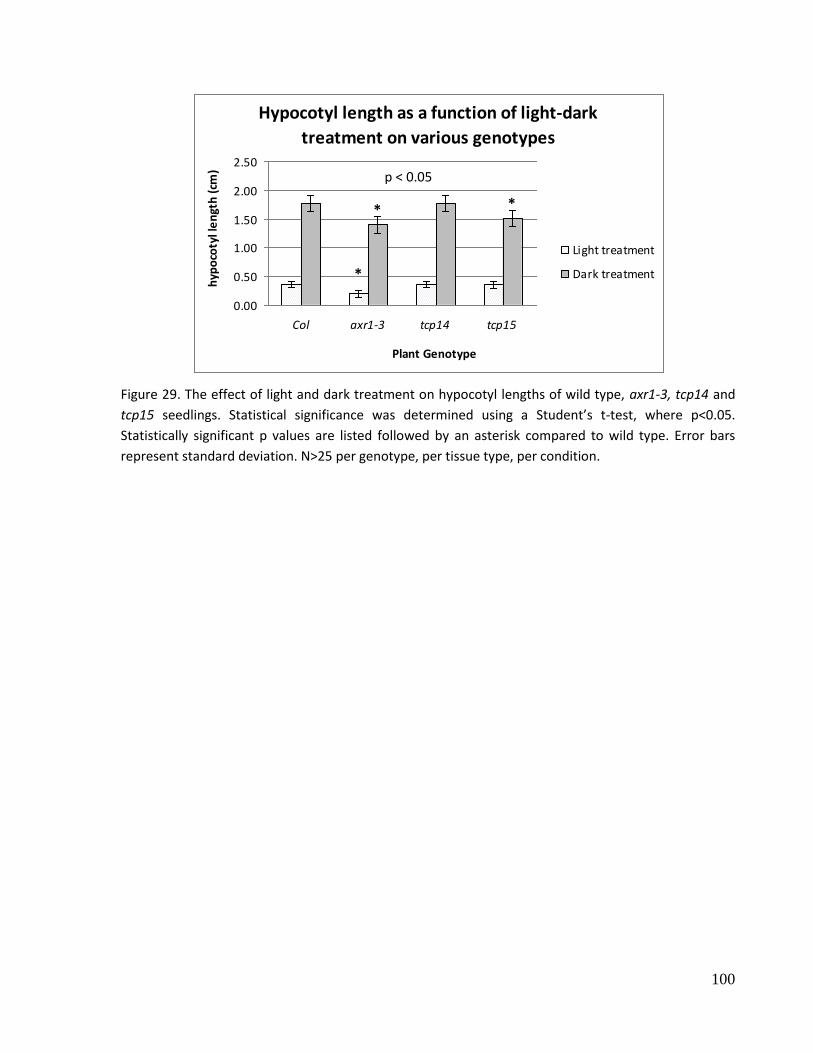
100
Figure 29. The effect of light and dark treatment on hypocotyl lengths of wild type, axr1-3, tcp14 and
tcp15 seedlings. Statistical significance was determined using a Student’s t-test, where p<0.05.
Statistically significant p values are listed followed by an asterisk compared to wild type. Error bars
represent standard deviation. N>25 per genotype, per tissue type, per condition.
Hypocotyl length as a function of light-dark
treatment on various genotypes
0.00
0.50
1.00
1.50
2.00
2.50
Col axr1-3 tcp14 tcp15
Plant Genotype
hyp
oco
tyl l
en
gth
(cm
)
Light treatment
Dark treatment*
* *
p < 0.05

101
Results Part 2: Examination of TCP8 function in leaf development
3.9 TCP8 identification and phenotype
TCP8 was selected for study on the basis of its similarity to TCP15 and TCP14. This was due to
the lack of availability of mutant lines for the more closely related genes TCP7 and TCP21 at the
time of this study.A T-DNA insertion line was obtained from the Riken institute in order to
propagate a null mutant and characterize this gene in a reverse-genetics manner (Figures 13,
Appendix 1 and Appendix 2).
Comparison of wild-type (Nossen ecotype) and tcp8 plants of comparable age revealed no
differences in plant height or branching pattern (Figure 30), however mutant plants displayed
changes in leaf morphology (Figure 31 and 32).
Figure 30. A comparison of plant architecture in wild-type and tcp8 plants. The wild-type plant
(Nossen) is on the left and the tcp8 mutant is on the right. Plants were 50 days old at time of image
capture.
Closer examination of leaves revealed that the mutant exhibited serrated leaves and
increased trichome numbers. In order to examine differences in leaf shape/morphology and
number, wild type and mutant plants of identical age (50 days post sowing) were selected for
comparison of sequentially ordered rosette leaves dissected from the respective plants (Figure
31).

102
The mutant produced leaves with a wavier/curlier leaf blade (Figure 34), as found by the
difficulty in flattening these leaves compared to wild-type leaves. Later produced mutant rosette
leaves were bigger (especially in blade width) than their wild-type counterparts.
Figure 31. The overall shape and morphology of tcp8 rosette leaves as compared to wild-type leaves.
Rosette leaves from 50 day old plants of both genotypes were laid out in order of leaf initiation.
Rosette leaf 1 is shown by the white arrow.
tcp8 cauline leaves were found to be larger by comparison to the Nossen parental line
(Figure 32). Quantitation of the size differences between wild-type and mutant cauline leaf size
revealed that while mutant leaves are bigger than their wild type counterparts, this difference
was not significant (Figure 33). Mutant leaves possessed more adaxial trichomes than wild-type
leaves and were more serrated than their wild-type counterparts (Figure 32).

103
Figure 32. A comparison of Nossen and tcp8 cauline leaf morphology. Panels show cauline leaves from
nodes 1 to 3. Each panel shows the wild-type (Nossen) and mutant (tcp8) cauline leaves side by side
from equivalent node positions. Panels A-C show the adaxial side of cauline leaves, panels D-F show the
abaxial side of cauline leaves. Nossen leaves are marked by a white dot. Arrows indicate positions of
deeper sinuses in mutant leaves.
tcp8 cauline leaves had a greater area and greater perimeter (Figures 33 and 34) than their
wild type counterparts at all three nodal positions, however the difference wasn‟t great enough
to be considered statistically significant.
Figure 33. Leaf area differences between wild-type and tcp8 cauline leaves at nodes 1-3. Error bars reflect standard deviation. N>25 per genotype per nodal position.
Cauline leaf area as a function of genetic background and leaf
position
0
20
40
60
80
100
120
140
160
Nossen tcp8
Plant Genotype
Leaf
Are
a (m
m2)
NODE1
NODE2
NODE3

104
Figure 34. Leaf perimeter quantitation in wild-type and tcp8 cauline leaves at nodes 1-3. Error bars reflect standard deviation. N>25 per genotype per nodal position.
To examine if there were any abnormalities in the morphology of leaf cells, scanning
electron microscopy was undertaken (Figure 35). No differences were detected in the
morphology of trichomes (Figure 35, panels A, B), trichome-support cells (Figure 35, panels
A, B), epidermal and stomatal cells (Figure 35, panels C, D), midrib cells of rosette leaf one
(Figure 35, panels E, F), or in cauline leaf margin epidermal cells (Figure 35, panels G, H).
Cauline leaf perimeter as a function of genetic background
and leaf position
0
10
20
30
40
50
60
Nossen tcp8
Plant Genotype
Leaf
Per
imet
er (
mm
)NODE1
NODE2
NODE3

105
Figure 35. Cell morphology of Nossen and tcp8 leaves using scanning electron microscopy. Panels A,
C, E, and G show representative wild type samples. Base of a trichome on a 16dpg rosette leaf one
(panels A, B). Close-up of epidermal cells of cauline leaf at node one (panels C, D). Cells of the midrib
of a 16dpg rosette leaf 1 (panels E, F). High magnification (3000x) of the leaf margin of cauline leaves
at node one (panels G, H). Scale bars represent 100µM for panels (A, B), 50µM for panels (C,D),
100µm for panels (E,F), and 10µM for panels (G,H).
Nossen tcp8 mutant

106
To characterize the tcp8 leaf phenotype, differences in cell (epidermal, stomatal and
trichome) density, organ size, hormone perception, and vein patterning in rosette leaf one and
cauline leaves at nodal positions 1-3 were quantitated.
3.10.1 Leaf size differences between wild-type and tcp8 rosette one leaves
To assess size differences between tcp8 and wild-type leaves, area and perimeter was
calculated for rosette leaf one. For fully expanded rosette one leaves (measured at 45 days post
sowing), wild-type leaves had a significantly larger area and perimeter than mutant leaves
(Figure 36). The reason that rosette leaf one was chosen for the study of cell density and
vascular characterization is because it is the most characterized leaf in Arabidopsis, and is used
as a framework for developing theories of pathways regulating leaf shape, vascular patterning
and dorso-ventrality (Waites and Hudson, 1995; Donnelly et al. 1999; Kang and Dengler,
2002; Tsukaya, 2005, 2006). It was postulated that if TCP8 is functioning to regulate an aspect
of leaf development such as cell spacing, margin formation or vascular patterning, this may be
manifested in rosette leaf one. This leaf is small and amenable to characterization of a variety
of parameters that are not easy to characterize in adult leaves due to size constraints (large
organ size makes image capture difficult, and quantitative vascular analysis unwieldy).
Figure 36. Leaf area and perimeter measurements in wild-type and tcp8 rosette one leaves. Asterisks indicate significant differences in both area and perimeter between samples (p-values are listed). Significance was measured using a t-test, with the threshold of p < 0.05 used. Error bars reflect standard deviation. N>25 per genotype.
Rosette leaf one area and perimeter in Nossen and tcp8
plants
0
10
20
30
40
50
60
70
80
90
100
Nossen tcp8
Plant Genotype
me
asu
rem
en
t u
nit
s (m
m2 a
nd
mm
)
Area
Perimeter
p= 2.85272E-05 *
p= 2.2951E-05 *

107
3.10.2 Leaf shape differences between wild-type and mutant rosette one
leaves
The leaf index is a measure of leaf shape (Tsuge et al. 1996; Horiguchi et al. 2005;
Tsukaya, 2002, 2005, 2006). It is calculated from the ratio of the leaf blade length to the leaf
blade width. Values that are equal (ratio close to 1) reflect a round leaf (equivalent amounts
of growth occur along the proximo-distal and medio-lateral axes of the leaf blade) and values
less than 1 reflect a wide leaf (greater expansion in the medio-lateral axis of the leaf blade).
Values greater than 1 reflect a narrow leaf (more growth occurring along the proximo-distal
axis). To assess if any differences exist between wild-type and mutant rosette leaf one shape,
the leaf index was calculated. Rosette one leaf shape is fairly round in general, thus Nossen
leaves had a leaf index close to 1. tcp8 leaves were slightly rounder than Nossen (their values
a little greater than wild type, but still less than 1), however no significant difference existed
(Figure 37).
Figure 37. Leaf index values for fully expanded wild-type and mutant rosette leaves. This graph was generated using SPSS. A non-parametric Mann-Whitney U test was performed to test for statistical significance, using a threshold of 0.05, however, no significance was detected (p> 0.05) The error bars represent +/- 2 SE. N>25 per genotype.
3.11 Epidermal cell density and spacing in rosette one leaves
Qualitative observations of TCP8 mutants suggested that leaf structural/developmental
parameters are governed by TCP8. To assess these changes quantitatively, leaf impressions were
taken from fully expanded rosette leaf one and cauline leaves 1-3 in wild-type and mutant
leaves. These impressions were used to calculate adaxial trichome, stomatal, and pavement
epidermal cell densities. Trichome, pavement epidermal and stomatal cell density were defined
Nossen tcp8
Genotype
1.20 1.00 0.80 0.60 0.40 0.20 0.00
Bla
de
len
gth
: wid
th r
atio
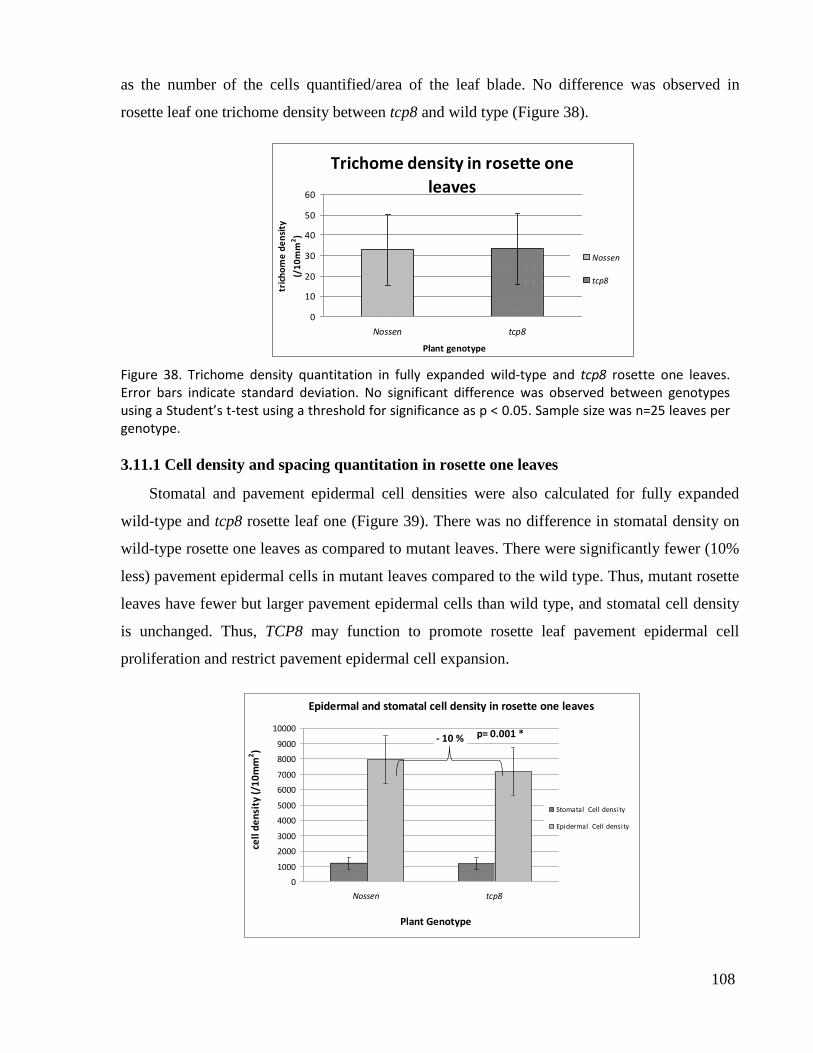
108
as the number of the cells quantified/area of the leaf blade. No difference was observed in
rosette leaf one trichome density between tcp8 and wild type (Figure 38).
Figure 38. Trichome density quantitation in fully expanded wild-type and tcp8 rosette one leaves. Error bars indicate standard deviation. No significant difference was observed between genotypes using a Student’s t-test using a threshold for significance as p < 0.05. Sample size was n=25 leaves per genotype.
3.11.1 Cell density and spacing quantitation in rosette one leaves
Stomatal and pavement epidermal cell densities were also calculated for fully expanded
wild-type and tcp8 rosette leaf one (Figure 39). There was no difference in stomatal density on
wild-type rosette one leaves as compared to mutant leaves. There were significantly fewer (10%
less) pavement epidermal cells in mutant leaves compared to the wild type. Thus, mutant rosette
leaves have fewer but larger pavement epidermal cells than wild type, and stomatal cell density
is unchanged. Thus, TCP8 may function to promote rosette leaf pavement epidermal cell
proliferation and restrict pavement epidermal cell expansion.
Trichome density in rosette one
leaves
0
10
20
30
40
50
60
Nossen tcp8
Plant genotype
tric
ho
me
de
nsi
ty
(/1
0m
m2)
Nossen
tcp8
Epidermal and stomatal cell density in rosette one leaves
0
1000
2000
3000
4000
5000
6000
7000
8000
9000
10000
Nossen tcp8
Plant Genotype
cell
de
nsi
ty (
/10
mm
2)
Stomatal Cell density
Epidermal Cell density
- 10 % p= 0.001 *

109
Figure 39. Pavement epidermal and stomatal cell density quantitation in wild-type and tcp8 rosette one leaves. The asterisk indicates significant differences in epidermal density (p-value is listed). Significance was measured using a Student’s t-test, with the threshold of p < 0.05 used. Error bars represent standard deviation. N>25 per genotype.
Cell densities reflect changes in cell number, however they give no indication of changes in
patterns of epidermal cell spacing. To evaluate whether trichome and stomatal cell spacing
patterns were altered in tcp8 rosette one leaves, the average trichome and stomatal index was
calculated for leaves of both genotypes (Figure 40A and B). Stomatal spacing has been
characterized, and can be calculated using the Stomatal Index (SI) (Dyer, 2001; Schoch et al.
1980; Ceulemans et al. 1995). This formula incorporates the density of pavement epidermal
cells, therefore the stomatal index is a measure of cell spacing.
This formula was modified to similarly define the trichome index (TI) as:
TI = trichome density X 100
trichome density + pavement epidermal cell density
The trichome index was approximately equivalent within wild-type and mutant rosette one
leaves (0.41086 in Nossen and 0.46041 in tcp8 leaves) (Figure 40A), suggesting that spacing
patterns of trichomes was not altered in the mutant. Wild-type and mutant rosette leaves also
were found to have equivalent stomatal indices (Figure 40B; 13.25 in Nossen and 13.8996 in the
mutant) suggesting that the spacing pattern of stomata was also unperturbed in the mutant.
Figure 40. Trichome Index (A) and Stomatal Index values (B) in wild-type and tcp8 rosette one leaves. Error bars reflect standard error. No significant difference was found according to a Student’s t-test where the threshold for significance was P<0.05. N>25 per genotype.
Trichome index for rosette one leaves
0.3
0.35
0.4
0.45
0.5
Nossen tcp8
Plant Genotype
Tri
ch
om
e In
dex
Stomatal index for rosette one leaves
12
12.5
13
13.5
14
14.5
Nossen tcp8
Plant Genotype
Sto
mata
l In
dex
A B

110
3.11.2 The effect of NPA on trichome density
The inhibition of auxin transport leads to an increase in leaf trichome number in wild-type
rosette leaves (O‟Donnell et al. 2004). tcp8 leaves displayed increased trichome number,
therefore the effect of increasing NPA concentration on wild-type rosette and mutant leaf one
trichome density was examined quantitatively (Figures 41 and 42). The shortened time span of
14 days for this study was chosen due to the severe morphological defects caused by NPA
treatment (leaf epinasty, anthocyanin production), thus it may not have been possible to
propagate these seedlings for an extended period of time to obtain fully expanded rosette one
leaves. Wild-type untreated rosette one leaves had a trichome density of 3 trichomes/mm2
(Figure 41). Upon treatment with 1µM NPA, trichome density dramatically increased 2.6 fold,
to 8 trichomes/mm2. This effect was enhanced when seedlings were treated with a higher
concentration of NPA such as 10µM, causing the trichome density to increase to 10
trichomes/mm2. Increased trichome density may be due to increased auxin accumulation within
the leaf. Thus, the maintenance of normal auxin flux may be required to limit trichome
formation, as inhibiting polar auxin transport promotes trichome formation.
Figure 41. The effect of NPA on trichome density. Asterisks indicate significantly differing trichome densities as compared to that in the mock (DMSO) treatment (p-value listed). Significance was measured using a Student’s t-test with the condition that p < 0.05. The error bars reflect standard deviation. The sample size was n= 25 leaves/ concentration.
This experiment was repeated using both wild-type and tcp8 seedlings to see if the same
effect is exhibited in mutant rosette one leaves (Figure 42). Untreated tcp8 leaves showed a
Nossen rosette leaf one trichome density as a function of increasing
NPA concentration
0
2
4
6
8
10
12
DMSO 1uM NPA 3uM NPA 5uM NPA 10uM NPA
NPA concentration (uM)
Tri
ch
om
e D
en
sit
y (
/mm
^2)
p<0.000001
* * * *

111
significantly lower rosette leaf one trichome density as compared to wild-type rosette one
leaves (2 trichomes/ mm2 compared to 3 trichomes/ mm
2 in wild type). While mutant trichome
density is lower than wild type when mock treated with DMSO, this may be due to a lag in
mutant leaf development, such that trichome densities are lower until leaf expansion has
ceased, as the previously shown study examining trichome density in rosette leaves of wild-
type and mutant background was performed on leaves that had fully expanded (>24 dpg; Figure
38).
Upon treatment of seedlings with 10µM NPA, wild-type seedlings showed dramatically
increased trichome density (about 10 trichomes/mm2), whereas the mutant showed only a
modest increase in trichome density of about 3 trichomes/mm2. Thus it appears that tcp8 leaves
are relatively insensitive to the effects of NPA on increased trichome density. NPA functions to
inhibit auxin transport out of leaves, hence increasing leaf auxin concentration. In wild type
leaves, this serves to increase trichome density, suggesting a normal function of auxin transport
out of the leaves is to limit/maintain leaf trichome number. In tcp8 leaves, NPA causes auxin
accumulation in the leaf without concomitant increase in trichome number. This suggests that
tcp8 plants are partially auxin insensitive.
Figure 42. The effect of NPA on trichome density differences between wild-type and tcp8 rosette one
leaves. Significance was measured using a Student’s t-test with the condition that p < 0.05 (p-values
listed). Asterisks indicate significantly differing trichome densities between genotypes. The error bars
reflect standard deviation. The sample size was n= 25 leaves/ concentration/ genotype.
Trichome density as a function of NPA concentration in
rosette one leaves
0
2
4
6
8
10
12
DMSO 10uM NPA
Treatment condition
Trichom
e D
ensity
(/m
m^2
)
Nossen
tcp8
p=0.003 *
p=5.82E-14 *
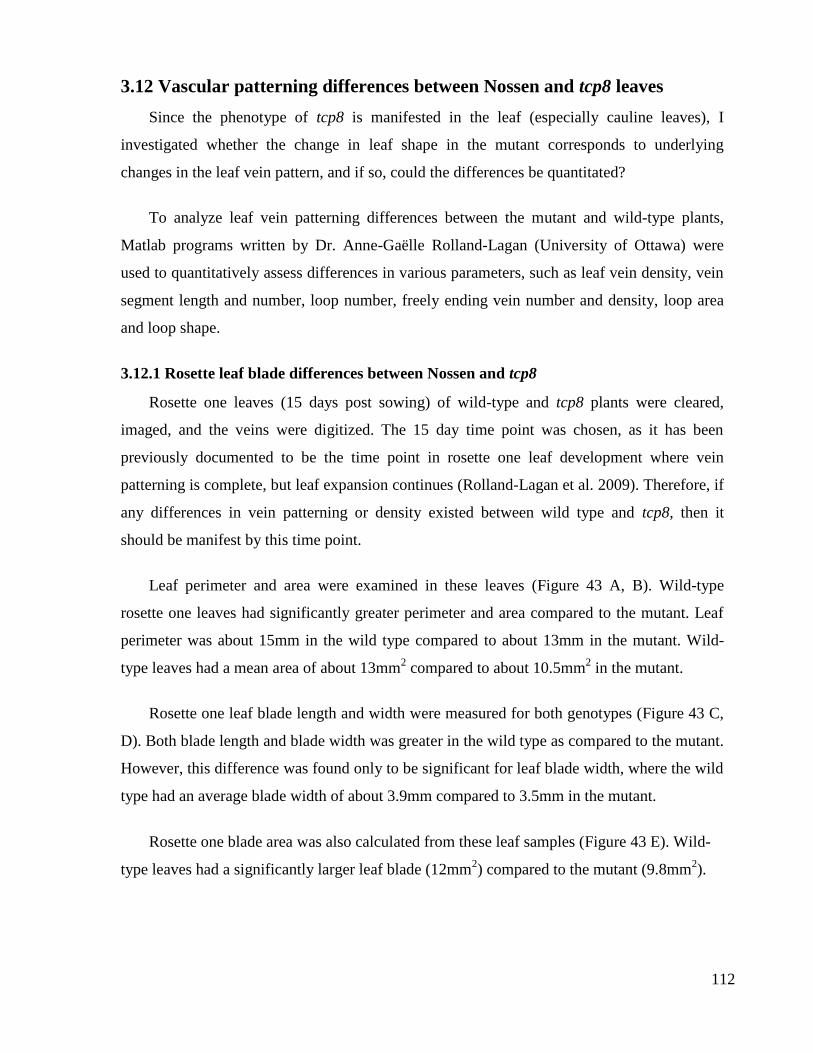
112
3.12 Vascular patterning differences between Nossen and tcp8 leaves
Since the phenotype of tcp8 is manifested in the leaf (especially cauline leaves), I
investigated whether the change in leaf shape in the mutant corresponds to underlying
changes in the leaf vein pattern, and if so, could the differences be quantitated?
To analyze leaf vein patterning differences between the mutant and wild-type plants,
Matlab programs written by Dr. Anne-Gaëlle Rolland-Lagan (University of Ottawa) were
used to quantitatively assess differences in various parameters, such as leaf vein density, vein
segment length and number, loop number, freely ending vein number and density, loop area
and loop shape.
3.12.1 Rosette leaf blade differences between Nossen and tcp8
Rosette one leaves (15 days post sowing) of wild-type and tcp8 plants were cleared,
imaged, and the veins were digitized. The 15 day time point was chosen, as it has been
previously documented to be the time point in rosette one leaf development where vein
patterning is complete, but leaf expansion continues (Rolland-Lagan et al. 2009). Therefore, if
any differences in vein patterning or density existed between wild type and tcp8, then it
should be manifest by this time point.
Leaf perimeter and area were examined in these leaves (Figure 43 A, B). Wild-type
rosette one leaves had significantly greater perimeter and area compared to the mutant. Leaf
perimeter was about 15mm in the wild type compared to about 13mm in the mutant. Wild-
type leaves had a mean area of about 13mm2 compared to about 10.5mm
2 in the mutant.
Rosette one leaf blade length and width were measured for both genotypes (Figure 43 C,
D). Both blade length and blade width was greater in the wild type as compared to the mutant.
However, this difference was found only to be significant for leaf blade width, where the wild
type had an average blade width of about 3.9mm compared to 3.5mm in the mutant.
Rosette one blade area was also calculated from these leaf samples (Figure 43 E). Wild-
type leaves had a significantly larger leaf blade (12mm2) compared to the mutant (9.8mm
2).
A

113
3.12.2 Vascular differences between Nossen and tcp8 leaves
Blade loop number was another parameter measured (Figure 43 F). There was no
significant difference between the two sample sets; both produced on average approximately
10 vein loops on the leaf blade.
Other loop parameters measured were total loop area and mean loop area (Figure 43 G,
H). Both total loop area and mean loop area was significantly greater in wild-type leaves
compared to the mutant. Wild-type leaves had a total loop area of 8.5mm2, while the mutant
had a total loop area of 6mm2. Wild-type leaves had a mean loop area of about 0.85mm
2,
while mutant leaves had a mean loop area of about 0.59mm2.
Vein segment number, total vein segment length, mean vein segment length and freely
ending vein number were also calculated (Figure 43 I, K, L). While there didn‟t appear to be any
difference in the number of vein segments present in both wild-type and mutant leaves, wild-
type leaves produced significantly greater total vein length compared to the mutant (33mm in
wild type versus 28mm in the mutant). Accordingly, it was found that the wild-type leaves had a
significantly greater mean vein length (0.57mm) compared to the mutant (0.49mm). Freely
ending veins are defined as a vein that freely terminates within the leaf blade and does not
intersect another vein. The number of freely ending veins was equivalent in both genotypes.
Vein branch point number was also calculated (Figure 43 M). Vein junctions or branch
points are defined as occurring when one vein segment intersects another vein segment. There
was no significant difference in values between wild-type and mutant leaves (32 in wild-type
compared to 31 in the mutant).
Vein density was calculated from the ratio of total vein segment length and mean rosette
leaf blade area (Figure 43 N). Wild-type leaves showed a vein density of 2.53 veins/mm2 while
mutant leaves showed a higher vein density at 2.65 veins/mm2.
Vein branch point and free vein density were similarly calculated (Figure 43 P, O). tcp8
leaves had a greater free vein density (1.3 fv/mm2) compared to wild-type leaves (1.1 fv/mm
2),
however this was not found to be significant. tcp8 leaves also had a greater vein branching point
density (3 bp/ mm2) compared to the wild type (2.5 bp/ mm
2). The difference in vein branch
point density was found to be significant.

114
3.12.3 Petiole differences between Nossen and tcp8 leaves
Petiole length, width, and area were examined in these leaves (Figure 43 Q-S). Wild-type
rosette one leaves had significantly greater petiole length and area compared to the mutant
(Figure 43 B, C). Petiole length was 1.6mm in the wild type compared to 1.1mm in the mutant.
Wild-type leaves had a mean petiole area of 0.8mm2 compared to 0.65mm
2 in the mutant.
Petiole width was not significantly greater in the mutant leaves compared to wild type (0.7mm
in the mutant compared to 0.6mm in wild type) (Figure 43 R).
p = 0.01 *
p = 0.04 *
A
B
p = 0.0419
C
D
p = 0.049
F
E
p = 0.044 *
p = 0.280

115
H
G
p = 0.014 *
p = 0.002 *
L
K
p = 0.004*
p = 0.884
J
I
p = 0.967
p = 0.026*

116
N
M
p = 0.868
p = 0.110
R
Q
p= 0.001 *
p = 0.191
P
O
p = 0.012 *
p = 0.191
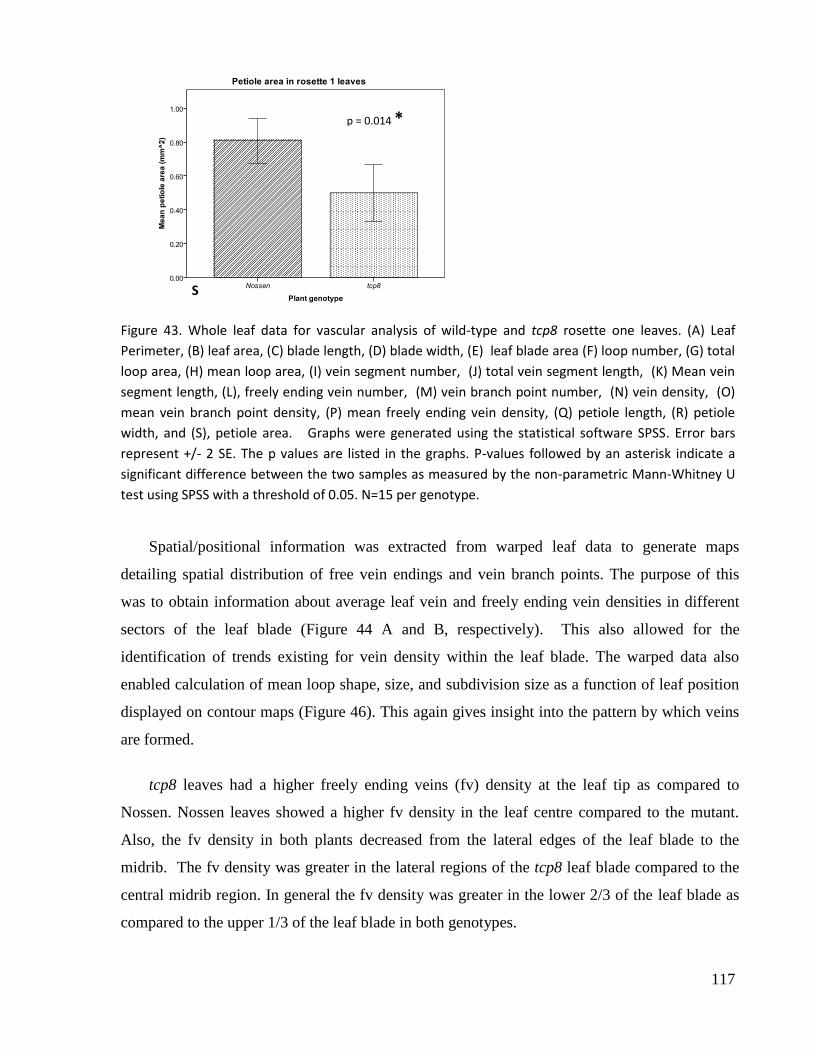
117
Figure 43. Whole leaf data for vascular analysis of wild-type and tcp8 rosette one leaves. (A) Leaf
Perimeter, (B) leaf area, (C) blade length, (D) blade width, (E) leaf blade area (F) loop number, (G) total
loop area, (H) mean loop area, (I) vein segment number, (J) total vein segment length, (K) Mean vein
segment length, (L), freely ending vein number, (M) vein branch point number, (N) vein density, (O)
mean vein branch point density, (P) mean freely ending vein density, (Q) petiole length, (R) petiole
width, and (S), petiole area. Graphs were generated using the statistical software SPSS. Error bars
represent +/- 2 SE. The p values are listed in the graphs. P-values followed by an asterisk indicate a
significant difference between the two samples as measured by the non-parametric Mann-Whitney U
test using SPSS with a threshold of 0.05. N=15 per genotype.
Spatial/positional information was extracted from warped leaf data to generate maps
detailing spatial distribution of free vein endings and vein branch points. The purpose of this
was to obtain information about average leaf vein and freely ending vein densities in different
sectors of the leaf blade (Figure 44 A and B, respectively). This also allowed for the
identification of trends existing for vein density within the leaf blade. The warped data also
enabled calculation of mean loop shape, size, and subdivision size as a function of leaf position
displayed on contour maps (Figure 46). This again gives insight into the pattern by which veins
are formed.
tcp8 leaves had a higher freely ending veins (fv) density at the leaf tip as compared to
Nossen. Nossen leaves showed a higher fv density in the leaf centre compared to the mutant.
Also, the fv density in both plants decreased from the lateral edges of the leaf blade to the
midrib. The fv density was greater in the lateral regions of the tcp8 leaf blade compared to the
central midrib region. In general the fv density was greater in the lower 2/3 of the leaf blade as
compared to the upper 1/3 of the leaf blade in both genotypes.
S
p = 0.014 *

118
Vein density differences were also observed in Nossen and tcp8 rosette one leaves (Figure
44B). Vein density in tcp8 leaves‟ lateral regions was greater than that for lateral regions of
Nossen leaves. The vein density in the proximal (the midrib region of the leaf base) regions for
tcp8 leaves was less than that of comparable regions for Nossen leaves, while vein density in the
lateral regions of the proximal leaf were greater in the mutant than in wild type. Also, the vein
density in the distal regions (centre of the leaf tip) for tcp8 leaves was less than that of
comparable regions for Nossen leaves. In the middle of the leaf blade (the central grid square)
the vein density in tcp8 leaves was greater than that found in the same region of Nossen leaves.
The freely ending vein density was very low in the central region of the midrib in tcp8 leaves.
This value was comparable to that of freely ending vein density at the tip of wild-type leaves
(compare 0.56 for Nossen at the tip and 0.52 for tcp8 in the leaf centre). This suggests that wild-
type distal leaf fate (with respect to freely ending vein density) is moved basipetally in the
mutant.
Figure 44. Freely ending vein density (A) and vein density (B) differences between wild-type and tcp8 warped rosette one leaves. The colour map below the leaves (C) reflects the legend for free vein and vein density (in mm2).

119
To verify that differences in free vein density and vein density exist across the leaf blade
and are statistically relevant, the following steps were taken individually for the Nossen and tcp8
warped leaf blades. The leaf blade was divided into a numbered grid (Figure 45 A, B, and C).
According to the Matlab program used to partition the leaf blade into a grid, the number “1”
represents the entire leaf blade, thus numbering of individual grid boxes within the leaf blade
begins at 2. The leaf blade was divided into regions according to the leaf centre versus the leaf
margin (Figure 45A), the proximo-distal axis of the leaf blade (Figure 45B), and into regions
according to the medio-lateral axis of the leaf blade (Figure 45C). Density values in different
regions were compared to determine if statistically significant differences existed along different
growth planes of the leaf blade.
For a marginal/central comparison of free vein and vein density across the leaf blade
(Figure 45A), the leaf blade was divided into two regions. The central region was comprised of
all vein data in the grid box numbered “six”, and the marginal region was comprised of the grid
boxes numbered ”2, 3, 4, 5, 7, 8, 9, and 10”.
For a proximo-distal comparison of free vein and vein density across the leaf blade, (Figure
45B) the leaf blade was divided into three regions. The uppermost region was comprised of all
vein data in the grid boxes numbered “4, 7 and 10”. The middle region was comprised of all
vein data in the grid boxes numbered “3, 6 and 9”. The lower region was comprised of all vein
data in the grid boxes numbered “2, 5 and 6”.
For a medio-lateral comparison of free vein and vein density across the leaf blade (Figure
45C), the leaf blade was divided into three regions. The left lateral region of the leaf blade was
comprised of all vein data in the grid boxes numbered “2, 3, and 4”. The middle region of the
leaf blade was comprised of all vein data in the grid boxes numbered “5, 6 and 7”. The right
lateral region of the leaf blade was comprised of all vein data in the grid boxes numbered “8, 9
and 10”.
Both wild-type and tcp8 leaves had significant gradients of free vein density and vein
density along the proximo-distal axis of the leaf blade (p < 0.00005). In addition to this, tcp8
leaves showed significant free vein and vein density trends medio-laterally and centro-
marginally (p < 0.00005). This illustrates that the mutant displays free vein and vein density
gradients in different axes of growth than wild-type leaves.

120
Figure 45. Regional division of warped leaf blades for statistical analysis. For all panels, the left hand leaf blade picture represents the wild-type leaf, and the right hand side leaf picture represents the mutant. (A) Regional grouping of grid sectors according to the central-marginal regions of the leaf blade. (B) Regional grouping of grid sectors according to the proximo-distal leaf axis. (C) Regional grouping of grid sectors according to the medio-lateral leaf axis. Arrows adjacent to panels B and C show the axis by which region classification was performed.
1
2
3
2
1
3 2 1 3 2 1
Central-Marginal
Proximal-Distal
Medial-Lateral

121
3.12.4 Spatial patterns of vein loop differences between Nossen and tcp8 leaves
The spatial maps give insight into how vein patterns are formed in the leaf by providing
information about vein parameters in different regions of the leaf blade. Average values for the
entire leaf blade may mask gradients that exist along the medio-lateral and proximo-distal axes
of the leaf blade (Figure 46).
Fifteen leaves per genotype were used to obtain spatial data about loop number (Figure 46,
panel A). Areas in the leaf blade that are coloured red-brown are indicative of regions in the leaf
blade that have overlapping loop data from a large number of samples (from 12-14 leaves),
whereas regions in the leaf blade that show a dark blue-light blue colouring are indicative of
regions that have overlapping loop data from fewer leaf samples (ie, 2-6) and reflect weak loop
data. Regions which show weak loop data in this panel are located on the periphery of the leaf
blade about the leaf margin for both wild type and mutant warped leaves.
Spatial maps illustrating the distribution of loop area across the leaf blade were generated
(Figure 46, panel B). Areas with darker colours from orange to red-brown are indicative of
regions in the leaf that have larger (ie in magnitude of area) loops compared to areas with blue-
green colouring. It was observed that in both wild type and mutant leaves, loops with large areas
were found in the centre of the leaf blade and smaller area loops were found peripheral to the
leaf centre. However, in the mutant, the region in which large loops were found is confined to
the extreme centre of the leaf blade, whereas in the wild type this distribution was broader. This
spatial distribution of loop size confirms the findings of Rolland-Lagan et al. (2009) for this time
point. This could mean that the mutant is delayed in development, such that at this time point,
leaf expansion has not developed to the same extent in the mutant as in the wild type, thus loops
in similar regions appear smaller in the mutant. It could also mean that in the mutant the extent
to which a vein loop can increase in size is reduced such that a vein loop subdivides to form
smaller loops at a lower threshold than in wild type. Nevertheless, in both genotypes, it is
apparent that there is a gradient in loop area from small loops in more marginal areas to larger
loops in more central regions.
The overall loop shape in different regions of the leaf blade was examined (Figure 46, panel
C). Here loop shape is defined as “length/width” (Rolland-Lagan et al. 2009), such that
according to the coloured scale, higher values (yellow-red on the colour scale) represent a high

122
length to width ratio, which is indicative of loops that are more narrow and elongated. Lower
loop shape values (green on the colour scale) represent a low length to width ratio suggesting a
wider shaped vein loop. Isotropic loops would be completely round indicating a length to width
ratio of one. In this panel, it is seen that a concave gradient exists in wild type leaves along the
proximo-distal axis, such that loops with a ratio of about 1.5 exist in the leaf tip region, whereas
the ratio increases up to about two as one moves basipetally. In other words, the vein loops
became narrower from the tip to the base of the leaf. In the mutant leaf, the trend is not quite as
clear. There almost appears to be an oblique (diagonal) gradient. Narrower vein loops exist at
the leaf tip. Wider vein loops extend out about the leaf periphery/margin, whereas centrally the
trend of narrow loops persists. At the leaf base, less narrow loops predominate. This may be
indicative of alternate mechanisms regulating loop shape development in the mutant. When
comparing the loop shapes in similar areas of the wild type and mutant, the mutant displayed
narrower loops in the distal (leaf tip) region of the leaf blade, while the wild type displayed
narrower loops in the proximal (leaf base/petiole area) region. As shown earlier, tcp8 leaves
were slightly decreased in blade length and more so in width compared to wild type, which
contributed to significantly reduced area and perimeter of the mutant. This made the mutant
leaves appear rounder than wild type leaves. The lack of organ expansion in the mutant could
contribute to altered loop shape. It is known that the cell cycling front proceeds basipetally from
the leaf tip to the base, and when cell division ceases, cell expansion is initiated in the same
gradients (Donnelly et al. 1999), thus, one would expect to find a longitudinal gradient in loop
shape.
The number of subdivided loops (defined as a loop possessing freely ending veins within it;
Rolland-Lagan et al. 2009) across the leaf blade was also examined (Figure 46, panel D). A
clear radial gradient was observed across the leaf blade. The greatest number of subdivided
loops existed in the centre of the leaf blade (14), and the number decreased with increasing
distance away from the centre of the blade, such that at the periphery, there were between 8-10
subdivided loops. At the distal leaf tip, there is a region which has an even lower number of
subdivided loops (between 4-6). The same radial gradient pattern existed in the mutant leaf
blade, however, subdivided loop number was lower. The central region containing the highest
number of subdivided loops was greatly reduced compared to wild type, and a broader region
existed with a subdivided loop number between 9-11. Also, the region in the distal leaf tip
containing the lowest number of subdivided loops was greatly expanded to about twice the area

123
found in the wild-type leaf blade, and the number of subdivided loops there was lower than in
the mutant (4 vs 6-8 in wild type). This suggests that freely ending veins show the greatest
occurrence within the centre of the leaf blade, and taper off in number towards the leaf margin.
This trend was also observed in the mutant, however as subdivided loop number is greatly
decreased thus so is freely ending vein number. This could be again due to delayed development
within the mutant.
The area of subdivided loops across the leaf blade was also mapped (Figure 46, panel E). In
the wild-type blade, a sort of radial gradient existed, in which subdivided loops with large areas
(1.6-1.8mm2) were found in the periphery of the leaf blade, and smaller sized subdivided loops
were found closer to the leaf centre (about 1.3-1.4mm2). At the leaf tip, a small area existed
where smaller sized (about 1mm2) subdivided loops were found. At the base of the leaf blade,
even smaller (0.6-0.8mm2) subdivided loops existed. This suggests that the largest loops with
freely ending veins exist in the lateral regions of the middle of the leaf, with smaller sized loops
within the leaf centre, and decreasing in size with increasing distance away from the leaf centre.
The occurrence of freely ending veins in wild type leaves is greatest within the leaf centre, yet
the subdivided loops to attain the greatest size appear at the leaf margin (Figure 46, panels D and
E).
In the mutant blade, the pattern of subdivided loop area was completely different (Figure 46
panel E). A gradient of subdivided loop area existed such that the subdivided loops with the
largest area (about 1.2-1.3mm2) were found in the central region of the leaf blade. Subdivided
loop area became progressively smaller with increasing distance from the blade centre. In other
words, the subdivided loops with the smallest area (0.4-0.8mm2) were found at the periphery of
the leaf blade. This pattern was almost identical in distribution to that of the extent of loop
subdivision. Areas in which very little subdivision was found showed tiny subdivided loops.
Areas in which a high extent of subdivision occurred showed large subdivided loops. Thus in the
mutant subdivided loop area parallels the trend on subdivided loop number; both show highest
values at the leaf centre and taper off with increasing distance from the leaf centre. This suggests
that freely ending vein production is greatest in the centre, and that organ expansion occurs in a
manner such that loops within the leaf centre experience the greatest amount of increase in size;
hence radial growth is occurring.

124
Figure 46. Spatial maps showing various vein loop parameters in wild type and mutant rosette one leaves. Wild type warped leaf is presented on the left and the mutant warped leaf is presented on the right. Loop number (A), loop area (B), loop shape (C), number of subdivided loops (D), and area of subdivided loops (E). The colour legends beside the spatial maps reflect the legend for each loop parameter.
3.13 Cell density and spacing in cauline leaves
Qualitative examination of mutant cauline leaves suggested that trichome density was
altered, therefore trichome, stomatal and pavement epidermal cell densities were quantitated for
wild-type and mutant fully expanded node 1-3 leaves. This was performed in a manner similar
to that for rosette one leaves. tcp8 cauline leaves had significantly higher adaxial trichome

125
densities for cauline leaves at nodes 1-3 compared to their wild-type counterparts, with a 2-3
fold increased number (Figure 47). Thus, TCP8 may function to repress trichome formation.
Figure 47. Trichome density quantitation in wild-type and tcp8 cauline leaves at nodes 1-3. This graph was generated using SPSS. Non-parametric Mann-Whitney U tests were performed to test for statistical significance, using a threshold of 0.05. P values are listed on the graphs. Statistically significant data is denoted by an asterisk after the p-value. The error bars represent +/- 2 SE.
To evaluate whether trichome cell spacing patterns were altered in tcp8 cauline leaves, the
trichome index (TI) was calculated for wild-type and tcp8 nodes 1-3 cauline leaves (Figure 48).
Mutant leaves had significantly higher TI values at all nodal positions compared to wild-type
leaves. TI was increased about three fold for mutant leaves at node one, 4.5 fold for mutant
leaves at node two, and about two fold for node three leaves. In both genotypes, trichome index
generally decreases with increasing nodal position. The increased trichome index of mutant
cauline leaves suggests that TCP8 may function to regulate trichome spacing by controlling
pavement epidermal cell proliferation.
p= 2.44272E-21*
p= 1.96577E-18*
p= 6.4924E-10*

126
Figure 48. Changes in trichome spacing patterns as calculated using the trichome index for wild-type
and tcp8 cauline leaves at nodes 1-3. These graphs were generated using SPSS. Non-parametric Mann-
Whitney U tests were performed to test for statistical significance, using a threshold of 0.05. P values
are listed on the graphs. Statistically significant data is denoted by an asterisk. The error bars represent
+/- 2 SE. N>25 per genotype per nodal position.
The altered shape and size of cauline leaves suggested that stomatal and pavement
epidermal cell number was altered in the mutant. There was a significant increase in stomatal
cell density in the mutant compared to wild-type cauline leaves at all positions (Figure 49 A).
The increase ranged from about 1.7 fold to 2.4 fold in mutant leaves.
There was a significant increase in pavement epidermal cell density in the mutant compared
to wild-type cauline leaves at nodes 1 and 3 (Figure 49 B). The increase ranged from about 10-
20% in mutant leaves. There were a greater number of epidermal cells in mutant cauline leaves
but they were smaller than their wild-type counterparts. Thus, TCP8 may function normally to
promote cauline leaf pavement epidermal cell expansion and restrict cell proliferation.
*
*
*
p>0.000005

127
Figure 49. Stomatal cell density (A) and Pavement epidermal cell density (B) quantitation in wild-type
and tcp8 cauline leaves at nodes 1-3. Graphs were generated using SPSS. A non-parametric Mann-
Whitney U test was performed to test for statistical significance, using a threshold of 0.05. The p values
listed on the graphs represent all statistically significant data. Statistically significant data is denoted by
an asterisk. The error bars represent +/- 2 SE. N>25 per genotype per nodal position.
To evaluate if stomatal spacing patterns were altered in mutant cauline leaves, the stomatal
index (SI) was calculated for wild type and tcp8 nodes 1-3 cauline leaves (Figure 50). SI
generally increased with increasing nodal position in both genotypes, however tcp8 mutant
cauline leaves showed significantly increased SI values at all three nodal positions compared to
wild type (p< 0.000005). SI was increased about 1.7 fold for mutant leaves at all three nodes.
This reflects a change in spacing in mutant leaves such that a greater number of stomata exist
per pavement epidermal cells as compared to wild type. From these results, it seems that TCP8
may function to regulate spacing of stomata by controlling pavement epidermal cell
proliferation.
p=0.000* p=0.000*
B
*
*
p < 0.00005
p < 5.0E-16
*
*
*
A

128
Figure 50. Changes in stomatal spacing patterns between wild-type and tcp8 cauline leaves at nodes 1-3. These graphs were generated using SPSS. Non-parametric Mann-Whitney U tests were performed to test for statistical significance, using a threshold of 0.05. Statistically significant data is denoted by an asterisk. The error bars represent +/- 2 SE. N>25 per genotype per nodal position.
3.14 A developmental framework for vascular pattern formation in cauline
leaves 1-3
Cauline leaf vein patterning was examined by performing an experiment similar to that
performed upon Nossen and tcp8 rosette one leaves. Leaves from nodal positions 1-3 were
harvested at three time points relative to the day when each individual plant had bolted. Bolting
was defined in the following manner. Day zero was defined as when a plant was observed to
have observed internode growth. Cauline leaf material for nodal positions 1-3 were harvested at
this time point, and at 24 hours and 48 hours following plant bolting (these two time points
were labelled one, and two days post plant bolting for other plants). To do this, plants were
individually monitored daily for plant bolting, and tissue was collected at appropriate time
points. Whole leaf data was collected and graphs were generated (Figure 51) using the statistical
software SPSS. For simplicity, only data for node three cauline leaves is presented here. Due to
variability in leaf size across time points for all nodes, leaf warping was not performed.
3.14.1 Cauline whole leaf parameters summary
Both genotypes showed an increase in leaf perimeter with time (Figure 51A). At the first
time point the average leaf perimeter was about 10mm, and increased to between 25 and 28mm
(for the wild type and mutant, respectively) at the last time point. The mutant leaves showed
*
*
*
p<0.000005

129
increased perimeter compared to wild type leaves on the 2nd
and 3rd
time points. This increase
was found to be significant for the last two time points.
Leaf area (Figure 51B) increased for both genotypes with time from about 4mm2 to about
30 and 28mm2 (for the wild type and mutant leaves, respectively). As with leaf perimeter, a
difference in leaf area existed on the 2nd
and third time points, but in this case, the mutant leaf
area was slightly larger on the 2nd
time point and slightly smaller on the 3rd
time point. This
increase was not found to be significant.
Leaf blade length (Figure 51C) also increased for both genotypes over time, from 3mm to
about 9mm. There did not appear to be any significant difference at any time point in blade
length between the two genotypes.
Leaf blade width was also measured for both genotypes over time (Figure 51D) and ranged
from about 1.5mm to about 3.75-4.25mm (for wild type and the mutant, respectively). No
significant difference was observed for the first time point, however for the 2nd
and 3rd
time
points, the mutant blade width was greater than that of wild type. This increase was found to be
significant only at the middle time point.
Loop number (Figure 51E) increased for both genotypes over time from 25-20 loops to 125
and 115 loops (for the wild type and the mutant respectively). At all time points, the mutant
consistently had fewer loops than the wild type. This increase was not found to be significant.
Total loop area (Figure 51F) increased over time from less than 5mm2 to 25mm
2. The
mutant showed a greater loop area at the 2nd
time point, but showed a slightly smaller loop area
at the 3rd
time point than wild type. These differences were found to be significant only at the 1st
time point.
Segment number is defined as the number of vein segments present in a leaf (Candela et al.
1999). Segment number (Figure 51G) increased over time from about 75 vein segments to
between 450 and 550 vein segments (for the mutant and the wild type respectively). For each
time point wild-type leaves had a greater segment number than the mutant. The difference in
segment number became more pronounced over time. These differences were found not to be
significant.

130
Total vein segment length (Figure 51H) increased over time from about 20mm to 150mm
for the mutant and from 20mm to 175mm in the wild type. There was no difference in total vein
segment length at the first two time points, however the mutant displayed a shorter vein segment
length at the 3rd
time point. This difference was found to be not significant.
Branch point number (Figure 51I) increased with time from about 40 branch points to about
250-450 branch points (in the mutant and the wild type respectively). At all three time points,
the mutant had fewer branch points than wild type, and this difference was enhanced over time.
This difference was found to be not significant.
Freely ending veins (Figure 51J) increased with time from about 20 to between 60 and 95
(for the mutant and wild type respectively). At the first two time points no difference was
detected between the genotypes, however the mutant had a lower number of freely ending veins
at the 3rd
time point compared to wild type. This difference was found to be significant for the
last time point.
Mean loop area (Figure 51K) increased with time from about 0.75mm2 and 0.1mm
2 (for the
mutant and wild type respectively) to 0.15mm2 and 0.175mm
2 (for the wild type and mutant
respectively). At the 1st time point the mutant had a lower mean loop area than wild type,
however at the last two time points the mutant had increased loop area compared to wild type.
These differences were found to be significant for days one and three.
Mean segment length (Figure 51L) was relatively constant for leaves at all time points at
about 0.3mm in length, however the mutant was slightly elevated at the 1st and last time points.
The maintenance of a constant length indicates that the plant may have a fundamental
mechanism in place limiting segment length such that when a vein segment reaches a certain
threshold length it forms connections (branches) with neighbouring vein segments. Mean
segment length in the mutant was significantly greater than that of wild type at the last time
point.
Vein density (Figure 51M) in the mutant was also constant over time at about 5-6mm2,
whereas the wild type density values showed more fluctuation between 6-9mm2. The wild type
had higher density values than the mutant at all time points. This difference was found to be
significant for all days.
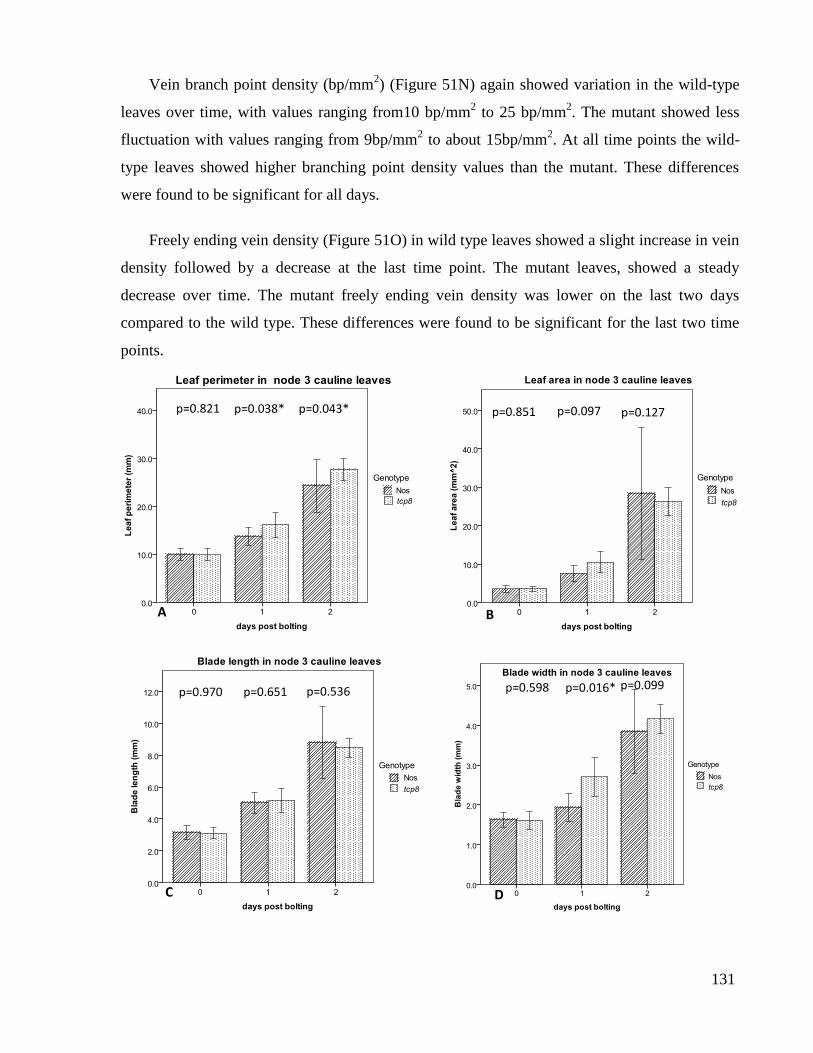
131
Vein branch point density (bp/mm2) (Figure 51N) again showed variation in the wild-type
leaves over time, with values ranging from10 bp/mm2 to 25 bp/mm
2. The mutant showed less
fluctuation with values ranging from 9bp/mm2 to about 15bp/mm
2. At all time points the wild-
type leaves showed higher branching point density values than the mutant. These differences
were found to be significant for all days.
Freely ending vein density (Figure 51O) in wild type leaves showed a slight increase in vein
density followed by a decrease at the last time point. The mutant leaves, showed a steady
decrease over time. The mutant freely ending vein density was lower on the last two days
compared to the wild type. These differences were found to be significant for the last two time
points.
A
p=0.821 p=0.038* p=0.043*
B
p=0.851 p=0.097 p=0.127
C
p=0.970 p=0.651 p=0.536
D
p=0.598 p=0.099 p=0.016*

132
G
F
p=0.428 p=0.763 p=0.322
E
F
p=0.141 p=0.880 p=0.901
F
p=0.016* p=0.274 p=0.186
H
p=0.678 p=0.598 p=0.773
I
F
p=0.336 p=0.763 p=0.342
J
p=0.806 p=0.970 p=0.029*

133
Figure 51. Whole leaf data for wild-type and tcp8 cauline leaves. For simplicity only data for node 3 position leaves is presented here. (A) leaf perimeter, (B) leaf area, (C) blade length, (D) blade width, (E) loop number, (F) total loop area, (G) segment number, (H) total vein segment length, (I) branch point number, (J) number of freely ending veins, (K) mean loop area, (L), mean segment length, (M) vein density, (N) vein branch point density, and (O) freely ending vein density. Graphs were generated using the statistical software SPSS. Error bars represent +/- 2 SE. The p values are listed in the graphs. P-
M
F
p=0.001* p=0.001* p=0.001*
N
p=0.001* p=0.004* p=0.05*
O
p=0.026* p=0.851 p<0.00005*
K
F
p=0.013* p=0.309 p=0.008*
L
p=0.386 p=0.678 p=0.001*

134
values followed by an asterisk indicate a significant difference between the samples as measured by the non-parametric Kruskal-Wallis analysis of variance (ANOVA) test using SPSS with a threshold of 0.05.
Appendix four shows perimeter, area, and vascular complexity data for all three nodes. The
same trends for vascular parameters were observed at all three nodal positions. Leaf perimeter
and area increased with time for leaves of both genotypes at all three nodes (Figure 52 A, B,
Appendix 4). Vein branch point density at all three nodes showed an increase from day 1-2, and
then a decrease from day 2-3 for leaves of both genotypes (Figure 52 N, Appendix 5). Freely
ending vein density for wild type leaves at all three nodes displayed an increase from day 1-2
and then a decrease from day 2-3. Mutant leaves showed a continual decrease from day 1-3 for
leaves at all three nodes (Figure 52O, Appendix 5). Vein density for wild type leaves at all 3
nodes displayed an increase from day 1-2 and then a decrease from day 2-3. Mutant leaves
showed constant vein density over time at all three nodes (Figure 52M, appendix 5).
Figure 52 displays all leaves sampled for node three at the three time points for both
genotypes studied. Although size variation does exist within this sample set, it was considerably
less than for nodes one and two, therefore the vein pattern analysis presented here was
performed on node three leaves only.
Figure 52. Node three cauline leaf size and shape distribution over the course of development. Wild-type (left hand side) and tcp8 (right hand side) node 3 leaves are displayed side by side. The top row displays leaves sampled on zero days post bolting, and the middle and bottom rows display leaves sampled on one and two days post bolting, respectively. Scale bar represents 5mm.
3.15.1 Leaf margin serration in tcp8 cauline leaves
tcp8 mutant cauline leaves were more serrated than Nossen leaves. Upon quantitation of
serration number, it was found that tcp8 leaves had a significantly greater number of serrations
than wild type leaves at nodes one and two. The same trend was observed in node three leaves,

135
however this difference was not found to be statistically significant. This may be simply a
consequence of a general increase in organ size in the mutant, suggesting that the increase in
serration number is a secondary effect of this mutation, and TCP8 does not directly regulate
serration formation. Another possibility is that this increase in serration number in the mutant
correlates with changes in serration spacing (or serration density) about the leaf blade.
To evaluate which of these two possibilities is correct, serration density was calculated for
wild-type and mutant leaves at all nodal positions at each time point and graphed (Figure 53A,
B, C). Wild-type leaves show two trends for serration density; node two leaves generally
maintain a constant density, while serration density in node one and node three leaves decreases
with leaf age. Mutant leaves show a slightly different pattern of serration density. Mutant node
one and node two leaves show a decrease in density over the first two time points, and serration
density remains unchanged at the last time point. In node three mutant leaves, however the
pattern of serration density mimics that of wild-type node three leaves. In general, tcp8 leaves
showed increased serration density compared to wild-type leaves mainly at the zero and two day
time points. These differences were found to be significant for nodes one and two cauline leaves
(the trend in node three cauline leaves was the same, however the extent of increase in the
mutant wasn‟t great enough to be statistically significant, again maybe due to delayed blade
growth in node three leaves compared to node one and two leaves at this time point). This
suggests a role for TCP8 in regulating the number of serrations formed about the leaf margin.
The trend of increased serration density also holds for node three leaves given that TCP8 mutant
leaves show increased perimeter and serration number in node three leaves. However, the
development of node three leaves is probably delayed relative to node one and two leaves, and
observations at a later time point (ie, day four or five post bolting) would confirm this trend for
this node position.
C
B
p= 0.015*
p< 0.00005 *
p= 0.633
A
p < 0.00005 *
p= 0.007 *
p= 0.025 *

136
Figure 53. A comparison of serration density in wild-type and tcp8 cauline leaves. (A) Serration density in node one leaves, (B) Serration density in node two leaves, and (C) Serration density in node three leaves. Graphs were generated using SPSS. Error bars represent +/- 2 SE. The p values are listed in the graphs. Asterisks indicate a significant difference between the two samples as measured by the non-parametric Mann-Whitney U test using SPSS with a threshold of 0.05.
3.15.2 The effect of IAA and NPA on leaf serration
The hormone auxin (IAA) and its transport inhibitor NPA affect the degree of rosette leaf
serration. NPA treatments cause smoothening of the rosette leaf margin, while IAA has the
opposite effect (Hay et al. 2006). Since tcp8 cauline leaves display enhanced leaf margin
serration, the effect of NPA and IAA treatment on wild-type and tcp8 node one cauline leaves
was tested. As expected, wild type node one cauline leaves showed increased leaf margin
serration with increasing IAA treatment, and increasing leaf margin smoothness with increasing
NPA treatment (data not shown). When the two treatment types were repeated on tcp8 node one
cauline leaves, the same results were found, showing that the mutants displayed no difference
from wild type in their ability to perceive either chemical (data not shown). It is possible that
auxin gradients are perturbed in the mutant, however auxin perception is intact, thus the mutant
behaves identically to wild type in response to hormone or inhibitor treatment. Another reason
for no alteration in the mutants response to hormone/inhibitor application is that the mechanism
by which placement and outgrowth of marginal serrations occurs at a time in development prior
to the hormone/inhibitor treatment, thus differences in the mutant response to the treatment may
be masked. While inconclusive, these results suggest that the mechanism by which leaf serration
is regulated by TCP8 may be independent of action by IAA, however further experiments must
be performed to substantiate this claim.
C
p= 0.175
p= 0.474
p= 0.590

137
3.16 Leaf shape differences between Nossen and tcp8 cauline leaves
The leaf index was calculated for cauline leaves at nodes 1-3 to determine if any difference
in leaf shape exists between Nossen and tcp8 cauline leaves from nodes 1-3 on days 0-2 post
bolting (Figure 54).
In general, Nossen leaves are more elongate and narrow than tcp8 leaves. The differences in
leaf shape were found to be significant for nodes one and two over the entire time course
studied, however the trend did not hold for node three leaves. This may be because node three
cauline leaves have not fully expanded, and the initial rate of development may be similar in
these leaves; thus the difference may not be apparent until a later point in time.
Figure 54. Leaf index values for wild-type and mutant cauline leaves. All three graphs illustrate differences between Nossen and tcp8. (A) leaf index values for node one leaves. (B) leaf index values for node two leaves. (C) leaf index values for node three leaves These graphs were generated using SPSS. Non-parametric Mann-Whitney U tests were performed to test for statistical significance, using a threshold of 0.05. P values are listed on the graphs. Statistically significant data is denoted by an asterisk after the p-value. The error bars represent +/- 2 SE.
C
p<0.00005* p=0.498 p=0.12
B
p=0.017*
p<0.00005* p=0.001*
A
p=0.008* p=0.001* p=0.002*

138
What is interesting to see from the leaf index values of wild-type and mutant cauline leaves
at nodes 1-3 over time is that leaf shape is relatively constant regardless of nodal position or
genotype, suggesting that a fundamental mechanism is maintained even in the mutant to prevent
aberrant growth in the medio-lateral or proximo-distal planes of the leaf blade. Although the
mutant exhibits distorted growth along one leaf axis, this distortion is constant. Polar growth
determination occurs very early in development and then that pattern is maintained during blade
expansion, such that this pattern dictates the manner in which subsequent growth occurs along
the 2-D growth planes.
3.17 tcp8 developmental phase defects
3.17.1 Light and dark treatment affects seedling development in tcp8 plants
tcp8 plants showed a delay in development (data not shown). Since the delay in transition to
adult vegetative development in tcp8 plants occurs under a 16:8 light-dark photoperiod cycle
(data not shown), any defect in tcp8 seedling development may only manifest itself under these
specific growth conditions. To evaluate whether tcp8 plants showed defects or a delay in
seedling development, wild-type and mutant seedlings were propagated on solid media for ten
days. Half of the seedlings from each genotype were propagated under continuous light
conditions, while the remaining seedlings were propagated in the dark. Root and hypocotyl
lengths were scored as a function of genetic background and light or dark treatment (Figure 55).
Under continuous light conditions, Nossen hypocotyl length was slightly shorter than that of
tcp8 (0.39cm compared to 0.4cm). Nossen root length was significantly greater than the mutant
seedlings (0.65cm compared to 0.5cm).
Under dark grown conditions, Nossen hypocotyl length was significantly greater than the
mutant (1.5cm compared to 1.2cm in wild type). One possible cause of decreased hypocotyl
length in the mutant could be defects in auxin perception, as has been previously demonstrated
by Romano and coworkers by a suppression of hypocotyl elongation in axr1-3 seedlings
(Romano et al. 1995). Root length was also significantly greater in the wild type as compared to
the mutant (1cm compared to 0.9cm). Thus, tcp8 seedlings have altered responses to growth in
the dark.
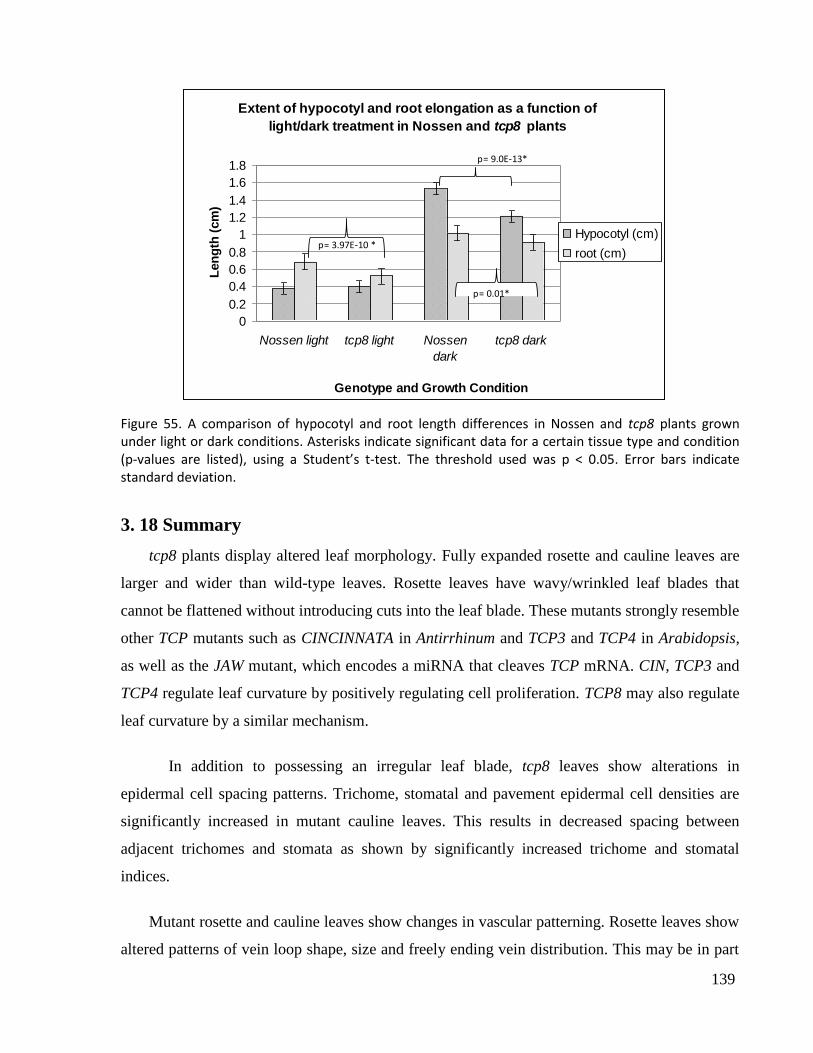
139
Figure 55. A comparison of hypocotyl and root length differences in Nossen and tcp8 plants grown under light or dark conditions. Asterisks indicate significant data for a certain tissue type and condition (p-values are listed), using a Student’s t-test. The threshold used was p < 0.05. Error bars indicate standard deviation.
3. 18 Summary
tcp8 plants display altered leaf morphology. Fully expanded rosette and cauline leaves are
larger and wider than wild-type leaves. Rosette leaves have wavy/wrinkled leaf blades that
cannot be flattened without introducing cuts into the leaf blade. These mutants strongly resemble
other TCP mutants such as CINCINNATA in Antirrhinum and TCP3 and TCP4 in Arabidopsis,
as well as the JAW mutant, which encodes a miRNA that cleaves TCP mRNA. CIN, TCP3 and
TCP4 regulate leaf curvature by positively regulating cell proliferation. TCP8 may also regulate
leaf curvature by a similar mechanism.
In addition to possessing an irregular leaf blade, tcp8 leaves show alterations in
epidermal cell spacing patterns. Trichome, stomatal and pavement epidermal cell densities are
significantly increased in mutant cauline leaves. This results in decreased spacing between
adjacent trichomes and stomata as shown by significantly increased trichome and stomatal
indices.
Mutant rosette and cauline leaves show changes in vascular patterning. Rosette leaves show
altered patterns of vein loop shape, size and freely ending vein distribution. This may be in part
Extent of hypocotyl and root elongation as a function of
light/dark treatment in Nossen and tcp8 plants
0
0.2
0.4
0.6
0.8
1
1.2
1.4
1.6
1.8
Nossen light tcp8 light Nossen
dark
tcp8 dark
Genotype and Growth Condition
Len
gth
(cm
)
Hypocotyl (cm)
root (cm)p= 3.97E-10 *
p= 9.0E-13*
p= 0.01*

140
due to delayed growth within the mutant leaf blade. As both mutant rosette and cauline leaves
display rounder leaves, it is possible that changes in vascular patterning may be tied to changes
in organ growth from polarized along the proximo-distal axis of the leaf blade to a more radial
growth pattern in the mutant, as observed for cauline leaf growth over time.
While developing mutant cauline leaves show changes in overall leaf blade shape, they are
not significantly larger than wild-type leaves (during the developmental stages observed). What
is striking is that although wild-type and mutant leaves show overall similar organ sizes, the
venation complexity is significantly decreased in the mutant, as observed by reduced freely
ending vein density, vein density and branch point density. Normally vein patterning is coupled
with leaf organ growth; smaller leaves have less vascular complexity, while larger leaves have
more complex vascular networks. The decreased vascular complexity of tcp8 cauline leaves
suggests that this gene may function to promote vascular development.
The tcp8 plants also displayed enhanced cauline leaf margin serration. This suggests that
TCP8 may function to restrict leaf margin outgrowth and regulate spacing of marginal
outgrowth, as the number of outgrowths was increased in mutant leaves, in addition to decreased
spacing between outgrowths.

141
4.0 Discussion
The genome of Arabidopsis thaliana is small and contains approximately 27 000 genes, many
of which have not been studied (Swarbreck et al. 2008). Reverse genetics is a useful tool in
order ascertain function of a candidate gene through experimental study. The TCP family
provides a large gene family for examination in Arabidopsis with 50% of family members yet
to be characterized. The growing body of information about how and when TCP genes act in
other plant species can be applied to Arabidopsis TCP family members in order to determine
their function.
4.1 TCP family members and potential functions
The TCP family is a plant-specific family of transcription factors. It has been suggested that
large scale genome duplication events prior to the evolutionary split of monocots and dicots has
led to the presence of multiple TCP genes in plant genomes (Yao et al. 2007). Many family
members have been characterized as having diverse roles in regulating various aspects of plant
architecture, including leaf and petal development, lateral branching, cell proliferation, pollen
development and germination (Nath et al. 2003; Palatnik et al. 2003; Luo et al. 1999; Doebley
et al. 1997; Finlayson, 2007; Kosugi and Ohashi, 1997; Takeda et al. 2006; Tatematsu et al.
2006).
The TCP family is divided into 2 subfamilies. Members of the CYC/TB1 subfamily regulate
plant architecture by suppressing cell division as is the case for CYCLOIDEA and TEOSINTE
BRANCHED1 (Doebley et al. 1997; Luo et al. 1999; Hubbard et al. 2002). CYC represses
CYCLIND3b expression, thus restricting cell division in dorsal areas of the flower while TB1
represses outgrowth from axillary meristems and suppresses the formation of lateral branches,
resulting in apical dominance.
The other TCP subfamily is the PCF1/2 subfamily. Members are thought to be positive
regulators of cell cycling, such as the PCF proteins. PCF1 and PCF2 activate the transcription
of the rice PROLIFERATING CELL NUCLEAR ANTIGEN (PCNA) gene, which is involved in
DNA replication and cell cycling (Kosugi and Ohashi, 1997).
TCP8, TCP14, and TCP15 belong to the PCF1/2 subfamily based on protein multiple sequence
alignments (Cubas et al. 1999). Thus, TCP8, TCP14, and TCP15 may function in a similar

142
manner by positively regulating expression of cell cycling genes to mediate downstream effects
on plant architecture. Also, based on TCP binding site screens, it is possible that TCP8, TCP15
and TCP14 may regulate auxin mediated developmental processes as several auxin responsive
genes also have a TCP binding site (Koyama et al. 2010).
The TCP14 gene has been implicated in positively regulating germination (Tatematsu et al.
2006). TCP14 mutant plants have a seed dessication defect and show delayed germination
relative to wild type. TCP14 transcripts are highly abundant immediately prior to germination,
while treatment conditions that delay germination (increasing ABA levels or decreasing GA
levels) inhibit induction of TCP14 expression. TCP14 also shows ubiquitous RNA and protein
expression in 24 and 48 hour imbibed seeds, as well as in young seedlings. This supports a role
for TCP14 in early development.
Recent studies have demonstrated a role for TCP proteins in regulation of diurnally expressed
genes and circadian clock proteins (Pruneda-Paz, 2009; Giraud et al. 2010). The TCP21 protein
which is highly homologous to TCP8 has been shown to bind to the CCA1 protein to repress its
expression (Pruneda-Paz, 2009). Also, the TCP15 and TCP3 proteins have been shown to bind
to the promoter elements of genes encoding circadian clock and diurnally expressed proteins
(Giraud et al. 2010). From these studies it is possible to hypothesize that TCP8, TCP14 and
TCP15 may function in regulating circadian rhythms.
4.2 The nature of the interaction between TCP15 and BREVIPEDICELLUS
TCP15 was identified in an enhancer trap screen for targets of the BREVIPEDICELLUS (BP)
gene. BP is a class I KNOX family gene that functions at nodes to regulate pedicel development
(Douglas et al. 2002; Douglas and Riggs, 2005). bp plants display reduced stature, altered
pedicel angle, an altered stem anatomy and the presence of a “stripe” in stems (Douglas et al.
2002). The stripe is a file of cells that initiates at nodes and extends down the subtending
internode. This term was coined due to the morphological difference of cells within the stripe
from surrounding internode cells. A GFP enhancer trap line for TCP15 (WG335) was recovered
in a screen for lines showing a nodal signature (Douglas and Riggs, 2005). WG335 expression
changes when it is crossed to a bp plant, such that its expression is extended into the stripe. The
expansion of TCP15 expression could be due to loss of BP regulation of TCP15 expression. In
wild type, BP might constrain expression of TCP15 to a small domain (the node). An

143
alternative theory to explain TCP15 expression in bp stripe tissue is that BP may function as a
boundary element (Douglas et al. 2002). In bp plants, nodal tissue identity has expanded into
the stripe cells of the subtending internode. TCP15 expression may be specific to nodal tissue,
thus a translation of nodal identity into the internode results in the expansion of TCP15
expression.
4.3 TCP15 may act as a boundary element
Based on several lines of evidence, TCP15 is predicted to serve as a boundary element. First,
the expression pattern of TCP15 as gauged by the WG335 enhancer trap line and the
TCP15::GUS reporter reveals that TCP15 expression occurs in the emerging inflorescence
within and beneath buds, at nodes, in pedicels, and in boundary zones of flowers such as valve
margins, the abscission zone, the stigma and the style.These findings are in agreement with
those of Kieffer et al. (2011) who found that TCP15 expression at pedicel/sepal boundaries, the
stem/leaf boundary, and at leaf margins using a translational fusion containing about 2Kbp of
the TCP15 native promoter driving GUS expression. Thus, TCP15 may function to delimit
boundaries between different organs.
The second reason was based on the function of a closely related ortholog of TCP15, the
Antirrhinum gene TCP INTERACTING WITH CUPULIFORMIS (TIC). Weir et al. (2003)
showed a physical interaction between the TIC protein and the NAC family protein
CUPULIFORMIS (CUP). NAC genes regulate lateral organ boundaries between the SAM and
leaf primordia (Aida et al. 1997, 1999; Vroemen et al. 2003). Mutations in CUP disrupt
boundary formation between lateral organs. Orthologues of CUP exist in Arabidopsis, where
there is greater gene redundancy. They are CUP SHAPED COTYLEDON 1, 2, and 3
(CUC1/2/3). cuc1 cuc2 double mutants result in a phenotype similar to that of cup, whereby a
continuous ring of cotyledon tissue develops at the meristem periphery instead of the two
discrete cotyledons that form in wild type (Aida et al. 1997, 1999; Vroemen et al. 2003). Based
on TCP-NAC protein interactions in Antirrhinum, we suspected that TCP15 may form such
interactions with CUC1 or CUC2. However no interaction was found using yeast 2 hybrid
assays (Riggs, unpublished data).
Two lines of evidence support the theory that TCP15 may regulate boundary formation through
modulation of NAC gene expression. Firstly, TCP15 has been shown to directly bind to the site

144
II DNA elements (conserved DNA sequences found to which TCP proteins bind, Kosugi and
Ohashi, 1997) via yeast 1 hybrid assays (Giraud et al. 2010) and protein localization using the
bioinformatic tool to visualize sub-cellular localization (cell efp browser: http://esc4037-
shemp.csb.utoronto.ca/cell_efp/cgi-bin/cell_efp.cgi) revealed that the TCP15 protein is
predicted to localize to within the mitochondria and the nucleus, thus supporting the idea that
TCP15 may function as a transcription factor. Secondly, publicly available microarray data
supports the idea that TCP14 and TCP15 may regulate CUC gene expression
(https://www.genevestigator.com/gv/user/serveApplet.jsp ) as strong up-regulation of CUC1
was found in tcp14, tcp15 or tcp14 tcp15 backgrounds in a microarray experiment performed
by Davies and colleagues (Figure 56, https://www.genevestigator.com/gv/user/serveApplet.jsp).
Figure 56. Expression map of microarray gene expression in various TCP mutant backgrounds. (Figure courtesy of Stefan Bleuler, Genevestigator Team www.genevestigator.com)
Recent work has demonstrated a role for TCP regulation of CUC gene expression (Koyama et
al. 2010). Microarray and RT-PCR data showed that the induction of a negative repressor of
TCP3 (TCP3SRDX) caused an induction of the boundary specific genes CUC1, CUC2, CUC3,
LOB and LAS. In addition to this it was observed that when TCP3SRDX was induced in cuc1
seedlings, there was a reduction in the cotyledon expansion phenotype relative to that seen in a
wild type background. Furthermore, TCP3 was demonstrated to physically bind to known TCP
protein binding elements (site II elements) within the promoter of the precursor gene for
miR164A, which is a negative regulator of CUC1 expression. TCP3 function in activating
expression of miR164A through site II binding was verified by evaluating the effect of mutation
to site II elements within the miR146A promoter on the expression of GUS reporters.
TC
P8
AG
L16
SP
L9
SP
L10
SP
L15
PA
US
ED
HA
ST
Y
SE
RR
AT
E
CU
C1
CU
C2
SP
L3
SP
L4
SP
L5
AT
GR
F7
tcp14 tcp14 tcp15
tcp15

145
While direct protein interactions between TCP15 and CUC1/CUC2 proteins were not found to
occur, TCP15 has been shown to interact with several protein partners (Giraud et al. 2010;
Viola et al. 2011). Each of these interactions may exert a different role in plant architecture,
depending on the identity of the interacting protein. This would be feasible, as TCP15 is
expressed in multiple tissue types. Work in our lab has demonstrated an interaction between the
TCP15 and TCP14 proteins (Riggs and Prouse, personal communication). It has been
demonstrated that TCP15 also binds the PRR1/TOC1 (At5g61380) and PRR5 proteins (two
circadian clock proteins) via yeast 2 hybrid assay (Giraud et al, 2010). TCP15 also binds
TCP11 via electrophoretic mobility shift assay and Yeast 2 hybrid assay studies (Viola et al.
2011).The latter study also demonstrated that the ease with which TCP proteins bind site II
elements within DNA is dependent on the type of TCP-TCP interaction they form; TCP
heterodimers form stronger complexes to DNA than TCP homodimers. Therefore it is plausible
that TCP proteins could regulate lateral organ boundaries in various plant tissues by forming
TCP protein heterodimers that regulate target gene expression.
4.4 TCP15 expression occurs throughout plant development
The use of publicly available expression map tools (Winter et al. 2007), RT-PCR experiments,
expression of the TCP15::GUS reporter and expression of the enhancer trap WG335 have
shown that TCP15 is expressed at all stages of development. Most notable are the expression
patterns at boundaries between organs (nodes, pedicels, between various floral organs);
however strong expression is also observed in various leaf structures and cell types (trichome
support cells, hydathodes, stipules, veins). TCP15 expression within veins, stipules and
serrations is highly suggestive of its function in vein patterning and marking incipient sites of
tooth formation. To assess if TCP15 was necessary for vein patterning, a quantitative analysis
of vascular patterning was performed on wild type and tcp15 rosette one leaves. However no
differences were observed in the amount or pattern of vasculature (data not shown). Leaf size in
tcp15 plants was unaltered (data not shown), and morphology did not appear to be perturbed,
however changes in marginal serrations and cell spacing were not quantitatively assessed, thus
it would be informative to examine these patterns within this mutant.
Kieffer et al (2011) have examined the effect of TCP14 and TCP15 mutation on leaf
development. This was performed by scanning leaves of various genotypes and using the Leaf
Analyser software (http://leafanalyser.openillusionist.org.uk/) to quantitate changes in leaf

146
shape. Mutant leaves were found to be broader at the leaf base and form broader and shorter
petioles. Although no other phenotype was manifest in the TCP15 and TCP14 TCP15 double
mutants, the generation of transgenic lines containing a dominant repressor of TCP14 driven by
the native TCP14 promoter (pTCP14:TCP14:SRDX) resulted in a two-fold increase in cell
density, mutliple branched trichomes and floral defects including ectopic stigmatic papillae
outgrowth from the carpel. The lack of an obvious phenotype in the T-DNA mutants may be
due to gene redundancy, however these results suggest a role for TCP14 and TCP15 in leaf
development.
4.5 A role for auxin in TCP-mediated function in plant development
Several lines of evidence suggest the involvement of auxin in TCP gene action. Annotated
sequence information in public genome databases showed that TCP15 is similar to an expressed
sequence tag in cotton predicted to encode an auxin-inducible basic helix-loop-helix
transcription factor. One study has demonstrated that a known auxin inducible gene AtGH3
(Ulmasov et al. 1995) contains TCP protein binding sites within its promoter (Kosugi and
Ohashi, 1997, 2002). These observations imply that the TCP proteins may be involved in the
transcriptional regulation of auxin-induced genes.
Another link associating TCP15 activity with auxin comes from the use of the GFP enhancer
trap WG335 as a tool to examine expression of TCP15 over development. Expression in the
leaf tracks the vasculature and clearly delimits stipules, serrations, hydathodes and the cells at
the base of trichomes. The expression pattern of WG335 in these leaf structures bears a striking
resemblance to that of the auxin accumulation reporter DR5::GUS, as shown by Aloni et al.
2003. Hydathodes are primary sites of auxin production, while trichomes are secondary sites of
auxin production (Aloni et al. 2003). TCP15 expression at these otherwise unrelated structures
maybe tied to auxin production. Therefore, either initial auxin gradients specify the location of
TCP15 expression, or TCP15 expression at all these sites specifies where auxin accumulates.
4.5.1 TCP14 and TCP15 are not regulated by the hormone auxin
The TCP15 link to auxin is intriguing. Previous studies have demonstrated the role of auxin in
both vascular patterning (Mattsson et al. 1999, 2003) and in leaf margin tooth formation
(Kawamura et al. 2010). The overlap of hormone gradients and TCP15 expression within the
leaf is highly suggestive of interplay between auxin and TCP15 in regulating leaf

147
morphogenesis and vein patterning. Examination of regulatory sites within the promoters of
TCP8, TCP14, and TCP15 genes using the Athena program
(http://www.bioinformatics2.wsu.edu/cgi-bin/Athena/cgi/visualize.pl) revealed the presence of
auxin response factor binding sites, lending support to the theory of auxin mediated regulation
of TCP genes.
Traditional auxin-inducibility assays examining transcript level as a function of auxin treatment
paired with detailed cytological studies of the WG335 expression pattern revealed no change in
expression levels or location of TCP15 with auxin addition. These results rule out the
possibility of auxin dependent regulation of TCP15 expression.
An alternative manner in which auxin and TCP gene interplay could occur would be by TCP15
expression regulating auxin-mediated vein patterning and leaf development. In this scenario,
loss of TCP15 expression would cause changes in auxin gradients, which may result in
developmental defects, such as altered vascular patterning, leaf curling, and changes to leaf
margin serration.
4.5.2 TCP14 and TCP15 regulate auxin accumulation in seedling and adult tissue
Data mining and experimental data supports the hypothesis that TCP15 and TCP14 could
regulate auxin accumulation or signalling. The effect of loss of TCP14 and TCP15 expression
on auxin accumulation was examined using the DR5::GUS reporter which detects the level of
free auxins such as IAA, NAA and 2,4-D (Sabatini et al. 1999; Aloni et al. 2003). The
expression of DR5::GUS in a wild-type background was compared to DR5::GUS levels in
multiple transgenic lines of tcp15, tcp14, and tcp14 tcp15 plants. Auxin accumulation domains
were found to be expanded and auxin also accumulated ectopically. Mattsson and colleagues
have shown that auxin accumulates in the leaf apex in the distal focus of cotyledons and rosette
leaves (Mattsson et al. 1999). The distal focus of cotyledons was expanded in tcp14, tcp15, and
tcp14 tcp15 transgenic lines. This expression persisted until three days post germination before
reverting to a wild-type pattern, however the level of auxin accumulation was still elevated as
compared to that observed in wild-type cotyledons.
Wild-type seedlings showed faint auxin accumulation at the root-hypocotyl junction however
accumulation was elevated in all mutant transgenic lines, in addition to ectopic auxin
accumulation within the hypocotyl. Expanded auxin accumulation was also observed in
148
emerging leaf primordia from young mutant seedlings, yet wild-type seedlings only showed
faint punctate expression at leaf tips and stipules. Auxin accumulation in the root was similarly
elevated in all mutant transgenic lines. The normal maxima found at the root meristem was
expanded apically in the primary root within the central vascular cylinder.
The expanded domain of auxin accumulation in tcp14, tcp15 and tcp14 tcp15 cotyledons
resembled that of seedlings propagated on polar auxin transport inhibitors such as NPA and
TIBA (Sabatini et al. 1999; Bao et al. 2004). PIN1 encodes a transmembrane protein that
functions in basipetal efflux of IAA from shoot tissue and in early development to drain auxin
out of the cotyledons (Okada et al. 1991). This is necessary to maintain appropriate auxin
gradients, through which correct vascular and embryo apical-basal patterning occurs (Benkova
et al. 2003). It is possible that the enhanced auxin maxima detected in tcp14 tcp15 plants is a
consequence of reduced basipetal transport of auxin. This suggests that TCP14 and TCP15 may
function to promote auxin flux by influencing PIN1 expression.
Loss of TCP14 and TCP15 expression resulted in expanded auxin accumulation in almost all
tissue types in all stages of development, suggesting that these TCP genes function throughout
development to regulate auxin levels. This is plausible, as TCP14 and TCP15 expression is
found in all stages of development (Winter et al. 2007). Auxin accumulation was found to be
dramatically enhanced during adult development of tcp14, tcp15, and tcp14 tcp15 plants. In
wild-type plants auxin accumulation in floral development is normally only observed in the
anthers of stamens. In tcp14, tcp15, or tcp14 tcp15 backgrounds, auxin accumulation expanded
into the gynoecium walls, the ovules, and petals of younger buds. How this affects overall floral
morphology isn‟t clear, as fully mature stage 12 tcp15 flowers did not appear to be defective in
organ placement or number (data not shown). Therefore, as in the seedling stage of
development, TCP14 and TCP15 are necessary for restricting auxin accumulation, which could
occur by promoting auxin flux, by restricting auxin synthesis, or by enhancing auxin
conjugation.
TCP-mediated regulation of auxin perception and downstream processes are observed in
Arabidopsis (Finlayson, 2007; Aguilar-Martinez et al. 2007). One such example is auxin
dependent control of apical dominance. Normally, apically derived auxin acts as signal to
prevent bud outgrowth and axillary branching at lower buds. Decapitation or other methods to

149
prevent auxin signalling result in bud outgrowth activation and lateral branches form. Lateral
branching is negatively regulated by two closely related genes TCP18/BRC1 and TCP12/BRC2
in the pathway downstream of the MAX genes by suppressing bud outgrowth (Stirnberg et al.
2002; Finlayson, 2007; Aguilar-Martinez et al. 2007). Data supporting the claim that BRC1
functions in an auxin dependent pathway regulating branching comes from decreased BRC1
transcripts in buds of the auxin perception mutant axr1, and increased BRC1 transcript levels in
buds from the transgenic auxin over-producer 35S::YUCCA (Finlayson, 2007). Therefore auxin
perception allows BRC1 to repress axillary branching. Thus it is conceivable that TCP14 and
TCP15 are operating to regulate an aspect of plant development through an auxin-dependent
pathway.
A second example of TCP-mediated regulation of auxin signalling was observed by the effect
of TCP3 repression on the expression of components of the auxin signalling pathway (Koyama
et al. 2010). Such components include SMALL AUXIN UP RNA (SAUR) and IAA3/SHY2
(INDOLE-3-ACETIC ACID/ SHORT HYPOCOTYL2). Both IAA3 and the SAUR homolog
At1g29460 are direct targets of TCP3 action due to direct binding of the TCP3 protein to site II
elements within the promoters of these genes as examined via the ChIP assay (Koyama et al.
2010). IAA3, SAUR and SAUR orthologues showed reduced expression in mutants that repress
TCP3 activity or over-express the microRNA regulator of TCP3 transcript level. These two
studies lend credence to the hypothesis that TCP14 and TCP15 may be regulating auxin
perception.
TCP14 has been implicated in regulating seed germination. It is expressed ubiquitously in
imbibed seeds and young seedlings (Tatematsu et al. 2006). Mutants have delayed germination
due to seed dessication defects. It is intriguing that auxin accumulation in tcp14 plants is
detected within the ovules of mature flowers, suggesting seed dessication defects could be
attributed to inappropriate concentrations of auxin within the gynoecium. It is unclear whether
inappropriate auxin accumulation in the ovules of the gynoecium is the direct result of defective
TCP14, or a secondary consequence, such as the enhancement of ethylene levels by ACC, a key
ethylene biosynthetic gene which stimulates auxin transport (Negi et al. 2008).
To evaluate if auxin transport is altered in the mutants, auxin flux rates could be compared by
measuring the rate of radiolabelled IAA transport from the shoot to root tissue in wild-type and

150
tcp14, tcp15, and tcp14 tcp15 plants. PIN1 expression could also be compared within these
genotypes, to determine if altered flux rates can be attributed to changes in the level of PIN1
expression. Normal auxin maxima could be restored by transforming tcp14/tcp15 plants with a
constitutive over-expresser of PIN1.
Alternatively, the levels of conjugated auxins could be perturbed in TCP mutants. TCP14 or
TCP15 may promote auxin conjugation, causing increased levels of free auxin in the TCP
mutants. Thus, the relative levels of free and conjugated auxins could be compared between
wild type and the TCP single and double mutant plants of comparable age and tissue samples to
see if differences exist at this level. TCP14 and TCP15 might regulate the expression of genes
encoding auxin conjugating enzymes.
Another possible reason for expanded auxin accumulation within TCP mutants could be due to
alterations in the expression of auxin signalling molecules. Prolonged activity of the auxin
reporter DR5::GUS has been demonstrated in the auxin response mutant arf6 (Rubio-Somoza et
al. 2009). ARF6 promotes floral organ development and bud opening by repression of class I
KNOX genes (Tabata et al. 2010). arf6 plants lack the recognition site for its regulator miR167
(Rubio-Somoza et al. 2009). Thus it is possible that ARF6 or miR167 may be perturbed in a
TCP14/15 mutant background, resulting in an expansion of auxin accumulation. Support for
this theory comes from microarray data available from Genevestigator
(https://www.genevestigator.com/gv/user/serveApplet.jsp ) showing that TCP15 transcript level
is increased in arf6 plants.
4.5.3 NPA alters auxin accumulation and TCP15 expression in cotyledons and leaves
Chemicals such as NPA and TIBA are known polar auxin transport inhibitors (Zettl et al.
1992). Treatment with these chemicals prevents polar auxin efflux. Disruption of polar auxin
transport causes multiple physiological changes in the plant. One example of changes in plant
physiology associated with inhibiting polar auxin flux is the resulting increased leaf
vascularization in three regions of the leaf bade (Mattsson et al. 1999; Sieburth 1999). Multiple
parallel strands of vasculature are formed in the central midrib region (replacing the normally
occurring single central midvein). Increased vascularization also occurs about the leaf margin
(forming a thick band of tracheary elements). Lastly, the number of veins that form connections

151
from the band of tracheary elements at the leaf margin to those in the midrib region increases.
There is also a loss of connectivity between the leaf and plant stem vasculature.
Inhibiting polar auxin transport changed TCP15 expression patterns as reflected by WG335
expression (Figure 27). Control seedlings showed a normal TCP15 pattern as observed
previously (expression in the true leaves and roots, but not in the cotyledons). Addition of even
10µM of NPA or TIBA was sufficient to cause ectopic TCP15 expression in cotyledon and
petiole vasculature, whereas it caused an attenuation of expression in domains where TCP15
was normally expressed (rosette leaves). Rosette leaf expression was confined to the base of
trichomes and in the multiple parallel strands of vasculature that formed in the place of the
midrib. NPA-treated plants did not show any other defects that can be associated with TCP15
mis-expression.
Normal auxin accumulation patterns are perturbed by disrupting polar auxin transport. In wild-
type plants, normal auxin accumulation occurs at the tips of cotyledons and in a punctuate
pattern around the leaf margin in the stipules and hydathodes (Mattsson et al. 1999, Aloni et al.
2003, Figure 28). NPA treated cotyledons and true leaves show expanded auxin accumulation
around the leaf margin which is confined to the thick band of tracheary elements located there.
NPA treatment disrupts the parallel expression patterns of WG335 and DR5::GUS in true
leaves. True leaves of NPA treated seedlings show auxin accumulation occuring in the thick
band of tracheary elements that forms close to the leaf margin, but not in the multiple strands of
vasculature formed in the midrib region of these leaves (Figure 28). However, NPA application
of WG335 plants shows that TCP15 expression is confined to the vasculature of midrib region,
and is not expressed in the marginal band vasculature (Figure 27).
While TCP15 vascular specific expression is altered upon NPA treatment, vascular patterning is
not dependent on TCP15 expression. tcp15 plants did not display any leaf defects (ie changes in
leaf shape/size, vein pattern), nor did they show changes in amount of vasculature (ie. vein
complexity, freely ending vein and vein density values- data not shown). This suggests that
while TCP15 expression is strongly associated with leaf vasculature, and can be altered by
restricting auxin flux, normal vascular patterning is not directly dependent on TCP15
expression.

152
To determine if auxin transport is responsible for correct TCP15 expression, TCP15 expression
could be evaluated using the chemical NOA, which specifically blocks auxin influx within cells
(Friml and Palme, 2002) or crossing WG335 plants to the auxin influx mutant aux1 (Pickett et
al. 1990). Should defective auxin transport result in decreased TCP15 expression, then NOA
treated/AUX1 mutant plants should display a TCP15 expression pattern similar to that seen in
NPA treated plants.
Disruption of auxin flux does alter patterning of leaves, however whether changes in TCP15
expression occur as a direct consequence of changes in auxin transport, or a secondary
consequence due to changes in leaf patterning (such as leaf epinasty and alterations in
vasculature at the leaf margin and midrib region) is unclear. This could be resolved by
examining TCP15 expression and auxin accumulation (using the DR5::GUS reporter)
simultaneously, by generating transgenic WG335 plants harbouring the DR5::GUS reporter
and examining both TCP15 and auxin accumulation simultaneously over the course of leaf
development.
4.6 Rosette leaf morphology differences between wild type and tcp8
tcp8 rosette one leaves showed no difference in shape from wild type. The leaf index (length:
width ratio) for both genotypes was approximately one, indicating that these leaves are round.
The next few rosette leaves formed in mutant plants also exhibited no difference from wild
type. Both genotypes showed smooth leaf margins and relatively round leaf blades. However,
later formed tcp8 rosette leaves exhibited increased width compared to wild type, producing
rounder leaves with a larger perimeter and area. While the overall number of organs (rosette
leaves) was unchanged, the manner and rate in which they developed was clearly affected,
suggesting leaf heteroblasty is compromised in mutant plants.
Heteroblasty is defined as “a phenomenon in which several morphological traits of leaves
change along with phase change” (Usami et al. 2009). Some examples of these traits include
leaf margin serration, the presence of abaxial trichomes, leaf blade shape, and the extent of cell
proliferation and cell expansion. The first few leaves initiated by the plant are round, form a
smooth margin, and produce trichomes on their adaxial surface. Subsequent leaves are less
round, produce marginal serrations and hydathodes and initiate trichome formation on their
abaxial side. The formation of abaxial trichomes is a marker of adult leaf identity, and marks a

153
phase change from the juvenile to the adult stage of development. Cell number and cell size has
also been used as a measure of leaf heteroblasty. Leaves produced at higher nodes/later
plastochrons exhibit increased cell number and cell size reduction (Usami et al. 2009).
Mutant leaves also exhibited increased curvature. tcp8 leaves showed waviness/undulations in
the leaf blade and could not be flattened without introducing cuts into the leaf blade. Both
increased width and increased curvature in tcp8 leaves could have been due to non-uniform
increased cell division or cell expansion.
Leaf curvature is regulated by a basipetal wave of cell proliferation arrest that occurs in a weak
convex pattern during leaf development (Nath et al. 2003). Studies have shown that TCP
encoding genes in Arabidopsis, Antirrhinum and tomato function to promote this pattern of cell
proliferation during leaf growth (Nath et al. 2003; Crawford et al. 2004; Palatnik et al. 2003,
2007; Ori et al. 2007). The timing and location of cell division arrest and cell differentiation is
tightly controlled by the microRNA miR319/JAW, which targets TCP genes‟ mRNA (TCP 2, 3,
4, 10 and 24) for cleavage. Increased leaf curvature occurs due to a disruption of the
coordinated programs of cell division and differentiation in miRJAW resistant TCP mutants.
The CIN mutant of Antirrhinum has a wavy leaf phenotype reminiscent of that seen in tcp8
leaves in Arabidopsis (Nath et al. 2003). cin plants display increased leaf curvature due to a
retardation of the basipetal moving cell cycle arrest front such that the pattern of cell division
changes to strongly concave. This results in extended cell proliferation at the leaf margin
causing the crinkly/wrinkly leaf phenotype. It has been suggested that CIN functions to
sensitize cells at the cell division arrest front to cell cycle arrest signals (Nath et al. 2003). Like
CIN, TCP8 may function to sensitize basal leaf marginal areas, specifically targeting cell cycle
arrest to promote zero curvature in the leaf blade.
4.7 tcp8 leaves show changes in epidermal cell proliferation and expansion
While leaf morphology is altered in tcp8 plants, cell morphogenesis is not. Trichome,
epidermal, stomatal and leaf margin cell morphology were unaltered from wild type. Leaf
morphology changes in the mutant are due to changes in the balance of cell proliferation and
differentiation. In tcp8 rosette one leaves, epidermal cell proliferation was restricted and
epidermal cell expansion was enhanced (tcp8 leaves showed a 10% decrease in cell number
compared to wild type leaves, Figure 42). TCP8 may act to limit organ size by regulating the

154
epidermal cell division- epidermal cell expansion balance in favour of promoting cell division
and restricting cell expansion.
Wild-type cauline leaves are narrow, elongate structures. tcp8 mutant leaves displayed slightly
increased leaf blade length and increased leaf blade width compared to wild type. As a result,
fully expanded mutant leaves had a greater area and perimeter than wild-type leaves.
Fully expanded tcp8 cauline leaves at nodes 1-3 displayed both increased leaf size and
epidermal (pavement cell) cell density. Thus, while both cauline and rosette leaf size is
increased in the mutants, TCP8 regulates organ expansion by different mechanisms in different
organs. TCP8 may function to suppress organ enlargement by restricting cell proliferation in
cauline leaves, whereas in rosette leaves, organ enlargement is suppressed by restricting cell
expansion. Therefore TCP8 may regulate leaf heteroblasty by affecting the balance of cell
division and expansion.
One family of genes affecting the balance of cell division and expansion is the SQUAMOSA
PROMOTER BINDING LIKE PROTEINS (SPL) family of genes. This family of genes encode
transcription factors that contain a conserved DNA binding domain that was first identified
within the promoter of the SQUAMOSA gene in Antirrhinum (Usami et al. 2009). SPL9/10
15(SPL9/10/15) have been implicated in regulating leaf size, shape and serration through
regulation of cell size and number (Usami et al. 2009; Wu et al. 2009). Mutations that render
SPL genes insensitive to target cleavage by the SPL transcriptional regulator miR156 (such as
spl15), or over-expression of SPL genes (such as SPL3 and SPL4) cause accelerated
heteroblasty, whereby mutant leaves produce a greater number of cells with decreased cell size
than wild type (Usami et al. 2009).
Another class of genes demonstrated to be important for regulating leaf shape are the
Arabidopsis GROWTH REGULATING FACTORS (AtGRF) family (Kim et al. 2003; Horiguchi
et al. 2005). These genes are believed to encode transcription factors that contain putative
nuclear localization sequences and a zinc finger motif believed to be important for DNA
binding (Kim et al. 2003). Genes such as AtGRF7 and AtGRF9 regulate polar expansion along
the proximal-distal and medio-lateral planes of the leaf blade via modulation of cell
proliferation and cell expansion (Kim et al. 2003). These genes are under microRNA regulation
by miR396. Over-expression of miR396 results in narrower leaves possessing fewer but larger

155
cells. This change in leaf morphology is phenocopied by loss of function higher order Atgrf
multiple mutants (Usami et al. 2009).
TCP8 could be functioning within an SPL or GRF mediated pathway to regulate leaf shape and
cell proliferation and expansion. Publicly available microarray data shows that TCP8, SPL3,
SPL4, and AtGRF7 are strongly down regulated in the phytochrome mutant PHB1
(https://www.genevestigator.com/gv/user/serveApplet.jsp, Figure 59). This suggests that light-
mediated changes in leaf growth may occur by modulating expression of these genes
4.8 Changes in cell densities in tcp8 cauline leaves results in cell spacing
differences
tcp8 cauline leaves displayed increased adaxial stomatal and trichome cell densities compared
to wild-type leaves at all three nodes, indicating that TCP8 may function to limit stomatal and
trichome cell number. Neither stomatal nor trichome density were altered in tcp8 rosette one
leaves, suggesting that the mechanism regulating stomatal and trichome density formation in
rosette leaves is different from that in cauline leaves.
The increased epidermal, stomatal, and trichome cell densities altered the spacing pattern of
these cell types on tcp8 cauline leaves. The spacing patterns of these various cell types were
measured using the stomatal index (SI) (Ceulemans et al. 1995; Royer, 2000) and the similarly
defined trichome index (TI). SI generally increased with increasing nodal position in both
genotypes, while TI decreased with nodal position for both genotypes. Both the stomatal the
trichome indices were found to be significantly increased in mutant cauline leaves at all nodes
compared to the wild type.
TCP8 may function to repress adaxial trichome formation specifically in cauline leaves by
promoting leaf heteroblasty and adult leaf traits in later formed rosette and cauline leaves. This
contention is supported by the observation that adaxial trichome number decreases with
plastochron number (Marks, 1997). The increased adaxial trichome density in adult leaves
suggests that juvenile identity is prolonged in later formed leaves.
Both biotic and abiotic factors affect SI. Biotic factors include changes in cell division activity
of guard cell precursors such as the amount of meristemoid mother cell divisions, the amount of
symmetric pavement epidermal cell divisions, and the amount of asymmetric meristemoid cell

156
divisions (Nadeau and Sack, 2008). This affects the numbers of both stomata and pavement
epidermal cells formed.
A genetic factor that has been shown to regulate stomatal patterning is the MADS family gene
AGAMOUSLIKE16 (AGL16). AGL16 expression is found within guard cells and trichomes
(Kutter et al. 2007) and is regulated by the microRNA miR824. Disruption of miR824 results in
increased stomatal density and higher order stomatal complexes (groups of cells containing
multiple cells at various stages of guard cell differentiation without intervening non-guard
cells). Conversely, lower AGL16 levels lead to simplified stomatal complexes. This suggests
that AGL16 prevents pavement epidermal cell differentiation fate. TCP8 could be functioning
upstream of AGL16 to repress guard cell differentiation. Data mining of publicly available
microarray data revealed overlapping expression of AGL16 and TCP8 in juvenile and adult
rosette leaves and in the hypocotyl (https://www.genevestigator.com/gv/user/serveApplet.jsp).
Disruption of TCP8, AGL16, or its microRNA regulator miR824, would result in modified
stomata complexes. To verify that TCP8 functions to regulate stomatal spacing upstream of
AGL16, the expression of AGL16 could be compared in wild-type and tcp8 leaves to examine if
AGL16 expression is increased. Should AGL16 levels be altered in tcp8 leaves, transformation
of mutants with a construct driving leaf specific over-expression of AGL16 might restore
stomatal spacing.
Different mechanisms control spacing patterns for stomata and trichomes. Stomatal cell spacing
is dependent on a cell lineage based series of asymmetric cell divisions (Nadeau and Sack,
2008) and lateral inhibition to maintain a one-cell spacing rule (Hara et al. 2007), while
trichome spacing is dependent on lateral inhibition through the interaction of activator and
inhibitor molecules (Hulskamp, 2004). TCP8 may control trichome and stomatal cell spacing
by regulating intervening pavement epidermal cell number and size. Thus, TCP8 may function
to promote the expansion of pavement epidermal cells, and restrict the formation of stomatal
and trichome cells. Figure 57 shows a schematic of proposed TCP8 function in regulating cell
spacing patterns. This model illustrates that changes in stomatal and trichome spacing can be
accounted for by the level to which TCP8 regulates cell proliferation events leading to trichome
and stomatal cell formation.

157
Figure 57. TCP8’s proposed role in regulating cell spacing patterns. The repression arrows pointing towards stomatal and trichome cell proliferation are heavily weighted to represent a greater restriction on trichome and stomatal cell formation than on epidermal cell formation.
4.9 TCP8 controls cauline leaf margin development
Shallow serrations exist about the wild-type leaf blade margin, whereas tcp8 cauline leaves
display enhanced serration. This could reflect a decrease in cell proliferation at the sinus region,
or an increase in cell cycling at the tooth tip, as shown by Kawamura et al (2010). The role that
cell proliferation plays in altered margin development in tcp8 cauline leaves should be
examined. Reporter gene expression of a marker of cell cycling (such as AtCyclin1A, Ferreira et
al. 1994 or HISTONE H3) could be monitored in wild type and tcp8 cauline leaves. Patterns of
cell proliferation could be compared between Nossen and tcp8 leaf margins to evaluate if
increased leaf margin serration in the mutant is due to changes in cell cycling levels in the tooth
tip, the sinus or the intervening region of tcp8 margins. This would confirm if increased leaf
margin serration in the mutant is due to differences in the pattern of cell division.
The mutant leaf margin also exhibited a greater number of leaf margin teeth (serrations). This
suggests that TCP8 regulates the placement of marginal teeth by controlling the spacing
between successive teeth. TCP8 could function to limit serration formation by negatively
regulating the placement of marginal teeth. This could occur by promoting non-tooth cell
number and/or non-tooth cell expansion. A more rigorous SEM examination of leaf margin
development of both Nossen and tcp8 leaves should be undertaken as in Kawamura et al. 2010.
The serration tips, cells of sinus, and intervening cells of teeth should be examined at defined
leaf lengths (ie 100µm, 200µm, 250µm). This would be useful in determining if differences
TCP8
Cell Proliferation
Pavement Cells
Stomatal
Cells
Trichome
Cells
stomatal cell spacing trichome cell spacing

158
exist in the pattern and formation of serrations between wild-type and tcp8 cauline leaves. Also,
the cells of the different regions of the tooth could be examined for morphological differences
(size/shape/density).
The pathway in which TCP8 functions to regulate leaf margin serration should be explored.
This could be done by creating pair-wise mutants with known regulators of leaf margin
development. Some candidates that have been previously shown to influence leaf margin
development include genes regulating cell division, such as NAC and KNOX family genes,
genes involved in auxin perception, and the SERRATE gene.
NAC family genes regulate leaf margin development by promoting outgrowth and formation of
serrations in simple leaves (Nikovics et al. 2006; Kawamura et al. 2010), and leaflets and lobes
in compound leaves (Blein et al. 2008; Berger et al. 2009). Members of this family include
CUP SHAPED COTYLEDON1 and 2 (CUC1/CUC2) in Arabidopsis, CUPULIFORMIS (CUP)
in Antirrhinum (Aida et al. 1997, 1999; Vroeman et al. 2003; Weir et al. 2003), and GOBLET
(GOB) in tomato (Berger et al. 2009). CUC1, CUC2 and GOB are regulated by the microRNA
miR164 (Nikovics et al. 2006; Kawamura et al. 2010; Berger et al. 2009). Increased
CUC1/CUC2 accumulation results in increased leaf margin serration due to enhanced tooth
outgrowth (Kawamura et al. 2010). Conversely, over-expression of miR164 within leaves
results in smoother margin.
Differences between the formation of a leaflet, a lobe or a serration could depend on the
different capacities of cells to respond to NAC gene expression. This could be due to interaction
with other factors regulating growth, such as TCP proteins which limit growth and prevent
leaflet formation, which has been demonstrated by interactions between the TCP protein TIC
and CUP to form lateral organ boundaries (Weir et al. 2003).
CUC1/CUC2 and TCP8 may be functioning in the same pathway to regulate leaf margin
development. TCP8 could be directly regulating CUC1/CUC2 expression as has been shown
for TCP3 (Koyama et al. 2010) by binding to site II elements present within the promoters of
CUC1 and CUC2. Mutations in TCP8 would perturb CUC1/CUC2 expression. To determine if
this is occurring, CUC1/CUC2 levels in tcp8 cauline leaves could be examined either using RT-
PCR/in situ hybridization, or using a GUS/GFP reporter of these two genes (CUC1::GUS or

159
CUC2::GUS). If TCP8 is functioning in the same pathway as CUC1/CUC2 to regulate leaf
margin development, then CUC1/CUC2 levels should be increased in tcp8 leaves.
The hormone auxin is important for leaf development in both vein patterning and predicting
sites of marginal serrations. A recent study has demonstrated that the hormone auxin marks
sites for tooth initiation (Kawamura et al. 2010). Previous studies have demonstrated that auxin
maxima levels and location are dependent on normal CUC2 activity (Vernoux et al. 2000; Aida
et al. 2002; Furutani et al. 2004). This agrees with the finding that decreased leaf serration in
cuc1 cuc2 plants is a result of decreased auxin maximas (Kawamura et al. 2010). Increased
margin serration in tcp8 leaves could be due to alterations in auxin accumulation. It would be
informative to examine if auxin accumulation patterns are altered in a tcp8 background using
the DR5::GUS reporter. This would confirm that TCP8 is functioning to position leaf margin
teeth through patterning sites of auxin accumulation. Also, auxin gradients could be examined
to see if they contribute to spatio-temporal changes in vascular patterning in tcp8 leaves.
Another study has demonstrated the role of the auxin IAA in promoting leaf margin serration.
The addition of NPA to rosette leaves smooths leaf margins, while IAA application produced
leaves with a greater number of serrations than an untreated leaf (Hay et al. 2006). I repeated
this experiment on expanded wild-type and tcp8 node 1 cauline leaves to determine if TCP8
action on serration occurs in an auxin-dependent pathway. No differences were observed
between wild type and mutant samples upon either IAA or NPA treatment. From these results it
is unclear whether tcp8 cauline leaves form an extensively serrated margin in an auxin
independent pathway, or that this treatment was performed at too late a developmental time
frame to render changes in margin status in the mutants.
KNOX genes are known regulators of compound leaf development. KNAT1/BP gene expression
is actively excluded from developing organ primordia in order to repress compound leaf
development in Arabidopsis (Lincoln et al. 1994; Chuck et al. 1996; Bryne et al. 2000). This
occurs by the action of genes such as ASYMMETRIC LEAVES1 (AS1) (Bryne et al. 2000). as1
plants show an expansion of BP gene expression into leaf cells (within leaf serrations and
hydathodes), causing the formation of ectopic meristems upon the leaf surface and lobing of the
leaf margin (Bryne et al. 2000). This phenotype and ectopic BP gene expression is also
observed in other serrated leaf margin mutants such as BLH2/SAWTOOTH1 (SAW1) and

160
BLH4/SAW2 (Kumar et al. 2007). This suggests that AS1, SAW1 and SAW2 may function to
regulate leaf margin serration by repressing BP expression in leaves.
Ectopic expression of KNOX genes in leaves has not only been associated with altered leaf
morphology but also with expression changes in auxin inducible genes (Tsiantis et al. 1999;
Scanlon et al. 2002; Zgurski et al. 2005). This was demonstrated by the change in BP
expression in the auxin perception mutant axr1 and in the AS1 mutant (Hay et al. 2006). Ectopic
BP expression was found in the tips of serrations in axr 1-3 leaves, in the midrib, petiole and
tips of serrations in as1-1 leaves, and in the margin cells of sinuses of all lobes in axr1 as1
leaves. This suggests that BP expression is excluded from leaves by the independent action of
AXR1 and AS1. This finding also suggests that KNOX gene expression affects the pathway in
which auxin gradients pattern leaf shape, but the manner of this interaction has not been
defined.
Normally leaf serration is observed in later formed leaves. The SERRATE (SE) mutant displays
enhanced serration in all juvenile leaves (Clarke et al. 1999). SE encodes a C2H2 type zinc
finger protein (Prigge and Wagner, 2001) and has been found to form part of the RISC (RNA
induced silencing complex) protein complex including DICER-LIKE1 (DCL1), HUA
ENHANCER1 (HEN1), ARGONAUTE1 (AGO1), and HYPONASTIC LEAVES1 (HYL1)
proteins (Yang et al. 2006). This protein complex functions in RNA processing by producing
microRNA. SE is thought to be a global regulator of RNA processing as various miRNAs such
as miR157 (targets SPL10), miR159 (targets MYB33), miR164 (targets CUC1/CU2), miR165
(targets PHABULOSA, REVOLUTA), miR166 (targets PHAVOLUTA), miR167 (targets ARF8),
and miR168 (targets AGO1) show decreased accumulation in a se background (Laubinger et al.
2008). Thus, it is possible that the serrated leaf phenotype in serrate plants is consequence of
the mis-regulation of one or more targets of microRNA activity.
tcp8 leaves may display enhanced leaf margin serration due to reduced levels of SERRATE.
This would result in decreased microRNA-mediated regulation of gene expression. A
consequence of this would be an expansion of CUC expression and CUC mediated auxin
maxima production, and therefore result in greater leaf margin serration. This could be verified
by examining SE expression in tcp8 leaves. If decreased levels of SE are found compared to

161
wild type leaves, transforming tcp8 plants with an over-expresser of SE may ameliorate this leaf
phenotype.
Several members of the TCP family have been shown to regulate leaf margin serration. Gain of
function mutations within the tomato TCP gene LANCEOLATE (La) results in prolonged La
expression (Ori et al. 2007). This causes extended periods of leaf growth at the leaf margin
leading to extensive lobing. This mutation results in decreased regulation of the La transcript
by miR319/JAW. As described previously, TCP8 may function to repress leaf margin serration
through restriction of cell proliferation.
4.10 TCP8 regulates dark-mediated growth processes
Etiolated seedlings exhibit a classic triple response when grown in the dark. The hypocotyl
becomes elongated, roots display decreased elongation, and an apical hook forms. This has
been attributed to action by the hormone ethylene (Ellison et al. 2011). Light-dark treatment
studies revealed significant differences in shoot and root growth in tcp8 seedlings as compared
to wild type. Hypocotyl length differences between wild-type and mutant seedlings was
negligible in light treatment conditions, however, mutant seedling hypocotyl length was
significantly reduced as compared to wild type following dark treatment. This suggests that
TCP8 may function to promote hypocotyl elongation in the dark. The effect of dark versus light
treatment on root growth in tcp8 seedlings had the opposite effect. tcp8 seedlings showed a
significantly shorter root length compared to wild type grown in light conditions. Dark
treatment caused less of a disparity in root length between the genotypes. Diurnal expression
patterns show that TCP8 is strongly expressed at night (Giraud et al. 2010). This suggests that
TCP8 may function at night to promote hypocotyl growth. This alteration in hypocotyl growth
in tcp8 dark grown seedlings may be due to decreased ethylene levels. Ethylene has been
demonstrated to promote auxin transport within the root to cause primary root elongation and
lateral root formation, as these processes are disrupted in the ethylene biosynthetic mutant acc
(Negi et al. 2008). Decreased ethylene levels could explain the shortened root in light-grown
tcp8 seedlings. Alterations in root elongation in light grown tcp8 seedlings may be due to
elevated auxin levels, which in light conditions have been shown to inhibit root growth
(Romano et al. 1995). This could be verified by examining IAA levels in wild-type and mutant
light-grown roots. If IAA levels are elevated, it could be due to cross regulation of auxin
transport by ethylene.

162
Publicly available microarray data also shows that TCP8 is down-regulated in the DE-
ETIOLATED3 (DET3) mutant (https://www.genevestigator.com/gv/user/serveApplet.jsp). One
of the phenotypes of det3 plants is shortened hypocotyls in dark grown seedlings (Cabrera et al.
1993). DET3 encodes a subunit of a V-ATPase, which is a proton pump thought to be
responsible for proton translocation and proton coupled active transport across the cell
membrane (Schumacher et al. 1999). This mutant shows a defect in cell expansion. It is
possible that TCP8 may function in the same pathway as DET3 to promote hypocotyl
elongation in the dark. This could be examined by comparing DET3 expression in wild-type
and tcp8 mutant hypocotyls. If DET3 levels are perturbed in tcp8 plants, the effect of
transforming such plants with a constitutively expressed copy of DET3 may ameliorate this
phenotype.
Data mining of publicly available microarray results revealed interesting trends in TCP8
expression in various mutant backgrounds of key regulators of circadian rhythms such as
CICRCADIAN CLOCK ASSOCIATED1 (CCA1) and LATE ELONGATED HYPOCOTYL1
(LHY1) (https://www.genevestigator.com/gv/user/serveApplet.jsp). TCP8 expression was
down-regulated in the lhy21 cca1-11 double mutant, suggesting that TCP8 functions to regulate
circadian rhythms in a path downstream of these two genes. Similar investigations of TCP8
expression in phytochrome mutant backgrounds revealed that TCP8 expression is slightly
down-regulated in the PHY-INTERACTING FACTOR (PIF) pif1 pif 3 pif 4 pif 5 quadruple
mutant grown in the dark and transiently exposed to red light
(https://www.genevestigator.com/gv/user/serveApplet.jsp). These factors are phytochrome
interacting bHLH transcription factors. TCP8 also showed a two-fold decrease in the
PHYTOCHROME B (PHYB-1) mutant background ground under 10 hour light/ 14 hour dark
conditions. PHYB encodes a photoreceptor that absorbs red light to mediate
photomorphogenesis (inhibition of hypocotyl elongation, chlorophyll production and expansion
of cotyledons and subsequent produced leaves) (Rausenberger et al. 2010).
4.11 TCP8 response to hormone treatment
Some developmental mutants show altered physiological responses to addition of hormones. A
classic example is the lack of inhibition of axillary meristem outgrowth in excised nodes of
axr1 mutant plants in the presence of auxin (Stirnberg et al. 1999). Traditional hormone assays,
such as auxin treatment, or the effect of cytokinin treatment on primary root length were

163
performed in order to examine if any differences existed between wild-type and tcp8 plants
with respect to hormone perception and physiological response. No such differences were
found.
While traditional root elongation assays did not reveal differential sensitivity of TCP8 to auxin
or cytokinin, tcp8 leaves were found to be insensitive to NPA-mediated increases in trichome
density. NPA is an inhibitor of polar auxin transport. Seedlings grown on NPA supplemented
media exhibit a variety of physiological defects including increased trichome density
(O‟Donnell et al. 2004). In wild-type rosette leaf one, this increase was almost five times in
response to 10µM NPA treatment (figure 45). In contrast, trichome density in tcp8 leaves only
modestly increased. tcp8 rosette one leaves had significantly lower trichome density than their
wild-type counterparts in both mock and NPA treated samples, which is the opposite situation
from tcp8 cauline leaf trichome density. While trichome density is unperturbed in NPA treated
tcp8 seedlings, other physiological changes attributed to NPA still occur. Normally, inhibition
of auxin flux results in increased trichome number. Therefore, TCP8 and normal auxin flux
may function to maintain rosette trichome number.
It is possible that rosette and cauline leaves possess differing capacities to respond to hormone
perturbations, and this is reflected in the different trichome density trends between tcp8 cauline
and rosette leaves. This has been shown by Clarke et al. 1999 with respect to the differing
capacity of juvenile and adult leaves to respond to (eg. produce trichomes) exogenously applied
gibberrellic acid. If there is a differential hormone sensitivity of leaves produced in different
stages of development, then it would be interesting to observe how tcp8 cauline leaves respond
to similar treatments.
4.12 TCP8’s possible role in regulation of the timing of organ development
The changes in tcp8 cauline leaf size and shape suggested that overall leaf development was
altered in the mutant. This led me to explore the possibility that vascular patterning was also
altered in the mutant. Wild-type and tcp8 plants rosette one leaves were examined for
differences in leaf size, vein patterning and complexity at 15 days after sowing (DAS). The 15
DAS time point was chosen, as it has been previously documented to be the time point in
rosette one leaf development where vein patterning is complete, and leaf expansion continues
164
(Rolland-Lagan et al. 2009). I reasoned that if any differences in vein patterning existed
between wild type and tcp8, then it should be manifest by this time point.
At the 15 DAS time point tcp8 rosette one leaves were significantly smaller than wild type
leaves. Petiole area was reduced due to decreased length, while decreased leaf blade size was
due to modest reductions in both blade length and width. The decreased leaf length and width in
the mutants suggests that TCP8 could be functioning to promote growth in both the leaf length
and width direction by either promoting cell proliferation and/or cell expansion. This could be
occurring as mentioned previously, by the interaction of TCP8 with genes shown to regulate
leaf cell proliferation and expansion such as the SPL and AtGRF families of genes (Kim et al.
2003; Horiguchi et al. 2005; Usami et al. 2009). Fully expanded rosette one leaves in the
mutant were also found to be reduced in size compared to wild-type counterparts (Figure 31).
This finding suggests that TCP8 may regulate not only the timing but the extent of rosette leaf
one growth. While mutant rosette one leaves showed decreased size compared to wild type
during and at the end of development, later formed tcp8 rosette leaves showed greater
expansion than their wild-type counterparts specifically in the leaf width direction (Figure 26).
Again this observation indicates a role for TCP8 in the regulation of rosette leaf growth
however in an opposite manner from that occurring in rosette one leaves.
4.13.1 tcp8 rosette one leaves show altered spatial patterns of vein and free
vein density
Wild-type leaves showed a basipetal gradient for both free vein and vein density along the
proximo-distal plane of the leaf blade, such that apical areas possess lower values than basal
regions. This difference was found to be statistically significant.
The mutant displayed statistically significant gradients in both the proximo-distal and medio-
lateral planes of the leaf blade, as well as a gradient between the leaf centre and the leaf margin.
Greater free vein and vein densities were found in lateral regions of the leaf (compared to the
midrib), the marginal region (compared to the leaf centre), and in the basal region of the leaf
(compared to the apical region). Mutant free vein and vein densities were found to be slightly
higher than wild type in comparable regions of the leaf blade, especially in the lateral margin
positions. Increases in vein density can be attributed to three possibilities: pre-displacement (in
which there is a precocious onset of procambium formation), hypermorphosis (in which

165
procambium formation is prolonged) or acceleration (in which the rate of procambium
formation is accelerated) (McKown and Dengler, 2009). To distinguish which of these
possibilities exists in tcp8 leaves, vein density and the timing of different vein order initiation
should be measured and compared to wild-type leaves at comparable stages of leaf growth (ie.
leaf blade length). There are several causes of increased vein density (McKown and Dengler,
2009). Leaves could have increased auxin production, modified leaf ground meristem cell
competency to become procambium tissue, or a combination of both. If tcp8 leaves have a more
complex vein pattern due to increased auxin levels produced in the same developmental period
as wild type leaves, then vein density could be increased/decreased by the application of auxin
or auxin inhibitors, respectively.
Interestingly, mutant free vein density in the centre of the leaf blade was less than half the value
than seen in wild type. Normally, free vein density should be high in the centre of the leaf
blade, where the midvein exists and forms connections to many other veins. This may be due to
a greater number of freely ending higher order veins present in wild-type leaves than mutant
leaves in this region of the leaf. This suggests that the distribution of veins of different orders
may be altered in the mutant (higher order vein formation is terminated prematurely), or the
timing of higher order vein production is delayed in the mutant. Termination of vein formation
is due to the loss or a decrease of a procambium-forming signal, or a decrease in perception of
cells to these signals (Kang et al. 2007). This leads to a suppression of cell cycling, which is
necessary for vein formation. This suggests that decreased freely ending vein density in the
central region of tcp8 leaves is due to decreased cell proliferation. This can be verified by
examining the expression of a cell cycle marker such as CYCB::GUS in this region and
comparing it to expression patterns in the centre of wild type leaves.
Alternatively mutants could be exhibiting decreased free vein density in the centre of the leaf
blade due to a displacement of distal free vein density patterning/fate being displaced to a more
proximal region of the leaf blade.
4.13.2 tcp8 rosette one leaves exhibit changes in vein loop size shape and
subdivision
The distribution, area, and shape of vein loops was examined in both genotypes. The largest
loops were found in the centre of the leaf blade. Loop size decreased with increasing distance
radially from the leaf centre. tcp8 leaves showed a similar trend in loop area, however the

166
region in which larger sized loops exist was more tightly confined to the leaf centre, and a
larger region existed where smaller sized loops predominated. This could be due to delayed leaf
expansion resulting in delayed loop growth.
Loop shape was also examined as a function of position along the leaf blade. In wild-type
leaves, a concave basipetal front existed, whereby rounder loops existed at the leaf apex.
Towards the leaf base, loop shape became more elongate. This result agrees with earlier
findings presented by Rolland-Lagan et al. (2009). In the mutant, this gradient was altered, such
that both at the apical leaf margin and within the leaf central area, elongated loops existed,
whereas in the areas flanking this region, there were progressively rounder loops with
decreasing distance from the leaf margin. This shows that the pathway regulating loop shape is
altered in tcp8. This may be due to polarized growth occurring in one plane in the mutant that
does not occur in wild type, such that loops acquire an altered shape. Two examples of mutants
exhibiting polarized growth along one plane of the leaf blade are ron2 and rot3 (Cnops et al.
2004; Tsuge et al. 1996). RON2 is a transcriptional corepressor that functions late in leaf
development to restrict cell expansion (Cnops et al. 2004). ROT3 is a member of the
cytochrome p450 gene family encoding a steroid hydroxylase involved in polar cell elongation
(Kim et al. 1998).These mutants produce wide leaves that exhibit decreased cell expansion
along the proximo-distal axis of the leaf blade.
Wild-type leaves displayed few subdivided loops (defined as a loop possessing freely ending
veins within it; Rolland-Lagan et al. 2009) at the leaf apex and margin. The general trend
displayed was that subdivided loop number is the greatest in the centre of the leaf blade and
least at the periphery. This suggests that higher order vein initiation occurs at a high rate at the
leaf centre. In mutants, a similar trend existed, however there was a contraction of the central
region containing the highest number of subdivided loops and the region with the fewest
number of subdivided loops at the leaf margin was expanded. This could be due to a delayed
program of higher order vein initiation in the mutant resulting in a greater area of the mutant
leaf blade producing fewer higher order veins than comparable regions in the wild-type leaf
blade.
Wild-type leaves showed a longitudinal gradient of subdivided loop area, with the smallest
loops containing freely ending veins at the base of the leaf, and the largest subdivided loops at
the central and margin region of the middle section of the leaf. Based on these observations, it

167
appears that although the rate of higher order vein initiation is highest at the leaf centre, loop
expansion occurs in the lateral regions of the leaf centre. This suggests that while primary vein
formation is accropetal, and secondary vein formation is both basipetal and acropetal, higher
order vein formation does not parallel the growth axis of the leaf (whereby cell proliferation
and differentiation occur along basipetally along the leaf blade).
The mutant displayed both decreased higher order vein initiation and loop growth as smaller
subdivided loops predominated in the mutant leaf blade. A large region of the leaf at the apex
and base was composed of very small subdivided loops and larger subdivided loops existed in
the middle region of the leaf blade, illustrating a change in loop expansion patterns compared to
wild type. The largest subdivided loops in the mutant were still smaller than the largest in wild
type. This may be due to delayed blade expansion, or a decreased rate of higher order vein
initiation. The expression of ATHB8::GUS in tcp8 leaves should be examined, to see if the
pattern formation of higher order vein initiation is delayed or altered compared that in wild-type
leaves as ATHB8::GUS has been documented to be one of the earliest markers of pre-
procambial (cells destined to make up vascular tissue) fate (Baima et al. 1995; Kang and
Dengler, 2002).
From the vascular patterning analysis of rosette one leaves, it was evident that quantitative
differences existed in the quantity and spatial pattern of vasculature in the mutant, suggesting
that TCP8 functions to regulate timing of vein formation and the shape of vein loops. Altered
patterns in loop shape size and subdivision distribution across the leaf blade may be attributed
to altered cell proliferation patterns in the mutant leaf blade. Since tcp8 cauline leaves display
obvious morphological differences from their wild type counterparts, this study was extended to
cauline leaves to examine if they are also perturbed in vascular patterning.
4.13.3 tcp8 node three cauline leaves exhibited changes in leaf morphology
and vascular patterning
Nossen and tcp8 nodes 1-3 cauline leaves were examined over three days to observe general
growth and vascular patterning trends. The time frame in which leaves were examined was
while leaf expansion was still occurring. This was done in order to determine if any differences
occurred in these processes in the mutant. tcp8 leaves showed significantly increased perimeter
compared to wild type over all time points, although overall leaf area was equivalent between
the two genotypes. This is due to increased serration density in tcp8 cauline leaves (see above).

168
Mutant leaves had a greater width than wild-type leaves, however overall length was unaltered
producing rounder leaves as compared to wild type. TCP8 may be functioning to restrict blade
growth specifically in the leaf width direction.
During this developmental time frame, no significant difference was observed in wild-type and
mutant cauline leaf area at all three nodal positions. When leaves are fully expanded mutant
cauline leaves at all three nodal positions are larger than wild type counterparts. The initial
programs of organ expansion could be unchanged in the mutant, however tcp8 leaves show
increased expansion during later stages of development. Therefore, TCP8 may function to
regulate the rate of cauline leaf expansion in late development. This could be due to prolonged
expansion of mutant leaves over a longer time period, or due to changes in rates of organ
expansion.
Vein density, vein branch point density, and freely ending vein density are three measures of
vein complexity (Candela et al. 1999). All three measures of vein complexity were significantly
decreased as compared to wild type over all time points. This was also true for tcp8 mutant
cauline leaves at nodes one and two at the last time point.
It is interesting that no significant difference was seen in leaf blade area between wild-type and
mutant in node three cauline leaves (the same is true for node one and two leaves), and yet
three measures of vein complexity show significant decreases in the mutant. This signifies a
decoupling of organ growth and vein patterning in the mutant. Usually vein patterning and
organ growth are tightly coupled in wild-type rosette leaves (the larger the leaf, the greater the
vein complexity). Mutants producing larger leaves display greater vein complexity, while
mutants with smaller leaves have lower vein complexity. Many such examples have been
documented such as lop, cvp1, scf, and van7 (Carland and McHale, 1996; Carland et al. 1999;
Deyholos et al. 2003; Koizumi et al. 2005). The only gene found to exhibit smaller leaf size
associated with increased vein complexity example when mutated is TKV/ACL5 (Clay and
Nelson, 2005). The reduction in TKV leaf size of “adult” (rosette leaves 5+) is due to decreased
cell expansion. TCP8 may be functioning in a TKV mediated pathway. To explore this
possibility, TKV expression could be examined in tcp8 mutant leaves. If TCP8 is functioning
downstream of TKV, then increasing TKV expression may restore leaf development to normal.
Thus, it follows that TCP8 may be functioning to promote vein complexity and restrict organ
growth.

169
References
1. Achard, P., Baghour, M., Chapple, A., Hedden, P., Van Der Straeten, D., Genschik, P., Moritz, T.,
and Harberd, N. P.(2007). The plant stress hormone ethylene controls floral transition via DELLA-
dependent regulation of floral meristem-identity genes. PNAS. 104 (15), 6484-9.
2. Adamczyk, B.J., and Fernandez, D.E. (2009). MIKC* MADS Domain Heterodimers Are Required for
Pollen Maturation and Tube Growth in Arabidopsis. Plant Physiology. 149, 1713–1723.
3. Aggarwal, P., Das Gupta, M., Joseph, A.P., Chatterjee, N., Srinivasan, N, and Nath, U. (2010).
Identification of Specific DNA Binding Residues in the TCP Family of transcription factors in
Arabidopsis. The Plant Cell. 22, 1174-1189.
4. Aguilar-Martinez, J.A., Poza-Carrion, C., and Cubas, P. (2007). Arabidopsis BRANCHED1 acts as
an integrator of branching signals within axillary buds. Plant Cell. 19, 458–472.
5. Aida, M., Ishida, T., Fukaki, H., Fujisawa., H. and Tasaka, M. (1997). Genes involved in organ
separation in Arabidopsis: an analysis of the cup-shaped cotyledon mutant. Plant Cell. 9, 841-857.
6. Aida, M., Ishida, T. and Tasaka, M. (1999). Shoot apical meristem and cotyledon formation during
Arabidopsis embryogenesis: interaction among the CUP-SHAPED COTYLEDON and SHOOT
MERISTEMLESS genes. Development. 126, 1563-1570.
7. Aida, M., Vernoux, T., Furutani, M., Traas, J. and Tasaka, M. (2002). Roles of PIN-FORMED1 and
MONOPTEROS in pattern formation of the apical region of the Arabidopsis embryo. Development. 129,
3965–3974.
8. Aloni, R., Schwalm, K., Langhans, M., and Ullrich, C.I. (2003). Gradual shifts in sites of free-auxin
production during leaf-primordium development and their role in vascular differentiation and leaf
morphogenesis in Arabidopsis. Planta. 216, 841-853.
9. Alonso-Peral M.M., Candela, H., del Pozo, J.C., Martinez-Laborda, A., Ponce, M.R, and Micol
J.L. (2006). The HVE/CAND1 gene is required for the early patterning of leaf venation in Arabidopsis.
Development. 133, 3755-3766.
10. Baima, S., Nobili, F., Sessa, G., Lucchetti, S., Ruberti, I., and Morelli G. (1995). The expression of
the Athb-8 homeobox gene is restricted to provascular cells in Arabidopsis thaliana. Development. 121,
4171-4182.
11. Bailey, P.H.J., Currey, J.D., and Fitter, A.H. (2002). The role of root system architecture and root
hairs in promoting anchorage against uprooting forces in Allium cepa and root mutants of Arabidopsis
thaliana. Journal of Experimental Botany. 53 (367), 333-340.
12. Bao, F., Shen, J., Brady, S.R., Muday, G.K., Asami, T., and Yang, Z. (2004). Brassinosteroids
interact with auxin to promote lateral root development in Arabidopsis. Plant Physiology. 134, 1624–
1631.
13. Barton, M. K., and Poethig, R.S. (1993). Formation of the shoot apical meristem in Arabidopsis
thaliana: an analysis of development in the wild type and in the shoot meristemless mutant.
Development. 119, 823-831.
170
14. Benjamins, R and Scheres, B. (2008). Auxin: the looping star in plant development. Annu. Rev.
Plant Biol. 59,443–65.
15. Benkovà, E., Michniewicz, M., Sauer, M., Teichmann, T., Seifertova, D., Jurgen, G, and
Friml, J. (2003). Local, efflux-dependent auxin gradients as a common module for plant organ
formation. Cell. 115, 591-602.
16. Bent AF, Kunkel BN, Dahlbeck D, Brown KL, Schmidt R, Giraudat J, Leung J, Staskawicz
BJ. (1994). RPS2 of Arabidopsis thaliana: a leucine-rich repeat class of plant disease resistance
genes. Science. 265 (5180), 1856-60.
17. Berger, Y., Harpaz-Saad, S., Brand, A., Melnik, H., Sirding, N., Alvarez, J.P., Zinder, M.,
Samach, A., Eshed Y., and Ori, N. (2009).The NAC-domain transcription factor GOBLET
specifies leaflet boundaries in compound tomato leaves. Development. 136, 823-832.
18. Berleth T, Jürgens G. (1993). The role of the monopteros gene in organising the basal body
region of the Arabidopsis embryo. Development. 118, 575-588.
19. Blein, T., Pulido, A., Vialette-Guiraud A., Nikovics, K., Morin, H., Hay, A., Johansen, I. E.,
Tsiantis, M., and Laufs, P. (2008). A conserved molecular framework for compound leaf
development. Science. 322, 1835-1839.
20. Bohmert, K., Camus, I., Bellini, C., Bouchez, D., Caboche, M., and Benning, C. (1998). AGO1
defines a novel locus of Arabidopsis controlling leaf development. EMBO J. 17, 170- 180.
21. Booker, J., Auldridge, M., Wills, S., McCarty, D., Klee, H. and Leyser, O. (2004).
MAX3/CCD7 is a carotenoid cleavage dioxygenase required for the synthesis of a novel plant
signaling molecule. Curr. Biol. 14, 1232–1238.
22. Bowman, J.L., Smyth, D.R. and Meyerowitz, E.M. (1989). Genes directing flower development
in Arabidopsis. Plant Cell. 1, 37-52.
23. Bowman, J.L., Smyth, D.R. and Meyerowitz, E.M. (1991). Genetic interactions among floral
homeotic genes of Arabidopsis. Developmen.t 112, 1-20.
24. Brodersen, P., Petersen, M., Bjørn H., Zhu, N.S., Newman, M-A., Shokat, K.M., Riet, S.,
Parker J., and Mundy, J. (2006). Arabidopsis MAP kinase 4 regulates salicylic acid- and
jasmonic acid/ethylene-dependent responses via EDS1 and PAD4. Plant Journal. 47, 532–546.
25. Byrne, M.E., Barley, R., Curtis, M., Arroyo, J.M., Dunham, M., Hudson, A and Martienssen,
R.A. (2000). Asymmetric leaves1 mediates leaf patterning and stem cell function in Arabidopsis.
NATURE. 408, 967-971.
26. Cabrera y Poch, H.L., Peto. C.A., and Chory, J. (1993). A mutation in the Arabidopsis DET3
gene uncouples photoregulated leaf development from gene expression and chloroplast biogenesis.
Plant Journal. 4 (4), 671-682.
27. Candela H., Martinez-Laborda, and Micol, J.L. (1999). Venation pattern formation in
Arabidopsis thaliana vegetative leaves. Developmental Biology. 205, 205-216.

171
28. Carland F.M, and McHale. (1996). LOP1: a gene involved in auxin transport and vascular
patterning in Arabidopsis. Development. 122, 1811-1819.
29. Carland F.M., Berg, B.L., FitzGerald, J.N, Jinamorphongs, S., Nelson, T, and Keith B. (1999).
Genetic regulation of vascular tissue patterning in Arabidopsis. Plant Cell. 11, 2223-2137.
30. Carland F. M., and Nelson, T. (2004). COTYLEDON VASCULAR PATTERN2-Mediated
Inositol (1, 4, 5) Triphosphate signal transduction is essential for closed venation patterns of
Arabidopsis foliar organs. Plant Cell. 16, 1263-1275.
31. Casimiro, I., Marchant, A., Bhalerao, R.P., Beeckman, T., Dhooge, S., Swarup, R., Graham,
N., Inzé, D., Sandberg, G., Casero, P.J., and Bennett, M. (2001). Auxin transport promotes
Arabidopsis lateral root initiation Plant Cell. 13, 843–852.
32. Casson, S and Gray, J.E. (2008). Influence of environmental factors on stomatal development.
New Phytologist. 178: 9–23.
33. Ceulemans, R., Van Praet, L., and Jiang, X. N. (1995). Effects of CO2 enrichment, leaf position
and clone on stomatal index and epidermal cell density in poplar (Populus). New Phytologist. 131,
99-107.
34. Chang, C., Kwok, S.F,. Bleecker, A.B. and. Meyerowitz, E.M. (1993). Arabidopsis ethylene-
response gene ETR1: Similarity of product to two-component regulators. Science. 262, 5133. 539-
544.
35. Cheng, Y., Dai X., and Zhao, Y. (2006). Auxin biosynthesis by the YUCCA flavin
monooxygenases controls the formation of floral organs and vascular tissues in Arabidopsis. Genes
Dev. 20, 1790-1799.
36. Chien J. C. and Sussex, I. M. (1996). Differential regulation of trichome formation on the adaxial
and abaxial leaf surfaces of gibberellins and photoperiod in Arabidopsis thaliana (L.) Heynh. Plant
Physiol. 111, 1321-1328.
37. Chuck, G., Lincoln, C., and Hake, S. (1996). KNAT1 induces lobed leaves with ectopic
meristems when overexpressed in Arabidopsis. Plant Cell. 8, 1277–1289.
38. Clark, S.E. (1997). Organ formation at the vegetative shoot meristem. Plant Cell. 9, 1067-1076.
39. Clarke, JH., Tack D., Findlay K., Van Montagu M., Van Lijsebettens M. (1999). The
SERRATE locus controls the formation of early juvenile leaves and phase length in Arabidopsis.
Plant Journal. 20 (4), 493-501.
40. Clay, N., and Nelson, T. (2005). Arabidopsis thickvein mutation affects vein thickness and organ
vascularization, and resides in a provascular cell-specific spermine synthase involved in vein
definition and in polar auxin transport. Plant Physiology. 138, 767-777.
41. Clay, N.K. and Nelson, T. (2005). The recessive epigenetic swellmap mutation affects the
expression of two step II splicing factors required for the transcription of the cell proliferation gene
STRUWWELPETER and for the timing of cell cycle arrest in the Arabidopsis leaf. Plant Cell. 17,
1994–2008.
42. Clough, J.S. and Bent, A.F. (1998). Floral dip: a simplified method for Agrobacterium mediated
transformation of Arabidopsis thaliana. Plant Journal. 16, 735-743.

172
43. Cnops et al. (2004). The rotunda2 mutants identify a role for the LEUNIG gene in vegetative leaf
morphogeneis. J.Exp Bot. 55 (402), 1529-1539.
44. Cnops, G., Jover-Gil, S., Peters, J.L., Neyt, P., De Block, S., Robles, P., Ponce, M.R., Gerats,
T., Micol, J.L, and Van Lijsebettens, M.V. (2006). The TORNADO1 and TORNADO2 genes
function in several patterning processes during early leaf development in Arabidopsis thaliana.
Plant Cell. 18, 852-866.
45. Coen E.S and Meyerowitz E.M. (1991). The war of the whorls: genetic interactions controlling
flower development.Nature. 5,353 (6339):31-37.
46. Cohen JD, Baldi BG, Slovin JP (1986) I3C6-[Benzene ring-indole- 3-acetic acid: a new internal
standard for quantitative mass spectral analysis of indole-3-acetic acid in plants. Plant Physiol. 80,
14-19.
47. Crawford, B.W ., Nath, U., Carpenter, R., and Coen, E.S. (2004).CINCINNATA controls both
cell differentiation and growth in petal lobes and leaves of Antirrhinum. Plant Physiology. 135,
244-253.
48. Cubas, P., Lauter, N., Doebley, J., and Coen, E. (1999). The TCP domain: a motif found in
proteins regulating plant growth and development. Plant Journal. 18, 215-222.
49. Cubas, P. (2004). Floral zygomorphy, the recurring evolution of a successful trait. BioEssays. 26,
1175–1184.
50. Cubas, P., Vincent, C., and Coen, E. (1999). An epigenetic mutation responsible for natural
variation in floral symmetry. Nature. 401, 157-161.
51. Cubas, P., Lauter, N., Doebley, J., and Coen, E. (1999). The TCP domain: a motif found in
proteins regulating plant growth and development. The Plant Journal. 18, 215-222.
52. Cubas, P., Coen, E., and Martinez Zapater, J.M. (2001). Ancient asymmetries in the evolution
of flowers. Current Biology. 11, 1050-1052.
53. Deyholos, M. K., Cavaness, G. F., Hall, B., King, E., Punwani, J., Norman, J.V., and
Sieburth, L.E. (2003). VARICOSE, a WD-domain protein, is required for leaf blade development.
Development. 130, 6577-6588.
54. Dharmasiri, N., Dharmasiri, S., Weijers, D., Karunarathna, N., Jurgens, G.,and Estelle, M.
(2007). AXL and AXR1 have redundant functions in RUB conjugation and growth and
development in Arabidopsis. Plant Journal. 52, 114–123.
55. Dharmawardhana, D.P., Ellis, B.E., and Carlson, J.E. (1992). Characterization of vascular
lignification in Arabidopsis thaliana. Can. J. Bot. 70, 2238-2244.
56. Dinneny J.R., Yadegari, R., Fischer, R.L, Yanofsky, M.F, and Weigel, D. (2003). The role of
JAGGED in shaping lateral organs. Development. 131, 1101-1110.
57. Doebley, J., Stec, A., and Hubbard, L. (1997).The Evolution of apical dominance in maize.
Nature. 386, 485-488.
58. Donnelly, P.M., Bonetta, D., Tsukaya, H., Dengler, R.E, and Dengler, N.G. (1999). Cell
cycling and cell enlargement in developing leaves of Arabidopsis. Develpmental Biology. 215,
407-419.

173
59. Douglas, S.J., Chuck, G., Dengler, R.E., Pelecanda, L., and Riggs, C.D. (2002). KNAT1 and
ERECTA regulate inflorescence architecture in Arabidopsis. Plant Cell. 14, 547-558.
60. Douglas, S.J. and Riggs, C.D. (2005). Pedicel development in Arabidopsis thaliana: contribution
of vascular positioning and the role of the BREVIPEDICELLUS and ERECTA genes.
Developmental Biology. 284, 451-463.
61. Edlund, A., Eklof, S., Sundberg, B., Moritz, T., and Sandberg, G. (1995). A microscale
technique for gas chromatography-mass spectrometry measurements of picogram amounts of
Indole-3-Acetic Acid in plant tissues. Plant Physiol. 108, 1043-1047.
62. Ellison, C. T., Vandenbussche, F., Van Der Straeten, D., Harmer, S. L. (2011). XAP5
CIRCADIAN TIMEKEEPER regulates ethylene responses in aerial tissues of Arabidopsis. Plant
Physiology.155, 988–999.
63. Esau, K. (1977). ESAU‟S PLANT ANATOMY: Meristems, cells, and tissues of the plant body:
Their structure function and development 3rd
Edition John Wiley & Sons, INC.
64. Faivre-Rampant, O., Bryan, G.J., Roberts, A.G., Milbourne, D., Viola, R., and Taylor, M.A.
(2004). Regulated expression of a novel TCP domain transcription factor indicates an involvement
in the control of meristem activation processes in Solanum tuberosum. J. Exp Bot. 55 (398), 951-
953.
65. Feild, T.S., Sage, T.L., Czerniak, C., and Iles, W.J. D. (2005). Hydathodal leaf teeth of
Chloranthus japonicas (Chloranthaceae) prevent guttation-induced flooding of the mesophyll.
Plant, cell and Environment. 28, 1179-1190.
66. Ferreira, P.C. G., Hemerly, A.S., de Almeida Engler, J., Van Montagu, M., Engler, G., and
lnze, D. (1994). Developmental expression of the Arabidopsis cyclin gene cyclAt. Plant Cell. 6,
1763-1774.
67. Ferro, N., Bredow, T., Jacobsen, H-J., and Reinard, T. (2010). Route to novel auxin: Auxin
chemical space toward biological correlation carriers. Chem. Rev. 11;110(8),4690-708.
68. Finlayson, S.A. (2007). Arabidopsis TEOSINTE BRANCHED1-LIKE 1 regulates axillary bud
outgrowth and is homologous to monocot teosinte branched1. Plant Cell Physiology. 48, 667–677.
69. Friml, J., Wisniewska, J., Benkova, E., Mendgen, K., & Palme, K. (2002). Lateral relocation of
auxin efflux regulator PIN3 mediates tropism in Arabidopsis. NATURE. 415, 806-809.
70. Friml, J and Palme, K. (2002). Polar auxin transport – old questions and new concepts? Plant
Molecular Biology. 49, 273–284.
71. Fujii H., Verslues P.E., Zhu J.K. (2011). Arabidopsis decouple mutant reveals the importance of
SnRK2 kinases in osmotic stress responses in vivo. PNAS. 108 (4), 1717-1722.
72. Fujita and Syono. (1996). Genetic analysis of the effects of polar auxin transport inhibitors on root
growth in Arabidopsis thaliana. Plant Cell Physiol. 37(8), 1094-1101.
73. Furner, I.J., and Pumfrey, J.E. (1992). Cell fate in the shoot apical meristem of Arabidopsis
thaliana. Development. 115 (3), 755-764.

174
74. Furutani, M., Vernoux, T., Traas, J., Kato, T., Tasaka, M. and Aida, M. (2004). PIN-
FORMED1 and PINOID regulate boundary formation and cotyledon development in Arabidopsis
embryogenesis. Development. 131, 5021–5030.
75. Galego, L., and Almeida J. (2002). Role of DIVARICATA in the control of dorsoventral
asymmetry in Antirrhinum flowers. Genes Dev. 16(7), 880-91.
76. Gälweiler L., Guan, C., Müller, A., Wisman, E., Mendgen, K., Yephremov, A., and Palme, K. (1998). Regulation of polar auxin transport by AtPIN1 in Arabidopsis vascular tissue. SCIENCE.
282, 2226-2230
77. Gan, S., and Amasino, R.M. (1997). Making Sense of Senescence: Molecular Genetic Regulation
and Manipulation of Leaf Senescence. Plant Physiology. 113 (2), 313-319.
78. Gaudin, V., Lunness, P.A., Fobert, P.R., Towers, M. Riou-Khamlichi, C., Murray, J.A.H,
Coen, E., and Doonan, J.H. (2000). The Expression of D-cyclin genes defines distinct
developmental zones in Snapdragon apical meristems and is locally regulated by the CYCLOIDEA
Gene. Plant Physisology. 122, 1137-1148.
79. Geldner, N., Friml, J., Stierhof, Y-D., Jurgens, G., and Palme, K. (2001). Auxin transport
inhibitors block PIN1 cycling and vesicle trafficking. NATURE. 413, 425-428.
80. Giraud, E., Ng, S., Carrie, C., Duncan, O., Low, J., Lee, C.P. Van Aken, O., Millar, A.H.,
Murcha, M., and Whelan, J. (2010). TCP transcription factors link the regulation of genes
encoding mitochondrial proteins with the circadian clock in Arabidopsis thaliana. Plant Cell. 22,
3921–3934.
81. Guiltinan M.J., Marcotte W.R and Quatrano R.S. (1990). A plant leucine zipper protein that
recognizes an abscisic acid response element. Science. 250, 267-270.
82. Ha, C.M., Kim, G-T., Kim, B.C., Jun J.H., Soh, M.S., Ueno, Y., Machida, Y., Tsukaya, H.,
and Nam, H.G. (2003). The BLADE-ON-PETIOLE 1 gene controls leaf pattern formation through
the modulation of meristematic activity in Arabidopsis. Development. 130, 161-172.
83. Hammani, K., Gobert, A., Hleibieh, K., Choulier, L., Small, I., and Giegé, P. (2011). An
Arabidopsis dual-localized pentatricopeptide repeat protein interacts with nuclear proteins involved
in gene expression regulation The Plant Cell. 23, 730–740.
84. Hara, K., Kajita, R., Torii, K.U., Bergmann, D.C and Kakimoto, T. (2007). The secretory
peptide gene EPF1 enforces the stomatal one-cell-spacing rule. Genes & Development. 21,1720–
1725.
85. Harmer S.L., Hogenesch J.B., Straume, M., Chang H,S., Han, B., Zhu, T., Wang, X., Kreps,
J.A and Kay, S.A. (2000). Orchestrated transcription of key pathways in Arabidopsis by the
circadian clock. Science. 290, 2110-3.
86. Hay, A., Barkoulas, M, and Tsiantis, M. (2006). ASYMMMETRIC LEAVES1 and auxin
activities converge to repress BREVIPEDICELLUS expression and promote leaf development in
Arabidopsis. Development. 133, 3955-3961.

175
87. Himmelbach A, Hoffmann T, Leube M, Hohener B, Grill E. (2002). Homeodomain protein
ATHB6 is a target of the protein phosphatase ABI1 and regulates hormone responses in
Arabidopsis. EMBO J. 21, 3029-3038.
88. Horiguchi, G., Kim, G-T., and Tsukaya, H. (2005). The transcription factor AtGRF5 and the
transcription coactivator AN3 regulate cell proliferation in leaf primordia of Arabidopsis thaliana.
Plant Journal. 43, 68-78.
89. Horiguchi G., Fujikura, U., Ferjani, A., Ishikawa, N., and Tsukaya, H. (2006). Large-scale
histological analysis of leaf mutants using two simple leaf observation methods: identification of
novel genetic pathways governing the size and shape of leaves. Plant Journal. 48, 638-644.
90. Howarth, D.G. and Donoghue, M.J. (2006). Phylogenetic analysis of the„ECE‟ (CYC/TB1) clade
reveals duplications predating the core eudicots. PNAS. 103, 9101–9106.
91. Huang, W., Pi, L., Liang, W., Xu, B., Wang., H., Cai, R, and Huang, H. (2006). The proteolytic
function of the Arabidopsis 26S proteosome is required for specifying leaf adaxial identity. The
Plant Cell. 18, 2479-2492,
92. Hubbard, L., McSteen, P., Doebley, J., and Hake, S. (2002). Expression patterns and mutant
phenotype of teosinte branched1 correlate with growth suppression in maize and teosinte. Genetics.
162, 1927-1935.
93. Hülskamp, M., Miséra, S., and Jürgens, G. (1994). Genetic dissection of trichome cell
development in Arabidopsis. Cell. 76, 555-56.
94. Hülskamp, M. (2004). Plant Trichomes: A model for cell differentiation. Nature Reviews
Molecular Cell Biology. 5, 471-480.
95. Ikram, B., Xu, J., Wildwater, M., Willemsen, V., Paponov, I., Friml, J., Heidstra, R., Aida,
M., Palme, K., and Scheres, B. (2005). The PIN auxin efflux facilitator network controls growth
and patterning in Arabidopsis roots. NATURE. 433, 39-44.
96. Jacobs, W. P. (1952). The role of auxin in the differentiation of xylem round a wound. Am. J. Bot.
39, 301–309.
97. Jefferson, R.A., Kavanagh, T.A. and Bevan, M.W. (1987). GUS fusions: β-glucuronidase as a
sensitive and versatile gene fusion marker in higher plants. EMBO J. 6, 3901-3907.
98. Kang, J and Dengler, N. (2002). Cell cycling frequency and expression of the homeobox gene
ATHB-8 during leaf vein development in Arabidopsis. Planta. 216, 212-219.
99. Kang, J and Dengler, N. (2004). Vein Pattern development in adult leaves of Arabidopsis thaliana.
Int. J. Plant Sci. 165(2), 231-242.
100. Kawamura, E., Horiguchi, G., and Tsukaya, H. (2010). Mechanisms of leaf tooth formation in
Arabidopsis. Plant Journal. 62, 429-441.
101. Keith, K.A., Kraml, M., Dengler, N.G., and McCourt, P. (1994). fusca3: D. Gibberellins
promote flowering of Arabidopsis by activat- A heterochronic mutation affecting late development
in Arabidopsis. Plant Cell. 6 (5), 589-600.

176
102. Khan, Sadaf & Julie M. Stone (2007). Arabidopsis thaliana GH3.9 in auxin and jasmonate cross
talk. Plant Signaling & Behavior. 2(6), 483-485.
103. Khan, Sadaf & Julie M. Stone. (2007). Arabidopsis thaliana GH3.9 influences primary root
growth. Planta. 226, 21–34.
104. Kieffer, M., Master, V., Waites R., and Davies, Brendan. (2011). TCP14 and TCP15 affect
internode length and leaf shape in Arabidopsis. Plant Journal. doi:10.1111/j.1365-
313X.2011.04674.x
105. Kim, G.T., Tsukaya, H., Uchimiya, H. (1998). The ROTUNDIFOLIA3 gene of Arabidopsis
thaliana encodes a new member of the cytochrome P-450 family that is required for the regulated
polar elongation of leaf cells. Genes Dev. 12(15), 2381–2391.
106. Kim, G-T., Shoda, K., Tsuge, T., Cho, K-H., Uchimiya, H., Yokoyama, R., Nishitani, K., and
Tsukaya, H. (2002). The ANGUSTIFOLIA gene of Arabidopsis, a plant CtBP gene, regulates leaf-
cell expansion, the arrangement of cortical microtubules in leaf cells and expression of a gene
involved in cell-wall formation. EMBO Journal. 21(6), 1267-1279.
107. Kim, J.H., Choi, D., and Kende, H. (2003). The AtGRF family of putative transcription factors is
involved in leaf and cotyledon growth in Arabidopsis. Plant Journal. 36, 94–104.
108. Kirik, V., Simon, M., Hulskamp, M., and Schiefelbein, J. (2004). The ENHANCER OF TRY
AND CPC1 gene acts redundantly with TRIPTYCHON and CAPRICE in trichome and root hair
cell patterning in Arabidopsis. Developmental Biology. 268, 506-513.
109. Koch, A.J., and Meinhardt, H. (1994). Biological pattern formation: From basic mechanisms to
complex structures. Rev. Mod. Phys. 66. 1481-1507.
110. Koizumi, K., Naramoto, S., Sawa, S., Yahara, N., Ueda, T., Nakano, A., Sugiyama, M, and
Fukuda, H. (2005). VAN3 ARF-GAP-mediated vescicle transport is involved in leaf vascular
network formation. Development. 132, 1699-1711.
111. Kosugi and Ohashi. (1997). PCF1 and PCF2 specifically bind to cis elements in the rice
proliferating cell nuclear antigen gene. Plant Cell. 9, 1607-1619.
112. Kosugi, S, and Ohashi, Y. (2002). DNA binding and dimerization specificity and potential targets
for the TCP protein family. Plant Journal. 30 (3), 337-348.
113. Koyama, T., Furutani, M., Tasaka, M, and Ohme-Takagi, M. (2007). TCP transcription factors
control the morphology of shoot lateral organs via negative regulation of the expression of
boundary-specific genes in Arabidopsis. Plant Cell. 19, 473-484.
114. Koyama, T., Mitsuda, N., Seki, M., Shinozaki, K., and Ohme-Takagi, M. (2010). TCP
transcription factors regulate the activities of ASYMMETRIC LEAVES1 and miR164, as well as
the auxin response, during differentiation of leaves in Arabidopsis. Plant Cell Preview. 1-15
115. Kumar, R., Kushalappa, K., Godt, D., Pidkowich, M.S., Pastorelli, S., Hepworth, S.R., and
Haughn, G.W. (2007). The Arabidopsis BEL1-LIKE HOMEODOMAIN proteins SAW1 and
SAW2 act redundantly to regulate KNOX expression spatially in leaf margins. Plant Cell. 19,
2719-2735.

177
116. Kutter, C., Scho, H., Stadler, M., Meins, F., and Si-Ammour, A. (2007). MicroRNA-mediated
regulation of stomatal development in Arabidopsis. Plant Cell. 19, 2417–2429.
117. Lake, J. A., Quick, W. P., Beerling, D. J., and Woodward, F. I. (2001). Signals from mature to
new leaves. NATURE. 411, 154.
118. Larkin, J.C., Oppenheimer, D.G., Pollock, S., and Marks, M.D. (1993). Arabidopsis
GLABROUS1 Gene requires downstream sequences for function. Plant Cell. 5, 1739-1748.
119. Larkin, J.C., Young, N., Prigge, M., and Marks, M.D. (1996). The control of trichome spacing
and number in Arabidopsis. Development. 122, 997-1005.
120. Laskowski, M.J., Williams, M.E., Nusbaum, H.C., and Sussex, I.M. (1995). Formation of lateral
root meristems is a two-stage process. Development. 121, 3303-3310.
121. Laubinger S, Sachsenberg T, Zeller G, Busch W, Lohmann JU, Ratsch G, Weigel D. (2008).
Dual roles of the nuclear cap-binding complex and SERRATE in pre-mRNA splicing and
microRNA processing in Arabidopsis thaliana. PNAS. 105, 8795–8800.
122. Laufs, P., Peaucelle, A., Morin, H., and Traas, J. (2004). MicroRNA regulation of the CUC
genes is required for boundary size control in Arabidopsis meristems. Development. 131, 4311-
4322.
123. Leyser, H. M. O., Lincoln, C. A., Timpte, C. S., Lammer, D., Turner, J. C. and Estelle, M.
(1993). Arabidopsis auxin-resistance gene AXR1 encodes a protein related to ubiquitin-activating
enzyme E1. Nature. 304, 161-164.
124. Li, C., Potuschak, T., Colon-Carmona, A., Gutierrez, R.A., and Doerner, P. (2005).
Arabidopsis TCP20 links regulation of growth and cell division control pathways. PNAS. 102,
12978-12983.
125. Lincoln, C., Britton, J.H., and Estelle, M. (1990). Growth and development of the axr1 mutants
of Arabidopsis. Plant Cell. 2, 1071-1080.
126. Lincoln, C., Long, J., Yamaguchi, J., Serikawa, K., and Hake, S. (1994). A knottedl-like
Homeobox Gene in Arabidopsis is expressed in the vegetative meristem and dramatically alters leaf
morphology when overexpressed in transgenic plants. Plant Cell. 6, 1859-1876.
127. Ljung, K., Hull, A.K., Celenza, J., Yamada, M., Estelle, M., Normanly, J., and Sandberg, G.
(2005). Site and regulation of auxin biosynthesis in Arabidopsis roots. The Plant Cell. 17, 1090-
1104.
128. Lomax. T. L., Muday. G. K. and Rubery. P H. (1995). Auxin transport- In Plant Hormones:
Physiology. Biochemistry and Molecular Biology (P. J. Davies. ed. pp. 509-530. (Kluwer
Academic Publishers). Dordrecht. ISBN 0-7923-2984-8.
129. Long, J.A., Moan, E.I., Medford, J.I., Barton, M.K. (1996). A member of the KNOTTED class
of homeodomain proteins encoded by the STM gene of Arabidopsis. Nature 379, 66 – 69.
130. Luo, D., Copsey, L., Vincent, C., Clark, J., and Coen, E. (1999). Control of organ asymmetry in
flowers. Cell. 99, 367-376.

178
131. Marchant, A., Kargul, J., May, S.T., Muller, P., Delbarre, A., Perrot-Rechenmann, C.,
Bennett, M.J. (1999). AUX1 regulates root gravitropism in Arabidopsis by facilitating auxin
uptake within root apical tissues. EMBO J. 18 (8), 2066-2073.
132. Marks , M.D. (1997). Molecular genetic analysis of trichome development In Arabidopsis. Ann.
Rev. Plant Physiol. Plant Mol. Biol. 48,137–63.
133. Martin-Trillo, M., and Cubas, P. (2010). TCP genes: a family snapshot ten years later. Trends in
Plant Science. 15 (139), 1360-1385.
134. Martinez-Trujillo, M., Limones-Briones, V., Cabrera-Ponce, J.L., and Herrerra-Estrella, L. (2004). Improving transformation efficiency of Arabidopsis thaliana by modifying the floral dip
method. Plant Molecular Biology Reporter. 22, 63–70.
135. Marx, A. and Sachs, T. (1977). The determination of stomata pattern and frequency in Anagallis.
Bot. Gaz. 138, 385-392.
136. Más, P., Devlin, P.F., Panda, S., and Kay, S. A. (2000). Functional interaction of phytochrome B
and cryptochrome 2. Nature. 408, 207-211.
137. Mattsson, J., Sung, Z R., and Berleth, T. (1999). Responses of plant vascular systems to auxin
transport inhibition. Development. 126, 2979-2991.
138. Mattsson, J., Ckurschumova, W., and Berleth, T. (2003). Auxin sigalling in Arabidopsis leaf
vascular development. Plant Physiology. 131, 1327-1339.
139. Mayer, U., Büttner, G., and Jürgens, G. (1993). Apical-basal pattern formation in the
Arabidopsis embryo: studies on the role of the gnom gene. Development. 117, 149-162.
140. McClung, C. R. (2006). Plant circadian rhythms. Plant Cell. 18, 795-803
141. McKown, A. D. and. Dengler, N.G. (2009). Shifts in leaf vein density through accelerated vein
formation in C4 Flaveria (Asteraceae). Annals of Botany. 104, 1085-1098.
142. McNellis, T.W., and Deng, X-W. (1995). Light control of seedling morphogenetic pattern. Plant
Cell. 7, 1749-1761,
143. Meinhardt, H. (1996). Models of biological pattern formation: Common mechanism in plant and
animal development. Int. J. Dev. Biol. 40, 123-134.
144. Meinhardt, H and Gierer, A. (1974). Applications of a theory of biological pattern formation
based on lateral inhibition. J. Cell Sci. 15, 321–346.
145. Meinke, D., and Koorneef, M. (1997). Community standards for Arabidopsis genetics. The Plant
Journal. 12 (2), 247-253.
146. Meinke, D.W., Cherry, J. M., Dean, C., Rounsley, S.D and Koornneef, M. (1998). Arabidopsis
thaliana: A model plant for genome analysis. Science. 282, 678-682.
147. Meister G., and Tuschl, T. (2004). Mechanisms of gene silencing by double-stranded RNA.
Nature. 431, 343-349.
148. Meyerowitz, E. M. and Somerville, C. R. Arabidopsis (Cold Spring Harbor Laboratory Press,
Cold Spring Harbor, NY, 1994).

179
149. Miyamoto, Y and Sancar, A. (1998). Vitamin B2-based blue-light photoreceptors in the
retinohypothalamic tract as the photoactive pigments for setting the circadian clock in mammals.
PNAS. 95, 6097-6102.
150. Mizukami, Y., and Fischer, R.L. (2000). Plant organ size control: AINTEGUMENTA regulates
growth and cell numbers during organogenesis. PNAS. 97(2), 947-947.
151. Nadeau, J.A. and Sack, F.D. (2002). Control of stomatal distribution on the Arabidopsis leaf
surface. Science. 296 (31), 1697- 1700.
152. Nadeau, J.A. and Sack, F.D. (2008). Stomatal development in Arabidopsis: January, 2008. The
Arabidopsis Book. 1-28.
153. Nakazawa M, Yabe, N., Ichikawa, T., Yamamoto, Y.Y., Yoshizumi, T., Hasunuma, K., and
Matsui, M. (2001). DFL1, an auxin‑responsive GH3 gene homologue, negatively regulates shoot
cell elongation and lateral root formation, and positively regulates the light response of hypocotyl
length. Plant Journal. 25,213‑221.
154. Narita, N.N., Moore, S., Horiguchi, G., Kubo, M., Demura, T., Fukuda, H., Goodrich, J., and
Tsukaya, H. (2004). Overexpression of a novel small peptide ROTUNDIFOLIA4 decreases cell
proliferation and alters leaf shape in Arabidopsis thaliana. Plant Journal. 38, 699-713.
155. Nath, U., Crawford, B.C.W., Carpenter, R., and Coen, E. (2003). Genetic control of surface
curvature. Science 299, 1404-1407.
156. Navaud, O., Dabos, P., Carnus, E., Tremousaygue, D. and Hervé, C. (2007). TCP transcription
factors predate the emergence of land plants. J Mol Evol. 65, 23-33.
157. Negi, S., Ivanchenko, M.G. and Muday, G.K. (2008). Ethylene regulates lateral root formation
and auxin transport in Arabidopsis thaliana. Plant Journal. 55, 175–187.
158. Nelson, T., and Dengler, N. (1997). Leaf vascular pattern formation. Plant Cell. 9, 1121-1135.
159. Nikovics, K., Blein, T., Peaucelle, A., Ishida, T., Morin, H., Aida, M., and Laufs, P. (2006). The
balance between the MIR164A and CUC2 genes controls leaf margin serration in Arabidopsis.
Plant Cell. 18, 2929-2945.
160. Normanly, J. (1997). Auxin metabolism. Physiologia. Plantarum. 100, 431–442.
161. O’Donnell, B.M., Garrido, P., Kersey, S., and Ghoshroy, S. (2004). Structural alteration of
Arabidopsis thaliana leaf vasculature and restricted virus systemic movement in response to auxin
transport inhibition. Microsc Microanal. 10 (2), 220-221.
162. Okada, K. T., Uedal, J., Komaki, M.K., Bell, C.J., and Shimuraa, Y. (1991). Requirement of
the auxin polar transport system in early stages of Arabídopsis floral bud formation. Plant Cell. 3,
677-684.
163. Ori, N., Refael Cohen, A., Etzioni, A., Brand, A., Yanai, O., Shleizer, S., Mend, N., Amsellem,
Z., Efroni, I., Pekker, I., Alvarez, J.P., Blum, E., Zamir D., and Eshed, Y. (2007). Regulation of
LANCEOLATE by miR319 is required for compound-leaf development in tomato. Nature
Genetics. 39 (6), 787-791.

180
164. Paciorek, T, and Friml, J. (2006). Auxin signalling. Journal of Cell Science. 119, 1199-1202.
165. Pagnussat, G.C., Yu, H-J., Ngo, Q.A., Rajani, S., Mayalagu, S., Johnson, C.S., Capron, A.,
Xie, L-F., Ye, D., and Sundaresan, V. (2004). Genetic and molecular identification of genes
required for female gametophyte development and function in Arabidopsis. Development. 132, 603-
614.
166. Palatnik, J.F., Allen, E., Wu, X., Schommer, C., Schwab, R., Carrington, J.C., and Weigel, D. (2003). Control of leaf morphogenesis by microRNAs. Nature. 425, 257-262.
167. Palatnik, J.F., Wollmann, H., Schommer, C., Schwab, R., Boisbouvier, J., Rodriguez, R.,
Warthmann, N., Allen, E., Dezullian, T., Huson, D., Carrington, J.D, and Weigel, D. (2007).
Sequence and expression differences underlie functional specialization of Arabidopsis microRNAs
miR159 and miR319. Developmental Cell. 13, 115-125.
168. Pant, D. D. and Kidwai, P. F. (1967). Development of stomata in some Cruciferae. Ann. Bot. 31,
513-521.)
169. Petrášek, J and Friml, J. (2009). Auxin transport routes in plant development. Development. 136,
2675-2688.
170. Pickett, F.B., Wilson, A.K, and Estelle, M. (1990). The aux1 mutation of Arabidopsis confers
both auxin and ethylene resistance. Plant Physiology. 94, 1462-1466.
171. Pitts, R. J., Cernac, A., and Estelle, M. (1998). Auxin and ethylene promote root hair elongation
in Arabidopsis. The Plant Journal. 16(5), 553–560.
172. Poethig, S. (1990). Phase change and the regulation of shoot morphogenesis in plants. Science. 250
(16), 923-930.
173. Poethig, R. S. (1997). Leaf Morphogenesis in flowering plants. The Plant Cell. (9), 1077-1087.
174. Prigge, M.J and Wagner, D.R. (2001). The Arabidopsis SERRATE gene encodes a zinc-finger
protein required for normal shoot development. The Plant Cell. 13, 1263-1279.
175. Pruneda-Paz, J.L., Breton, G., Para, A., Kay, S.A. (2009). A functional genomics approach
reveals CHE as a component of the Arabidopsis circadian clock. Science. 323 (13), 1481-1485.
176. Pulido, A., and Laufs, P. (2010). Co-ordination of developmental processes by small RNAs during
leaf development. Journal of Experimental Botany. 61(5), 1277–1291.
177. Qi, R., and John, P.C.L. (2007). Expression of genomic AtCYCD2;1 in Arabidopsis induces cell
division at smaller cell sizes: Implications for the control of plant growth. Plant Physiology. 144,
1587-1597.
178. Qin, L., Guo, X., Feng, X., Weng, L., Yan, J., Hu, X., and Luo, D. (2004). Cloning of LjCYC1
gene and nuclear localization of LjCYC1protein in Lotus japonicus. J. Plant Physiol. Mol. Biol. 30,
523–532.
179. Rashotte, A.M., Brady, S.R., Reed, R.C., Ante, S.J., and Muday, G.K. (2000). Basipetal auxin
transport is required for gravitropism in roots of Arabidopsis. Plant Physiology. 122, 481- 490.

181
180. Rausenberger, J., Hussong, A., Kircher, S., Kirchenbauer, D., Timmer, J., Nagy, F., Schäfer,
E., Fleck, C. (2010). An integrative model for phytochrome B mediated photomorphogenesis:
from protein dynamics to physiology. PLoS. 5: (5) 1-13.
181. Raynaud, C., Sozzani, R., Glab, N., Domenichini, S., Perennes, C., Cella, R., Kondorosi, E.,
and Bergounioux, C. (2006). Two cell-cycle regulated SET-domain proteins interact with
proliferating cell nuclear antigen (PCNA) in Arabidopsis. Plant Journal. 47, 395–407.
182. Reinhardt, D., Mandel, T., and Kuhlemeier, C. (2000). Auxin regulates the initiation and radial
position of plant lateral organs. The Plant Cell. 12, 507–518.
183. Reinhardt, D., Pesce, E-R., Stieger, P., Mandel, T., Baltensperger, K., Bennett, M., Traas, J.,
Friml, J., and Kuhlemeier, C. (2003). Regulation of phyllotaxis by polar auxin transport. Nature.
426, 255-260.
184. Rolland-Lagan, A-G., Amin, M., and Pakulska, M. (2009). Quantifying leaf venation patterns:
two-dimensional maps. Plant Journal. 57, 195–205.
185. Romano, C.P., Robson, P.R., Smith, H., Estelle, M., and Klee, H.J. (1995). Transgene-mediated
auxin overproduction in Arabidopsis: Hypocotyl elongation phenotype and interactions with the
hy6-1 hypocotyl elongation and axr1 auxin-resistant mutants. Plant Mol. Biol. 27, 1071–1083.
186. Roth-Nebelsick, A., Dieter, U., Mosbrugger, V., and Kerp, H. (2001). Evolution and function of
leaf venation architecture: A review. Annals of Botany. 87, 553-566.
187. Royer, D.L. (2001). Stomatal density and stomatal index as indicators of paleoatmospheric CO2
concentration. Review of Palaeobotany and Palynology. 114, 1-28.
188. Rubio-Somoza, I., Cuperus, J.T., Weigel, D., and Carrington, J.C. (2009).Regulation and
functional specialization of small RNA–target nodes during plant development. Current Opinion in
Plant Biology. 12, 1–6.
189. Sabatini, S, Beis, D., Wolkenfelt, H., Murfett, J., Guilfoyle, T., Malamy, J., Benfey, P., Leyser,
O., Bechtold, N., Weisbeek, P., and Scheres, B. (1999). An auxin-dependent distal organizer of
pattern and polarity in the Arabidopsis root. Cell. 99, 463–472.
190. Sachs, T. (1981). The control of patterned differentiation of vascular tissues. Adv. Bot. Res. 9, 151-
262.
191. Sachs, T. (1989). The development of vascular networks during leaf development. Curr. Top. Plant
Biochem. Physiol. 8, 168-1 83.
192. Sachs, T. (1991a). Cell polarity and tissue patterning in plants. Dev. Supp. 1, 83-93.
193. Sachs, T. (1991 b). Pattern formation in plant tissues. (Cambridge, UK: Cambridge University
Press).
194. Scanlon, M. J., Henderson, D. C. and Bernstein, B. (2002). SEMAPHORE1 functions during the
regulation of ancestrally duplicated KNOX genes and polar auxin transport in maize. Development.
129, 2663 -2673.

182
195. Schnittger, A., Folkers, U., Schwab, B., Jurgens, G., and Hulskamp, M. (1999). Generation of a
Spacing Pattern: The role of TRIPTYCHON in Trichome Patterning in Arabidopsis. The Plant
Cell. 11, 1105-1116.
196. Schoch, P-G., Zinsou, C., and Sibi, M. (1980). Dependence of the stomatal index on
environmental factors during stomatal differentiation in leaves of Vigna sinensis L. Journal of
Experimental Botany. 31 (124), 1211-1216.
197. Schommer, C., Palatnik, J.F., Aggarwal, P., Chételat, A., Cubas, P., Farmer, E.E., Nath, U.,
and Weigel, D. (2008). Control of jasmonate biosynthesis and senescence by miR319 targets.
PLOS Biology. 6 (9), 1991-2000.
198. Schumacher, K., Vafeados, D., McCarthy, M., Sze, H., Wilkins, T., and Chory, J. (1999).The
Arabidopsis det3 mutant reveals a central role for the vacuolar H+–ATPase in plant growth and
development. Genes & Development. 13, 3259–3270.
199. Shinozaki K., Yamaguchi-Shinozaki K. (2000). Molecular responses to dehydration and low
temperature. Curr. Opin. Plant Biol. 3, 217-223.
200. Sieburth, L. (1999). Auxin is required for leaf vein pattern in Arabidopsis. Plant Physiology. 121,
1179-1190.
201. Sieburth, L.E., Muday, G.K, King, E.J., Benton, G.B. Kim, S., Metcalf, K.E., Meyers, L.,
Seamen, E, and Van Norman, J.M. (2006). SCARFACE encodes an ARF-GAP that is required
for normal auxin efflux and vein patterning in Arabidopsis. Plant Cell. 18, 1396-1411.
202. Smyth, D.R., Bowman, J.L., and Meyerowitz E.M. (1990). Early flower development in
Arabídopsis. Plant Cell. 2, 755-767.
203. Sorefan, K., Booker, J., Haurogne, K., Goussot, M., Bainbridge, K., Foo, E., Chatfield, S.,
Ward, S., Beveridge, C., Rameau, C., and Leyser, O. (2003). MAX4 and RMS1 are orthologous
dioxygenase-like genes that regulate shoot branching in Arabidopsis and pea. Genes Dev. 17, 1469–
1474.
204. Steynen, Q.J., and Schultz, E.A. (2003).The FORKED genes are essential for distal vein meeting
in Arabidopsis. Development. 130, 4695-4708.
205. Sticklen, M. (2006). Plant genetic engineering to improve biomass characteristics for biofuels.
Current Opinion in Biotechnology. 17, 315–319.
206. Stirnberg, P., Chatfield, S.P., and Leyser, H.M. (1999). AXR1 acts after later bud formation to
inhibit lateral bud growth in Arabidopsis. Plant Physiology. 121, 839-847.
207. Stirnberg, P., Van de Sande, K., and Leyser, H.M.O. (2002). MAX1 and MAX2 control shoot
lateral branching in Arabidopsis. Development. 129, 1131-1141.
208. Stoynova-Bakalova, E., Karanov, E., Petrov, P. and M. A. Hall. (2004). Cell division and cell
expansion in cotyledons of Arabidopsis seedlings. New Phytologist. 162, 471-479.
209. Suzuki, T., Sakurai, K., Ueguchi, C., and Mizuno, T. (2001). Two types of putative nuclear
factors that physically interact with histidine-containing phosphotransfer (Hpt) domains, signaling
mediators in histo-asp phosphorelay, in Arabidopsis thaliana. Plant Cell Physiol. 42(1), 37–45.

183
210. Swarbreck, D., Wilks, C., Lamesch, P., Berardini, T.Z., Garcia-Hernandez, M., Foerster, H.,
Li, D., Meyer, T., Muller, R., Ploetz, L., Radenbaugh, A., Singh, S., Swing, V., Tissier, C.,
Zhang P., and Huala, E. (2008). The Arabidopsis information resource (TAIR): gene structure and
function annotation. Nucleic Acids Research. 36, D1009–D1014.
211. Swarup, R., Friml, J., Marchant, A., Ljung, K., Sandberg, G., Palme, K. And Bennett, M. (2001). Localization of the auxin permease AUX1 suggests two functionally distinct hormone
transport pathways operate in the Arabidopsis root apex. Genes Dev. 15, 2648-2653.
212. Tabata R, Ikezaki M, Fujibe T, Aida M, Tian CE, Ueno Y, Yamamoto KT, Machida Y,
Nakamura K, Ishiguro S. (2010). Arabidopsis auxin response factor6 and 8 regulate jasmonic acid
biosynthesis and floral organ development via repression of class 1 KNOX genes. Plant Cell
Physiol. 51(1), 164-75.
213. Taiz, L. and Zeiger, E. (1997). Plant Physiology, 2nd
ed. (Sunderland, Massachusetts: Sinauer
Associates, Inc., Publishers.).
214. Takeda, T., Suwu, Y., Suzuki, M., Kitano, H., Ueguchi-Tanaka, M., Ashikari, M., Matsuoka,
M., and Ueguchi, C. (2003). The OsTB1 gene negatively regulates lateral branching in rice. The
Plant Journal. 33, 513-520.
215. Takeda, T., Amano, K., Ohto, M., Nakamura, K., Sato, S., Kato, T., Tabata, S., and Ueguchi,
C. (2006). RNA interference of the Arabidopsis putative transcription factor TCP16 gene results in
abortion of early pollen development. Plant Molecular Biology. 61, 165-177.
216. Talon, M., Koornneef, M and Zeevaart, J.A.D. (1990). Accumulation of C 19-gibberellins in the
gibberellin-insensitive dwarf mutant gai of Arabidopsis thaliana (L.) Heynh. Planta. 182,501-505.
217. Tatematsu, K., Kumagai, S., Muto, H., Sato, A., Watahiki, M.K., Harper, R.M, Liscum, E.,
and Yamamoto, K.T. (2004). MASSUGU2 encodes Aux/IAA19, an auxin-regulated protein that
functions together with the transcriptional activator NPH4/ARF7 to regulate differential growth
responses of hypocotyl and formation of lateral roots in Arabidopsis thaliana. Plant Cell. 16, 379-
393.
218. Tatematsu, K., Ward, S., Leyser, O., Kamiya, Y., and Nambara, E. (2005). Identification of
cis-Elements that regulate gene expression during initiation of axillary bud outgrowth in
Arabidopsis. Plant Physiology. 138, 757-766.
219. Tatematsu, K., Nakabayashi, K., Kamiya, Y, and Nambara, E. (2006). Transcription factor
AtTCP14 regulates embryonic growth potential during seed germination in Arabidopsis thaliana.
The Plant Journal. 53, 42-52.
220. Tiwari, S.B., Wang, X-J., Hagen, G., and Guilfoyle, T.J. (2001). AUX /IAA proteins are active
repressors, and their stability and activity are modulated by auxin. The Plant Cell. 13, 2809–2822,
221. Tiwari, S.B., Hagen, G., and Guilfoyle, T. (2003). The roles of auxin response factor domains in
auxin-responsive transcription. The Plant Cell. 15, 533–543.
222. Tiwari, S.B., Hagen, G., and Guilfoyle, T.J. (2004). Aux/IAA proteins contain a potent
transcriptional repression domain. The Plant Cell. 16, 533–543.

184
223. To, J. P. C., Haberer, G., Ferreira, F. J., Deruère, J., Mason, M. G., Schaller, G. E., Alonso, J.
M., Ecker, J. R. & Kieber, J. J. (2004). Type-A Arabidopsis response regulators are partially
redundant negative regulators of cytokinin signaling. Plant Cell. 16, 658–671.
224. Toledo-Ortiz, G., Huq, E., and Quail, P.H. (2003). The Arabidopsis basic/helix-loop-helix
transcription factor family. Plant Cell. 15, 1749– 1770.
225. Toufighi, K., Brady, S.M., Austin, R., Ly, E., and Provart, N.J.(2005) The Botany Array
Resource: e-Northerns, Expression Angling, and promoter analyses. Plant J. 43, 153-163.
226. Tremousaygue, D., Garnier, L., Bardet, C., Dabos, P., Herve, C., and Lescure, B. (2003).
Internal telomeric repeats and „TCP domain” protein-binding sites co-operate to regulate gene
expression in Arabidopsis thaliana cycling cells. The Plant Journal. 33, 957-966.
227. Tsiantis, M., Brown, M. I., Skibinski, G. and Langdale, J. A. (1999). Disruption of auxin
transport is associated with aberrant leaf development in maize. Plant Physiology. 121, 1163 -1168.
228. Tsuge, T., Tsukaya, H., and Uchimiya, H. (1996). Two independent and polarized processes of
cell elongation regulate leaf blade expansion in Arabidopsis thaliana (L) Heynh. Development. 122,
1589-1600.
229. Tsukaya, H., and H.Uchimiya. (1997). Genetic analyses of the formation of the serrated margin of
leaf blades in Arabidopsis: combination of a mutational analysis of leaf morphogenesis with the
characterization of a specific marker gene expressed in hydathodes and stipules. Mol Gen Genet.
256, 231-238.
230. Tsukaya, H., Kozuka, T., and Kim G-T. (2002). Genetic control of petiole length in Arabidopsis
thaliana. Plant Cell Physiology. 43 (10), 1221-1228.
231. Tsukaya, H. (2002).The Leaf Index: Heteroblasty, natural variation, and the genetic control of
polar processes of leaf expansion. Plant Cell Physiology. 43 (4), 372-378.
232. Tsukaya, H. (2005). Leaf shape: genetic controls and environmental factors. Int. J. Dev. Biol. 49,
547–555
233. Tsukaya, H. (2006). Mechanism of Leaf-Shape Determination. Annu. Rev. Plant Biol. 57, 477–
496.
234. Ulmasov, T., Murfett, J., Hagen, G., and Guilfoyle, T.J. (1997) Aux/IAA proteins repress
expression of reporter genes containing natural and highly active synthetic auxin response elements.
Plant Cell. 9, 1963-1971.
235. Ulmasov, T., Liu, Z-B., Hagen, G., and Guilfoyle, T.J. (1995). Composite structure of auxin
response elements. The Plant Cell. 7, 1611-1623.
236. Usami, T., Horiguchi G, Yano, S., nd Tsukaya H. (2009). The more and smaller cells mutants of
Arabidopsis thaliana identify novel roles for SQUAMOSA PROMOTER BINDING PROTEIN-
LIKE genes in the control of heteroblasty. Development. 136, 955–964.
237. Vernoux, T., Kronenberger, J., Grandjean, O., Laufs, P. and Traas, J. (2000). PIN-FORMED1
regulates cell fate at the periphery of the shoot apical meristem. Development. 127, 5157–5165.
185
238. Viola, I.L., Uberti Manassero, N.G., Ripoll R., and Gonzalez, D.H. (2011). The Arabidopsis
class I TCP transcription factor AtTCP11 is a developmental regulator with distinct DNA binding
properties due to the presence of threonine at position 15 of the TCP domain. Biochemical Journal.
435 (1), 143-55.
239. Vroemen, C. W., Mordhorst, A. P., Albrecht, C., Kwaaitaal, M. A. C. J, and de Vries, S.C.
(2003). The CUP-SHAPED COTYLEDON3 gene is required for boundary and shoot meristem
formation in Arabidopsis. Plant Cell.15, 1563-1577.
240. Waites, R., and Hudson, A. (1995). phantastica: A gene required for dorsoventrality of leaves in
Antirrhinum majus. Development 121, 2143–2154.
241. Wang Z-Y, Kenigsbuch D, Sun L, Harel E, Ong MS, Tobin EM. (1997). A myb-related
transcription factor is involved in the phytochrome regulation of an Arabidopsis Lhcb gene. Plant
cell. 9, 491-507.
242. Wang, H., Zhou, Y., Gilmer, S., Whitwill, S., and Fowke, L.C. (2000). Expression of the plant
cyclin-dependent kinase inhibitor ICK1 affects cell division, plant growth and morphology. Plant
Journal 24 (5), 613-623.
243. Weir, I., Lu, J., Cook, H., Causier, B., Schwarz-Sommer, Z., and Davies, B. (2003).
CUPULIFORMIS establishes lateral organ boundaries in Antirrhinum. Development. 49 (6), 885-
897.
244. Weijers, D., Sauer, M., Meurette, O., Friml, J., Ljung, K., Sandberg, G., Hooykaas, P., and
Offringa, R. (2005). Maintenance of embryonic auxin distribution for apical-basal patterning by
PIN-FORMED–dependent auxin transport in Arabidopsis. The Plant Cell. 17, 2517–2526.
245. Welchen, E, and Gonzalez D.H. (2005). Differential expression of the Arabidopsis cytochrome c
genes Cytc-1 and Cytc-2. Evidence for the involvement of TCP-Domain protein-binding elements
in anther-and meristem-specific expression of the Cytc-1 gene. Plant Physiology. 139, 88-100.
246. Went, F. W. (1935). Auxin, the plant-growth hormone. The Botanical Review. 1, 162–182.
247. Wenzel, C.L., Hester, Q., and Mattsson, J. (2008). Identification of genes expression in vascular
tissues using NPA-induced vascualar overgrowth in Arabidopsis. Plant Cell Physiology. 49(3),
457-468.
248. Werner, T., and Schmülling, T. (2009). Cytokinin action in plant development. Current Opinion
in Plant Biology. 12, 527-538.
249. Wilson, A.K., Pickett, F. B., Turner, J.C., and Estelle, M. (1990). A dominant mutation in
Arabidopsis confers resistance to auxin, ethylene and abscisic acid. Mol Gen Genet. 222, 377-383.
250. Wilson R.N., and Somerville, C.R. (1995). Phenotypic suppression of the gibberellin-insensitive
mutant (gai) of Arabidopsis. Plant Physiol. 108, 495-502.
251. Winter D, Vinegar B, Nahal H, Ammar R, Wilson GV, and Provart, N.J. (2007). An
“Electronic Fluorescent Pictograph” browser for exploring and analyzing large-scale biological data
sets. PLoS ONE. 2 (8), 1-12.

186
252. Wu, G., Park, M.Y., Conway, S.R., Wang, J-W., Weigel, D and Poethig, R.S. (2009). The
sequential action of miR156 and miR172 regulates developmental timing in Arabidopsis. Cell.
138, 750–759.
253. Xin, Z and Browse, J. (1998). PNAS. eskimo1 mutants of Arabidopsis are constitutively
freezing-tolerant. 95, 7799–7804.
254. Yang, L., Liu, Z., Dong, A., and Huang, H. (2006). SERRATE is a novel nuclear regulator in
primary microRNA processing in Arabidopsis. The Plant Journal. 47(6), 1-10.
255. Yang, M., and Sack, F.D. (1995). The too many mouths and four lips mutations affect stomatal
production in Arabidopsis. Plant Cell. 7, 2227-2239.
256. Yao, X., Ma, H., Wang, J., and Zhang, D. (2007). Genome-wide comparative analysis and
expression pattern of TCP gene families in Arabidopsis thaliana and Oryza sativa. J.Int Plant
Biology. 49 (6), 885-897.
257. Zettl, R., Feldwisch, J., Boland, W., Schell, J., and Palme, K. (1992). 5‟-Azido-[3,6-3 H2 ]-1-
napthylphthalamic acid, a photoactivatable probe for naphthylphthalamic acid receptor protein from
higher plants: Identification of a 23-kDa protein from maize coleoptiles plasma membranes. PNAS.
89, 480-484.
258. Zgurski, J. M., Sharma, R., Bolokoski, D. A. and Schultz, E. A. (2005). Asymmetric auxin
response precedes asymmetric growth and differentiation of asymmetric leaf1 and asymmetric leaf2
Arabidopsis leaves. Plant Cell. 17, 77-91.
259. Zhao, Y., Christensen, S.K., Fankhauser, C., Cashman, J.R., Cohen, J.D., Weigel, D, and
Chory, J. (2001). A role for flavin monooxygenase-like enzymes in auxin biosynthesis. Science.
291, 306-309.
260. https://www.genevestigator.com/gv/user/serveApplet.jsp.

187
Appendix 1. PCR results of T-DNA single mutant genotyping. Results for each single mutant are shown in the following panels; tcp8 (panels A,D,G), tcp14 (panels B, E, H) tcp15 (panels, C, F, I). For each single mutant, PCR was conducted using 3 different sets of primers; ACTIN7 as a housekeeping reference gene (panels A, B, C), the gene specific primer pair (GSP) (panels D, E, F), and the T-DNA specific primer + GSP pair (panel G, H, I). Arrows in panels D, E and F indicate amplification of positive control with gene specific primers. The white bar over PCR samples in panels G, H, and I indicates samples which amplified with the appropriate T-DNA and GSP primers. White dots over PCR samples in panels D, E, F indicate samples which were null for a particular TCP gene. The arrow in panels A-F indicate amplification of wild type DNA (Columbia ecotype) with either ACTIN7 or each of the 3 sets of gene specific primers. The “-“ lane reflects a no template control.

188
Appendix 2. PCR results of double mutant genotyping. Results for each double mutant are shown in the following panels; tcp8 tcp14 (panels A,D, G, J and M), tcp8 tcp15 (panels B, E, H, K and N), tcp14 tcp15 (panels C, F, I, L, and O). For each double mutant, PCR was conducted using 5 different sets of primers; ACTIN7 as a housekeeping reference gene (panels A, B, C), 2 gene specific primer pairs (GSP) (panels D, E, F, J, K, and L), and 2 T-DNA specific primer GSP pairs (panels G, H, I, M, N, and O). For the tcp8 tcp14 double mutant GSP1 and GSP2 were the tcp8 GSP’s (see methods) and the TCP14 GSP’s (see methods), respectively. The T-DNA specific primers for the tcp8 tcp14 double mutant were the T-DNA specific primers for tcp8 T-DNA (see methods) and for tcp14 T-DNA (see methods), respectively.

189
Arrows in panels A,B,C,D, E, F, J, K and L indicate amplification of positive control with gene specific primers. White dots over PCR samples in panels J and K indicate samples which were null for a particular TCP gene. White bars over PCR samples in panels G,H, I, M, N and O indicate samples which amplified with the appropriate GSP + T-DNA primer pair, and are null for a particular TCP gene. The “-“ lane reflects a no template control, “Col” reflect samples in which genomic DNA from wild type (Columbia) was used as a positive control for PCR with ACTIN7 or GSP primer pairs.
Appendix 3. PCR results of TCP8 TCP14 TCP15 triple mutant genotyping. Results for PCR done with specific primer sets are shown in the following panels; PCR with TCP8 gene specific primers (A), PCR with TCP14 gene specific primers (B), PCR with TCP15 gene specific primers (C), PCR with TCP8 GSP+T-DNA specific primers (D), PCR with TCP14 GSP+T-DNA specific primers (E), PCR with TCP15 GSP+T-DNA specific primers (F), PCR with ACTIN7 primers as a housekeeping reference gene (G). Arrows in panels A,B,C indicate amplification of positive control with gene specific primers. White dot over PCR sample in panel F indicates a sample which was null for all 3 TCP loci. The “-“ lane reflects a no template control, “Col” or “Nos” reflect samples in which genomic DNA from wild type (Columbia or Nossen ecotype) was used as a positive control for PCR with ACTIN7 or GSP primer pairs. Lanes which have no designation represent PCR samples for amplifications of other templates.

A
pp
end
ix 4
. Lea
f p
erim
eter
an
d a
rea
resu
lts
for
no
des
1-3
cau
line
leav
es. P
erim
eter
in n
od
e 3
cau
line
leav
es (
A).
Per
imet
er in
no
de
2 c
aulin
e le
aves
(B
),
Per
imet
er in
no
de
1au
line
leav
es (
C. A
rea
in n
od
e 3
cau
line
leav
es (
D),
Are
a in
no
de
2 c
aulin
e le
aves
(E)
, Are
a in
no
de
1 c
aulin
e le
aves
(F)
. Gra
ph
s w
ere
ge
ner
ated
usi
ng
the
stat
isti
cal
soft
war
e SP
SS.
Erro
r b
ars
rep
rese
nt
+/-
2 S
E. T
he
p v
alu
es a
re l
iste
d i
n t
he
grap
hs.
P-v
alu
es f
ollo
wed
by
an a
ste
risk
in
dic
ate
a si
gnif
ican
t d
iffe
ren
ce b
etw
een
th
e sa
mp
les
as m
easu
red
by
the
no
n-p
aram
etri
c K
rusk
al-W
allis
an
alys
is o
f va
rian
ce (
AN
OV
A)
test
usi
ng
SPSS
w
ith
a t
hre
sho
ld o
f 0
.05
. n=1
5 le
aves
per
no
dal
po
siti
on
per
gen
oty
pe.
A
B
C
p=0
.01
7*
p
=0.3
51
p
=0.1
14
p
=0.0
00
05
* p=0
.00
00
5*
p=0
.02
2*
p
=0.8
21
p
=0.0
38
*
p=0
.04
3*
D
E F
p=0
.85
1
p=0
.09
7
p=0
.12
7
p=0
.00
7*
p=0
.00
00
5*
p=0
.52
5
p=0
.49
4
p=0
.00
8*
p
=0.9
68
190

A
B
C
p=0
.00
1*
p
=0.0
04
*
p=0
.05
*
p=0
.00
1*
p
=0.0
01
* p
=0.0
01
*
p=0
.02
6*
p
=0.8
51
p
=0.0
00
05
*
E
p=0
.18
4
p=0
.25
4
p=0
.24
8
F D
p=0
.03
3*
p
=0.0
17
* p
=0.0
68
p
=0.5
48
p
=0.0
02
*
p=0
.03
2*
191

Ap
pen
dix
5. V
ein
co
mp
lexi
ty r
esu
lts
for
no
des
1-3
cau
line
leav
es. B
ran
chp
oin
t d
ensi
ty in
no
de
3 c
aulin
e le
aves
(A
), b
ran
ch p
oin
t d
ensi
ty in
no
de
2
cau
line
leav
es (
D),
bra
nch
po
int
den
sity
in n
od
e 1
cau
line
leav
es (
G).
Fre
ely
end
ing
vein
den
sity
in n
od
e 3
cau
line
leav
es (
B),
fre
ely
en
din
g ve
in d
ensi
ty in
no
de
2 c
aulin
e le
aves
(E)
, fre
ely
en
din
g ve
in d
ensi
ty in
no
de
1 c
aulin
e le
aves
(H
). V
ein
den
sity
in n
od
e 3
cau
line
leav
es (
C),
vei
n d
ensi
ty in
no
de
2 c
aulin
e
leav
es (
F), v
ein
den
sity
in n
od
e 1
cau
line
leav
es (
I). G
rap
hs
wer
e ge
ner
ate
d u
sin
g th
e st
atis
tica
l so
ftw
are
SPSS
. Err
or
bar
s re
pre
sen
t +/
- 2
SE.
Th
e p
valu
es a
re li
sted
in t
he
grap
hs.
P-v
alu
es f
ollo
we
d b
y an
ast
eris
k in
dic
ate
a si
gnif
ican
t d
iffe
ren
ce b
etw
een
th
e sa
mp
les
as m
easu
red
by
the
no
n-
par
ame
tric
Kru
skal
-Wal
lis a
nal
ysis
of
vari
ance
(A
NO
VA
) te
st u
sin
g SP
SS w
ith
a t
hre
sho
ld o
f 0
.05
. n=1
5 le
aves
per
no
dal
po
siti
on
per
gen
oty
pe.
p=0
.52
0
p=0
.00
2*
G
p=0
.13
8
H
p=0
.29
0 p
<0.0
00
05
*
p<0
.00
00
5*
I p=0
.57
6
p=0
.00
1*
p=0
.00
6*
192

193
Copyright Acknowledgements
Aloni R, Schwalm K, Langhans M, Ullrich CI. (2003). Gradual shifts in sites of free-auxin
production during leaf-primordium development and their role in vascular differentiation and
leaf morphogenesis in Arabidopsis. Planta. 216 (5), 841-53. Figures 1i, and 2g
Cubas P, Lauter N, Doebley J, Coen E. (1999). The TCP domain: a motif found in proteins
regulating plant growth and development. Plant J. 18(2), 215-22. Figure 2.
Doebley, J., Stec, A., Hubbard, L. (1997). The evolution of apical dominance in maize.
Nature, 386, 485-488. Figures 1a and 1c.
Douglas, S.J. and Riggs, C.D. (2005). Pedicel development in Arabidopsis thaliana:
contribution of vascular positioning and the role of the BREVIPEDICELLUS and ERECTA
genes. Developmental Biology. 284, 451-463. Figure 5m and 5n.
Hülskamp, M. (2004). Plant Trichomes: A Model For Cell Differentiation. Nature Reviews
Molecular Cell Biology. 5, 471-480. Figure b from Box 2.
Hubbard L, McSteen P, Doebley J, Hake S. (2002). Expression patterns and mutant
phenotype of teosinte branched1 correlate with growth suppression in maize and teosinte.
Genetics.162(4),1927-35. Figure 1.
Nelson, T and Dengler, N. (1997) Leaf Vascular Pattern Formation. Plant Cell. 9,1121-1 135.
Figure 4.
Petrášek, J and Friml, J. (2009). Auxin transport routes in plant development. Development.
136, 2675-2688. Figure 1a.
Winter D, Vinegar B, Nahal H, Ammar R, Wilson GV, and Provart, N.J. (2007). An
“Electronic Fluorescent Pictograph” Browser for Exploring and Analyzing Large-Scale
Biological Data Sets. PLoS ONE. 2(8), 1-12. Figures 11 and 21.
https://www.genevestigator.com/gv/user/serveApplet.jsp. Figure 59.