characterization of stress–strain relationships in al over a wide range of testing temperatures
TRANSCRIPT

Accepted Manuscript
Characterization of stress-strain relationships in Al over a wide range of testing
temperatures
Tamás Csanádi, Nguyen Q. Chinh, Jenő Gubicza, György Vörös, Terence G.
Langdon
PII: S0749-6419(13)00169-1
DOI: http://dx.doi.org/10.1016/j.ijplas.2013.08.014
Reference: INTPLA 1699
To appear in: International Journal of Plasticity
Received Date: 18 April 2013
Revised Date: 16 August 2013
Please cite this article as: Csanádi, T., Chinh, N.Q., Gubicza, J., Vörös, G., Langdon, T.G., Characterization of
stress-strain relationships in Al over a wide range of testing temperatures, International Journal of Plasticity (2013),
doi: http://dx.doi.org/10.1016/j.ijplas.2013.08.014
This is a PDF file of an unedited manuscript that has been accepted for publication. As a service to our customers
we are providing this early version of the manuscript. The manuscript will undergo copyediting, typesetting, and
review of the resulting proof before it is published in its final form. Please note that during the production process
errors may be discovered which could affect the content, and all legal disclaimers that apply to the journal pertain.

1 2 3 4 5 6 7 8 9 10 11 12 13 14 15 16 17 18 19 20 21 22 23 24 25 26 27 28 29 30 31 32 33 34 35 36 37 38 39 40 41 42 43 44 45 46 47 48 49 50 51 52 53 54 55 56 57 58 59 60 61 62 63 64 65
1
Characterization of stress-strain relationships in Al
over a wide range of testing temperatures
Tamás Csanádi1, Nguyen Q. Chinh
1,*, Jenő Gubicza
1, György Vörös
1 and Terence G. Langdon
2,3
1 Department of Materials Physics, Eötvös University Budapest
H-1117 Budapest, Pázmány P. sétány 1/A., Hungary
2 Departments of Aerospace & Mechanical Engineering and Materials Science
University of Southern California, Los Angeles, CA 90089-1453, USA
3 Materials Research Group, Faculty of Engineering and the Environment
University of Southampton, Southampton SO17 1BJ, U.K.
Abstract
The stress-strain relationships characterizing plastic deformation of aluminum are described
over a wide range of testing temperatures by applying both a widely used phenomenological
relationship and a well-known dislocation-based model. It is shown that over the whole range of
testing temperatures the trapping of mobile dislocations and the annihilation of forest dislocations
are controlled by the same thermally-activated dislocation motion, thereby leading to a simplified
model which uses only two parameters to describe the multiplication and the annihilation rates of
dislocations. The temperature dependence of these two microscopic quantities is explained.
Furthermore, correlations between the characteristics of macroscopic and microscopic descriptions
were established over a wide range of testing temperatures for pure Al.
Keywords: Dislocations (A), microstructures (A), strengthening mechanisms (A), constitutive
behavior (B), stress-strain relationship.
------------------------------------------------------------------------------
*Corresponding author: Nguyen Q. Chinh (tel: +36-1-3722845, e-mail: [email protected])

1 2 3 4 5 6 7 8 9 10 11 12 13 14 15 16 17 18 19 20 21 22 23 24 25 26 27 28 29 30 31 32 33 34 35 36 37 38 39 40 41 42 43 44 45 46 47 48 49 50 51 52 53 54 55 56 57 58 59 60 61 62 63 64 65
2
1. Introduction
For more than fifty years, considerable interest has been devoted to understanding the plastic
behavior of simple face-centered cubic (fcc) metals such as pure aluminum. Thirty years ago, Frost
and Ashby (Frost and Ashby, 1982) summarized both the theoretical models and experimental data
in the form of sets of deformation mechanism maps covering a very wide range of crystalline
materials including pure aluminum. These maps divided the flow behavior into a regime of
diffusion-controlled creep dominating flow at high temperatures and a regime of thermally-
activated flow dominating at low temperatures, thereby suggesting a transition from low to high
temperature behavior in the vicinity of ~0.5Tm, where Tm is the absolute melting point of the
material.
On the basis of many different experiments, it is now well established that the work
hardening of single crystals may be divided into three distinct stages, designated as I, II and III
(Nabarro et al., 1964; Berner and Kronmüller, 1965; Kovács and Zsoldos, 1973; Kocks and
Mecking, 2003). Investigations using torsion experiments (Zehetbauer and Seumer, 1993;
Zehetbauer, 1993; Les et al., 1997) have suggested the occurrence of two additional stages, denoted
as IV and V in the case of polycrystalline metallic materials. Later, applying severe plastic
deformation (SPD) techniques, which are favored methods for producing bulk ultrafine-grained
materials (Valiev et al., 2000; Valiev and Langdon, 2006; Zhilyaev and Langdon, 2008), it was
found that the flow stress tends practically to saturate (Chinh et al., 2004; Chinh et al., 2005; Chinh
et al., 2010; Csanádi et al., 2011) in accordance with the behavior charateristic for stage V.
Consequently, it is now possible to investigate the flow process over a wide range of strain at
different temperatures and this is important from both a materials science and an engineering point
of view.
According to the many experimental data, several equations were developed for the
description of the stress-strain ( ) relationships. There are both phenomenological (Hollomon,

1 2 3 4 5 6 7 8 9 10 11 12 13 14 15 16 17 18 19 20 21 22 23 24 25 26 27 28 29 30 31 32 33 34 35 36 37 38 39 40 41 42 43 44 45 46 47 48 49 50 51 52 53 54 55 56 57 58 59 60 61 62 63 64 65
3
1945; Voce, 1948; Chinh et al., 2004; Chinh et al., 2005; Farrokh and Khan, 2009; Csanádi et al.,
2011) and dislocation-based (Kocks, 1976; Estrin and Mecking, 1984; Kubin and Estrin, 1990;
Malygin, 1990; Lukác and Balík, 1994; Estrin et al., 1998; Nes, 1998; Barlat et al., 2002; Tóth et
al., 2002; Beyerlein and Tomé, 2008; Austin and McDowell, 2011; Fan and Yang, 2011; Gao and
Zhang, 2012; Bertin et al., 2013; Hansen et al., 2013; Li et al., 2013) models. In the case of the
latter, different microstructural approaches were suggested, including the evolution of the total
dislocation density (Kocks, 1976; Estrin and Mecking, 1984; Malygin, 1990; Lukác and Balík,
1994; Beyerlein and Tomé, 2009,Fan and Yang, 2011), the separate evolution of the mobile and
forest dislocations (Kubin and Estrin, 1990; Barlat et al., 2002; Wang et al., 2008; Austin and
McDowell, 2011; Gao and Zhang, 2012; Hansen et al., 2013; Li et al., 2013), the separate evolution
of the polar and non-polar dislocations (Bertin et al., 2013), the development of the dislocation
densities in cell walls and grain interiors (Estrin et al., 1998; Roters et al., 2000, Tóth et al., 2002)
and/or the subgrain size and misorientation angle (Nes, 1998) as structural parameters. Recently, the
plastic deformation of polycrystals was described also by considering the grain boundary effects
(Lim et al., 2011) and the grain size gradient (Li and Soh, 2012) in the case of nanostructured
materials. As all of the macroscopic and microscopic models reasonably describe the experimental
data, despite their different approaches, there should be a correlation between the main
characteristics of these various models. A knowledge of any possible connections would certainly
help in achieving a deeper understanding of the mechanisms of plastic deformation, and also it
would contribute towards an understanding of the physical meanings of the parameters used in the
different models.
This was the motivation for the present work and for the earlier studies reported recently
(Chinh et al., 2010; Csanádi et al., 2011). Accordingly, this work may be regarded as a continuation
of these recent reports where the room temperature plastic behavior of pure Al and several other fcc
metals was studied over a wide range of strain. In these earlier reports (Chinh et al., 2010; Csanádi
et al., 2011) the relationships were examined between the parameters of the microscopic processes

1 2 3 4 5 6 7 8 9 10 11 12 13 14 15 16 17 18 19 20 21 22 23 24 25 26 27 28 29 30 31 32 33 34 35 36 37 38 39 40 41 42 43 44 45 46 47 48 49 50 51 52 53 54 55 56 57 58 59 60 61 62 63 64 65
4
adopted in the classic Kubin-Estrin (KE) model (1990) and the characteristics of a recent
macroscopic description (Chinh et al., 2004). Based on this earlier analysis, the present work is
focused on the plastic behavior of pure Al deformed at different testing temperatures. Specifically,
the effects of thermal activation are investigated in terms of the temperature dependence of the
relevant characteristics of the macroscopic (Chinh et al., 2005) and microscopic KE (Kubin and
Estrin, 1990) descriptions. In order to place this report in perspective, the following section
provides a brief description of the background to the analysis.
2. Background to the analysis: Macroscopic description of the plastic deformation in Al
In an earlier work (Chinh et al., 2005) high purity (99.99%) aluminum samples were
deformed by tensile tests over a wide range of temperature between 293 K (room temperature) and
738 K. The specimens were annealed for 30 min. at 673 K to give an initial grain size of ~190 m
and then tested using an MTS testing machine operating at a constant cross-head velocity with
initial strain rate of 13100.1 s . Additional data were also used in this earlier analysis based on
information reported previously for the same material where samples were produced by processing
through equal-channel angular pressing (ECAP) (Iwahashi et al., 1998a; Komura et al., 1999). For
this purpose, aluminum billets having diameters of 10 mm and lengths of 60 mm were annealed and
pressed through a channel at room temperature using a solid die with an angle of 90 between the
two parts of the channel and an angle of ~30 representing the outer arc of curvature where the two
parts of the channel intersect. These internal angles lead to an imposed strain of ~1 on each passage
through the die. Further details on the principles of processing by ECAP are given in earlier reports
(Iwahashi et al., 1997; Iwahashi et al., 1998b; Furukawa et al., 2001, Valiev and Langdon, 2006)
and it is important to note that processing by ECAP provides the opportunity to introduce large
strains into the material.
It was demonstrated that the macroscopic stress-strain ( ) relationship may be fitted by
a phenomenological constitutive relationship of the form (Chinh et al., 2004; Chinh et al., 2005):

1 2 3 4 5 6 7 8 9 10 11 12 13 14 15 16 17 18 19 20 21 22 23 24 25 26 27 28 29 30 31 32 33 34 35 36 37 38 39 40 41 42 43 44 45 46 47 48 49 50 51 52 53 54 55 56 57 58 59 60 61 62 63 64 65
5
n
c
exp110 (1)
where o , 1 , c and the exponent n are fitting parameters and the strain is taken as the absolute
amount of plastic strain relative to the annealed state. Physically, the first constant o , is the
friction stress related to the onset of plastic deformation which is then described by the three fitting
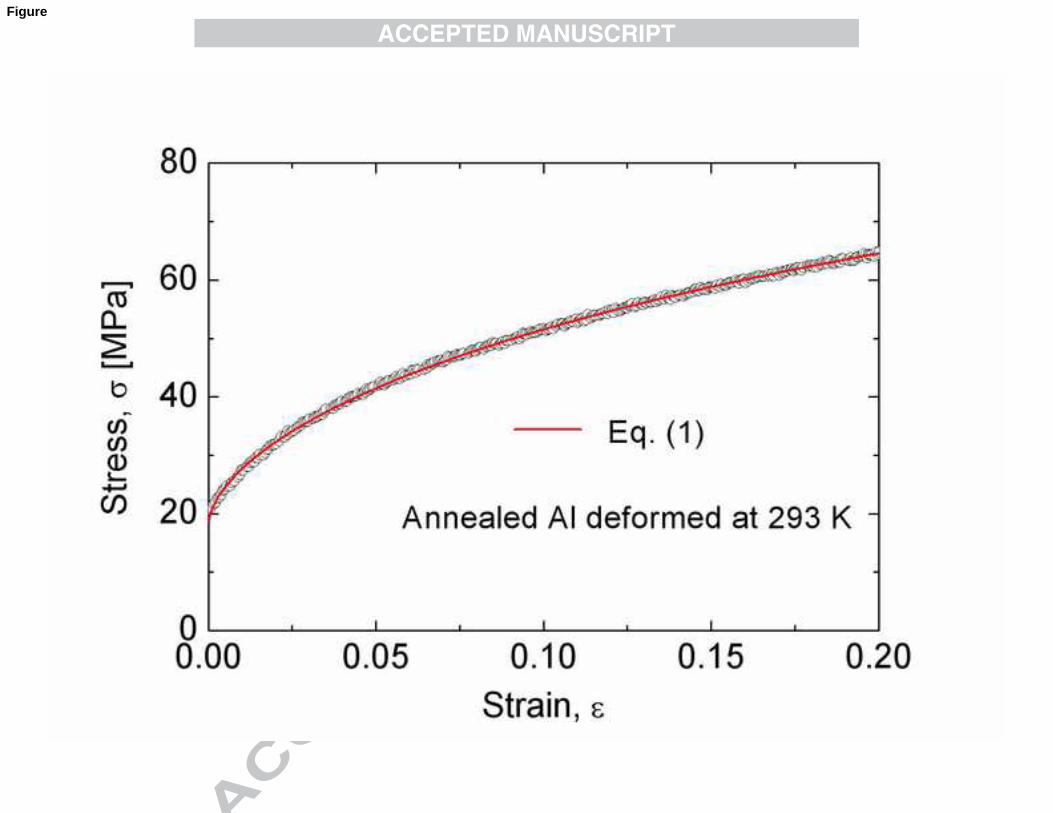
parameters, 1 , c and n. Fig. 1 shows, for example, the experimental data obtained at room
temperature and a fitted line based on Eq. (1) for two separate situations: very small initial strains as
achieved in conventional tensile testing in Fig. 1a and a very wide range of strain including the high
strains imposed in ECAP in Fig. 1b where the datum points represent the individual measured yield
stresses. In practice, the flow stress of the specimens subjected to ECAP is documented by reading
the 0.2% proof stress, 2.0 obtained in the tensile test. This approach is given in Fig. 1b where the
strain is defined as the sum of that resulting from the tensile test and the imposed strain due to
ECAP processing so that a zero strain corresponds to the initial unpressed and annealed condition.
The results shown in Fig. 1 confirm the validity of the constitutive relationship given by Eq. (1) and
the data in Fig. 1b demonstrate a smooth transition from the low strains attained in tensile testing to
the high strains imposed through severe plastic deformation. An examination of Eq. (1) shows that,
as the flow stress, , tends to a saturation value
1osat , (2)
the deformation may be regarded as a steady-state process similar to the flow in the secondary or
steady-state stage of creep. At relatively low testing temperatures in the range from 293 to 473 K,
the saturation state is attained only at very high strains (i.e., sat95.0 , if 2 ) so that, for
practical purposes at least, the deformation of annealed samples is represented by the work-
hardening behavior over the entire range of deformation. Under these conditions, the macroscopic

1 2 3 4 5 6 7 8 9 10 11 12 13 14 15 16 17 18 19 20 21 22 23 24 25 26 27 28 29 30 31 32 33 34 35 36 37 38 39 40 41 42 43 44 45 46 47 48 49 50 51 52 53 54 55 56 57 58 59 60 61 62 63 64 65
6
flow stress increases monotonously with increasing strain and this is essentially equivalent to the
primary stage in conventional high temperature creep.
An increase in the testing temperature leads to the advent of the secondary stage of creep at
relatively small strains. For instance, in Fig. 2 there is a positive stage of work-hardening
( 0/ ) in the early stages of deformation at 623 K (see Fig. 2a), whereas there is a maximum
flow stress and then a slight decrease in the curve when data are plotted over the entire range
of strain at 623 K as shown in Fig. 2b. A mathematical analysis shows that, for the real work-
hardening stage, the relationship may be accurately described by Eq. (1) as denoted by the
solid lines in Figs. 2a and 2b. Figure 2b plots both the measured and the fitted data over the entire
strain range at 623 K and inspection of this plot shows that the saturation stress ( 1osat )
obtained from fitting the real hardening stage by Eq. (1) practically coincides with the maximum
measured value. As already mentioned in the earlier work (Chinh et al., 2005), in the stage of
secondary creep, which occurs after the maximum stress, the flow stress is very sensitive to the
strain rate and in practice, in tensile testing at constant cross-head velocity, the strain rate decreases
slightly with increasing strain leading to a slight decrease in the measured flow stress. In addition,
the flow stress may decrease at high temperatures due to the advent of recovery and/or dynamic
recrystallization.
Describing the stress-strain relationships by using Eq. (1), the relevant values of the fitting
parameters obtained for different testing temperatures are given in Table 1. It is important to
emphasize that an approach incorporating Eq. (1) is consistent with the major features of the more
conventional and well-established Hollomon-type power law with an exponent n (Hollomon, 1945)
and the Voce-type exponential relationship having 1n (Voce, 1948). Expressing Eq. (1) as a
Taylor expansion at small strains leads to
n
o K

1 2 3 4 5 6 7 8 9 10 11 12 13 14 15 16 17 18 19 20 21 22 23 24 25 26 27 28 29 30 31 32 33 34 35 36 37 38 39 40 41 42 43 44 45 46 47 48 49 50 51 52 53 54 55 56 57 58 59 60 61 62 63 64 65
7
which is the conventional power-law Hollomon relationship where K is a constant. Taking 1n ,
Eq. (1) leads to the Voce-type exponential equation:
cosat
t
expsa ,
where sat is the saturation stress given by Eq. (2) ( 10 sat ).
Figure 3 shows the temperature dependence of sat derived earlier (Chinh et al., 2005) by
applying Eq. (1) for pure aluminum over a wide range of testing temperatures (see the values of
sat in Table 1). Examining the effect of thermal activation on sat , it was shown earlier (Chinh et
al., 2005) that the temperature dependence of sat for pure aluminum over a wide range of testing
temperatures can be divided readily into two distinct regions corresponding to a low temperature
behavior at T < 0.5Tm and a high temperature behavior at T > 0.5Tm. The application of the
macroscopic Eqs. (1) and (2) leads, therefore, to the definition of two distinct temperature regimes
occurring at low and high temperatures, where the process of plastic deformation can be
characterized by different strain rate sensitivities and different activation energies.
In addition, it was shown previously (Chinh et al., 2004) that the macroscopic stress-strain
relationship given by Eq. (1) can be supported by considering the effect of microscopic mechanisms
of dislocation-based processes. It is well known that the strengthening of pure metals is basically
determined by the interaction between dislocations (Chinh et al., 2004; Chinh et al., 2010; Csanádi
et al., 2011) and the underlying processes of plastic deformation are the formation and the
annihilation of dislocations. Considering the rapid development of the cell and/or subgrain structure
in deformed metals, both types of dislocation densities, m for mobile dislocations and f for
forest dislocations, must be incorporated into any analysis in order to provide an accurate
description of the development of dislocations during plastic deformation. The average total
dislocation density, , is the sum of these two components so that fm . It was showed in

1 2 3 4 5 6 7 8 9 10 11 12 13 14 15 16 17 18 19 20 21 22 23 24 25 26 27 28 29 30 31 32 33 34 35 36 37 38 39 40 41 42 43 44 45 46 47 48 49 50 51 52 53 54 55 56 57 58 59 60 61 62 63 64 65
8
earlier studies (Chinh et al., 2004; Chinh et al., 2010; Csanádi et al., 2011) that the KE model can be
effectively used to describe the development of these dislocation densities in the case of pure fcc
metals. Mathematically, the application of this model requires a numerical solution of the following
equations:
2/1
321 fmm CCC
d
d
(3a)
and
ffm
fCCC
d
d
4
2/1
32 (3b)
where the terms containing parameters Ci are related to the primary competing microscopic
processes occurring during plastic deformation, such as the multiplication of mobile dislocations
1C , their mutual trapping 2C , their immobilization through interactions with forest
dislocations 3C and their annihilation 4C . The values of the parameters Ci representing the
effect of the basic mechanisms for any given material were determined by applying Eqs. (3a) and
(3b) so that the stress-strain values deduced from their numerical solution describe best the
experimental data (Chinh et al., 2004; Chinh et al., 2010; Csanádi et al., 2011). In this analysis the
stress is calculated from the total dislocation density by the Taylor equation. Applying the
macroscopic description based on Eq. (1) and microscopic description based on Eqs. (3a) and (3b),
several plastic features of face-centered cubic Al, Au, Cu and Ni metals deformed at room
temperature were discussed - such as the macroscopic stress-strain relationship, the steady state
flow, the melting point dependence of the saturation dislocation density and the saturation stress. In
the followings the stress-strain relationships obtained at different testing temperatures for pure Al,
reported in an earlier work (Chinh et al., 2005) will be characterized by using the KE theoretical
model and the corresponding numerical calculation.

1 2 3 4 5 6 7 8 9 10 11 12 13 14 15 16 17 18 19 20 21 22 23 24 25 26 27 28 29 30 31 32 33 34 35 36 37 38 39 40 41 42 43 44 45 46 47 48 49 50 51 52 53 54 55 56 57 58 59 60 61 62 63 64 65
9
3. Microscopic description by the dislocation-based mechanisms
3.1. Investigation of stress-strain relationship
The stress-strain data in the range of real work-hardening ( 0/ ) obtained for pure Al
deformed at different temperatures were also evaluated by the dislocation-based KE model (Kubin
and Estrin, 1990). Thus, Eqs. (3a) and (3b) were solved numerically to yield the mobile and forest
dislocation densities as a function of strain and the parameters Ci. Then the values of parameters Ci
were determined from the best agreement between the experimental flow stress data arising from
plastic deformation, 0 p , and the values calculated from the total dislocation density,
fm , using the well-known Taylor equation:
0 bp . (4)
In all cases, the value of the initial dislocation density, 0 , was chosen as 21110x1 m . In this
equation, is a numerical constant including the Taylor factor ( 7.0 was chosen for all testing
temperatures as this value was also used for all fcc metals in the earlier calculations (Chinh et al.,
2010; Csanádi et al., 2011)), is the temperature-dependent shear modulus having the equation
given by Frost and Ashby (Frost and Ashby, 1982) and b is the magnitude of the Burgers vector. It
should be noted that in plastically deformed metals usually two strengthening contributions are
considered: (i) dislocation strengthening and (ii) grain boundary strengthening. However, it has
been shown that each of these two contributions can be described by a Taylor-type equation as the
majority of boundaries in deformed metals are built up from dislocations (Hughes and Hansen,
2000). Thus, in the present study the effect of grain size is also included in the Taylor relationship
describing the dislocation–dislocation interactions. The values of parameters Ci obtained from the
evaluation of the stress-strain curves are listed in Table 2. It is also noted that the deformation-

1 2 3 4 5 6 7 8 9 10 11 12 13 14 15 16 17 18 19 20 21 22 23 24 25 26 27 28 29 30 31 32 33 34 35 36 37 38 39 40 41 42 43 44 45 46 47 48 49 50 51 52 53 54 55 56 57 58 59 60 61 62 63 64 65
10
induced texture may change the value of the Taylor factor, M, thereby influencing the dislocation
density determined from the experimental flow stress using the Taylor equation. However, in
compressed or ECAP-processed fcc metals the texture is usually weak and this yields only a slight
deviation (less than 5% (Gubicza et al., 2008)) of the Taylor factor from the value characterizing the
random case (3.06). Thus, the influence of texture on parameters Ci in the KE model is negligible
compared to the effect of deformation temperature. The values of parameters Ci now permit an
analysis of the roles of individual micro-mechanisms operating during plastic deformation in Al at
different testing temperatures.
As an example, Fig. 4a plots the mobile, the forest and the total dislocation densities
obtained as the best solutions of Eqs (3a) and (3b) for Al deformed at 623 K. The corresponding
microscopic stress-strain curve calculated up to very high strains of 2 is shown in Fig. 4b together
with the experimental data and the macroscopic stress-strain function obtained from the fitting by
using Eq. (1). It is readily apparent from Fig. 4b that there is a very good agreement between the
experimental data and the macroscopic/microscopic descriptions given by Eq. (1) and Eqs. (3a, 3b),
respectively. In practice, a similar acceptable agreement was obtained in this study for all testing
temperatures, thereby providing a confirmation for the basic principles of the KE theoretical model.
Further analysis also shows that, similar to the results obtained for different fcc metals
deformed at RT (Csanádi et al., 2011), the coincidence between the experimental and the calculated
stress-strain data for Al over a wide range of temperature is sensitive to the values of the parameters
C1, C2 and C4 given in Table 2. It should be noted that during the fitting procedure the best values of
the parameters Ci were chosen so that the usual mathematical variance characterizing the usability
of the fitting procedure is minimal. Results of the sensitivity analysis show that when the value of
the minimal variance is changing within 1%, the values of C2 and C4 are almost the same. A relative
difference higher than 20% between these two parameters will lead to a drastic increase of the
variance, confirming that the coincidence of the coefficients C2 and C4 is genuine. By contrast, the
determination of the parameter C3 is accompanied by high uncertainty, as the simulation results

1 2 3 4 5 6 7 8 9 10 11 12 13 14 15 16 17 18 19 20 21 22 23 24 25 26 27 28 29 30 31 32 33 34 35 36 37 38 39 40 41 42 43 44 45 46 47 48 49 50 51 52 53 54 55 56 57 58 59 60 61 62 63 64 65
11
change only slightly over a wide range for this parameter. The low sensitivity on the value of C3 is a
consequence of the fact that, at every testing temperature, the value of the term 2/1
3 fC is about two
orders of magnitude lower than any other term in Eq. (3a) or Eq. (3b). This is demonstrated directly
in Fig. 5 for the sample deformed at 623 K. Thus, mf CC 2
2/1
3 and ff CC 4
2/1
3 so that
the result means that during the plastic deformation of Al over a wide range of temperature the
reduction in the mobile dislocation density can be attributed mainly to the trapping due to the
interaction between mobile dislocations (by the term mC 2 ) rather than to the mobile-forest
interaction. Furthermore, the results of the numerical calculations applying Eqs. (3a) and (3b) (see
Table 2) also show that the values of the parameters C2 and C4 agree within the experimental error
for all testing temperatures, similar to other fcc metals deformed at RT (Csanádi et al., 2011).
As was mentioned earlier, many different dislocation-based models are available in the
literature, which – despite their different approaches – reasonably describe the experimental data in
different stages of plastic deformation by calculating the total ( ) dislocation density. The
treatment of the dislocation components, however, still remains an open question. Concerning the
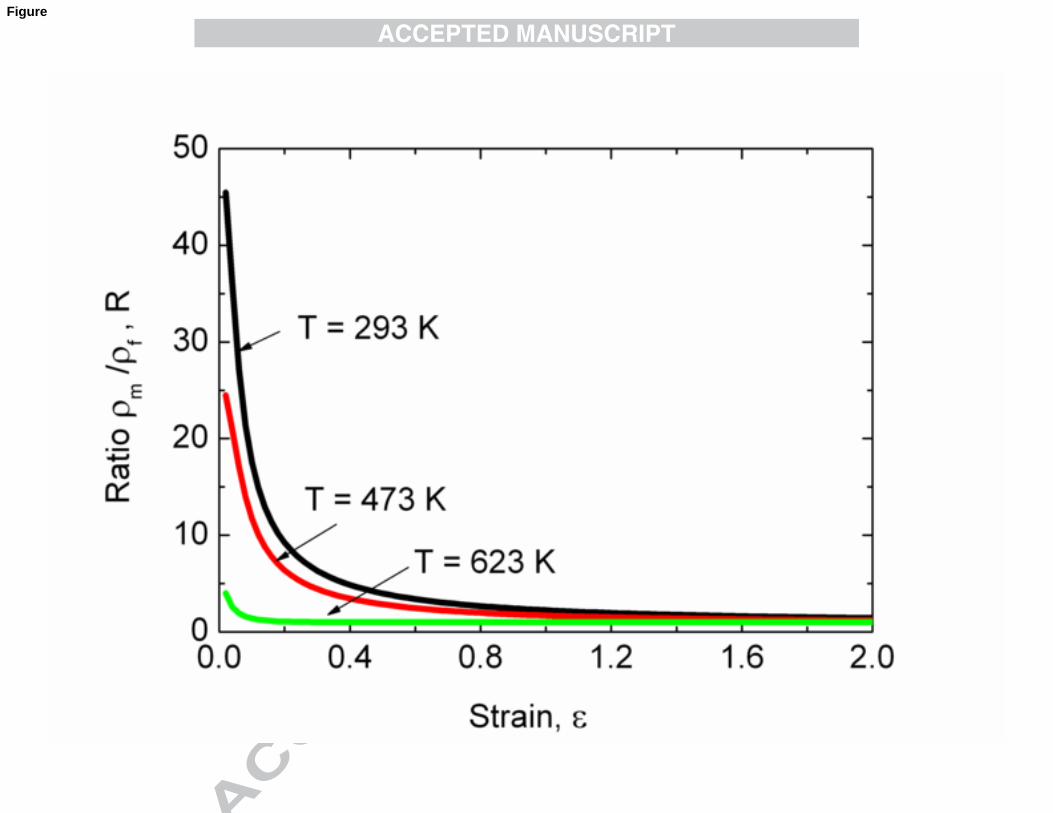
dislocation densities numerically calculated in this work, Fig. 6 shows the ratios (R) of mobile to
forest density obtained for some testing temperatures. It can be seen that at low strains ( 1.0 ) the
ratio R obtained for room temperature is higher that 10 (see Fig. 6a), showing that the mobile
dislocation density represents a major fraction of the total density. This result is similar to that
obtained through numerical calculation by Bertin et al. (Bertin et al., 2013), or that obtained through
the discrete dislocation dynamic (DDD) simulations of Wang et al. (Wang et al. 2009) for single
crystals. The evolution of microstructure at low strains – in stages I-III – can be understood if we
consider the deformation process starting from the well-annealed state having a low initial
dislocation density. The work done by plastic deformation is mainly associated with the creation of
new (mobile) dislocations (for instance, by the term C1 in Eq. (3a)), leading to a higher fraction of
the mobile to total densities. In the later stages of the plastic deformation, the fraction of the forest

1 2 3 4 5 6 7 8 9 10 11 12 13 14 15 16 17 18 19 20 21 22 23 24 25 26 27 28 29 30 31 32 33 34 35 36 37 38 39 40 41 42 43 44 45 46 47 48 49 50 51 52 53 54 55 56 57 58 59 60 61 62 63 64 65
12
dislocation density governed by Eq. (3b) is enhanced with increasing mobile density, resulting in a
decrease of the ratio R which is, together with both dislocation components, eventually saturated at
high strains (see Fig. 6b).
The saturation of other kinds of dislocation components, as with the dislocation densities in
cell walls and grain interiors (Estrin et al., 1998; Roters et al., 2000) calculated for the analysis of
the slip resistance at high strains including the stages III-V, is also well-established in the
description of the plastic deformation of different cell/subgrain-forming metals and alloys. It should
be noted that in this case the component (cell wall and cell interior) dislocation densities are defined
for different volume fractions of the samples, being rather local dislocation densities inside the cell
wall and inside the cell interior, respectively. As the fraction of the cell wall, wf is generally low,
wf may decrease from 0.25 to only 0.05 ((Estrin et al., 1998), and the local cell wall (immobile)
dislocation density may be much higher than the cell interior (mobile) density which is defined for a
much higher volume fraction.
Considering the mentioned features of the numerical solutions, Eqs. (3a) and (3b) of the KE
model can be simplified for Al over a wide range of testing temperature, as they were already
simplified for other fcc metals deformed at RT (Csanádi et al., 2011). Briefly, in the first step,
neglecting the term 2/1
3 fC , Eqs. (3a) and (3b) can be simplified as:
m
mCC
d
d
21 (5a)
and
fm
fCC
d
d
42 , (5b)
respectively. Considering the saturation state at high strains, where the mobile and forest dislocation
densities are saturated to satm , and satf , , respectively, and from Eq. (5b)

1 2 3 4 5 6 7 8 9 10 11 12 13 14 15 16 17 18 19 20 21 22 23 24 25 26 27 28 29 30 31 32 33 34 35 36 37 38 39 40 41 42 43 44 45 46 47 48 49 50 51 52 53 54 55 56 57 58 59 60 61 62 63 64 65
13
0,4,2
, satfsatm
satfCC
d
d
(6)
we get
2
4
,
,
C
C
satf
satm
. (7)
The similarities in values of C2 and C4 (Table 2) results in similar saturation densities for the forest
and mobile dislocations. It has been shown for several fcc metals deformed at RT that the similar
values of C2 and C4 suggest that both the trapping of mobile dislocations and the annihilation of
forest dislocations are controlled by the same thermally activated dislocation motion (Csanádi et al.,
2011).
In addition, there are some further important consequences of the simplification of the KE
model. Starting from the total dislocation density fm , we get:
fmf
CCd
d
d
d
d
d
41 . (8)
Differentiating this equation with respect to leads to:
d
dC
d
d f
42
2
. (9)
Substituting Eq. (5b) into Eq. (9) we get:
fm CCCd
d
4242
2
. (10)
Using the relationships fm and
d
dCC f 14 , Eq. (10) can be rewritten as:
d
dCCCCCCC
d
dCCC
d
dff 44142421242
2
,

1 2 3 4 5 6 7 8 9 10 11 12 13 14 15 16 17 18 19 20 21 22 23 24 25 26 27 28 29 30 31 32 33 34 35 36 37 38 39 40 41 42 43 44 45 46 47 48 49 50 51 52 53 54 55 56 57 58 59 60 61 62 63 64 65
14
or
d
dCCC
d
dCCCC
d
d44112422
2
. (11)
Re-arranging Eq. (11) leads to a second-order differential equation for the total dislocation density,
:
042142422
2
CCCCCd
dCC
d
d
, (12)
in which the role of parameters C2 and C4 is symmetrical. Considering the results of numerical
simulation based on the experimental data (see Table 2), it is reasonable to take the parameters C2
and C4 as equal ( 42 CC ). In this case, Eq. (12) can be expressed simply as:
022 41
2
442
2
CCCd
dC
d
d
, (13)
which has analytical solution given by the following closed form:
44
0
4
1
4
1 exp2
122
)( CC
C
C
C
C
, (14)
where 0 is the initial dislocation density at 0 ( 0)0( ). As mentioned earlier, this value
is taken as 21110x1 m at every testing temperature for the best solutions in the present analysis. In
the solution of Eq. (13) the initial value of the first derivative of is given by Eq. (8) as
)0()0( 41 fCC and as a first approximation, it is reasonable to take
22
)0()0()0(
0 fm in every calculation (here the ratio 10/0 fm . The results
of the present analysis would change within only 2% if the ratio 0/0 fm changed between 0.1
and 10). Applying the analytical solution Eq. (14), the values of parameters C1 and C4 determined
by the simplified KE model are listed in Table 3. It can be seen that they are only slightly different

1 2 3 4 5 6 7 8 9 10 11 12 13 14 15 16 17 18 19 20 21 22 23 24 25 26 27 28 29 30 31 32 33 34 35 36 37 38 39 40 41 42 43 44 45 46 47 48 49 50 51 52 53 54 55 56 57 58 59 60 61 62 63 64 65
15
from the values obtained using the original KE model as given in Table 2. As an example, Fig. 7
compares the total dislocation densities obtained from the KE model and the simplified KE model
using Eqs. (3a-b) and (4), respectively, for Al deformed at 293 K, 473 K and 623 K. The good
agreement between the dislocation densities gives a clear confirmation of the validity of the
simplified KE model. It should be emphasized that the expected maximum dislocation density,
max , can be calculated from these equations. The values of max and the parameters C1 and C4 in
Eq. (4) are strongly affected by the testing temperature, as can be seen in Table 3.
3.2. Relationships between the characteristics of the macroscopic and microscopic descriptions
Considering Eq. (12) for the total dislocation density and its analytical solution given in Eq.
(13), the flow stress increment produced by the plastic strain (p,cal) can be calculated using Eq. (4)
as:
04
4
0
4
1
4
1
, exp2
122
CC
C
C
C
Cbcalp , (15)
which is affected also by the microscopic processes, characterized by 1C and 4C parameters, of
plastic deformation. The strain dependence of this flow stress increment, p,cal produced by the
plastic strain allows us to correlate it to the corresponding strain-dependent term, the second term,
in the phenomenological Eq. (1):
n
c
phenp
exp11, (16)
which is determined by the macroscopic parameters 1 , c and n. Making Eqs. (15) and (16) equal
at high strains leads to:
0
4
11
2
C
Cb , (17)

1 2 3 4 5 6 7 8 9 10 11 12 13 14 15 16 17 18 19 20 21 22 23 24 25 26 27 28 29 30 31 32 33 34 35 36 37 38 39 40 41 42 43 44 45 46 47 48 49 50 51 52 53 54 55 56 57 58 59 60 61 62 63 64 65
16
which reflects quantitatively that the maximum strength attainable during plastic deformation is
determined unambiguously by the multiplication and annihilation of dislocations over a wide range
of testing temperatures. Investigating the equality of Eqs. (15) and (16) at c , we get:
eC
C
C
C
C
Cb c
c 11exp
21
22104
4
0
4
1
4
1
,
and substituting the value of 1 by the formula given in Eq. (17) yields
eC
CC
C
C
C
C
Cc
c 11
2exp
21
220
4
1
04
4
0
4
1
4
1
. (18)
Dividing both sides of eq. (18) by 4
12
C
C, taking the value of the ratio
4
1
0
2/
C
C between 10
-2
and 10-3
, as well as the value of its square root between 10-1
and 3x10⁻²
, the value of the quantity
cC 4 can be obtained between 0.88 and 1.01 for different testing temperature. It is reasonable to
approximate the product of cC 4 by one, so that
4
1
Cc . (19)
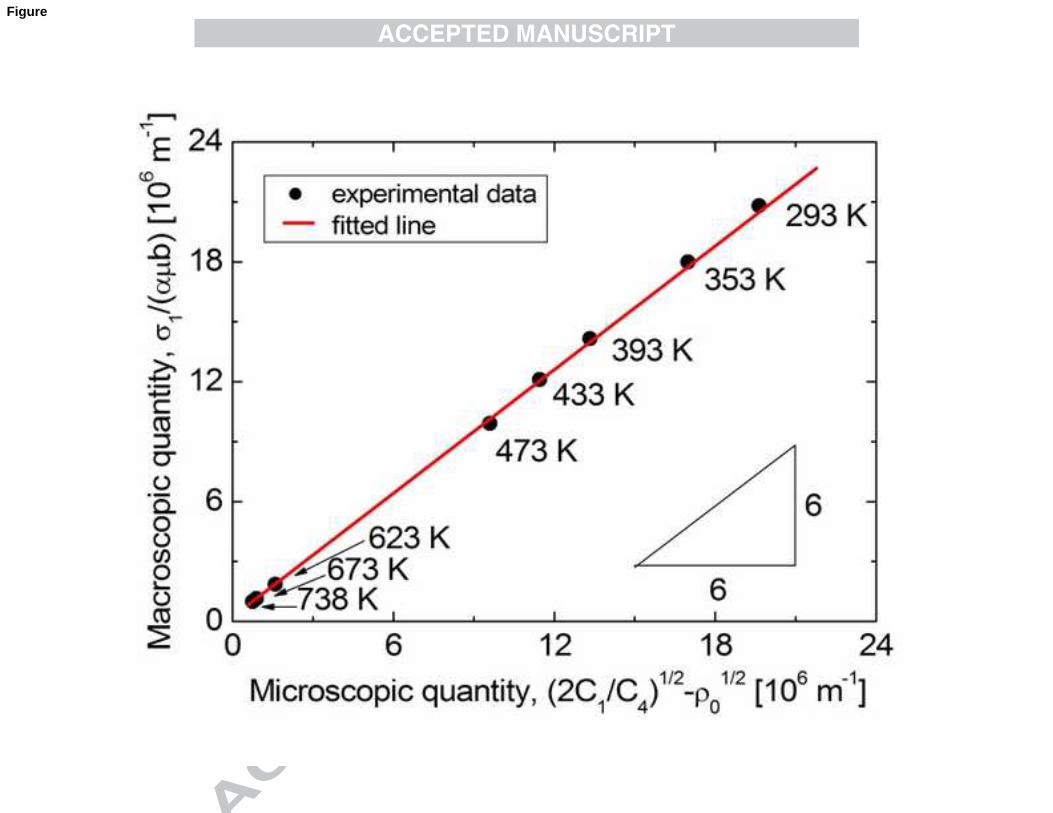
Both the Eqs. (17) and (19) represent useful relationships between the characteristics of
macroscopic description by eq. (1) and microscopic description given by Eqs. (3a, 3b). Figure 8
shows the relationship between the quantities b
1 and 0
4
12
C
C (Fig. 8a) as well as
between the quantities c and 4
1
C (Fig. 8b) for different testing temperatures, for which the value
of 1 and c , and that of C1 and C4 are listed in Tables 1 and 3, respectively. The datum points in
both figures are fitted well by straight lines which go through the origin. The slopes of ~1 in both

1 2 3 4 5 6 7 8 9 10 11 12 13 14 15 16 17 18 19 20 21 22 23 24 25 26 27 28 29 30 31 32 33 34 35 36 37 38 39 40 41 42 43 44 45 46 47 48 49 50 51 52 53 54 55 56 57 58 59 60 61 62 63 64 65
17
Figs. 8a and 8b unambiguously confirm the validity of Eqs. (17) and (19) describing the
relationships between the characteristics ( c ,1 ) of the macroscopic description and (C1, C4) of
the microscopic mechanisms. Equations (17) and (19) also mean that the values of C1 and C4 can be
estimated from 1 and c , respectively, for pure Al deformed at different testing temperatures.
3.3. The temperature dependence of the microscopic mechanisms
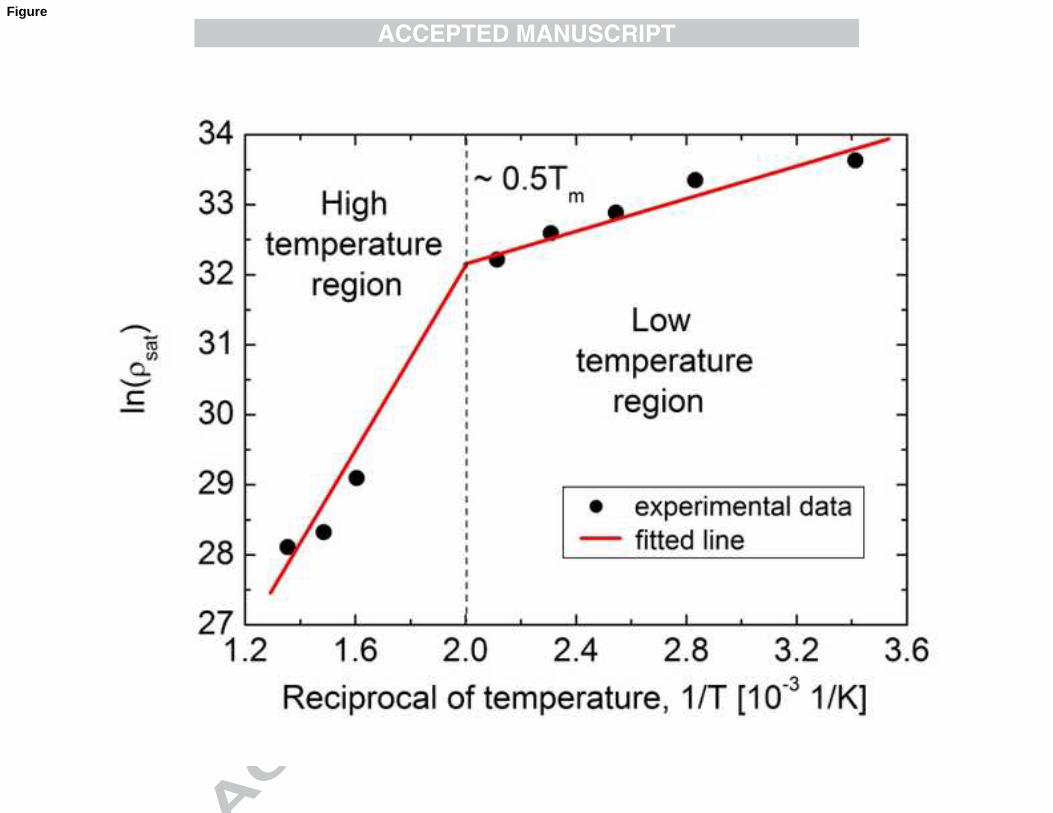
As already noted, the experimental and numerical results (given in Table 3) show that the
quantities sat , C1 and C4 are strongly temperature-dependent. As sat is closely related to sat via
the Taylor formula, the natural logarithm of the saturation dislocation density versus the reciprocal
of the testing temperature ( T/1 ) is plotted in Fig. 9a. The datum points in Fig. 9a can be divided
into two distinct groups corresponding to low and high temperatures, respectively. The transition
between the two regions occurs at a temperature of 473-483 K (200-210oC), equivalent to a
homologous temperature of ~0.51-0.52Tm, where Tm is the absolute melting temperature of Al.
Considering the Taylor formula in Eq. (4), the Tsat /1ln function obtained in the present work
corresponds to the Tsat /1ln plot shown in Fig. 3, reported in an earlier work (Chinh et al.,
2005). It is well-known that in the high temperature region ( mTT 5.0 ) the plastic deformation in
Al is controlled mainly by self-diffusion having an activation energy of about molkJ /140130
(Frost and Ashby, 1982; Chinh et al., 2005), whilst the annihilation of dislocations in the saturation
state at low temperatures ( mTT 5.0 ) occurs instead by pipe diffusion and/or grain boundary
diffusion and has a much lower activation energy of about molkJ /8482 (Frost and Ashby,
1982; Chinh et al., 2006). This difference in the activation energies lead to the low and high
temperature regions of the sat . It should be noted that the difference in the slopes of the two fitted
straight lines in Fig. 9a do not reflect directly the difference in the activation energies in the two
temperature regimes as the slopes are also affected by the strain rate sensitivity parameter (Chinh et

1 2 3 4 5 6 7 8 9 10 11 12 13 14 15 16 17 18 19 20 21 22 23 24 25 26 27 28 29 30 31 32 33 34 35 36 37 38 39 40 41 42 43 44 45 46 47 48 49 50 51 52 53 54 55 56 57 58 59 60 61 62 63 64 65
18
al., 2005 and 2006). The larger slope in the high temperature regime is caused by both the larger
activation energy and the larger strain rate sensitivity parameter.
According to Eq. (14) the saturation dislocation density can be expressed by C1 and C4 as
4
12
C
Csat . Therefore, the temperature dependence of C1 and C4 determine the variation of sat as a
function of temperature. Figure 9b plots the values of parameters C1 and C4 as a function of
temperature, T. Different tendencies can be observed as the multiplication of dislocation (C1) is
decreasing while the annihilation of dislocation (C4) is increasing with increasing testing
temperature. These trends are in accordance with the model proposed previously for an explanation
of the results obtained by the KE evaluation procedure (Csanádi et al., 2011). This simple model
was already applied successfully for the interpretation of the similar values of C2 and C4 and the
negligible magnitude of 2/1
3 fC compared to other terms in the KE equations (Csanádi et al.,
2011). In this model, the mobile dislocations multiply at jogs which are formed due to the
intersection of dislocations by other dislocations gliding on non-coplanar planes, as illustrated in
Fig. 10, where the jog is indicated by a thick dotted line. Our model is in accordance with previous
studies (e.g. Hsiung and Lassila, 2002) which have revealed that in pure metals the jogs formed on
screw dislocations act as the most important dislocation multiplication sources when deformed
under quasi-static conditions. Most probably, this mechanism remains dominant even for large
dislocation densities. In Fig. 10 the direction and the length of the jog formed on the first
dislocation gliding in plane S1 correspond to the Burgers vector of the other dislocation. Usually the
slip plane of the jog does not lie in the moving direction of the gliding segments in planes S1 and S2
and therefore the jog can follow these segments only through a non-conservative motion. Due to the
difficulty of this motion, the jog falls behind the gliding segments and, as a result, the two gliding
segments bow out in planes S1 and S2, yielding an increase in the mobile dislocation density. With
increasing temperature, the climb of the jog becomes easier due to more rapid vacancy diffusion,
and therefore the lagging of the jog behind the gliding segments is reduced and the length of the

1 2 3 4 5 6 7 8 9 10 11 12 13 14 15 16 17 18 19 20 21 22 23 24 25 26 27 28 29 30 31 32 33 34 35 36 37 38 39 40 41 42 43 44 45 46 47 48 49 50 51 52 53 54 55 56 57 58 59 60 61 62 63 64 65
19
newly formed mobile dislocations decreases. The lower rate for the formation of mobile
dislocations at the higher temperature is reflected in the lower value of C1.
In this model the forest dislocations are formed by trapping the mobile dislocation segments
with opposite signs gliding in planes S1 and S2 in the vicinity of the jog. These segments in Fig. 10
are illustrated by thick solid and dashed lines. There is an attractive interaction between these
segments and they can move towards each other by thermally-activated mechanisms such as climb
to form an immobile dipole. Later, these dislocation segments are annihilated by the same
mechanism, which leads to the close values of C2 and C4. With increasing temperature, the easier
occurrence of the thermally-activated processes yields a faster trapping and annihilation of
dislocations, leading to larger values of C4.
Figure 9b reveals that in the low temperature regime ( mTT 5.0 ) the temperature
dependence of parameter C4 is much weaker than that for parameter C1. At the same time, at high
temperatures ( mTT 5.0 ) parameter C4 shows a strong sensitivity to temperature variation. As
4
12
C
Csat , therefore the temperature dependence of sat is determined mainly by the formation of
mobile dislocations (C1), and the annihilation of forest dislocations (C4) in the low and high
temperature regimes, respectively. Our simple model can also be used to explain the very weak
sensitivity of parameter C4 to temperature variation for mTT 5.0 . At low temperatures, the
annihilation of dislocations in forest dipoles is strongly facilitated by the large attractive stresses
between them as they are very close to each other (their spacing equals the height of the
corresponding jog), therefore the effect of temperature is limited. At high temperatures instead of
dislocation pipe and grain boundary diffusion the vacancies migrate by bulk diffusion which is
more temperature-dependent, because it has a larger activation energy than the former processes. As
a consequence, the sensitivity of the annihilation of forest dislocations (C4) to temperature strongly
increases at high temperatures. It would be useful to develop an analytical equation to describe the
temperature dependence of both the C1 and C4 parameters. Further investigations are needed to

1 2 3 4 5 6 7 8 9 10 11 12 13 14 15 16 17 18 19 20 21 22 23 24 25 26 27 28 29 30 31 32 33 34 35 36 37 38 39 40 41 42 43 44 45 46 47 48 49 50 51 52 53 54 55 56 57 58 59 60 61 62 63 64 65
20
study the relationships shown in Fig. 9b in more detail. It will be the subject of further research
including measurements taken at different strain rates on Al and possibly for other fcc metals.
It is noted that the strong annihilation of dislocations can explain the general instability in
the microstructure of pure Al after severe plastic deformation (SPD) such as equal-channel angular
pressing (ECAP) when annealing at temperatures above ~473 K (0.51Tm) (Hasegawa et al., 1999).
An example of this effect can be seen in Fig. 11 for a sample of pure Al subjected to ECAP
processing at room temperature to an imposed strain of ~8 to obtain an ultrafine-grained (UFG)
structure (Chinh et al., 2005). In Fig. 11a the average grain size of the UFG structure remains
reasonably unchanged at ~1.2 m after annealing for 1 hour at 473 K whereas in Fig. 11b the grain
size strongly increases, by at least a factor of 10, when annealing at 563 K for a period of only 10
min. Thus, the UFG structure stability at low temperatures disappears very quickly when annealing
at high temperatures.
4. Summary and Conclusions
1) The plastic behavior of high purity polycrystalline aluminum was investigated over a
wide range of temperatures. The experimentally measured stress-strain curves were analyzed
applying a dislocation based model describing the major micro-mechanisms of plastic deformation.
2) It was shown for the deformation of Al at different temperatures that the interaction
between forest and mobile dislocations only marginally increases the forest density compared to the
effect of the interaction between mobile dislocations. Furthermore, both the trapping of mobile
dislocations and the annihilation of forest dislocations are controlled by thermally-activated
dislocation motion. The similarity between the two main micro-mechanisms and the negligible
effect of forest dislocations on the trapping of mobile dislocations lead to a simplification of the
applied theoretical model for Al over a wide range of testing temperatures.

1 2 3 4 5 6 7 8 9 10 11 12 13 14 15 16 17 18 19 20 21 22 23 24 25 26 27 28 29 30 31 32 33 34 35 36 37 38 39 40 41 42 43 44 45 46 47 48 49 50 51 52 53 54 55 56 57 58 59 60 61 62 63 64 65
21
3) The application of this simplified model gives an analytical relationship for the evolution
of the dislocation density as a function of strain. On the basis of this function, the saturation or
maximum dislocation densities were calculated for different testing temperatures.
4) Results of the analysis show that the microscopic parameters characterizing the
multiplication and the annihilation rates of dislocations decreases and increases, respectively, with
increasing testing temperature. The temperature dependence of these two microscopic quantities is
interpreted qualitatively using a simple model of dislocation interaction.
5) Quantitative correlations between the characteristics of macroscopic and microscopic -
dislocation-based - descriptions were established over a wide range of testing temperatures for pure
Al, confirming the physical meaning of the phenomenological parameters describing the
macroscopic evolution of the stress-strain relationships during plastic deformation.
Acknowledgements
This work was supported by the Hungarian Scientific Research Funds, OTKA, Grant No. K-
81360, by the National Science Foundation of the United States under Grant No. DMR-1160966
and by the European Research Council under ERC Grant Agreement No. 267464-SPDMETALS.
(TGL). The European Union and the European Social Fund provided financial support to this
project under grant agreement no. TÁMOP 4.2.1./B-09/1/KMR-2010-0003.
References
Austin, R.A., McDowell, D.L., 2011. A dislocation based constitutive model for viscoplastic
deformation of fcc metals at very high strain rates. International Journal of Plasticity 27, 1-
24.

1 2 3 4 5 6 7 8 9 10 11 12 13 14 15 16 17 18 19 20 21 22 23 24 25 26 27 28 29 30 31 32 33 34 35 36 37 38 39 40 41 42 43 44 45 46 47 48 49 50 51 52 53 54 55 56 57 58 59 60 61 62 63 64 65
22
Barlat, F., Glazov, M.V., Brem, J.C., Lege, D.J., 2002. A simple model for dislocation behavior,
strain and strain rate hardening evolution in deforming aluminum alloys. International
Journal of Plasticity 18, 919-939.
Berner, R., Kronmüller, H., 1965. Moderne Probleme der Metallphysik. Springer Verlag, Berlin.
Bertin, N., Capolungo, L., Beyerlein, I.J., 2013. Hybrid dislocation dynamics based strain hardening
constitutive model. International Journal of Plasticity 49, 119-144.
Beyerlein, I.J., Tomé, C.N., 2008. A dislocation-based constitutive law for pure Zr including
temperature effects. International Journal of Plasticity 24, 867-895.
Chinh, N.Q., Horváth Gy., Horita, Z., Langdon, T.G., 2004. A new constitutive relationship for the
homogeneous deformation of metals over a wide range of strain. Acta Mater. 52, 3555-3563.
Chinh, N.Q., Illy, J., Horita, Z., Langdon, T.G., 2005.Using the stress-strain relationships to
propose regions of low and high temperature plastic deformation in aluminum. Mater. Sci.
Eng. A 410-411, 234-238.
Chinh, N.Q., Szommer, P., Csanádi, T., Langdon, T.G., 2006. Flow processes at low temperatures
in ultrafine-grained aluminum. Mater. Sci. Eng. A 434, 326-334.
Chinh, N.Q., Csanádi, T., Gubicza, J., Langdon, T.G., 2010. Plastic behavior of face-centered-cubic
metals over a wide range of strain. Acta Mater. 58, 5015-5021.
Csanádi, T., Chinh, N.Q., Gubicza, J., Langdon, T.G., 2011. Plastic behavior of fcc metals over a
wide range of strain: Macroscopic and microscopic descriptions and their relationship. Acta
Mater. 59, 2385-2391.
Estrin, Y., Mecking, H., 1984. A unified phenomenological description of work hardening and
creep based on one-parameter models. Acta Metall. 32, 57-70.
Estrin, Y., Tóth, L.S., Molinari, A., Brechet, Y., 1998. A dislocation-based model for all hardening
stages in large strain deformation. Acta Mater. 46, 5509-5522.

1 2 3 4 5 6 7 8 9 10 11 12 13 14 15 16 17 18 19 20 21 22 23 24 25 26 27 28 29 30 31 32 33 34 35 36 37 38 39 40 41 42 43 44 45 46 47 48 49 50 51 52 53 54 55 56 57 58 59 60 61 62 63 64 65
23
Fan, X.G., Yang, H., 2011. Internal-state-variable based self-consistent constitutive modeling for
hot working of two-phase titanium alloys coupling microstructure evolution. International
Journal of Plasticity 27, 1833-1852.
Farrokh, B., Khan, A.S., 2009. Grain size, strain rate and temperature dependence of flow stress in
ultra-fine grained and nanocrystalline Cu and Al: Shyntesis, experiment and constitutive
modeling. International Journal of Plasticity 25, 715-732.
Frost, H.J., Ashby, M.F., 1982. Deformation-Mechanism Maps: The Plasticity and Creep of Metals
and Ceramics. Pergamon Press, Oxford.
Furukawa, M., Horita, Z., Nemoto, M., Langdon, T.G., 2001. Processing of metals by equal-
channel angular pressing. J. Mater. Sci. 36, 2835-2843.
Gao, C.Y., Zhang, L.C., 2012. Constitutive modelling of plasticity of fcc metals under extremely
high strain rates. International Journal of Plasticity 32-33, 121-133.
Gubicza, J., Chinh, N.Q., Lábár, J.L., Hegedűs, Z., Xu, C., Langdon, T.G., 2008. Microstructure
and yield strength of severely deformed silver. Scripta Mater. 58, 775-778.
Hansen, B.L., Beyerlein, I.J., Bronkhorst, C.A., Cerreta, E.K., Dennis-Koller, D., 2013. A
dislocation-based multi-rate single crystal plasticity model. International Journal of
Plasticity 44, 129-146.
Hasegawa, H., Komura, S., Utsunomiya, A., Horita, Z., Furukawa, M., Nemoto, M., Langdon, T.G.,
1999. Thermal stability of ultrafine-grained aluminum in the presence of Mg and Zr
additions. Mater. Sci. Eng. A 265, 188-196.
Hollomon, J.H., 1945. Tensile deformation. Trans. AIME 162, 268-290.
Hsiung, L.M., Lassila, D.H., 2002. Initial dislocation structure and dynamic dislocation
multiplication in Mo single crystals, Comp. Modeling in Eng. Sci. 3, 185-191.

1 2 3 4 5 6 7 8 9 10 11 12 13 14 15 16 17 18 19 20 21 22 23 24 25 26 27 28 29 30 31 32 33 34 35 36 37 38 39 40 41 42 43 44 45 46 47 48 49 50 51 52 53 54 55 56 57 58 59 60 61 62 63 64 65
24
Hughes, D.A., Hansen, N., 2000. Microstructure and strength of nickel at large strains. Acta Mater.
48, 2985-3004.
Iwahashi, Y., Wang, J., Horita, Z., Nemoto, M., Langdon, T.G., 1996. Principle of equal-channel
angular pressing for the ultra-fine grained materials. Scripta Mater. 35, 143-146.
Iwahashi, Y., Horita, Z., Nemoto, M., Langdon, T.G., 1997. An investigation of microstructural
evolution during equal-channel angular pressing. Acta Mater. 45, 4733-4741.
Iwahashi, Y., Horita, Z., Nemoto, M., Langdon, T.G., 1998a. Factors influencing the equilibrium
grain size in equal-channel angular pressing: role of Mg addition to aluminum. Metall.
Mater. Trans. 29A, 2503-2510.
Iwahashi, Y., Horita, Z., Nemoto, M., Langdon, T.G., 1998b. The process of grain refinement in
equal-channel angular pressing. Acta Mater. 46, 3317-3331.
Kocks, U.F., 1976. Laws for work-hardening and low-temperature creep. J. Eng. Mater. Tech.
(ASME) 98, 76-85.
Kocks, U.F., Mecking, H., 2003. Physics and phenomenology of strain hardening: the FCC case.
Prog. Mater. Sci. 48, 171-273.
Komura, S., Horita, Z., Nemoto, M., Langdon, T.G., 1999. Influence of stacking fault energy on
microstructural development in equal-channel angular pressing. J. Mater. Res. 14, 4044-
4050.
Kovács, I., Zsoldos, L., 1973. Dislocations and Plastic Deformation. Akademia Publisher,
Budapest.
Kubin, L.P., Estrin, Y., 1990. Evolution of dislocation densities and the critical conditions for the
Portevin-Le Chatelier effect. Acta Metall. Mater. 38, 697-708.
Les, P., Stuewe, H.P., Zehetbauer, M., 1997. Hardening and strain rate sensitivity in stage IV of
deformation in f.c.c. and b.c.c. metals. Mater. Sci. Eng. A 234-236, 453-455.

1 2 3 4 5 6 7 8 9 10 11 12 13 14 15 16 17 18 19 20 21 22 23 24 25 26 27 28 29 30 31 32 33 34 35 36 37 38 39 40 41 42 43 44 45 46 47 48 49 50 51 52 53 54 55 56 57 58 59 60 61 62 63 64 65
25
Li, D., Zbib, H., Sun, X., Khaleel, M., 2013. Predicting plastic flow and irradiation hardening of
iron single crystal with mechanical-based continuum dislocation dynamics. International
Journal of Plasticity, http://dx.doi.org/10.1016/j.ijplas.2013.01.015
Li, J., Soh, A.K., 2012. Modeling of plastic deformation of nanostructured materials with grain size
gradient. International Journal of Plasticity 39, 88-102.
Lim, H., Lee, M.G., Kim, J.H., Adams, B.L., Wagoner, R.H., 2011. Simulation of polycrystal
deformation with grain and grain boundary effects. International Journal of Plasticity 27,
1328-1354.
Lukác, P., Balík, J., 1994. Kinetics of plastic deformation. Key Eng. Mater. 97-98, 307-322.
Malygin, G.A., 1990. Dislocation density evolution equation and strain hardening of f.c.c. crystals.
Phys. Stat. Sol. (a) 119, 423-436.
Nabarro, F.R.N., Basinski, Z.S., Holt, D.B., 1964. The plasticity of pure singe crystals. Adv. Phys.
13, 193-323.
Nes, E., 1998. Modelling of work hardening and stress saturation in fcc metals. Prog. Mater. Sci.
41, 129-193.
Roters, F., Raabe, D., Gottstein, G., 2000. Work hardening in heterogeneous alloys – A
microstructural approach based on three internal state variables. Acta Mater. 48, 4181–4189.
Tóth, L.S., Molinari, A., Estrin, Y., 2002. Strain hardening at large strains as predicted by
dislocation based polycrystal plasticity model. J. Eng. Mater. Tech. 124, 71-77.
Valiev, R.Z., Islamgaliev, R.K., Alexandrov, I.V., 2000. Bulk nanostructured materials from severe
plastic deformation. Prog. Mater. Sci. 45, 103-189.
Valiev, R.Z., Langdon, T.G., 2006. Principles of equal channel angular pressing as a processing tool
for grain refinement. Prog. Mater. Sci. 51, 881-981.

1 2 3 4 5 6 7 8 9 10 11 12 13 14 15 16 17 18 19 20 21 22 23 24 25 26 27 28 29 30 31 32 33 34 35 36 37 38 39 40 41 42 43 44 45 46 47 48 49 50 51 52 53 54 55 56 57 58 59 60 61 62 63 64 65
26
Voce, E., 1948. The relationship between stress and strain for homogeneous deformation. J. Inst.
Met. 74, 537-562.
Wang, Z.Q., Beyerlein, I.J., Lesar, R., 2009. Plastic anisotropy in fcc single creystals in high rate
deformation. International Journal of Plasticity 25, 26-48.
Zehetbauer, M., Seumer, V., 1993. Cold work hardening in stage IV and V of f.c.c. metals – I.
Experiments and interpretation. Acta Mater. 41, 577-588.
Zehetbauer, M., 1993. Cold work hardening in stage IV and V of f.c.c. metals – II. Model fits and
physical results. Acta Mater. 41, 589-599.
Zhilyaev, A.P., Langdon, T.G., 2008. Using high pressure torsion for metal processing:
Fundamentals and applications. Prog. Mater. Sci. 53, 893-979.

1 2 3 4 5 6 7 8 9 10 11 12 13 14 15 16 17 18 19 20 21 22 23 24 25 26 27 28 29 30 31 32 33 34 35 36 37 38 39 40 41 42 43 44 45 46 47 48 49 50 51 52 53 54 55 56 57 58 59 60 61 62 63 64 65
27
Figure and Table Captions
Figure 1: Experimental stress-strain ( ) data and a fitted line based on Eq. (1) for a) low
strains and b) a wide range of strain for pure Al deformed at room temperature (293
K) (Chinh et al., 2005).
Figure 2: Experimental stress-strain ( ) data and a fitted line based on Eq. (1) for a) the
low strain region of positive work-hardening and b) the entire range of the
experimental strain for pure Al tested at 623 K (Chinh et al., 2005).
Figure 3: The regions of low and high temperature flow in pure Al, defined by the Eqs. (1) and
(2) (Chinh et al., 2005).
Figure 4: The solution of equation (3) for the testing temperature of 623 K, showing a) the
evolution of the dislocation densities with strain and b) the corresponding
numerically calculated stress–strain curve together with the experimental data and
the corresponding fitted function based on equation (1) over a wide range of strain.
Figure 5: The quantities of mC 2 , fC 4 and 2/1
3 fC numerically calculated for a testing
temperature of 623 K as a function of strain, demonstrating their contributions in
equations (3a) and (3b).

1 2 3 4 5 6 7 8 9 10 11 12 13 14 15 16 17 18 19 20 21 22 23 24 25 26 27 28 29 30 31 32 33 34 35 36 37 38 39 40 41 42 43 44 45 46 47 48 49 50 51 52 53 54 55 56 57 58 59 60 61 62 63 64 65
28
Figure 6: The ratios R of the mobile to forest dislocation densities numerically calculated by
Eqs. (3a and 3b) for some testing temperatures a) at low strains and b) over a wide
range of strains.
Figure 7: The evolution of the total dislocation densities calculated by the Kubin-Estrin and the
simplified Kubin-Estrin models for some different temperatures, showing the validity
of the simplification and also the strong temperature dependence of the saturation
dislocation density, max .
Figure 8: The relationship between the characteristics of macroscopic and microscopic
descriptions as a) b
1 versus
0
4
12
C
C and b) c versus
4
1
C for
different testing temperatures.
Figure 9: The temperature dependence of a) the saturation dislocation density, sat b) the C1
parameter characterizing dislocation multiplication and the C4 parameter
characterizing dislocation annihilation.
Figure 10: A schematic illustration showing the multiplication of mobile dislocations and their
trapping at a jog formed by intersection of mobile dislocations gliding on non-
coplanar planes.
Figure 11: Microstructures of pure Al after processing by ECAP at room temperature to a strain
of ~8 (a) remaining ultrafine-grained after annealing for 1 h at 473 K and (b)
becoming coarse-grained after annealing for 10 min at 563 K (Chinh et al., 2005).

1 2 3 4 5 6 7 8 9 10 11 12 13 14 15 16 17 18 19 20 21 22 23 24 25 26 27 28 29 30 31 32 33 34 35 36 37 38 39 40 41 42 43 44 45 46 47 48 49 50 51 52 53 54 55 56 57 58 59 60 61 62 63 64 65
29
Table 1: The values of parameters 1 , 10 sat , c and n obtained by fitting Eq. (1)
to the stress-strain data obtained on Al deformed at different temperatures, T.
Table 2: The values of Ci parameters in Eqs. (3a) and (3b) determined by simulations of the
experimental stress-strain curves obtained on Al deformed at different temperatures,
T.
Table 3: The values of parameters C1 and C4 and sat determined by Eq. (13) of the
simplified KE model applied for the experimental stress-strain curves obtained on Al
deformed at different temperatures.


Highlights
Macroscopic and microscopic descriptions of the stress-strain relationship
Evolution of the dislocation densities in Al over a wide range of temperature
Interpretation of the temperature dependence of microscopic mechanisms
Quantitative correlations between the macroscopic and microscopic characteristics