characterization of phosphatidylcholine oxidation products
TRANSCRIPT

Characterization of Phosphatidylcholine Oxidation Products byMALDI MSn
Whitney L. Stutts,† Robert F. Menger,† Andras Kiss,‡ Ron M. A. Heeren,‡ and Richard A. Yost*,†
†Department of Chemistry, University of Florida, Gainesville, Florida 32611-7200, United States‡FOM Institute AMOLF, Science Park 104, 1098 XG Amsterdam, Netherlands
*S Supporting Information
ABSTRACT: Phospholipid oxidation has been implicated in the pathogenesis andprogression of numerous age-related and neurodegenerative diseases. Despite theseimplications, this broad class of biomolecules remains poorly characterized. In thiswork, the fragmentation patterns of [M + H]+ and [M + Na]+ ions of intactphosphatidylcholine oxidation products (OxPCs) were characterized by matrix-assisted laser desorption/ionization tandem mass spectrometry (MALDI MSn, n = 2,3, and 4). MS2 of both the [M + H]+ and [M + Na]+ ions of short-chain OxPCsyielded product ions related to the PC headgroup and the fatty acid substituents.MS3 of the [M + Na − N(CH3)3]
+ ions yielded fragmentation indicative of theOxPC modification; specifically, a product ion corresponding to the neutral loss ofCO2 (NL of 44) was observed for OxPCs containing a terminal carboxylic acidrather than an aldehyde. Furthermore, MS4 of the [M + Na − HPO4(CH2)2N-(CH3)3]
+ ions resulted in fragmentation pathways dependent on the sn-2 fatty acidchain length and type of functional group(s). Specifically, CHO-containing OxPCs with palmitic acid esterified to the sn-1position of the glycerol backbone yielded a NL of 254, 2 u less than the nominal mass of palmitic acid, whereas the analogousterminal COOH-containing OxPCs demonstrated a NL of 256. Finally, the presence of a γ-ketone relative to the terminalcarboxyl group resulted in C−C bond cleavages along the sn-2 substituent, providing diagnostic product ions for keto-containingOxPCs. This work illustrates the enhanced selectivity afforded by MSn on the linear ion trap and develops a method for theidentification of individual products of PC oxidation.
Lipid oxidation has been implicated in the pathogenesis orprogression of various human disorders and diseases
including Alzheimer’s,1−3 age-related macular degeneration,4
atherosclerosis,4,5 cataractogenesis,4 multiple sclerosis,6 andrheumatoid arthritis.7 Probing lipid oxidation has provedchallenging for a number of reasons, including the diversityof oxidation products, the instability of select oxidationproducts, and the sensitivity necessary to detect these oxidationproducts.8 Furthermore, several studies have illustrated thevarious important biological activities of lipid oxidationproducts and have shown that many of these activities (e.g.,inflammatory vs anti-inflammatory) are dependent on thespecific chemical structure of the oxidized species;9 the type ofmodification to the sn-2 substituent (terminal carboxylic acid vsterminal aldehyde), the chemical bond linking the sn-1substituent (ether vs ester), the fatty acid chain length, andthe charge on the headgroup have all been shown to affect thebiological activities of lipid oxidation products.9−13 Certainlipids known to be susceptible to oxidation have also beenreported to be enriched in specific cells and tissues; oneexample is plasmalogens, a type of phospholipid containing avinyl ether moiety at the sn-1 position, which are abundant incardiac and nervous tissue.14 Thus, there is growing interest indeveloping methods for characterizing and identifying lipidoxidation products in biological samples.15
Biochemical assays, such as the thiobarbituric acid (TBA)assay,16 have been widely used to detect total lipid oxidation;however, these assays lack the selectivity needed for structuralelucidation.17 Diene conjugation, measured by UV absorbanceat 234 nm, has also been utilized to determine the extent oflipid oxidation, but this method also suffers from poorselectivity.17 Mass spectrometry (MS) has become increasinglyutilized in lipid oxidation research due to the ability tocharacterize biomolecules based on their mass-to-charge (m/z)ratios, yielding superior selectivity relative to the aforemen-tioned techniques.18−20 Despite the various challenges, severalMS methods have been developed for the analysis of theoxidatively modified phospholipids (OxPLs). Gas chromatog-raphy−mass spectrometry (GC-MS) and liquid chromatog-raphy−mass spectrometry (LC-MS) have been used foridentification and quantitation of phospholipid oxidationproducts;21−26 however, many of these methods requirehydrolysis of the oxidized free fatty acid moieties from thephospholipid headgroup and extensive derivatization prior toanalysis.
Received: July 31, 2013Accepted: November 3, 2013Published: November 3, 2013
Article
pubs.acs.org/ac
© 2013 American Chemical Society 11410 dx.doi.org/10.1021/ac402400f | Anal. Chem. 2013, 85, 11410−11419

More recently, soft ionization methods have been employedfor the analysis of OxPLs without derivatization.27−37 Electro-spray ionization mass spectrometry (ESI MS) combined withreversed-phase high-performance liquid chromatography (RP-HPLC) has become the most widely used method for theanalysis of OxPLs.19 This method offers several advantages.First, OxPLs readily ionize by ESI and RP-HPLC offerschromatographic separation based on fatty acid composition.Second, these methods are amenable to tandem massspectrometry (MSn), though in most cases only two stages ofMS (i.e., MS2) have been performed.18,19 Matrix-assisted laserdesorption/ionization (MALDI) has also been used toinvestigate OxPLs,38 but few published studies have used thisionization method in spite of the many inherent advantages.39
In comparison to LC coupled with ESI MS, MALDI MSrequires less sample and offers more rapid analysis.Furthermore, MALDI is less sensitive to salts and otherimpurities found in complex biological samples;17 in fact,addition of salts is often advantageous for the structuralelucidation of various phospholipids by MALDI MSn.35,40−42
Additionally, MALDI can be coupled with mass spectrometricimaging (MSI) techniques for in situ detection and localizationof phospholipids in biological tissues.41−44
This investigation characterized oxidation products ofphosphatidylcholines, the most abundant phospholipids incell membranes, by MALDI MSn using a linear ion trap (LIT)mass analyzer. The MSn (where n = 2, 3, or 4) capabilities ofthe LIT were exploited for enhanced selectivity, resulting inmore reliable characterization of the collision-induced dissoci-ation (CID) fragmentation pathways of OxPCs. Additionally,preliminary results illustrate the utility of the developedMALDI MSn method for identifying and imaging theseOxPCs in biological tissues.
■ EXPERIMENTAL SECTIONChemicals. Avanti Polar Lipids (Alabaster, AL) was the
source for all lipid standards except 1-palmitoyl-2-(5-keto-6-octene-dioyl)-sn-glycero-3-phosphatidylcholine (KOdiAPC),which was purchased from Cayman Chemical (Ann Arbor,MI). MALDI matrix, 2,5-dihydroxybenzoic acid (DHB), waspurchased from Acros Organics (Geel, Belgium). Sodiumacetate trihydrate (NaOAc) and HPLC-grade water andmethanol were purchased from Fisher Scientific (Fair Lawn,NJ). Ethanol (200 proof) was purchased from DeconLaboratories (King of Prussia, PA).Sample Preparation. The short-chain oxidation product
(OxPC) standards listed in Table 1 were dissolved in cold,degassed ethanol to a concentration of 100 ppm (100 ng in 1μL). A MALDI matrix solution consisting of 40 mg/mL DHBin 70:30 methanol:water (v/v) and 10 mM NaOAc (finalconcentration) was prepared. Sodium acetate was added toenhance the relative intensity of the [M + Na]+ ions, whichyielded more structurally informative fragmentation. OxPCstandards were deposited atop a 384-well stainless steel MALDIplate using a modified dried-droplet method.45 For thismethod, 1 μL of the 100 ppm OxPC standards followed by 1μL of MALDI matrix were pipetted into the sample wells. Thesolvent was allowed to evaporate in ambient air, resulting inmatrix−analyte cocrystals. The lowest concentration of stand-ards evaluated was 10 ppm (10 ng in 1 μL), and at thisconcentration analytes were still observed above baseline;however, ion intensities were insufficient for some multistageexperiments.
To illustrate the potential for identification and MSI ofOxPCs, spinal cord tissue from the lumbar region of adult,female Sprague−Dawley rats (Harlan, San Diego, CA) wasutilized. Animal studies, approved by the local IACUC, werecarried out by Nigel Calcutt at the University of California, SanDiego and were performed in an AAALAC-approved vivarium.Following euthanasia, excised tissue was immediately flash-frozen in liquid nitrogen and stored at −80 °C until further use.Tissue was sectioned at −25 °C using a Microm HM 505Ecryostat (Walldorf, Germany). To avoid analyte ion suppres-sion resulting from tissue mounting media (e.g., optimal cuttingtemperature polymer),46 spinal cord tissue was fused to thecutting stage using HPLC-grade water. Cross sections (10 μmthick) were thaw-mounted atop cold glass microscope slidesand subsequently dried in a vacuum desiccator for approx-imately 30 min to remove excess water. The slides were thenspray coated with MALDI matrix using a glass Type AMeinhard nebulizer (Golden, CO) and nitrogen (30 PSI) asthe nebulizing gas. Matrix was applied until a homogeneouslayer of matrix−analyte cocrystals was observed over the entiretissue.
Mass Spectrometry. Mass spectra were acquired inpositive ion mode using an intermediate-pressure (75 mTorr)MALDI-LIT mass spectrometer, a Thermo Scientific MALDILTQ XL (San Jose, CA). This instrument was equipped with a337 nm nitrogen laser with a 60 Hz repetition rate and 100 μmlaser spot diameter. Laser energies of 2.0−8.0 μJ per laser shotand 3−4 laser shots per raster spot were used in theseexperiments; automatic gain control (AGC) was toggled off.Each mass spectrum presented represents an average of 100analytical scans, unless otherwise noted. For MSI experiments,images were generated using Thermo ImageQuest 1.0.1software (San Jose, Ca). Mass spectral images generatedfollowing one stage of mass analysis (MS) were normalized tothe total ion current (TIC). For images generated from higherstages of mass analysis, the intensity of the most abundantproduct ion was plotted at each pixel and was not normalized to
Table 1. Nomenclature of the OxPC Standards Analyzeda
chemical name [shorthand] R1 R2′monoisotopic
mass
1-palmitoyl-2-(5-oxo-valeroyl)-sn-glycero-3-phosphocholine[POVPC]
16:0 5:0 (CHO) 593.37
1-palmitoyl-2-glutaryl-sn-glycero-3-phosphocholine [PGPC]
16:0 5:0 (COOH) 609.36
1-palmitoyl-2-(9-oxo-nonanoyl)-sn-glycero-3-phosphocholine[PONPC]
16:0 9:0 (CHO) 649.43
1-palmitoyl-2-azelaoyl-sn-glycero-3-phosphocholine[PAzPC]
16:0 9:0 (COOH) 665.43
1-palmitoyl-2-(5-keto-6-octene-dioyl)-sn-glycero-3-phosphocholine [KOdiAPC]
16:0 8:1 (COOH)b 663.37
aNomenclature according to the LIPID MAPS systematic naming isused (www.lipidmaps.org). R1 represents the number of carbons anddouble bonds (C:DB) in the fatty acid substituents esterified to the sn-1 position of the glycerol backbone. R2′ represents the number ofcarbons and double bonds in the oxidatively truncated fatty acidsubstituent. These sn-2 acyl groups contain 5−9 carbon atoms and aterminal aldehyde (CHO) or carboxyl group (COOH). bIn additionto the terminal α,β-unsaturated carboxyl group, the sn-2 tail ofKOdiAPC also contains a ketone at C5.
Analytical Chemistry Article
dx.doi.org/10.1021/ac402400f | Anal. Chem. 2013, 85, 11410−1141911411

TIC. All other data processing was performed using ThermoQualBrowser 2.0.7 (San Jose, Ca).For MS2 experiments, a precursor ion isolation width of 1.2 u
was utilized. For MS3, the precursor ion isolation widths for thefirst and second isolation events were adjusted to 1.5 and 2.0 u,respectively. Lastly, for MS4, isolation widths of 1.5, 2.0, and 2.5u were utilized for the first, second, and third isolation events,respectively. By widening these isolation windows for MS3 andMS4, precursor ion isolation efficiencies were enhanced.Therefore, signal loss was minimized when going from MS2
to MS3. However, MS4 typically resulted in a signal loss ofapproximately an order of magnitude compared to MS3.MS2, MS3, and MS4 experiments were performed using CID.
Collision energies were optimized to achieve maximum production intensity. In general, the precursor ion was depleted to<20% of the most intense fragment ion; however, withoutexception, the precursor ion was detected above the baseline.For precursor ions with higher m/z values (greater than m/z599), the q of activation (qact) was reduced to 0.22 (typicallyqact = 0.25 on the LTQ XL), when necessary, to decrease thelow-mass cutoff (LMCO). Specifically, the LMCO wasdecreased to observe the product ion at m/z 184 for protonatedOxPCs.
To validate several proposed fragmentation pathways andproduct ion identifications, accurate mass measurements wereperformed using a 7T hybrid LIT-Fourier transform ioncyclotron resonance (FTICR) mass spectrometer, the FinniganLTQ FT (Thermo Fisher Scientific, Bremen, Germany). Thisinstrument was equipped with a Thermo Scientific nanosprayionization (NSI) source. For these experiments, OxPCstandards, diluted to 1000 nM in ethanol, were directly infusedat a flow rate of 0.5 μL/min, and the NSI spray voltage was setto +2 kV. The heated capillary on the LTQ was held at +39 Vand 200 °C. MSn isolation and excitation were performed in theLIT, whereas mass analysis of the product ions was conductedin the ICR cell. AGC was toggled on for all experiments with amaximum injection time of 100 ms. For MSn experiments onthe LTQ FT, the parameters for precursor ion isolation widthswere the same as those outlined above, with the exception ofthe third isolation event in MS4, which was lowered from 2.5 to2.0 u. Additionally, collision energies were optimized asdescribed above. The FT portion of the instrument wasoperated in wide scan mode at a resolving power of 100 000with 50 analytical scans (each composed of 10 microscans)averaged to obtain accurate mass values.
Table 2. Product Ions Observed in the MS2 Spectra of [M + H]+ Ions of PAzPC, PONPC, PGPC, POVPC, and KOdiAPCa
neutral loss composition PAzPC m/z 666 PONPC m/z 650 PGPC m/z 610 POVPC m/z 594 KOdiAPC m/z 664
[H2PO4(CH2)2N(CH3)3]+b 184 (100) 184 (100) 184 (100) 184 (100) 184 (100)
−R1CO 428 (0.4) 412 (1.6) 372 (0.6) 356 (0.5) 426 (1.0)−R2′CO 496 (1.1) 496 (3.4) 496 (1.1) 496 (0.7) 496 (2.5)−R1COOH 410 (1.2) 394 (3.5) 354 (1.2) 338 (0.8) 408 (1.4)−R2′COOH 478 (0.5) 478 (2.1) 478 (0.7) 478 (0.7) 478 (1.1)−HPO4(CH2)2N(CH3)3 483 (0.3) 467 (1.2) 427 (0.3) 411 (0.5) 481 (1.2)−H2O 648 (1.5) NA 592 (1.1) NA 646 (9.6)−N(CH3)3 NA 591 (0.4) NA NA 605 (8.9)−CO2 NA NA 566 (0.1) NA 620 (1.9)
aRelative abundances (%) for each product ion are given in parentheses. The abundance was rounded to the nearest tenth of a percent. NA = relativeabundances ≤ 0.1%. Most abundant loss of sn-1 and sn-2 are indicated in bold type. bIndicates a product ion rather than a NL.
Figure 1. MS2 product ion spectrum of m/z 666, the [M + H]+ ion of PAzPC. The structure and proposed fragmentation of the ion at m/z 666 arealso shown.
Analytical Chemistry Article
dx.doi.org/10.1021/ac402400f | Anal. Chem. 2013, 85, 11410−1141911412

■ RESULTS AND DISCUSSION
Ionization of unmodified PCs by MALDI produces bothprotonated species, [M + H]+, and alkali metal adducts such as[M + Na]+.18 Depending on the precursor ion selected, thefragmentation pathways observed by MS2 vary greatly.47 Incontrast to the [M + H]+ ions of unmodified PCs, which yieldone predominant MS2 product ion (m/z 184) and littlestructural information, CID of the [M + Na]+ ions yields manystructurally informative product ions.40,48 In this work, MALDIMS utilizing DHB as a positive-mode matrix produced bothprotonated and sodiated ions of OxPCs. Subsequently, thefragmentation pathways of the [M + H]+ and [M + Na]+ ionswere explored for each of the OxPCs listed in Table 1.MS2 Characterization of the [M + H]+ Ions of Short-
Chain OxPCs. The observed MS2 product ions resulting fromCID of the [M + H]+ ions of PAzPC, PONPC, PGPC,POVPC, and KOdiAPC are listed in Table 2. Many of theseproduct ions are in accordance with the ESI MS2 fragmentationof [M + H]+ ions of 1-palmitoyl-2-linoleoyl-sn-glycero-3-phosphocholine (PLPC) and 1-palmitoyl-2-arachidonoyl-sn-glycero-3-phosphocholine (PAPC) oxidation products reportedby Reis et al.33 Similar to unmodified PCs, following CID of the[M + H]+ ion, short-chain OxPCs yielded a dominant production at m/z 184, corresponding to the protonated phosphocho-line headgroup ([H2PO4(CH2)2N(CH3)3]
+).49,50 Althoughmuch lower in abundance (0.5−4% relative abundance), theproduct ions corresponding to the neutral losses (NLs) of thefatty acid moieties, as free acids or as ketenes, were alsoobserved. These product ions were reported previously in ESIMS2 studies of unmodified PCs and allowed for differentiationof positional isomers based on the relative abundances of thesn-1 and sn-2 ketene losses; the product ion corresponding tothe sn-2 ketene NL (−R2CO) demonstrated greaterabundance than the product ion due to the sn-1 ketene NL(−R1CO).50 This trend was also observed for all short-chain OxPCs studied in this work; that is, the loss of thesaturated sn-1 ketene was, in all cases, less abundant than theloss of the oxidized sn-2 ketene. Furthermore, the modified sn-2fatty acid chain was preferentially lost as the ketene (−R2′CO) while the sn-1 fatty acid chain was preferentially lost asthe free acid (−R1COOH).As a specific example, Figure 1 illustrates these fragmentation
pathways for MS2 of the [M + H]+ ion of PAzPC (m/z 666).The product ion corresponding to the phosphocholineheadgroup, m/z 184, was the base peak; all other productions were observed below 2% relative abundance. Upon 20×magnification of the upper mass region of the spectrum(greater than m/z 200), product ions related to the fatty acidtails were observed. The losses of the sn-2 tail as the ketene
(NL of 170) and as the free acid (NL of 188), although lowerin abundance, were observed at m/z 496 and 478, respectively.Likewise, losses of the sn-1 tail as the ketene and as the free acidwere observed at m/z 428 and 410, respectively; however, thesn-1 tail was preferentially lost as the free acid instead of theketene. The MS2 product ion spectrum of m/z 666 alsoillustrates that the ion corresponding to the sn-2 ketene loss(m/z 496) was greater in abundance than that of the sn-1ketene loss (m/z 428).Although structural information may be obtained from CID
of the [M + H]+ ions, the majority of the product ion intensityfalls at m/z 184, a structurally uninformative fragment ion withregards to the substituents bound to the sn-1 and sn-2 positionsof the glycerol backbone. Thus, fragmentation of the [M + H]+
ion presents a relatively inefficient method for determining fattyacid composition and position. Accordingly, the fragmentationpathways related to the [M + Na]+ ions of OxPCs wereexplored.
MSn Characterization of the [M + Na]+ Ions of Short-Chain OxPCs. The MSn product ion spectra of the short-chainproducts studied illustrated distinct fragmentation patterns forthe [M + Na]+ ions. For each of the OxPCs, the MS2 productions resulting from CID of the [M + Na]+ precursor ions arelisted in Table 3. Many of these product ions are in agreementwith ESI MS2 product ions previously observed following CIDof PLPC and PAPC oxidation products.33 Characteristic MS2
fragmentation resulting in product ions produced from NLs of59 (trimethylamine) and 183 (phosphocholine) were ob-served.33,47,51 Although these were the two most abundantproduct ions of each of the short-chain OxPCs investigated inthis work, product ions resulting from the NLs of the sn-1 andsn-2 fatty acid tails were also observed following CID.In MS2, the sn-1 tail was lost as the free acid or as the
concurrent loss of the sn-1 free fatty acid and trimethylamine.Additionally, various losses of the sn-2 tail were observed foreach of the OxPCs investigated. For all of the short-chainOxPCs except PGPC, the sn-2 tail was preferentially lost as theneutral, sodiated free acid; PGPC fragmentation also yielded aloss of the sn-2 tail as the neutral, sodiated free acid, but the sn-2 ketene loss (NL of 114) was more abundant.Product ions resulting from the concurrent loss of the sn-2
tail and the trimethylamine were also observed at approximatelyequal or greater relative abundance than that of the productions resulting from concurrent loss of the sn-1 tail and thetrimethylamine. This fragmentation pathway has beenpreviously reported for lithium adducts of unmodified PCs.50
However, the opposite trend was previously observed (i.e., the[M + Li − R1COOH − N(CH3)3]
+ ion was greater inabundance than the [M + Li − R2COOH − N(CH3)3]
+ ion).50
Table 3. Product Ions Observed in MS2 Spectra of [M + Na]+ Ions of PAzPC, PONPC, PGPC, POVPC, and KOdiAPCa
neutral loss composition PAzPC m/z 688 PONPC m/z 672 PGPC m/z 632 POVPC m/z 616 KOdiAPC m/z 686
−N(CH3)3 629 (100) 613 (100) 573 (100) 557 (100) 627 (100)−HPO4(CH2)2N(CH3)3 505 (12.2) 489 (7.5) 449 (15.1) 433 (10.5) 503 (7.2)−R2′COONa 478 (0.3) 478 (0.1) 478 (0.2) 478 (0.3) 478 (0.2)−R1COOH 432 (0.2) 416 (0.1) 376 (0.1) 360 (0.1) 430 (0.1)−R2′COOH 500 (0.1) 500 (0.1) 500 (0.3) 500 (0.2) 500 (0.2)−R1COOH and N(CH3)3 373 (0.1) 357 (0.1) 317 (0.1) 301 (0.1) 371 (0.1)−R2′COOH and N(CH3)3 441 (0.1) NA 441 (0.4) 441 (0.3) 441 (0.2)−R2′CO NA NA 518 (0.6) NA 518 (0.1)
aRelative abundances (%) for each product ion are given in parentheses. The abundance was rounded to the nearest tenth of a percent. NA = relativeabundances ≤0.05%.
Analytical Chemistry Article
dx.doi.org/10.1021/ac402400f | Anal. Chem. 2013, 85, 11410−1141911413
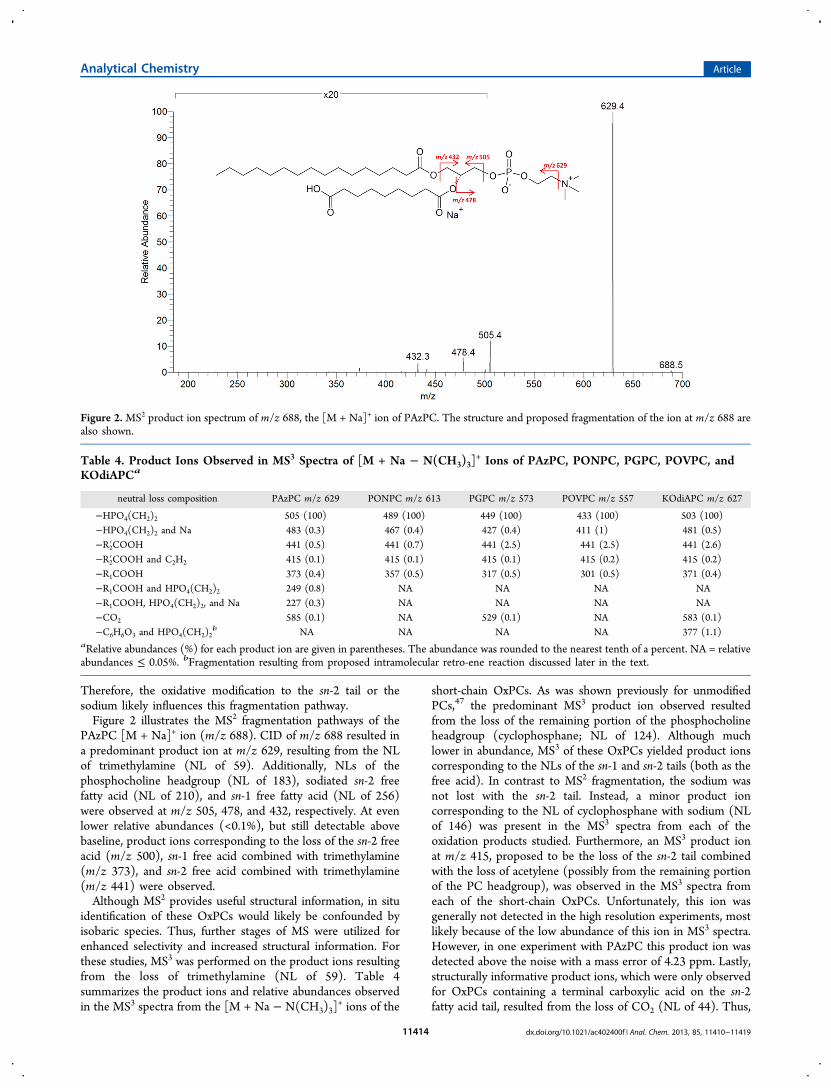
Therefore, the oxidative modification to the sn-2 tail or thesodium likely influences this fragmentation pathway.Figure 2 illustrates the MS2 fragmentation pathways of the
PAzPC [M + Na]+ ion (m/z 688). CID of m/z 688 resulted ina predominant product ion at m/z 629, resulting from the NLof trimethylamine (NL of 59). Additionally, NLs of thephosphocholine headgroup (NL of 183), sodiated sn-2 freefatty acid (NL of 210), and sn-1 free fatty acid (NL of 256)were observed at m/z 505, 478, and 432, respectively. At evenlower relative abundances (<0.1%), but still detectable abovebaseline, product ions corresponding to the loss of the sn-2 freeacid (m/z 500), sn-1 free acid combined with trimethylamine(m/z 373), and sn-2 free acid combined with trimethylamine(m/z 441) were observed.Although MS2 provides useful structural information, in situ
identification of these OxPCs would likely be confounded byisobaric species. Thus, further stages of MS were utilized forenhanced selectivity and increased structural information. Forthese studies, MS3 was performed on the product ions resultingfrom the loss of trimethylamine (NL of 59). Table 4summarizes the product ions and relative abundances observedin the MS3 spectra from the [M + Na − N(CH3)3]
+ ions of the
short-chain OxPCs. As was shown previously for unmodifiedPCs,47 the predominant MS3 product ion observed resultedfrom the loss of the remaining portion of the phosphocholineheadgroup (cyclophosphane; NL of 124). Although muchlower in abundance, MS3 of these OxPCs yielded product ionscorresponding to the NLs of the sn-1 and sn-2 tails (both as thefree acid). In contrast to MS2 fragmentation, the sodium wasnot lost with the sn-2 tail. Instead, a minor product ioncorresponding to the NL of cyclophosphane with sodium (NLof 146) was present in the MS3 spectra from each of theoxidation products studied. Furthermore, an MS3 product ionat m/z 415, proposed to be the loss of the sn-2 tail combinedwith the loss of acetylene (possibly from the remaining portionof the PC headgroup), was observed in the MS3 spectra fromeach of the short-chain OxPCs. Unfortunately, this ion wasgenerally not detected in the high resolution experiments, mostlikely because of the low abundance of this ion in MS3 spectra.However, in one experiment with PAzPC this product ion wasdetected above the noise with a mass error of 4.23 ppm. Lastly,structurally informative product ions, which were only observedfor OxPCs containing a terminal carboxylic acid on the sn-2fatty acid tail, resulted from the loss of CO2 (NL of 44). Thus,
Figure 2. MS2 product ion spectrum of m/z 688, the [M + Na]+ ion of PAzPC. The structure and proposed fragmentation of the ion at m/z 688 arealso shown.
Table 4. Product Ions Observed in MS3 Spectra of [M + Na − N(CH3)3]+ Ions of PAzPC, PONPC, PGPC, POVPC, and
KOdiAPCa
neutral loss composition PAzPC m/z 629 PONPC m/z 613 PGPC m/z 573 POVPC m/z 557 KOdiAPC m/z 627
−HPO4(CH2)2 505 (100) 489 (100) 449 (100) 433 (100) 503 (100)−HPO4(CH2)2 and Na 483 (0.3) 467 (0.4) 427 (0.4) 411 (1) 481 (0.5)−R2′COOH 441 (0.5) 441 (0.7) 441 (2.5) 441 (2.5) 441 (2.6)−R2′COOH and C2H2 415 (0.1) 415 (0.1) 415 (0.1) 415 (0.2) 415 (0.2)−R1COOH 373 (0.4) 357 (0.5) 317 (0.5) 301 (0.5) 371 (0.4)−R1COOH and HPO4(CH2)2 249 (0.8) NA NA NA NA−R1COOH, HPO4(CH2)2, and Na 227 (0.3) NA NA NA NA−CO2 585 (0.1) NA 529 (0.1) NA 583 (0.1)−C6H6O3 and HPO4(CH2)2
b NA NA NA NA 377 (1.1)aRelative abundances (%) for each product ion are given in parentheses. The abundance was rounded to the nearest tenth of a percent. NA = relativeabundances ≤ 0.05%. bFragmentation resulting from proposed intramolecular retro-ene reaction discussed later in the text.
Analytical Chemistry Article
dx.doi.org/10.1021/ac402400f | Anal. Chem. 2013, 85, 11410−1141911414
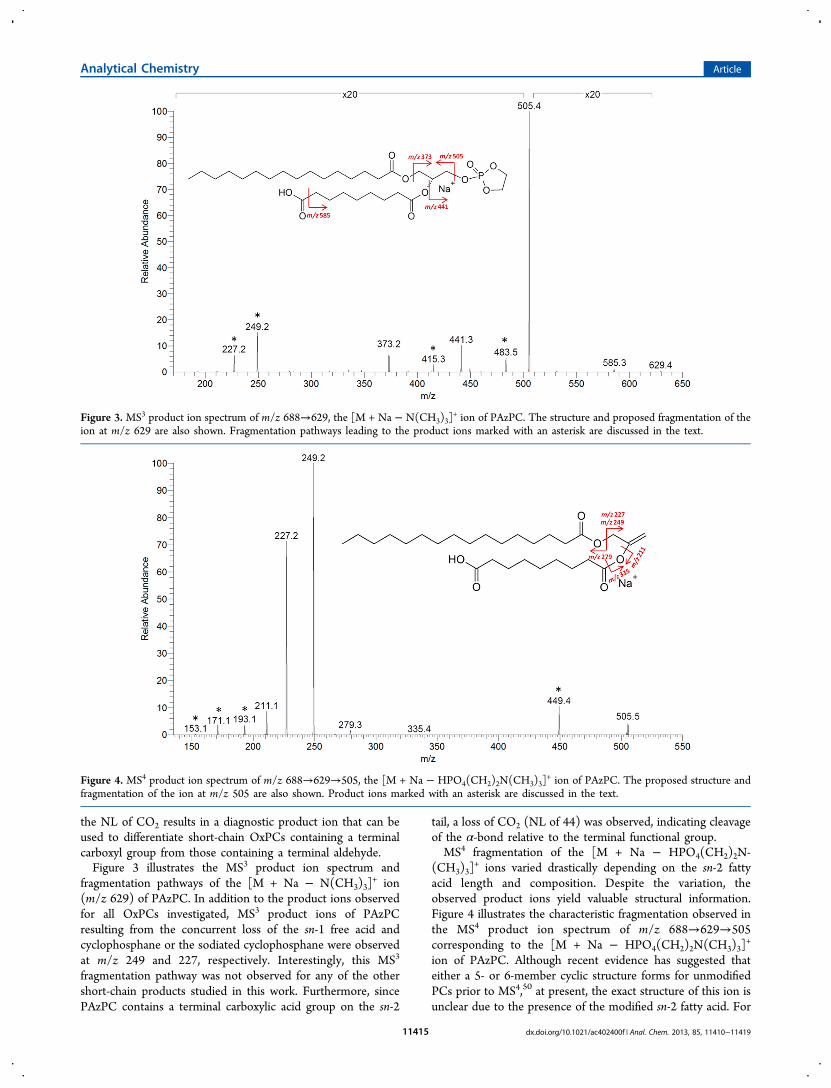
the NL of CO2 results in a diagnostic product ion that can beused to differentiate short-chain OxPCs containing a terminalcarboxyl group from those containing a terminal aldehyde.Figure 3 illustrates the MS3 product ion spectrum and
fragmentation pathways of the [M + Na − N(CH3)3]+ ion
(m/z 629) of PAzPC. In addition to the product ions observedfor all OxPCs investigated, MS3 product ions of PAzPCresulting from the concurrent loss of the sn-1 free acid andcyclophosphane or the sodiated cyclophosphane were observedat m/z 249 and 227, respectively. Interestingly, this MS3
fragmentation pathway was not observed for any of the othershort-chain products studied in this work. Furthermore, sincePAzPC contains a terminal carboxylic acid group on the sn-2
tail, a loss of CO2 (NL of 44) was observed, indicating cleavageof the α-bond relative to the terminal functional group.MS4 fragmentation of the [M + Na − HPO4(CH2)2N-
(CH3)3]+ ions varied drastically depending on the sn-2 fatty
acid length and composition. Despite the variation, theobserved product ions yield valuable structural information.Figure 4 illustrates the characteristic fragmentation observed inthe MS4 product ion spectrum of m/z 688→629→505corresponding to the [M + Na − HPO4(CH2)2N(CH3)3]
+
ion of PAzPC. Although recent evidence has suggested thateither a 5- or 6-member cyclic structure forms for unmodifiedPCs prior to MS4,50 at present, the exact structure of this ion isunclear due to the presence of the modified sn-2 fatty acid. For
Figure 3. MS3 product ion spectrum of m/z 688→629, the [M + Na − N(CH3)3]+ ion of PAzPC. The structure and proposed fragmentation of the
ion at m/z 629 are also shown. Fragmentation pathways leading to the product ions marked with an asterisk are discussed in the text.
Figure 4. MS4 product ion spectrum of m/z 688→629→505, the [M + Na − HPO4(CH2)2N(CH3)3]+ ion of PAzPC. The proposed structure and
fragmentation of the ion at m/z 505 are also shown. Product ions marked with an asterisk are discussed in the text.
Analytical Chemistry Article
dx.doi.org/10.1021/ac402400f | Anal. Chem. 2013, 85, 11410−1141911415
simplicity, this ion is displayed without the ring structure.Regardless of the structure, the predominant product ions atm/z 249 and 227 resulted from the NL of the sn-1 fatty acid tailand the sn-1 tail with sodium, respectively. These product ions,in addition to the product ions at m/z 279, 211, 193, 171, and153, which were attributed to [R1COOH + Na]+, [R2′COOH +Na]+, [R2′COOH + Na − H2O]
+, [R2′COOH + H − H2O]+,
and [R2′COOH + H − 2H2O]+, respectively, confirmed the
identification of both fatty acid substituents of PAzPC.Furthermore, the NL of 56 (m/z 449) was observed in theMS4 product ion spectrum of PAzPC and likely corresponds tothe loss of C3H4O as previously reported for MSn on the [M +
Na]+ ions of triacylglycerols.52 However, this loss of 56 wasobserved in the MS4 product ion spectrum from each of theOxPCs investigated in this work and is therefore lessstructurally informative than the product ions related to thefatty acid tails.The MS4 product ion spectra from CID of the [M + Na −
HPO4(CH2)2N(CH3)3]+ ion of the other OxPCs listed in
Table 1 are included in the Supporting Information (Figures S-1−S-4). Many product ions analogous to those described abovefor PAzPC were also observed in the MS4 spectra of the otherOxPCs; however, MS4 product ions specific to the type ofoxidative modification were also detected. One diagnostic
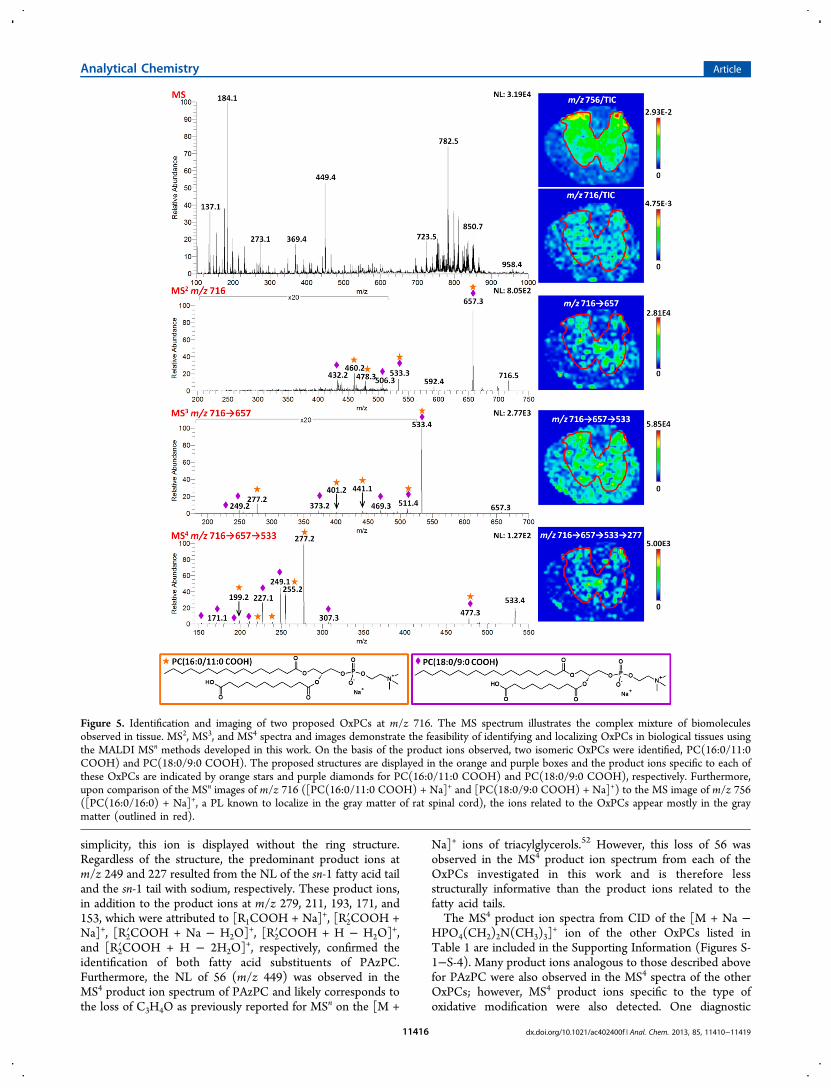
Figure 5. Identification and imaging of two proposed OxPCs at m/z 716. The MS spectrum illustrates the complex mixture of biomoleculesobserved in tissue. MS2, MS3, and MS4 spectra and images demonstrate the feasibility of identifying and localizing OxPCs in biological tissues usingthe MALDI MSn methods developed in this work. On the basis of the product ions observed, two isomeric OxPCs were identified, PC(16:0/11:0COOH) and PC(18:0/9:0 COOH). The proposed structures are displayed in the orange and purple boxes and the product ions specific to each ofthese OxPCs are indicated by orange stars and purple diamonds for PC(16:0/11:0 COOH) and PC(18:0/9:0 COOH), respectively. Furthermore,upon comparison of the MSn images of m/z 716 ([PC(16:0/11:0 COOH) + Na]+ and [PC(18:0/9:0 COOH) + Na]+) to the MS image of m/z 756([PC(16:0/16:0) + Na]+, a PL known to localize in the gray matter of rat spinal cord), the ions related to the OxPCs appear mostly in the graymatter (outlined in red).
Analytical Chemistry Article
dx.doi.org/10.1021/ac402400f | Anal. Chem. 2013, 85, 11410−1141911416

fragmentation pathway was the loss of the sn-1 fatty acid tail; incontrast to the carboxylic acid derivatives, the OxPCscontaining a terminal aldehyde lost the sn-1 tail (palmiticacid; 256 u) as the NL of 254 rather than 256. Based onpreviously reported MS2 fragmentation of [M + Li]+ ions ofunmodified PCs53 and triacylglycerols,52 the NL of 254 likelyresults from the elimination of α,β-unsaturated fatty acid fromthe sn-1 substituent. Interestingly, unmodified PCs only lost theα,β-unsaturated fatty acid from the sn-2 substituent, not fromthe sn-1 substituent;53 thus the terminal aldehyde on the sn-2substituent of the OxPCs is likely playing some role in theformation of this product ion.Furthermore, MS4 of the keto-containing OxPC, KOdiAPC,
yielded multiple fragmentation pathways not observed for othershort-chain OxPCs; specifically, cleavages between C2−C3(m/z 377) and C3−C4 (m/z 367) of the sn-2 fatty acid tailwere observed. To confirm these fragmentation pathways,accurate mass measurements were performed on the hybridLTQ FT mass spectrometer. The FTICR mass spectraobtained from MS4 on the [M + Na − HPO4(CH2)2N-(CH3)3]
+ ion from KOdiAPC exhibited product ions at m/z377.2676 (error of 2.18 ppm) and m/z 367.2856 (error of 2.10ppm), thereby confirming the proposed molecular formulas.Although the mechanism was not confirmed, one possiblerationale for the C2−C3 cleavage is an intramolecular retro-enereaction involving the C5 carbonyl group (SupportingInformation Scheme S-1). This mechanism is similar to thatproposed by Cheng and Gross for β-cleavage of oxofattyacids.54 Although γ-cleavage was observed relative to the C5carbonyl group, the C3−C4 cleavage is thought to result froman intramolecular retro-ene reaction involving the C1 carbonylgroup (Supporting Information Scheme S-2), rather than 1,4-hydrogen elimination as previously reported.54 1,4-hydrogenelimination was considered; however, the six-membered cyclicintermediate required for 1,4-hydrogen elimination is notfavorable, as the sn-2 tail does not contain four consecutivecarbons with accessible hydrogens.Identification of OxPCs in Spinal Cord Tissue.
Following MSn characterization of OxPC standards, [M +Na]+ ions of potential OxPCs were targeted for in situidentification and MSn imaging. Figure 5 illustrates theidentification and localization of two isomeric OxPCs in spinalcord tissue. The MALDI MS spectrum obtained by averagingthe mass spectra across the entire tissue section (approximately700 scans) depicts the complex mixture of biomoleculesobtained from tissue. For these in situ experiments, animportant aspect of data acquisition is the selection of properisolation windows. As described in the Experimental Section, anisolation width of 1.2 u was used for MS2, whereas widerisolation windows were used for MS3 and MS4. Widening theisolation window increases the isolation efficiency, therebymaximizing the ion signal required for this type of multistagetandem MS experiments. Normally, an isolation window of thiswidth may introduce added complexity to MS2 spectra;however, the selectivity afforded by MS3 and MS4 alleviatesthis problem.One potential PC oxidation product, PC(18:0/9:0 COOH),
was targeted for MSn analysis. Upon CID of the expected [M +Na]+ ion (m/z 716), MSn product ions (indicated with purplediamonds) were analogous to those predicted based on thefragmentation pathways outlined in Tables 2−4. Thus, productions observed in the MS2, MS3, and MS4 spectra allowed for insitu identification of PC(18:0/9:0 COOH). However, addi-
tional MS2, MS3, and MS4 product ions (indicated with orangestars) indicated the presence of an isomeric ion at m/z 716. Onthe basis of these product ions, another OxPC was identified atm/z 716, [PC(16:0/11:0 COOH) + Na]+.After collecting the MSn spectra, extracted ion images were
generated to determine the localization of the OxPCs at m/z716 in tissue. As discussed in the Experimental Section,isolation window widths were increased for higher order MSn
spectra to enhance signal intensity; as a result, absoluteintensities of MSn product ions can be greater for higher valuesof n, as observed in the MS2 and MS3 images in Figure 5. Eachimage is plotted such that the color scale permits visualizationof product ion localization; images generated from single-stageMS experiments are normalized to the TIC (maximumintensity values are <1.0), whereas MSn images are plotted inabsolute counts. To distinguish the gray matter from the whitematter in this spinal cord section, the TIC-normalized MSimage of [PC(16:0/16:0) + Na]+ at m/z 756, an ion previouslyreported to localize in the gray matter,43 is provided. The graymatter in this image is outlined in red; this same outline issuperimposed atop the other images, demonstrating thelocalization of these OxPCs in the gray matter. In theseimages, slight variations in the spatial distribution of theseproduct ions are observed due to scaling of each image;however in each image, the intensity of the selected ion isconsistently higher in the gray matter than in the white matter.The MSn spectra and images depicted in Figure 5 illustrate theenhanced selectivity afforded by the LIT, allowing foridentification and localization of OxPCs in situ.
■ CONCLUSIONSThis study has established that MALDI MSn is a powerful toolfor characterizing various short-chain oxidation products ofphosphatidylcholines. On the basis of the characteristic MALDIMSn fragmentation of the [M + H]+ and [M + Na]+ ions ofvarious short-chain OxPCs, valuable structural information isobtained. In MS2, CID of the [M + H]+ and [M + Na]+ ions ofPAzPC, PONPC, PGPC, POVPC, and KOdiAPC led tovarious product ions, which were analogous to those previouslyreported for unmodified PCs. For additional structuralinformation, the ion corresponding to the NL of 59 from the[M + Na]+ was fragmented in MS3 and yielded multipleproduct ions, one of which (the NL of CO2) was diagnostic of aterminal carboxyl group on the sn-2 tail. Furthermore, MS4 ofthe [M + Na]+ resulted in drastically different fragmentationdepending on the sn-2 fatty acid length and type of functionalgroups added. An MS4 fragmentation pathway characteristic ofOxPCs containing a terminal aldehyde rather than a carboxylicacid was the NL of 254, thought to correspond to theelimination of the α,β-unsaturated sn-1 fatty acid substituent(16:1). Additionally, the presence of the keto group inKOdiAPC led to midchain cleavages of the sn-2 fatty acidmoiety. While we were unable to confirm all of the product ionsin Tables 2−4 by accurate mass measurements, we did obtaindata to support the unexpected, midchain cleavages ofKOdiAPC in MS4.This work also illustrates the feasibility of this MALDI MSn
methodology for the analysis and identification of individual PCoxidation products in complex mixtures including intactbiological tissues. The diagnostic ions detailed in this studywere utilized for targeted MALDI MSn imaging studies todetermine the distribution of OxPCs in tissue sections.Although the work presented herein was focused specifically
Analytical Chemistry Article
dx.doi.org/10.1021/ac402400f | Anal. Chem. 2013, 85, 11410−1141911417

on short-chain OxPCs, long-chain OxPCs including hydroxy-lated derivatives have also been investigated and will be thesubject of a subsequent manuscript. Through the developmentof selective methods for identifying various OxPCs anddetermining their in situ localization, a greater understandingof the biological and physiopathological activities of thesephospholipid oxidation products may be achieved.
■ ASSOCIATED CONTENT*S Supporting InformationAdditional materials as described in the text. This material isavailable free of charge via the Internet at http://pubs.acs.org.
■ AUTHOR INFORMATIONCorresponding Author*E-mail: [email protected]. Phone: (352) 392-0557. Fax: (352)392-4651.NotesThe authors declare no competing financial interest.
■ ACKNOWLEDGMENTSThe authors would like to acknowledge Dr. Nigel Calcutt forproviding the spinal cord tissue used in this work. Also, theauthors thank Dr. Jodie Johnson and Ashton Bartley forinsightful discussions regarding fragmentation mechanisms.This work was partially supported by the NSF MS-PIREgrant (OISE-0730072) and Eastman Chemical Company.
■ REFERENCES(1) Markesbery, W. R.; Lovell, M. A. Neurobiol. Aging 1998, 19, 33−36.(2) Koppaka, V.; Axelsen, P. H. Biochemistry 2000, 39, 10011−10016.(3) Koppaka, V.; Paul, C.; Murray, I. V. J.; Axelsen, P. H. J. Biol.Chem. 2003, 278, 36277−36284.(4) Huang, L.; Estrada, R.; Yappert, M. C.; Borchman, D. FreeRadical Biol. Med. 2006, 41, 1425−1432.(5) Berliner, J. A.; Leitinger, N.; Tsimikas, S. J. Lipid Res. 2009, 50,S207−S212.(6) Qin, J.; Goswami, R.; Balabanov, R.; Dawson, G. J. Neurosci. Res.2007, 85, 977−984.(7) Baskol, G.; Demir, H.; Baskol, M.; Kilic, E.; Ates, F.; Karakukcu,C.; Ustdal, M. Cell Biochem. Funct. 2006, 24, 307−311.(8) Yin, H.; Cox, B. E.; Liu, W.; Porter, N. A.; Morrow, J. D.; Milne,G. L. J. Mass Spectrom. 2009, 44, 672−680.(9) Salomon, R. G.; Gu, X. Chem. Res. Toxicol. 2011, 24, 1791−1802.(10) Sun, M. J.; Finnemann, S. C.; Febbraio, M.; Shan, L.;Annangudi, S. P.; Podrez, E. A.; Hoppe, G.; Darrow, R.;Organisciak, D. T.; Salomon, R. G.; Silverstein, R. L.; Hazen, S. L. J.Biol. Chem. 2006, 281, 4222−4230.(11) Leitinger, N. Curr. Opin. Lipidol. 2003, 14, 421−430.(12) Lee, S.; Birukov, K. G.; Romanoski, C. E.; Springstead, J. R.;Lusis, A. J.; Berliner, J. A. Circ. Res. 2012, 111, 778−799.(13) Gao, D.; Ashraf, M. Z.; Kar, N. S.; Lin, D.; Sayre, L. M.; Podrez,E. A. J. Biol. Chem. 2010, 285, 4447−4454.(14) Murphy, R. C. Chem. Res. Toxicol. 2001, 14, 463−472.(15) Reis, A.; Spickett, C. M. Biochim. Biophys. Acta 2012, 1818,2374−2387.(16) Ohkawa, H.; Ohishi, N.; Yagi, K. Anal. Biochem. 1979, 95, 351−358.(17) Schiller, J.; Suß, R.; Arnhold, J.; Fuchs, B.; Leßig, J.; Muller, M.;Petkovic, M.; Spalteholz, H.; Zschornig, O.; Arnold, K. Prog. Lipid Res.2004, 43, 449−488.(18) Domingues, M. R. M.; Reis, A.; Domingues, P. Chem. Phys.Lipids 2008, 156, 1−12.(19) O’Donnell, V. B. Biochim. Biophys. Acta, Mol. Cell Biol. Lipids2011, 1811, 818−826.
(20) Bochkov, V. N.; Oskolkova, O. V.; Birukov, K. G.; Levonen, A.L.; Binder, C. J.; Stockl, J. Antioxid. Redox Signaling 2010, 12, 1009−1059.(21) Tokumura, A.; Sumida, T.; Toujima, M.; Kogure, K.; Fukuzawa,K.; Takahashi, Y.; Yamamoto, S. J. Lipid Res. 2000, 41, 953−962.(22) Kayganich-Harrison, K. A.; Murphy, R. C. Anal. Biochem. 1994,221, 16−24.(23) Watson, A. D.; Leitinger, N.; Navab, M.; Faull, K. F.; Horkko,S.; Witztum, J. L.; Palinski, W.; Schwenke, D.; Salomon, R. G.; Sha,W.; Subbanagounder, G.; Fogelman, A. M.; Berliner, J. A. J. Biol. Chem.1997, 272, 13597−13607.(24) Frey, B.; Haupt, R.; Alms, S.; Holzmann, G.; Konig, T.; Kern,H.; Kox, W.; Rustow, B.; Schlame, M. J. Lipid Res. 2000, 41, 1145−1153.(25) Nakamura, T.; Henson, P. M.; Murphy, R. C. Anal. Biochem.1998, 262, 23−32.(26) Hall, L. M.; Murphy, R. C. Anal. Biochem. 1998, 258, 184−194.(27) Reis, A.; Domingues, P.; Ferrer-Correia, A. J. V.; Domingues, M.R. M. J. Mass Spectrom. 2004, 39, 1513−1522.(28) Nakanishi, H.; Iida, Y.; Shimizu, T.; Taguchi, R. J. Chromatogr.,B: Anal. Technol. Biomed. Life Sci. 2009, 877, 1366−1374.(29) Spickett, C. M.; Rennie, N.; Winter, H.; Zambonin, L.; Landi,L.; Jerlich, A.; Schaur, R. J.; Pitt, A. R. Biochem. J. 2001, 355, 449−457.(30) Oskolkova, O. V.; Afonyushkin, T.; Preinerstorfer, B.; Bicker,W.; von Schlieffen, E.; Hainzl, E.; Demyanets, S.; Schabbauer, G.;Lindner, W.; Tselepis, A. D.; Wojta, J.; Binder, B. R.; Bochkov, V. N. J.Immunol. 2010, 185, 7706−7712.(31) Megli, F. A.; Russo, L. Biochim. Biophys. Acta 2008, 1778, 143−152.(32) Domingues, M. R. M.; Simoes, C.; da Costa, J. P.; Reis, A.;Domingues, P. Biomed. Chromatogr. 2009, 23, 588−601.(33) Reis, A.; Domingues, P.; Ferrer-Correia, A. J. V.; Domingues, M.R. M. Rapid Commun. Mass Spectrom. 2004, 18, 2849−2858.(34) Reis, A.; Domingues, M. R. M.; Amado, F. M. L.; Ferrer-Correia,A. J. V.; Domingues, P. Biomed. Chromatogr. 2005, 19, 129−137.(35) Stubiger, G.; Belgacem, O. Anal. Chem. 2007, 79, 3206−3213.(36) van den Brink, O. F.; Boon, J. J.; O’Connor, P. B.; Duursma, M.C.; Heeren, R. M. A. J. Mass Spectrom. 2001, 36, 479−492.(37) Bischoff, A.; Eibisch, M.; Fuchs, B.; Suss, R.; Schurenberg, M.;Suckau, D.; Schiller, J. Acta Chromatogr. 2011, 23, 365−375.(38) Fuchs, B.; Bresler, K.; Schiller, J. Chem. Phys. Lipids 2011, 164,782−795.(39) Stubiger, G.; Belgacem, O.; Rehulka, P.; Bicker, W.; Binder, B.R.; Bochkov, V. Anal. Chem. 2010, 82, 5502−5510.(40) Garrett, T. J.; Prieto-Conaway, M. C.; Kovtoun, V.; Bui, H.;Izgarian, N.; Stafford, G.; Yost, R. A. Int. J. Mass Spectrom. 2007, 260,166−176.(41) Menger, R. F.; Stutts, W. L.; Anbukumar, D. S.; Bowden, J. A.;Ford, D. A.; Yost, R. A. Anal. Chem. 2011, 84, 1117−1125.(42) Garrett, T. J.; Yost, R. A. InMass Spectrometry Imaging: Principlesand Protocols; Rubakhin, S. S., Sweedler, J. V., Eds.; Humana Press:New York, 2010; Vol. 656, pp 209−230.(43) Landgraf, R. R.; Prieto-Conaway, M. C.; Garrett, T. J.;Stacpoole, P. W.; Yost, R. A. Anal. Chem. 2009, 81, 8488−8495.(44) Sparvero, L. J.; Amoscato, A. A.; Kochanek, P. M.; Pitt, B. R.;Kagan, V. E.; Bayır, H. J. Neurochem. 2010, 115, 1322−1336.(45) Karas, M.; Hillenkamp, F. Anal. Chem. 1988, 60, 2299−2301.(46) Schwartz, S. A.; Reyzer, M. L.; Caprioli, R. M. J. Mass Spectrom.2003, 38, 699−708.(47) Garrett, T. J.; Yost, R. A. Anal. Chem. 2006, 78, 2465−2469.(48) Domingues, P.; Domingues, M. R. M.; Amado, F. M. L.; Ferrer-Correia, A. J. Rapid Commun. Mass Spectrom. 2001, 15, 799−804.(49) Pulfer, M.; Murphy, R. C. Mass Spectrom. Rev. 2003, 22, 332−364.(50) Hsu, F.-F.; Turk, J. J. Am. Soc. Mass Spectrom. 2003, 14, 352−363.(51) Han, X.; Gross, R. W. J. Am. Soc. Mass Spectrom. 1995, 6, 1202−1210.
Analytical Chemistry Article
dx.doi.org/10.1021/ac402400f | Anal. Chem. 2013, 85, 11410−1141911418

(52) Hsu, F.-F.; Turk, J. J. Am. Soc. Mass Spectrom. 2010, 21, 657−669.(53) Hsu, F.-F.; Turk, J. J. Chromatogr., B: Anal. Technol. Biomed. LifeSci. 2009, 877, 2673−2695.(54) Cheng, C.; Gross, M. J. Am. Soc. Mass Spectrom. 1998, 9, 620−627.
Analytical Chemistry Article
dx.doi.org/10.1021/ac402400f | Anal. Chem. 2013, 85, 11410−1141911419