characterization of pasture biophysical properties and the ... · measurements, that grazing...
TRANSCRIPT
t 109 (2007) 314–327www.elsevier.com/locate/rse
Remote Sensing of Environmen
Characterization of pasture biophysical properties and the impact of grazingintensity using remotely sensed data
Izaya Numata a,⁎, Dar A. Roberts a, Oliver A. Chadwick a, Josh Schimel b, Fernando R. Sampaio c,Francisco C. Leonidas d, João V. Soares e
a Department of Geography, University of California, Santa Barbara, CA 93106, USAb Department of Ecology, Evolution, and Marine Biology, University of California Santa Barbara, CA 93106, USA
c Departamento de Agronomia, ULBRA-Centro Universitário Luterano de Ji-Paraná, Ji-Praná, RO, Brazild EMBRAPA/CEPAFRO, Porto Velho, RO, Brazil
e Instituto Nacional de Pesquisas Espaciais, São José dos Campos, SP, Brazil
Received 1 September 2006; received in revised form 11 January 2007; accepted 13 January 2007
Abstract
Remote sensing has the potential of improving our ability to map and monitor pasture degradation. Pasture degradation is one of the mostimportant problems in the Amazon, yet the manner in which grazing intensity, edaphic conditions and land‐use age impact pasture biophysicalproperties, and our ability to monitor them using remote sensing is poorly known. We evaluate the connection between field grass biophysicalmeasures and remote sensing, and investigate the impact of grazing intensity on pasture biophysical measures in Rondônia, in the BrazilianAmazon. Above ground biomass, canopy water content and height were measured in different pasture sites during the dry season. Using LandsatThematic Mapper (TM) data, four spectral vegetation indices and fractions derived from spectral mixture analysis, i.e., Non‐PhotosyntheticVegetation (NPV), Green Vegetation (GV), Soil, Shade, and NPV+Soil, were calculated and compared to field grass measures. For grazedpastures under dry conditions, the Normalized Difference Infrared Index (NDII5 and NDII7), had higher correlations with the biophysicalmeasures than the Normalized Difference Vegetation Index (NDVI) and the Soil‐Adjusted Vegetation Index (SAVI). NPV had the highestcorrelations with all field measures, suggesting this fraction is a good indicator of pasture characteristics in Rondônia. Pasture height wascorrelated to the Shade fraction. A conceptual model was built for pasture biophysical change using three fractions, i.e., NPV, Shade and GV tocharacterize possible pasture degradation processes in Rondônia. Based upon field measures, grazing intensity had the most significant impact onpasture biophysical properties compared to soil order and land‐use age. The impact of grazing on pastures in the dry season could be potentiallymeasured by using remotely sensed measures such as NPV.© 2007 Elsevier Inc. All rights reserved.
Keywords: Pasture degradation; Grass biomass; Spectral mixture analysis; Grazing intensity.
1. Introduction
Managed pastures have been the most important form ofland use in the Amazon since early colonization and continueto expand in the region. Many of these areas becomedegraded after only a few years (Fearnside and Barbosa,1998). However, quantitative measures of pasture conditionand their change in space and time due to pasture de-
⁎ Corresponding author. Tel.: +1 805 893 4434; fax: +1 805 893 3146.E-mail address: [email protected] (I. Numata).
0034-4257/$ - see front matter © 2007 Elsevier Inc. All rights reserved.doi:10.1016/j.rse.2007.01.013
gradation have not been reported in the Amazon and ourknowledge about the characteristics of grazed pastures isvery limited.
Pasture nutritional conditions and changes in soil and plant(grass) vary according to soil order and pasture age (Asner etal., 2004; Numata et al., 2007). In addition to pasturenutritional quality, pasture degradation refers to the reductionof pasture productivity, which is directly determined by achange in pasture biophysical properties such as biomass, leafarea index (LAI), grass density, and canopy height. Thesemeasures are a consequence of complex interactions among
315I. Numata et al. / Remote Sensing of Environment 109 (2007) 314–327
pasture management practices, pasture age, edaphic conditions,and climate (Dias Filho et al., 2000; Serrão & Toledo, 1990).Of these factors, grazing intensity may have the most directand rapid impact on standing biomass, LAI and vegetationcover in the short term (Lupinacci, 2002; Mwendera et al.,1997).
Animal stocking rates in the Amazonian pastures are usuallyabove the recommended level in order to maximize short termprofit (Costa & Rehman, 2005; Fearnside, 1996). As a result,overgrazing causes excess defoliation and grass nutrient loss,resulting in reduced animal production and pasture degradation(Lupinacci, 2002; Boddey et al., 2004). Although the primaryeffects of grazing intensity on pastures are known, the impactsof grazing intensity have not been quantitatively measured andtheir importance compared to other factors such as soil order, isnot clear.
Remote sensing provides temporal and spatial patterns ofecosystem change and has been used to estimate biophysicalcharacteristics of managed grasslands. In the Amazon,remote sensing has been used primarily to estimatedeforestation rates and monitor land‐cover change (Alves etal., 1999; Moran, 1993; Roberts et al., 2002; Skole &Tucker, 1993). However, our understanding of the utility ofremote sensing for Amazonian pastures is limited and theaccuracy and physical meaning of indices derived fromremote sensing should be evaluated. Recently, Asner et al.(2004) studied the linkage between pasture biochemical andphysical data and remotely derived measures, and found thatpasture characteristics measured by Landsat EnhancedThematic Mapper (ETM+) varied according to soil ordersand pasture age. Field pasture LAI and non‐photosyntheticmaterial area index (NPAI) were well correlated withremotely sensed indices such as Photosynthetic Vegetation(PV) and Non‐photosynthetic vegetation (NPV). Despitethese results, some points in Amazonian pasture character-ization using remote sensing remain unclear. For example,we do not know the relative importance of pasture age,grazing intensity, and nutrient availability on pasture canopyproperties and remotely sensed signatures. We therefore needto expand our understanding of the inter‐relationshipsbetween these land‐use, edaphic, and biogeochemical con-trols. Here, we investigate the potential of remotely senseddata for pasture characterization and for estimating grassbiophysical properties.
Our primary objective was to evaluate the biophysicalconnections between grazing intensity, pasture age andremotely sensed indices derived from Landsat TM imagery.The specific goals are to: 1) investigate the impacts of grazingintensity on pasture biophysical properties; 2) analyze relation-ships between pasture field data such as biomass, water andcanopy height and remotely sensed data. After determiningappropriate remote sensing measures for pasture characteriza-tion, a conceptual model will be constructed based upon thisanalysis. Finally, 3) to analyze the effects of grazing intensity onrelated remotely sensed data, addressing the question ofsensitivity of remote sensing to pasture biophysical changesdue to grazing intensity.
2. Methodology
2.1. Study site
The state of Rondônia is located in the southwesternBrazilian Amazon, occupying an area between 8 and 15° Sand 60 to 65° W (Fig. 1). Six ranches were used for this study,distributed in Porto Velho, Ariquemes, Ouro Preto, andPresidente Médici. These ranches are beef pastures (extensivemanagement system). Soil orders are related to geology andtopography of this region. Oxisols and Ultisols, both dystrophicsoils, are found mostly over the Precambrian granitoid andmeta‐supracrustal rocks with predominantly flat topography inthe north of the state, while Alfisols are distributed mainly incentral of Rondônia to the south, where they coincide with thepresence of intrusive basic and ultrabasic rocks with gentlyrolling topography (CPRM,1997; EMBRAPA, 1983; Holmes etal., 2004).
2.1.1. Field measurements: grass biophysical properties andsoils
Field measurements of grass biophysical properties wereconducted in July–August, 2003. Pasture field measurementsincluding biomass, grass water content and canopy height wereobtained from study sites that consisted of the same grassspecies, Brachiaria brizantha. Besides grass species, someweed species and burned forest debris were found especially inyoung pastures (6–10 years old). However, due to periodicburning and other management practices for weed controlemployed by ranch owners, the amount of residual woodyplants and successional plant cover decline as pastures age.Within each study site, the above measurements were takenfrom a 100 m transect placed on areas with different pastureages, if more than one age class was present. In total, sixteentransects were used for field measurements of grass biophysicalproperties in this study. Grass aboveground biomass wasclipped from a 50 cm × 50 cm quadrant at 20 m intervals alongeach 100 m transect gathering six biomass samples per transect.Grass biomass was weighed then oven dried at 70 °C for 36 h.Dried grass biomass was reweighed in order to calculate grasswater content. Canopy height was measured at 5 m intervalsalong the same transects.
Pasture management information was obtained throughinterviews with ranch owners. Grazing intensity in this studyrefers exclusively to stocking rate (number of animals per 1 ha).For the dry season in Rondônia, the recommended stocking rateis 1 Animal Unit (450 kg)/ha or 1.2 head/ha (F. C. Leonidas,personal communication). With respect to grazing rotation, therecommended fallow period for pasture after grazing is 20–30 days in Rondônia, but the fallow periods for our study sitesvaried from 5 to15 days, which is much shorter than isrecommended. Although we have information on grazingrotation period for each site at the time of the field survey, thetiming of grazing (when cattle come into the area and leave) wasnot known. Therefore, the impacts of grazing rotation onpasture biophysical changes are not clear in this study. It isassumed, based upon interviews with ranch owners and field

Fig. 1. Study area showing study sites distributed from Porto Velho to Presidente Médici.
316 I. Numata et al. / Remote Sensing of Environment 109 (2007) 314–327
measurements, that grazing rotation period in the dry season ispositively correlated with stocking rate: the higher the stockingrate, the more biomass will be consumed and the more quicklythe rotation will be imposed.
There was no rainfall recorded during the field work and atleast three weeks prior to the imagery acquisition dates(SEDAM, 2004). Therefore, the effects of rainfall on fieldmeasurements of grass biophysical properties and remotelysensed data were neglected in this study. And the effects of soilmoisture on remotely sensed data are likely to be negligible too.Soil sampling was conducted in May and July–August in 2003.Soil samples were collected from 0–30 cm in the areas close toeach transect. Soil chemical measures such as pH, soil availableP, and Base saturation were measured according to the tech-niques described in EMBRAPA (1997). Soil reaction (pH) wasmeasured using a standard calomel electrode pH meter. TheMelich extractor was used to extract available P and exchange-able K. This extraction procedure utilizes 0.025 N of H2SO4, and0.05 N of HCl to remove labile forms of these nutrients.Phosphorus was determined using spectrophotometry by themethod Molybdate Blue while exchangeable K was determined
by flame photometry. Exchangeable Ca and Mg were extractedwith 1 N KCl, and quantified by titration with EDTA. Ex-changeable Al was extracted with 1 N KCl and quantified bytitration with 0.025 N NaOH. Base saturation was calculated as:
Base saturation¼ 100 S=cation exchange capacity ðCECÞ ð1Þ
where S=Ca+Mg+K and CEC=S+H+Al.
2.1.2. Statistical analysisTo analyze the impact of the variables including soil, land‐
use age and grazing intensity on biophysical data, one‐wayanalysis of variance (ANOVA) was performed. For the purposeof ANOVA, grazing intensity was divided into three classesbased on stocking rate: “high” (> 1.7 head/ha), “medium” (1.2–1.6 head/ha), and low (< 1.1 head/ha). The other variables,soil and age, were also divided into three classes: Soilorders, Alfisols, Ultisols and Oxisols, and three age classes,Young (6–10 years old), Intermediate (11–15 years old) andOld (> 16 years old).
Table 2Spectral indices used in this study
Spectral indices Reference
Normalized Difference Vegetation Index Rouse et al. (1973)NDVI=(R800−R680) / (R800+R680)
Soil‐Adjusted Vegetation Index Huete (1988)SAVI=(1.5⁎R800−R680) / (R800+R680+0.5)
Normalized Difference Infrared Index 5 Hardisky et al. (1983)NDII5=(R800−R1625) / (R800+R1625)
Normalized Difference Infrared Index7NDII7=(R800−R2220) / (R800+R2220)
317I. Numata et al. / Remote Sensing of Environment 109 (2007) 314–327
2.1.3. Remote sensing data and preprocessingThree Landsat Thematic Mapper 5 (TM5) scenes were used
in this study: 231/67, 231/68 (07/24/2003), and 232/66 (07/15/2003) (Table 1). Landsat TM5 is a spaceborne multi‐spectralsensor that has six spectral bands between 0.45 and 2.22 μm(three visible bands, one near‐infrared, and two short wave-length infrared bands). The ground instantaneous field‐of‐viewis 30 m. The Landsat series, starting with the MultispectralScanner (MSS) launched in 1972 and progressing to LandsatEnhanced Thematic Mapper (ETM+), are the most commonremote sensing data used for monitoring Amazonian tropicalrain forest since the 1970s.
Images were coregistered to the digital base maps providedby Instituto Nacional de Pesquisas Espaciais (INPE — theBrazilian Space Agency). Landsat TM images were inter‐calibrated to the corresponding Landsat ETM+ reflectanceimages using a relative radiometric calibration approach(Roberts et al., 1998a). Invariant targets such as primaryforest, second growth forest, bare soil, rock, and water wereselected for a pair of reflectance and uncalibrated images. Alinear equation was estimated using the pixel mean valuesextracted from a 4 by 4 pixel area of the invariant targets foreach band. These coefficients normalize the uncalibratedimages to the corresponding reference reflectance image.Three corresponding Landsat ETM+ images, i.e., 08/11/2001for 231/67 and 231/68, and 08/01/2001 for 232/66, wereradiometrically corrected using the gains and offset providedin the image metafile. Next, an atmospheric correction wasperformed using software Atmospheric Correction Now 3.0(ACORN — Imspec, 2003). The tropical model was used forreflectance retrieval. Water vapor was fixed at 35 mm for allthree images and image atmospheric visibility was set at35 km for the 231/67 and 231/68 scenes, and 45 km for the232/66 scene.
2.1.4. Image analysisGrass biomass, water content and canopy height were
measured from 16 transects and compared to Landsat data. Twotypes of spectral measures were derived from the imagery: 1)Spectral vegetation indices (VIs) based upon two spectral bandsand 2) Spectral Mixture Analysis (SMA).
Four VIs were calculated in this study (Table 2). The firsttwo VIs are the Normalized Difference Vegetation Index(NDVI) and Soil‐Adjusted Vegetation Index (SAVI) (Huete,1988). SAVI better accounts for the effects of variable soilbrightness than NDVI. The Normalized Difference InfraredIndices (NDII5 and NDII7) use the bands from the shortwavelength infrared (SWIR) region (band 5 — SWIR1 andband 7 — SWIR2, respectively) in place of band 4. These
Table 1Landsat data used in this study
Path/row City Landsat TM ETM reference
P232/R66 Porto Velho 2003–07–15 2001–08–01P231/R67 Ji‐Paraná 2003–07–24 2001–08–11P231/R68 Presidente Médici 2003–07–24 2001–08–11
indices are more sensitive to water content (Hardisky et al.,1983; Hill, 2004; Hunt and Rock, 1989).
SMA provides physically meaningful measures of thepercentage of the major components within the instantaneousfield‐of‐view, facilitating our interpretation (Adams et al., 1993;Roberts et al., 1993; Settle & Drake, 1993). SMA assumes thatthe spectra can be modeled as a linear combination of two ormore “pure” spectral endmembers (Adams et al., 1993):
qk ¼XNi¼1
fi⁎qik þ ek ð2Þ
where ρiλ is the reflectance of endmember i for a specific band(λ), fi is the fraction of the endmember, N is the number ofendmembers and ελ is the residual error. The sum of themodeled fractions is constrained to 1.
A root mean squared error (RMSE) is calculated for eachpixel of the scene to assess model fit (Adams et al., 1993):
RMSE ¼
ffiffiffiffiffiffiffiffiffiffiffiffiffiffiffiffiffiPMk¼1
ekð Þ2
M
vuuutð3Þ
whereM is the number of bands. SMA typically assumes singleinteractions between photons and surfaces, producing linearmixing of the surface fractions and their reflectance. In thisstudy, a 4‐endmember model was used including: NPV, GV,Soil, and Shade.
For SMA, a spectral library for NPV, GV, and Soil wasbuilt. The library consisted mostly of image endmembers,which were collected from Landsat reflectance images, butsome spectra from the field spectrometer were included in thelibrary as well. Field grass spectra were measured using anAnalytical Spectral Device (ASD) — full range spectrometer(350 to 2500 nm, Boulder, CO), on loan from the JetPropulsion Laboratory (JPL). The ASD measurements wereconducted for all study sites. The ASD spectra were collectedwith a 22° field‐of‐view (FOV) at 5 m intervals along 100 mtransect with a 1 m sensor height above grass canopies. Allspectral measurements were collected within 2 h of local solarnoon under clear‐sky conditions. Five replicates weremeasured for each grass canopy. These spectra werestandardized to Spectralon (Labsphere, Inc, North Sutton,NH) measured at approximately 10 min intervals, andconverted into reflectance. The spectra from the field

318 I. Numata et al. / Remote Sensing of Environment 109 (2007) 314–327
spectrometer were convolved to Landsat ETM+ using filterfunction of the ETM+ sensor.
For the selection of endmembers, we used MultipleEndmember Spectral Mixture Analysis (MESMA) developedby Roberts et al. (1998b). MESMA allows the number and typesof endmembers to vary on a pixel basis. A model that meets thecriteria of the selection such as lowest RMSE (2.5%), physicallyreasonable fraction (0 < f < 1.0), etc., is considered the bestmodel for the related pixel and selected in MESMA classifica-tion output. MESMA generates all possible combinations ofmodels based upon different input endmembers from a spectrallibrary. In this study, as input endmembers we selected fiveendmembers for soil, nine for GV, and eleven for NPV. Thisgenerated 495 models and we also added five already existentmodels. In total, we had 500 models. See Roberts et al. (1998b)for more details. MESMA was performed for all Landsat dataand we selected the best 4‐endmember model with NPV, GV,Soil, and Shade (photometric shade), out of 500 models, thatwas selected in pasture areas. With these selected endmembers
Fig. 2. a) Landsat TM data showing typical land‐cover types in the study area.B5, B4, and B3 in RGB; b) Selected Endmembers for Spectral MixtureAnalysis: NPV, GV, and Soil.
(Fig. 2b), simple SMA was performed generating NPV, GV,Soil, Shade fraction images (Fig. 3) and RMSE (not shown).
The vegetation indices and fractions of NPV, GV, Shade andSoil were extracted from four pixels along each transect in theimages and then averaged, representing 16 points (transects).Finally, these data were correlated to the relative pasture fielddata.
3. Results
3.1. Field measurements of grass biophysical properties andthe effects of the variables
3.1.1. Stocking rate, soil, and land‐use ageTable 3 summarizes field measurements of grass biophysical
properties from the 16 transects. Stocking rate in this table refersto general animal stocking rate for each ranch, therefore thosetransects with the same stocking rate imply that they are fromthe same ranch (study site). Most of the study sites exceeded therecommended stocking rate of 1.2 head/ha, indicating somedegree of overgrazing.
The results of ANOVA reveal that all the factors, i.e., soil,land‐use age, and stocking rate are significant for all pasturevariables at P < 0.05 (Table 4). However, F values indicate thatgrazing intensity is the most important and influential factor formeasurements of grass biophysical properties, followed by soiland age. Direct comparisons of biophysical properties with soilpH, soil available P, and base saturation showed weakrelationships, whereas stocking rate had a better relationship(r2 =0.72, p value < 0.0001, with biomass) (Fig. 4). Theseresults demonstrate the importance of grazing intensity forabove ground pasture changes.
3.1.2. Pasture biophysical properties vs. remote sensing
3.1.2.1. Vegetation indices. All four vegetation indicesshowed positive relationships with pasture measurements(Fig. 5). In general, the correlations were highest for watercontent and lowest for biomass. The chlorophyll based indices,NDVI and SAVI had poor correlations (r2 =0.05−0.13)compared to the SWIR based indices, i.e., NDII5 and NDII7(r2 =0.33−0.38). NDVI and SAVI, which rely on the spectralcontrast between red and near‐infrared bands, are sensitive toleaf‐chlorophyll content and LAI in vegetation, whereas NDII5and NDII7 are more sensitive to leaf water content of vegetation(Hardisky et al., 1983; Hunt and Rock, 1989). Low correlationcoefficients between field measurements of grass biophysicalproperties and chlorophyll based indices can be accounted forby the fact that pastures under dry conditions and intense cattlegrazing have small amounts of green leaves, and non‐photosynthetic materials such as stems and dry leaves dominatepasture biomass. Since NPV exhibits elevated reflectance inband 3 (Fig. 2b), red and near‐infrared based indices arehampered by the small contrast between these two bands inNPV dominated grasses. In the case of NDII5 and NDII7, band5 and band 7 vary as a function of grass water content inpastures, while band 3 is less sensitive to grass water content.
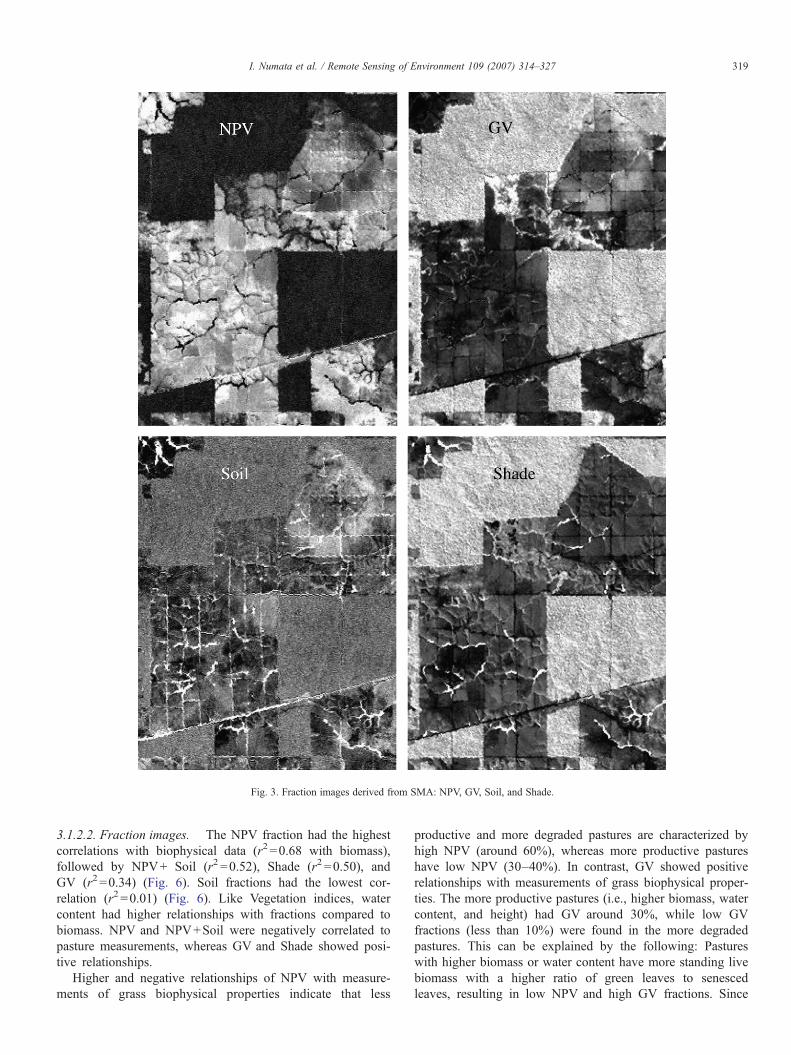
Fig. 3. Fraction images derived from SMA: NPV, GV, Soil, and Shade.
319I. Numata et al. / Remote Sensing of Environment 109 (2007) 314–327
3.1.2.2. Fraction images. The NPV fraction had the highestcorrelations with biophysical data (r2 =0.68 with biomass),followed by NPV+ Soil (r2 =0.52), Shade (r2 =0.50), andGV (r2 =0.34) (Fig. 6). Soil fractions had the lowest cor-relation (r2 =0.01) (Fig. 6). Like Vegetation indices, watercontent had higher relationships with fractions compared tobiomass. NPV and NPV+Soil were negatively correlated topasture measurements, whereas GV and Shade showed posi-tive relationships.
Higher and negative relationships of NPV with measure-ments of grass biophysical properties indicate that less
productive and more degraded pastures are characterized byhigh NPV (around 60%), whereas more productive pastureshave low NPV (30–40%). In contrast, GV showed positiverelationships with measurements of grass biophysical proper-ties. The more productive pastures (i.e., higher biomass, watercontent, and height) had GV around 30%, while low GVfractions (less than 10%) were found in the more degradedpastures. This can be explained by the following: Pastureswith higher biomass or water content have more standing livebiomass with a higher ratio of green leaves to senescedleaves, resulting in low NPV and high GV fractions. Since

Table 3Summary of field measures and characteristics of study sites
Transect S.D. a
(head/ha)Age b Soil Biomass
(t/ha)Moisture(t/ha)
Height(cm)
ja 1.09 Yg Alfisols 9.14 2.60 48 (17)jb 1.09 Int Alfisols 9.91 3.37 49 (11)jc 1.09 Old Alfisols 7.14 2.62 33 (11)pa 1.60 Yg Alfisols 4.02 1.50 26 (7)pb 1.60 Int Alfisols 5.84 2.48 28 (10)pc 1.60 Old Alfisols 3.80 1.21 23 (10)na 1.38 Old Ultisols 5.53 2.45 15 (8)nb 1.38 Old Ultisols 4.79 1.95 17 (8)ta 1.36 Yg Oxisols 6.40 2.51 36 (17)tb 1.36 Int Oxisols 5.49 2.08 21 (11)tc 1.36 Old Oxisols 3.58 1.35 21 (10)ra 2.29 Int Ultisols 2.43 0.65 5 (4)rb 2.29 Int Ultisols 1.18 0.33 5 (4)sa 1.77 Old Oxisols 2.57 0.99 14 (12)sb 1.77 Old Oxisols 5.50 2.08 17 (10)sc 1.32 Int Oxisols 4.31 1.62 25 (18)
a Stocking rate.b Age classes are: Yg=young (6–10 years), Int = intermediate (11–15 years),
Old=old (>16 years).
Table 4ANOVA results for biomass, canopy moisture, and height with the factorsgrazing, soil and age
Indices df F value Pr (F)
BiomassGrazing 2 29.81 <0.0001Soil 2 8.96 <0.001Age 2 4.07 0.019MoistureGrazing 2 17.393 <0.0001Soil 2 4.9 0.009Age 2 3.32 0.04HeightGrazing 2 152.57 <0.0001Soil 2 93.46 <0.0001Age 2 46.56 <0.001
320 I. Numata et al. / Remote Sensing of Environment 109 (2007) 314–327
cattle selectively graze on live and green biomass, thedecrease of the amount of above ground biomass by cattlegrazing implies the reduction of standing live biomass. As aresult, the amount of exposed senesced leaves and exposedlitter on the ground increases as the grass canopy is loweredby cattle grazing, contributing to an increase in NPV and adecrease in GV. Since pastures in the dry season are stronglydominated by non‐photosynthetic materials as discussedabove, the magnitude of GV variability is smaller than NPVvariability for pastures and, therefore, grasses are bettercharacterized by NPV than GV. On the other hand, the GVfraction had a higher r2 than NDVI and SAVI and as high anr2 as NDII5 and NDII7. Spectral mixture models utilize allspectral information of the six Landsat TM bands, and grazedand dry pastures may be better characterized by GV thantypical vegetation indices that involve only two or threebands.
Shade fractions increased as biomass increased. This isprobably related to a change in grass stature or canopy heightfrom low to high canopy height accompanied by the increasein biomass. Taller grass canopies cast more shadows, whereasshort pasture canopies cast fewer shadows within theircanopies. This inference is supported by the fact that thehighest r2 for the shade fraction is found with canopy height(r2 =0.65).
The soil fraction has been considered a very importantmeasure of pasture degradation or overgrazed areas, especiallyin semi‐arid regions (Asner & Heidebrecht, 2003; Huete et al.,2003; Pickup et al., 1998). In the case of our study, the soilfraction was low and not a good indicator of pasturebiophysical properties since most of our study sites have ahigh vegetation cover including live‐senesced biomass andlitter and a small amount of bare soil. Our results concur withother studies for Amazonian pastures (Asner et al., 1999;Asner et al., 2004). Another reason for low correlations of this
fraction is related to the fact that NPV and Soil are difficult todiscriminate using multispectral sensors due to the lack ofwell expressed ligno‐cellulose bands in multi‐spectral datasuch as Landsat (Roberts et al., 1993; van Leeuwen & Huete,1996). In the case of this study, where NPV is predominantand exposed soil is low, the soil fraction was not wellmodeled.
Combining NPVand Soil avoids this spectral confusion, andshows a clear decrease as biomass increased. The spectralsignatures of pastures with low biomass consist not only ofstanding biomass, but also of the substrate beneath the pasturecanopy such as litter and soil. If the surface of an area is coveredby litter, a high NPV fraction can be found, but the soil fractioncan be high if the surface is bare soil. A good estimate of thesetwo fractions, NPV and Soil, greatly improves land‐covercharacterization. (Roberts et al., 1998a; van Leeuwen & Huete,1996).
Over all, SMA fractions, except Soil, performed better forpasture characterization compared to vegetation indices.These fractions provide intuitive measures for the landsurface characteristics (physically meaningful measures ofthe target) that facilitate our interpretation. Figs. 7 and 8 showexamples of the fractional characteristics for two extremepasture cases in terms of biophysical properties; unproductive/degraded pasture and highly productive pasture. Site r (Table3 and Fig. 7) has brighter pastures in NPV and NPV+Soilfraction images than Site j (Table 3 and Fig. 8), whereas GVand Shade fractions are higher in Site j compared to Site r(Fig 8).
Grass biophysical change measured by SMA fractions can besummarized by the conceptual model in Fig. 9. More productivepastures can maintain higher biomass, which includes liveleaves with higher water content and taller plants. Higher GV(around 20%) and Shade (15–20%) with lower NPV arecharacteristics of these pastures. On the other hand, heavilygrazed and dry pastures have less live leaves with a short heightand litter on the ground, which results in a combination of highNPV, low GV, and low Shade. The arrow in Fig. 9 indicates apossible direction of the pasture degradation processes: fromhighly productive to degraded pastures with low biomass, basedupon SMA fractional changes.

Fig. 4. Relationships of field pasture measures with soil pH, P, base saturation, and stocking rate.
321I. Numata et al. / Remote Sensing of Environment 109 (2007) 314–327
3.2. Grazing intensity vs. remote sensing
Relationships between grazing intensity and remotely senseddata are similar to the ones between field measurements of grassbiophysical properties and remote sensing. The results are notsurprising given the fact that the remotely sensed data showed
reasonable relationships with grass field measures. Also grazingintensity is the most influential factor for grass biomass dynamics.In Table 5, NPV and NPV+Soil showed highly significant andpositive correlations with cattle stocking rate (r2=0.70 and 0.53,respectively, at P<0.001). NDII5, NDII7, GV and Shade werealso significant and negatively correlated at P level<0.01. These

Fig. 5. Scatterplots between field grass measures and vegetation indices.
322 I. Numata et al. / Remote Sensing of Environment 109 (2007) 314–327
results suggest that heavily grazed pastures in Rondônia aredominated by NPV, with a short canopy indicated by a low shadefraction, and low canopy moisture indicated by NDII. Grassbiophysical changes caused by pasture management maypotentially be monitored by remotely sensed data such as NPVduring the dry season in Rondônia (Fig. 10).
4. Discussion
4.1. Grazed pasture analysis and remotely sensed measures
NDVI or other chlorophyll based indices have been widelyused to characterize grass grazing systems and estimate grass
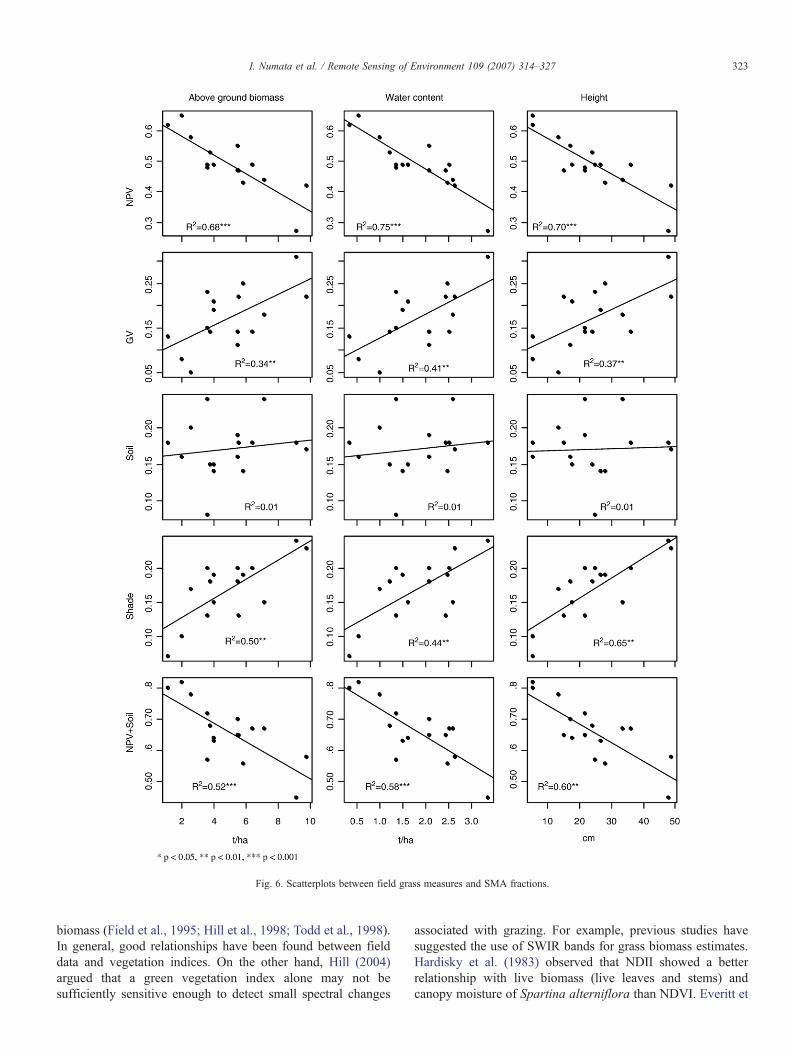
Fig. 6. Scatterplots between field grass measures and SMA fractions.
323I. Numata et al. / Remote Sensing of Environment 109 (2007) 314–327
biomass (Field et al., 1995; Hill et al., 1998; Todd et al., 1998).In general, good relationships have been found between fielddata and vegetation indices. On the other hand, Hill (2004)argued that a green vegetation index alone may not besufficiently sensitive enough to detect small spectral changes
associated with grazing. For example, previous studies havesuggested the use of SWIR bands for grass biomass estimates.Hardisky et al. (1983) observed that NDII showed a betterrelationship with live biomass (live leaves and stems) andcanopy moisture of Spartina alterniflora than NDVI. Everitt et

Fig. 7. Example of a low biomass pasture site (Site r).
Fig. 8. Example of a high bio
Fig. 9. Conceptual model of pasture change from productive to degraded basedon SMA fractions.
324 I. Numata et al. / Remote Sensing of Environment 109 (2007) 314–327
al. (1989) obtained good relationships for reflectance in the2200 nm wavelength and for indices using NIR and SWIRbands in estimate of grass biomass.
The question about which remotely sensed measures aremore appropriate for the analysis of grazed pastures may dependupon several factors. One of them is pasture phenology. Ifremotely sensed data and field measures are from the wet or latewet season, grass biophysical changes due to cattle grazing may
mass pasture site (Site j).
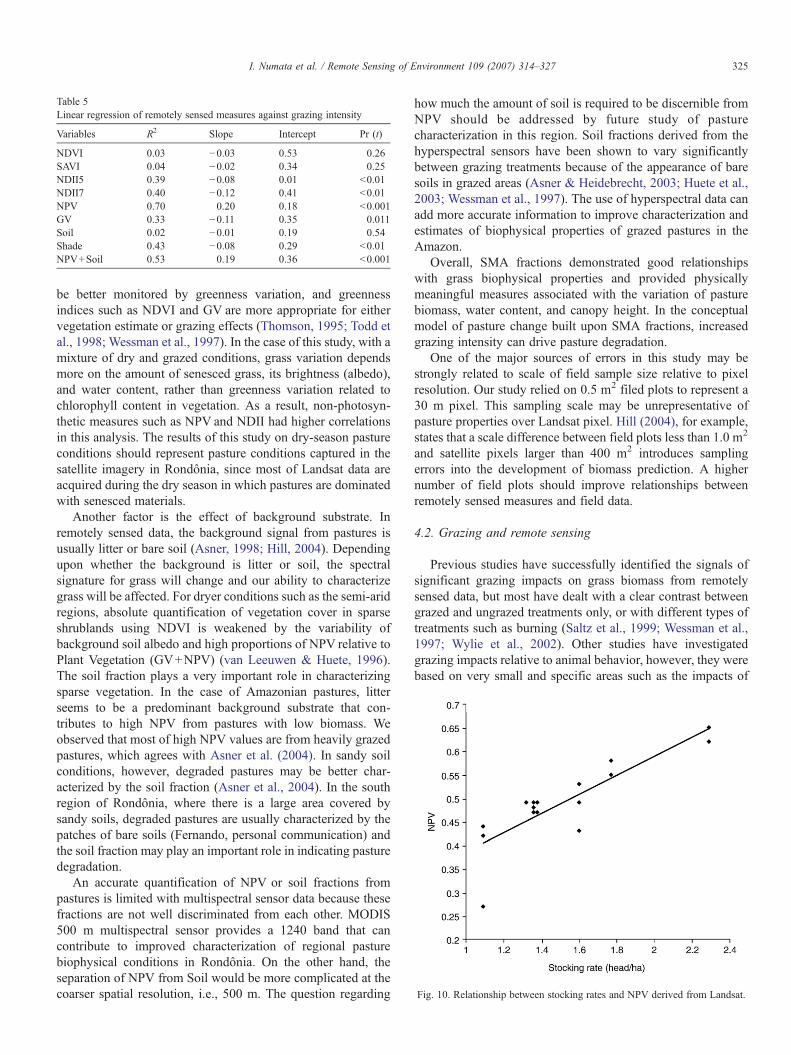
Table 5Linear regression of remotely sensed measures against grazing intensity
Variables R2 Slope Intercept Pr (t)
NDVI 0.03 −0.03 0.53 0.26SAVI 0.04 −0.02 0.34 0.25NDII5 0.39 −0.08 0.01 <0.01NDII7 0.40 −0.12 0.41 <0.01NPV 0.70 0.20 0.18 <0.001GV 0.33 −0.11 0.35 0.011Soil 0.02 −0.01 0.19 0.54Shade 0.43 −0.08 0.29 <0.01NPV+Soil 0.53 0.19 0.36 <0.001
Fig. 10. Relationship between stocking rates and NPV derived from Landsat.
325I. Numata et al. / Remote Sensing of Environment 109 (2007) 314–327
be better monitored by greenness variation, and greennessindices such as NDVI and GV are more appropriate for eithervegetation estimate or grazing effects (Thomson, 1995; Todd etal., 1998; Wessman et al., 1997). In the case of this study, with amixture of dry and grazed conditions, grass variation dependsmore on the amount of senesced grass, its brightness (albedo),and water content, rather than greenness variation related tochlorophyll content in vegetation. As a result, non‐photosyn-thetic measures such as NPV and NDII had higher correlationsin this analysis. The results of this study on dry‐season pastureconditions should represent pasture conditions captured in thesatellite imagery in Rondônia, since most of Landsat data areacquired during the dry season in which pastures are dominatedwith senesced materials.
Another factor is the effect of background substrate. Inremotely sensed data, the background signal from pastures isusually litter or bare soil (Asner, 1998; Hill, 2004). Dependingupon whether the background is litter or soil, the spectralsignature for grass will change and our ability to characterizegrass will be affected. For dryer conditions such as the semi‐aridregions, absolute quantification of vegetation cover in sparseshrublands using NDVI is weakened by the variability ofbackground soil albedo and high proportions of NPV relative toPlant Vegetation (GV+NPV) (van Leeuwen & Huete, 1996).The soil fraction plays a very important role in characterizingsparse vegetation. In the case of Amazonian pastures, litterseems to be a predominant background substrate that con-tributes to high NPV from pastures with low biomass. Weobserved that most of high NPV values are from heavily grazedpastures, which agrees with Asner et al. (2004). In sandy soilconditions, however, degraded pastures may be better char-acterized by the soil fraction (Asner et al., 2004). In the southregion of Rondônia, where there is a large area covered bysandy soils, degraded pastures are usually characterized by thepatches of bare soils (Fernando, personal communication) andthe soil fraction may play an important role in indicating pasturedegradation.
An accurate quantification of NPV or soil fractions frompastures is limited with multispectral sensor data because thesefractions are not well discriminated from each other. MODIS500 m multispectral sensor provides a 1240 band that cancontribute to improved characterization of regional pasturebiophysical conditions in Rondônia. On the other hand, theseparation of NPV from Soil would be more complicated at thecoarser spatial resolution, i.e., 500 m. The question regarding
how much the amount of soil is required to be discernible fromNPV should be addressed by future study of pasturecharacterization in this region. Soil fractions derived from thehyperspectral sensors have been shown to vary significantlybetween grazing treatments because of the appearance of baresoils in grazed areas (Asner & Heidebrecht, 2003; Huete et al.,2003; Wessman et al., 1997). The use of hyperspectral data canadd more accurate information to improve characterization andestimates of biophysical properties of grazed pastures in theAmazon.
Overall, SMA fractions demonstrated good relationshipswith grass biophysical properties and provided physicallymeaningful measures associated with the variation of pasturebiomass, water content, and canopy height. In the conceptualmodel of pasture change built upon SMA fractions, increasedgrazing intensity can drive pasture degradation.
One of the major sources of errors in this study may bestrongly related to scale of field sample size relative to pixelresolution. Our study relied on 0.5 m2 filed plots to represent a30 m pixel. This sampling scale may be unrepresentative ofpasture properties over Landsat pixel. Hill (2004), for example,states that a scale difference between field plots less than 1.0 m2
and satellite pixels larger than 400 m2 introduces samplingerrors into the development of biomass prediction. A highernumber of field plots should improve relationships betweenremotely sensed measures and field data.
4.2. Grazing and remote sensing
Previous studies have successfully identified the signals ofsignificant grazing impacts on grass biomass from remotelysensed data, but most have dealt with a clear contrast betweengrazed and ungrazed treatments only, or with different types oftreatments such as burning (Saltz et al., 1999; Wessman et al.,1997; Wylie et al., 2002). Other studies have investigatedgrazing impacts relative to animal behavior, however, they werebased on very small and specific areas such as the impacts of

326 I. Numata et al. / Remote Sensing of Environment 109 (2007) 314–327
grazing intensity gradient near water (Harris & Asner, 2003;Pickup et al., 1998), which does not indicate general pastureconditions under grazing systems. This study analyzed theeffects of grazing intensity on pasture biophysical variablesmeasured in the field and remote sensing along a gradient ofstocking density over the study sites. Remotely sensed measuressuch as NPV quantified the variability in measurements of grassbiophysical properties as a function of stocking rates. Asexpected, grazing intensity and remotely sensed data frompastures showed good relationships. The results may be used toindicate the regions affected by high grazing intensity inRondônia using remote sensing.
For more specific analyses, however, there are some issues tobe considered. First is grazing rotation. Although, this studyassumed the minimum effect of grazing rotation, the actualeffects of the rotation on grasses inside a study site, for example,are not well understood. Second is pasture types, i.e., beef anddairy, and related grass species. In this study, beef pastures withthe grass species B. brizantha were analyzed. Addition of dairypastures with different species such as Brachiaria decumbens,the most abundant species in the region after B. brizantha, willcomplete our knowledge about pasture characterization usingremote sensing. These points should be addressed in futurestudies.
5. Conclusions
In this study, we investigated the potential of remote sensingfor either quantification of pasture biophysical properties or theanalysis of grazing impacts on pasture conditions at the localscale using moderate resolution satellite sensor, i.e., LandsatTM. For grazed pastures under dry conditions, the NIR‐SWIRband indices, NDII5 and NDII7, better correlated with fieldmeasurements of grass biophysical properties than red‐NIRband indices, NDVI and SAVI. SMA fractions provided moreintuitive information on pasture conditions. NPV was found tobe a good proxy of pasture degradation in Rondônia andsuccessfully showed the impact of grazing on pastures. Othercharacteristics such as pasture height can also be estimatedusing the Shade fraction. Grass moisture was better correlatedwith remotely sensed data than biomass. These results mayreflect the main characteristics of Rondônia's pastures, since thesatellite data are primarily collected in the dry season.
For more accurate quantification, especially better discrimi-nation of Soil and NPV, higher spectral resolution data such asAster and Hyperion are needed. In addition, since we usedsingle date satellite images and field data, the consistency ofthese results should be tested at a different time of the year,investigating whether NPV provides the best estimate forbiomass and grazing intensity over longer periods. Temporalanalysis using high temporal resolution sensors such as MODISwill be able to address this question.
Acknowledgements
This studywas funded byNASA‐grants: LBAECOPhase II—NCC5–681 and the LBA Airborne Program, NCC5–589. We
also had technical and logistic support from EMBRAPA‐CPAFRO, Agronomy at ULBRA Ji‐Paraná, and INCRA Ji‐Paraná and INPE. We thank the reviewers of this paper, twoanonymous and Dr. Greg Asner, for their invaluable commentsand suggestions.
References
Adams, J. B., Smith, M. O., & Johnson, P. E. (1993). Imaging spectroscopy:interpretation based on spectral mixture analysis. In C. M. Pieters, & P. A. J.Englert (Eds.), Remote Geochemical Analysis: Elemental and MineralogicalComposition (pp. 145−164). Cambridge, England: Cambridge UniversityPress.
Alves, D. S., Pereira, J. L. G., De Sousa, C. L., Soares, J. V., & Yamaguchi, F.(1999). Characterizing landscape changes in central Rondonia using LandsatTM imagery. International Journal of Remote Sensing, 20, 2877−2882.
Asner, G. P. (1998). Biophysical and biochemical sources of variability incanopy reflectance. Remote Sensing of Environment, 64, 234−253.
Asner, G. P., & Heidebrecht, K. B. (2003). Imaging spectroscopy fordesertification studies: comparing AVIRIS and EO‐1 Hyperion in Argentinadrylands. IEEE Transactions on Geoscience and Remote Sensing, 41,1283−1296.
Asner, G. P., Townsend, A. R., & Bustamante, M. M. C. (1999). Spectrometry ofpasture condition and biogeochemistry in the Central Amazon. GeophysicalResearch Letters, 26, 2769−2772.
Asner, G. P., Townsend, A. R., Bustamante, M. M. C., Nardoto, G. B., &Olander, L. P. (2004). Pasture degradation in the central Amazon: linkingchanges in carbon and nutrient cycling with remote sensing. Global ChangeBiology, 10, 844−862.
Boddey, R. M., Macedo, R., Tarre, R. M., Ferreira, E., de Oliveira, O. C.,Rezende, C. D., et al. (2004). Nitrogen cycling in Brachiaria pastures: thekey to understanding the process of pasture decline. Agriculture Ecosystems& Environment, 103, 389−403.
Costa, F. P., & Rehman, T. (2005). Unravelling the rationale of ‘overgrazing’ andstocking rates in the beef production systems of Central Brazil using a bi‐criteria compromise programming model. Agricultural Systems, 83, 277−295.
CPRM. 1997. Mapa Geológico do Estado de Rondônia. in, Porto Velho, RO.Dias Filho, M. B., Davidson, E. A., & de Carvalho, C. J. R. (2000). Linking
biogeochemical cycles to cattle pasture management and sustainability in theAmazon Basin. In M. McClain, R. L. Victoria, & J. E. Ritchey (Eds.), TheBiogeochemistry of the Amazon Basin. New York: Oxford Univ. Press.
EMBRAPA. 1983. Mapa de levantamento de reconhecimento de meiaintensidade dos solos do estado de Rondônia, 1:500.000. in. ComissãoEstadual de Planejamento Agrícola, Porto Velho.
EMBRAPA. (1997). Manual de Métodos de Análise de Solo: 2a Edição Rio deJaneiro: Ministério da Agricultura e do Abastecimento.
Everitt, J. H., Escobar, D. E., & Richardson, A. J. (1989). Estimating grasslandphytomass production with near‐infrared and mid‐infrared spectral vari-ables. Remote Sensing of Environment, 30, 257−261.
Fearnside, P. M. (1996). Amazonian deforestation and global warming: carbonstocks in vegetation replacing Brazil's Amazon forest. Forest Ecology andManagement, 80, 21−34.
Fearnside, P. M., & Barbosa, I. R. (1998). Soil carbon changes from conversionof forest to pasture in Brazilian Amazonia. Forest Ecology and Manage-ment, 108, 147−166.
Field, C. B., Randerson, J. T., & Malmstrom, C. M. (1995). Global net primaryproduction — combining ecology and remote‐sensing. Remote Sensing ofEnvironment.
Harris, A. T., & Asner, G. P. (2003). Grazing gradient detection with airborneimaging spectroscopy on a semi‐arid rangeland.
Hardisky, M. A., Klemas, V., & Smart, R. M. (1983). The influence of soil‐salinity, growth form, and leaf moisture on the spectral radiance of Spartinaalterniflora canopies. Photogrammetric Engineering and Remote Sensing,49, 77−83.
Hill, M. J. (2004). Grazing agriculture: Managed pasture, grassland, andrangeland. In S. L. Ustin (Ed.), Manual of Remote SensingRemote sensing

327I. Numata et al. / Remote Sensing of Environment 109 (2007) 314–327
for natural resource management and environmental monitoring, vol. 4.(pp. 449−530). Hoboken, NJ: John Wiley & Sons.
Hill, M. J., Donald, G. E., Vickery, P. J., Smith, R. C. G. 1998. NDVI‐basedphonological indices; predictive potential for grazing systems. Proceedingfor the 9th Australasian Remote Sensing and Photogrammetry Conference,UNSW, Sydney, July, 1998 CDROM.
Holmes, K. W., Roberts, D. A., Sweeney, S., Numata, I., Matricardi, E., Biggs,T. W., et al. (2004). Soil databases and the problem of establishing regionalbiogeochemical trends. Global Change Biology, 10, 796−814.
Huete, A. R. (1988). A soil‐adjusted vegetation index (SAVI). Remote Sensingof Environment, 25, 295−309.
Huete, A. R., Miura, T., & Gao, X. (2003). Lands cover conversion anddegradation analyses through coupled soil–plant biophysical parametersderived from Hyperspectral EO‐1 Hyperion. IEEE Transactions onGeoscience and Remote Sensing, 41, 1268−1276.
Hunt, E. R., & Rock, B. N. (1989). Detection of changes in leaf water contentusing near‐ and middle‐infrared reflectance. Remote Sensing of Environ-ment, 30, 43−54.
Imspec (2003). ACORNTM user's guide. Analytical Imaging and GeophysicsBoulder, CO, USA.
Lupinacci, A. V. (2002). Reservas orgânicas, índice de área foliar e produçãode Forragem em Brachiaria brizantha cv. Marandu submetida a intensidadede pastejo por bovino de corte. Master Piracicaba: ESALQ/USP.
Moran, E. F. (1993). Deforestation and land use in the Brazilian Amazon. Hu-man Ecology, 21, 1−21.
Mwendera, E. J., Saleem, M. A. M., &Woldu, Z. (1997). Vegetation response tocattle grazing in the Ethiopian highlands. Agriculture Ecosystems &Environment, 64, 43−51.
Numata, I., Chadwick, O. A., Roberts, D. A., Schimel, J. P., Sampaio, F. F., &Leonidas, F. C. (2007). Temporal nutrient variation in soil and vegetation ofpost-forest pastures as a function of soil order, pasture age, and management,Rondônia, Brazil. Agriculture Ecosystems & Environment, 118, 159−172.
Pickup, G., Bastin, G. N., & Chewings, V. H. (1998). Identifying trends in landdegradation in non‐equilibrium rangelands. Journal of Applied Ecology, 35,365−377.
Roberts, D. A., Numata, I., Holmes, K., Batista, G., Krug, T., Monteiro, A.,2002. Large area mapping of land‐cover change in Rondonia usingmultitemporal spectral mixture analysis and decision tree classifiers. Jour-nal of Geophysical Research‐Atmospheres, 107, 40–41–40–18.
Roberts, D. A., Batista, G., Pereira, J. L. G., Waller, E., & Nelson, B. (1998).Change identification using multitemporal spectral mixture analysis:applications in eastern Amazônia. In C. Elvidge, & R. Lunetta (Eds.), Re-
mote Sensing Change Detection: Environmental Monitoring Applicationsand Methods (pp. 137−161). Ann Arbor: Ann Arbor Press.
Roberts, D. A., Gardner, M., Church, R., Ustin, S., Scheer, G., & Green, R. O.(1998). Mapping chaparral in the Santa Monica Mountains using multipleendmember spectral mixture models. Remote Sensing of Environment, 65,267−279.
Roberts, D. A., Smith, M. O., & Adams, J. B. (1993). Green vegetation,nonphotosynthetic vegetation, and soils in AVIRIS data. Remote Sensing ofEnvironment, 44, 255−269.
Rouse, J. W., Haas, R. H., Schell, J. A., & Deering, D. W. (1973). Monitoringvegetation systems in the Great Plains with ERTS. Proceedings of the thirdERTS symposium (pp. 309−317).
Saltz, D., Schmidt, H., Rowen, M., Karnieli, A., Ward, D., & Schmidt, I. (1999).Assessing grazing impacts by remote sensing in hyper‐arid environments.Journal of Range Management, 52, 500−507.
SEDAM (2004). Boletim Climatologico de Rondônia— Ano 2003. Porto Velho:Secretaria de Estado de Desenvolvimento Ambiental.
Serrão, E. A. S., & Toledo, J. M. (1990). The search for sustainability inAmazonian pastures. In A. B. Anderson (Ed.), Alternatives to deforestation:Steps toward sustainable use of the Amazon rain forest (pp. 195−214). NewYork: Columbia University Press.
Settle, J. J., & Drake, N. A. (1993). Linear mixing and the estimation ofground cover proportions. International Journal of Remote Sensing, 14,1159−1177.
Skole, D., & Tucker, C. (1993). Tropical deforestation and habitat fragmentationin the Amazon — satellite data from 1978 to 1988. Science, 260,1905−1910.
Todd, S. W., Hoffer, R. M., & Milchunas, D. G. (1998). Biomass estimation ongrazed and ungrazed rangelands using spectral indices. InternationalJournal of Remote Sensing, 19, 427−438.
Thomson, A. G. (1995). Airborne radiometry and a sheep grazing experiment ondune grassland. International Journal of Remote Sensing, 16, 981−988.
van Leeuwen, W. J. D., & Huete, A. R. (1996). Effects of standing litter on thebiophysical interpretation of plant canopies with spectral indices. RemoteSensing of Environment, 55, 123−138.
Wessman, C. A., Bateson, C. A., & Benning, T. L. (1997). Detecting fire andgrazing patterns in tallgrass prairie using spectral mixture analysis. Ecolo-gical Applications, 7, 493−511.
Wylie, B. K., Meyer, D. J., Tieszen, L. L., & Mannel, S. (2002). Satellitemapping of surface biophysical parameters at the biome scale over the NorthAmerican grasslands — a case study. Remote Sensing of Environment, 79,266−278.