characterization of human sperm populations using conventional
TRANSCRIPT
Tscsn
sdvtg
RS
R
Characterization of human sperm populations usingconventional parameters, surface ubiquitination, andapoptotic markersSandra Varum, B.Sc.,a Carla Bento, B.Sc.,a Ana Paula M. Sousa, B.Sc.,a Carina S. S. Gomes-Santos, B.Sc.,a Paula Henriques, B.Sc.,b Teresa Almeida-Santos, Ph.D., M.D.,b
Cristina Teodósio, B.Sc., c Artur Paiva, Ph.D.,c and João Ramalho-Santos, Ph.D.a
a Center for Neuroscience and Cell Biology, Department of Zoology, University of Coimbra, Coimbra, Portugal; b Departmentof Maternal-Fetal Medicine, Genetics and Human Reproduction, University Hospitals of Coimbra, Coimbra, Portugal; andc Histocompatibility Centre of Coimbra, Coimbra, Portugal
Objective: To directly compare distinct assays proposed to monitor human sperm quality and possibly preselectsperm populations for assisted reproductive technology (ART).Design: Analysis of human sperm sample quality using several methodologies.Setting: Academic and clinical institutions.Patient(s): Samples from consenting patients undergoing routine semen analysis or ART.Interventions: Human sperm samples were analyzed in terms of World Health Organization parameters andprocessed for annexin V, terminal deoxynucleotidyl transferase–mediated dUTP nick-end labeling of DNA(TUNEL), and the sperm–ubiquitin tag immunoassay (SUTI). Samples were analyzed both by flow cytometryand fluorescence microscopy.Main Outcome Measure(s): Correlations among apoptotic markers (outer leaflet phosphatidylserine exposure,membrane integrity, and DNA fragmentation), external ubiquitination, and semen parameters in human sperma-tozoa.Result(s): Nonviable sperm, TUNEL-positive cells, and ubiquitin fluorescence intensity means inversely corre-late with semen parameters. Apoptotic markers do not correlate with sperm surface ubiquitination. Normozo-ospermic samples have a higher number of viable cells and lower DNA fragmentation compared with sampleswith abnormal parameters. Nonviable sperm are more prevalent in samples with low counts and poor morphologybut not low motility. Not all sperm with morphologic abnormalities present surface ubiquitination.Conclusion(s): Sperm quality is inversely correlated with lack of viability, DNA fragmentation, and ubiquitinfluorescence intensity means. However, none of the apoptotic markers correlate with ubiquitin labeling. Elimi-nation of defective sperm cells prior to ART using surface markers (annexin V, ubiquitin) seems unwarranted atthis stage. (Fertil Steril� 2007;87:572–83. ©2007 by American Society for Reproductive Medicine.)
Key Words: human sperm, semen parameters, annexin V, TUNEL, ubiquitin, fluorescence microscopy, flowcytometry
mwqdspubmp
paglio
he heterogeneous nature of every ejaculate in terms ofperm functionality has led to many attempts both toharacterize distinct populations and to improve sorting/election of male gametes for assisted reproductive tech-ology (ART).
Besides classical techniques (gradient centrifugation,wim-up), more recent assays have been proposed based onifferential staining of spermatozoa with biologically rele-ant markers. In this case, following classical separations,he cells would then be further incubated with beads conju-ated with different probes that would bind defective sper-
eceived October 5, 2005; revised and accepted 21 July 2006.upported by a grant from the Portuguese National Science Foundation(Fundação para a Ciência e Tecnologia, FCT) to J.R.-S. (POCTI/ESP/38049/2001). S.V. and A.P.S. are supported by Ph.D. grants from FCT,Portugal.
eprint requests: João Ramalho-Santos, Ph.D., Center for Neuroscienceand Cell Biology, Department of Zoology, University of Coimbra, 3004-517
bCoimbra, Portugal (FAX: �351 239 855789; E-mail: [email protected]).
572 Fertility and Sterility� Vol. 87, No. 3, March 2007Copyright ©2007 American Society for Reproductive Medicine,
atozoa not yet eliminated. Removal of the beads (togetherith bound cells) would thus yield a theoretically higheruality sample. This would be especially relevant if theefective sperm cells in question could not be identified byimple visualization (1). Indeed, although spermatozoa fromatients possess multiple structural and functional defects,sually evaluated by light microscopy (2), this approach cane limited, because, for example, spermatozoa with normalorphology can, nevertheless, have DNA defects or be
ositive for apoptotic markers (3).
Apoptotic markers seem to be good candidates for theossible selection of functional sperm (or for the removal ofbnormal cells). Apoptosis is a process of cell death based onenetic mechanisms that induce a series of cellular, morpho-ogic, and biochemical alterations (4). It is, for example,nvolved in counteracting clonal expansion during spermat-genesis (5, 6). Furthermore, male fertility can be affected
y alterations in apoptotic mechanisms (7).0015-0282/07/$32.00Published by Elsevier Inc. doi:10.1016/j.fertnstert.2006.07.1528
ttpsrdtDm
trasmeademco
esf
fptt(llumdsaslac
smtuds(Mnr
ted
tocu(m
ototoasfelmbi
MALiabo
BHCdvssfbfupn
ncmQm
F
One of the earliest apoptotic events is the translocation ofhe phospholipid phosphatidylserine (PS) from the inner tohe outer leaflet of the plasma membrane. PS exposurerovides an opportunity to identify cells that are in an earlytage of apoptosis. These cells can be detected using fluo-escently tagged annexin V, which binds PS in a calcium-ependent fashion, and has thus been used to detect apopto-ic spermatozoa (7–9). When coupled with an impermeantNA dye, the annexin V assay can also, in parallel, quantifyembrane integrity.
Another important feature of apoptosis is DNA fragmen-ation. This process occurs in the later stages of apoptosis,esults from the activation of endogenous endonucleases (9),nd can be detected using a variety of assays, such as theperm chromatin structure assay (SCSA), comet, or the ter-inal deoxynucleotidyl transferase–mediated dUTP nick-
nd labeling assay, known as the TUNEL assay (3). Severaluthors have proposed DNA strand breaks as the main evi-ence for apoptosis in human spermatozoa (4, 8, 10). How-ver, it is important to note that DNA fragmentation inature sperm can have other origins besides apoptosis, as it
an occur during or after DNA packaging in spermiogenesisr as a result of oxidative stress (8).
Although several reports refer to DNA fragmentation andxternalization of PS in human sperm as putative markers forperm selection, correlations with seminal parameters (andertility) are still controversial.
Recently, ubiquitin labeling was validated as a biomarkeror human infertility (11). Ubiquitin is a ubiquitously ex-ressed 76-amino-acid protein that can be covalently at-ached to target proteins, and polyubiquitination tags pro-eins for degradation by 26S proteasome or by lysosomes12). It was originally proposed (13) that epididymal epithe-ial cells secrete ubiquitin and phagocyte defective spermabeled with this marker. This study also demonstrated thatbiquitinated spermatozoa found in the ejaculate, and whichay have escaped phagocytosis, are characterized by major
efects in the head or axoneme. Furthermore, more recenttudies proposed that this biomarker could be used [a] tossess sperm quality by flow cytometry, with poor qualityamples yielding higher ubiquitination, which would trans-ate to higher fluorescence intensities (11), and [b] that thessay could also help select spermatozoa for ART, as aomplement for classical separations (1).
Surprisingly, results obtained by other authors suggest thatperm ubiquitination positively correlates with normal se-en parameters in human sperm (especially morphology),
hus implying that there may be a functional role for ubiq-itination in normal sperm (14). The same authors have alsoemonstrated the presence of bodies of different sizes inperm samples, especially in oligoasthenoteratozoospermicOAT) men, which can be detected when stained with the
erocyanine 540 (M540) dye. The nature of these bodies isot well defined, but they do not contain DNA and may
esult from sperm degradation (15). It was thus suggested tertility and Sterility�
hat the negative correlation found between seminal param-ters and ubiquitination by flow cytometry (11) was mainlyriven by these bodies and not by sperm (14).
The corollary of these contradictory results is that, al-hough the original proposal to use ubiquitination as a bi-marker for male infertility may still be valid, direct appli-ations for sperm selection in the clinic would benwarranted. Furthermore, the actual biological significancepositive or negative) of human sperm ubiquitination re-ains elusive.
Our aims in this study were [a] to determine percentagesf translocation of PS and DNA fragmentation and correlatehem with seminal parameters; [b] to determine percentagesf ubiquitination in the same semen samples and correlatehem with seminal parameters and both apoptosis assays. Tour knowledge, this is the first time these three differentssays have been carried out simultaneously on the sameamples in humans, although similar work has been per-ormed by our group in feline sperm (16). Given the differ-nces in methodology reported by other authors, we ana-yzed samples by both direct visualization (fluorescenceicroscopy) and flow cytometry, in this case quantifying
oth the percentage of labeled entities and the fluorescencentensity of biomarkers.
ATERIALS AND METHODSll chemicals were from Sigma Chemical Company (St.ouis, MO), unless stated otherwise. All patients signed
nformed consent forms, and all human material was used inccordance with the appropriate ethical and internal reviewoard (IRB) guidelines provided by the University Hospitalsf Coimbra.
iological Materialuman sperm samples were obtained from the Fertilitylinic (University Hospitals of Coimbra) from patients un-ergoing routine semen analysis or fertility treatments in-olving both in vitro fertilization (IVF) and intracytoplasmicperm injection (ICSI). During a 2-year period, a total of 150amples were collected and used in this study (see Table 1or details). Fresh semen samples were obtained by mastur-ation after 2–5 days abstinence and were allowed to liquefyor 10–20 minutes at room temperature or for 20–30 min-tes at 37°C in cases of high viscosity. The routine seminalarameters were evaluated according to World Health Orga-ization (WHO) criteria (2).
The variables taken into consideration were total spermumber, volume, pH, leukocyte number, motility, and spermoncentration. For morphologic analysis, semen smears wereade on microscopy slides and then treated with the Diff–uick stain set (Dade Behring Inc., Newark, NJ). Spermorphology was assessed using strict criteria (17). Informa-
ion on proven fertility of patients was not available. All the
573

fll
FSaaptp
DITamwHC�mNfiat(FpFLtt
1d
th(fleascltsappgapwcda
DTuatfffis83iwobtHdat
tlamdaV
uorescent tests described below were carried out blind by ateast two observers.
low Cytometry Analysisperm population was defined after passing samples throughsorter and separating the different populations obtained inscatterplot of complexity versus size (Fig. 1A). These
opulations were analyzed and classified as sperm popula-ion, small cells/cellular debris population, and large cellopulation.
etection of Membrane PS Exposure and Membranentegrity Using the Annexin V Assayhe detection of PS externalization was performed usingnnexin V conjugates (Molecular Probes, Eugene, OR). Se-en samples containing 5 � 106 spermatozoa/mL were firstashed and centrifuged (800 � g for 5 minutes) withEPES buffer (10 mM HEPES, 140 mM NaCl, 2.5 mMaCl2, pH � 7.4). After resuspension in HEPES buffer, 5L of allophycocyanin–annexin V and 0.1 �L from an 0.005M stock solution of the impermeant DNA dye Greenucleic Acid Stain (Sytox; Molecular Probes) were added
or each 100 �L of cellular suspension. Sperm was incubatedn this solution for 15 minutes at room temperature, washedgain, and centrifuged (800 � g for 5 minutes). Both posi-ive (induction of apoptosis with H2O2) and negativeHEPES buffer without Ca2�) controls were performed.inally, 500 �L of HEPES buffer was added, and the sam-les were immediately analyzed by flow cytometry using aACSCalibur flow cytometer (Becton Dickinson, Franklinakes, NJ). The settings included a 488- and 635-nm exci-
ation with a 530/30-nm bandpass filter for fluorescein iso-
TABLE 1Total amount of samples analyzed per groupand assay
Groups
Assay N A P2 OAT Total
Annexin V 22 16 19 9 66TUNEL 24 16 13 9 62SUTI 39 25 33 16 113SUTI � M540 14 8 11 4 37Total number of
samplesa150
a The total number of samples include 113 samplesused for annexin V, TUNEL, and/or SUTI assays(most of the samples were used in all three assays,however this was not always possible) plus 37 sam-ples used only in SUTI � M540.
Varum. Assays to monitor human sperm quality. Fertil Steril 2007.
hiocyanate conjugate (FITC) detection (Sytox) and a 661/ C
574 Varum et al. Assays to monitor human sperm quality
6-nm bandpass filter for allophycocyanin (annexin V)etection.
At least 10,000 cells in each sample were collected, andhe percentages of the following were calculated from theistogram using the Paint-A-Gate and CELL Quest softwareBecton Dickinson): intact sperm without any staining (nouorescence, An�;S�) � viable sperm; intact sperm withxternalized PS that stained only with allophycocyanin–nnexin V (red, An�;S�) � early apoptosis; damagedperm with externalized PS that stained both with allophy-ocyanin–annexin V and Sytox (red and green, An�;S�) �ate apoptosis; and damaged sperm without externalized PShat stained only with Sytox (green, An�;S�) � nonviableperm. Results of the annexin V assay on our samples werelso analyzed by fluorescence microscopy, in this case usinghycoerythrin–annexin V (Molecular Probes) and an Axio-lan 2 Imaging fluorescence microscope (Carl Zeiss, Göttin-en, Germany) equipped with a triple bandpass filter. Thessay was coupled with both Sytox and the membrane-ermeable DNA dye Hoechst 33342 (Molecular Probes),hich allows the detection of viable cells. At least 200 sperm
ells were assessed per slide in four fields by at least twoifferent observers. The interobserver and intraobserver vari-bility was �5%.
NA Fragmentation Monitored Using the TUNEL Assayo monitor DNA fragmentation via the TUNEL assay, wesed the APO-BrdU TUNEL assay Kit (Molecular Probes),nd the procedure was in accordance with the manufac-urer’s instructions. Briefly, after sperm fixation with 2%ormaldehyde in phosphate-buffered saline (PBS; pH � 7.2)or 60 minutes, and permeabilization in PBS with 1% Tritonor 30 minutes, the samples were washed with the kit wash-ng buffer. They were then incubated into a DNA labeling-olution (10 �L of reaction buffer, 0.75 �L of TdT enzyme,.0 �L of BrdUTP, and 31.25 �L of H2O) for 60 minutes at7°C. The cell suspension was then centrifuged and washedn 300 �L of the rinse buffer. After washing, the cell pelletsere resuspended in 100 �L of the antibody solution (1:20f Alexa Fluor 488 anti-BrdU antibody diluted in rinseuffer) and incubated for 40 minutes in the dark at roomemperature. Both positive (induction of apoptosis with
2O2) and negative (just secondary antibody–488 anti-Br-UTP) controls were performed. The stained cells werenalyzed by flow cytometry and fluorescence microscopy onhe day of processing.
Percentages of TUNEL-positive cells were obtained usinghe FACSCalibur cytometer at a 488-nm wavelength. Ateast 10,000 cells were analyzed per sample, as describedbove. In order to analyze the samples by fluorescenceicroscopy, the stained cells were counterstained with 4,6-
iamino-2-phenylindole (DAPI) (Molecular Probes) beforenalysis, placed on coverslips, which were mounted inectaShield mounting medium (Vector Labs, Burlingame,
A), and sealed with nail polish.Vol. 87, No. 3, March 2007
F
FIGURE 1
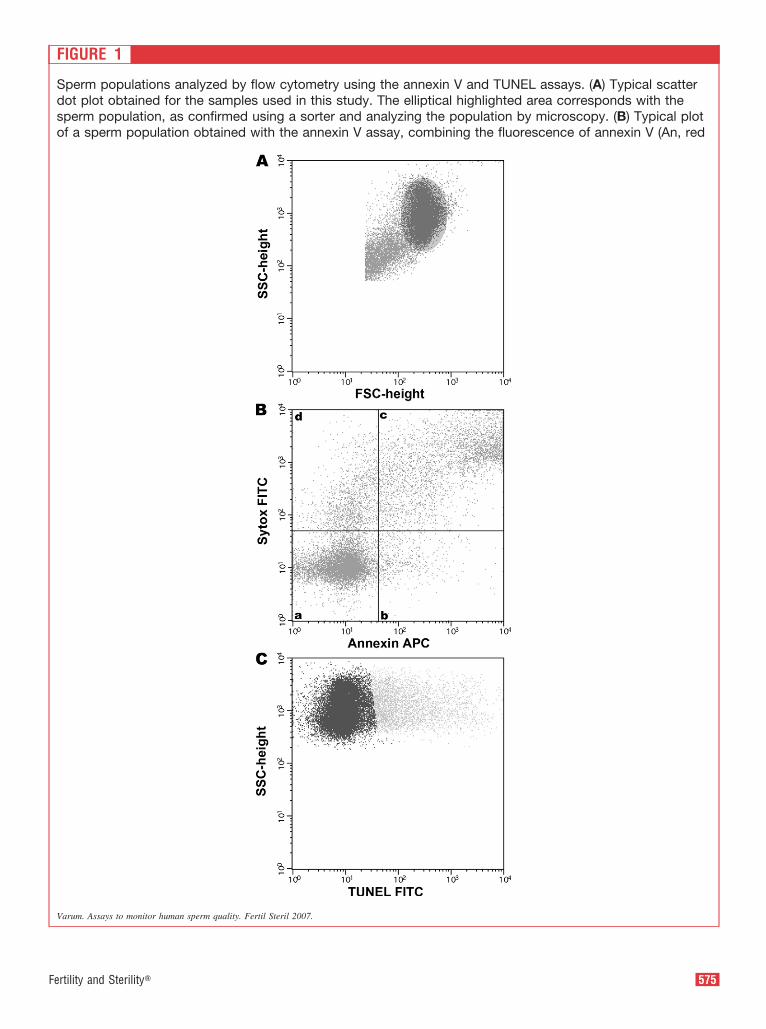
Sperm populations analyzed by flow cytometry using the annexin V and TUNEL assays. (A) Typical scatterdot plot obtained for the samples used in this study. The elliptical highlighted area corresponds with thesperm population, as confirmed using a sorter and analyzing the population by microscopy. (B) Typical plotof a sperm population obtained with the annexin V assay, combining the fluorescence of annexin V (An, red
Varum. Assays to monitor human sperm quality. Fertil Steril 2007.
575ertility and Sterility�
STtc2fslts(biwc
aS3PTa(wNp
FSflaapGaStusfi�ws
UFtatpsdnb�
MLiHuPcocumn
5p(s
STvpcflmweac
).
perm–Ubiquitin Tag Immunoassayhe sperm– ubiquitin tag immunoassay (SUTI) was essen-
ially carried out as originally defined (11, 13). Briefly, theell suspension (5 � 106 spermatozoa/mL) was fixed with% formaldehyde in PBS for 60 minutes and then centri-uged (800 � g for 5 minutes). No permeabilization of theperm membrane was performed. Using the fluorescentectin Pisum sativum agglutinin (PSA)-FITC, which bindso exposed acrosomal contents, we were able to show thatperm membranes are mostly intact after this treatmentnot shown). Samples were blocked in PBS with 2 mg/mLovine serum albumin (BSA) and 100 mM glycine (block-ng solution). The same procedure was also carried outith sperm previously attached to coverslips for fluores-
ence microscopy analysis.
After fixation, samples were incubated with anti-ubiquitinntibody (clone KM 691 mouse IgM; Kamiya Biomedical,eattle, WA), diluted 1:400 in blocking solution, at 37°C for0 minutes; centrifuged (800 � g for 5 minutes); washed inBS with 0.1% Triton for 30 minutes, and centrifuged again.hey were then incubated with the appropriate secondaryntibody (anti-IgM 488, Molecular Probes) diluted 1:20037°C, 20 minutes). Finally, samples were centrifuged,ashed, and resuspended in 500 �L of blocking solution.egative controls were prepared for each experimental sam-le by omitting the primary antibody.
Samples were analyzed on the day of processing using aACSCalibur flow cytometer and a fluorescence microscope.UTI mean values and percentages and histograms of relativeuorescence were obtained using the FACSCalibur cytometert 488-nm wavelength. In each sample, 10,000 cells werenalyzed and the sperm population, ubiquitination means, andercentages were analyzed using CELL Quest and Paint-A-ate software. A similar protocol was performed in order to
nalyse the data by fluorescence microscopy. In this case,UTI-treated coverslips were placed on slides, and DAPI coun-
erstaining was included to determine the percentage of ubiq-itin-positive cells in each sample. For each sample, we as-essed at least 200 sperm cells per slide in at least four differentelds. Both interobserver and intraobserver variability were5%. It is not known whether the anti-ubiquitin antibody,hich was raised against ubiquitin monomers, has distinct
FIGURE 1 CONTINUED
channel) and Sytox (S, green channel). The quadrantearly apoptosis (An�;S�), (c) sperm in late apoptosisTypical plot of a sperm population obtained with the(TUNEL�), the lighter dots represent cells staining inthe percentages of different cell populations calculatusing fluorescence microscopy on the same samplesside scatter (relative granularity or internal complexity
pecificities for mono- or polyubiquitination. l
576 Varum et al. Assays to monitor human sperm quality
biquitin–Annexin V Assayor dual ubiquitin–annexin V staining, we first carried out
he annexin V protocol, followed by formaldehyde fixationnd immunostaining for ubiquitin, including the DAPI coun-erstain. All procedures were as described above. All sam-les were analyzed immediately with a fluorescence micro-cope. We analyzed 200 sperm cells per coverslip toetermine percentages of positive cells for surface ubiquiti-ation, positive cells for annexin V, and positive cells foroth. The interobserver and intraobserver variability were5%.
erocyanine 540 Stainingive sperm in suspension (5 � 106 spermatozoa/mL) were
ncubated at 37°C for 15 minutes at room temperature inEPES buffer containing 27 �M Merocyanine 540 (Molec-lar Probes). After incubation, the sample was washed withBS 0.1% Triton X-100 and examined by fluorescence mi-roscopy. Due to quick photobleaching of the dye, it seemedften useful to omit the washing step and fix the cells. In thisase, samples were fixed in 2% formaldehyde, processed forbiquitin immunostaining, and observed under fluorescenceicroscopy, as described above, to evaluate the presence of
on–DNA-containing ubiquitin bodies.
It should be noted that, in the current study, Merocyanine40 was not used to assess sperm function, namely as aossible reporter for changes related to sperm capacitation15), but only to detect the presence of non–DNA-containingemen bodies, as discussed in previous studies (14),
tatistical Analysishe criterion of data normality was evaluated. As all theariables had a normal distribution, parametric tests wereerformed. Comparisons between classes of patients werearried out by one-way ANOVA for apoptotic levels, DNAragmentation, and ubiquitination, both for percentages ofabeled cells (fluorescence microscopy) and fluorescenceeans (flow cytometry). Statistical relevance was consideredhen P�.05. We also calculated Pearson’s correlation co-
fficients (r) (P�.05) to determine the correlation betweenpoptotic levels, DNA fragmentation, ubiquitination fluores-ence means (flow cytometry), percentages of ubiquitin-
resent (a) viable sperm (An�;S�), (b) sperm in�;S�), and (d) nonviable sperm (An�;S�). (C)EL assay. The dark dots represent unlabeled cellsgreen channel (TUNEL�). The accuracy regardingy flow cytometry with both assays was confirmede text). FSC, forward scatter (relative size); SSC,
s rep(An
TUNthe
ed b(se
abeled cells (fluorescence microscopy), and seminal param-
Vol. 87, No. 3, March 2007
eS
RAS((vgaeoszmtda
muBc
dspslc
af
F
ters. All tests were carried out using Prism 4.0 (Graph Padoftware, San Diego, CA).
ESULTSpoptotic Markers and Semen Qualityamples were divided into four groups: normozoospermicN), asthenozoospermic (A), oligoasthenoteratozoospermicOAT), and samples that presented two parameters withalues lower than those indicated by the World Health Or-anization (P2). These populations formed statistically sep-rate entities for semen parameters (P�.0001), and differ-nces between them were as expected (e.g., N and A differednly in motility), except for samples with two abnormaleminal parameters, where subpopulations (i.e., oligoterato-oospermic, asthenoteratozoospermic, oligoasthenozoosper-ic) could not be distinguished statistically, thus prompting
he creation of the P2 population. The means and standardeviation (SD) for the seminal parameters of samples usedre presented in Table 2.
To assess PS exposure on the outer leaflet of the plasmaembrane (plus cell integrity) and DNA fragmentation, we
sed the annexin V and the TUNEL assays, respectively.oth assays were analyzed by flow cytometry and fluores-ence microscopy.
Figure 1A represents a typical light-scatter flow cytometryiagram, and the tightly focused cluster highlighted repre-ents the sperm population typical of our samples. Theopulation was defined after passing samples through aorter and analyzing the multiple populations obtained. Theower left and the upper right corners represent small cells/ellular debris and large cells, respectively.
Figure 1B shows the typical flow cytometry dot plot fornnexin V and Sytox staining found in all samples in which
TABLE 2Seminal parameters, apoptotic levels (annexin V(SUTI assay) found in sperm samples included in
N
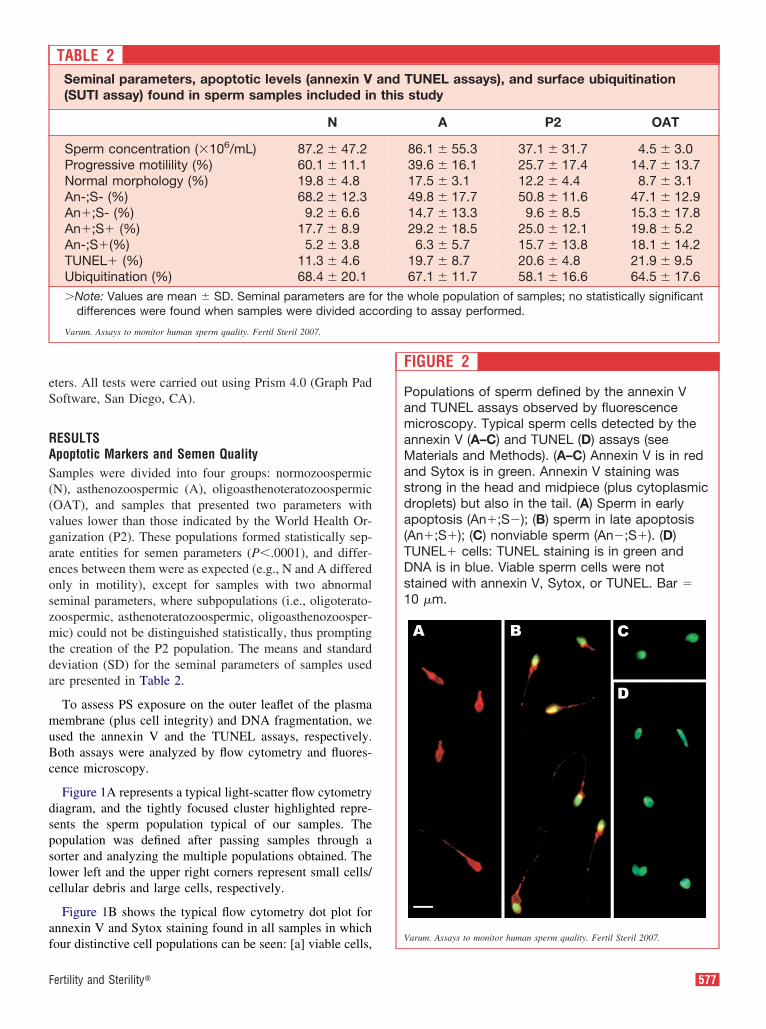
Sperm concentration (�106/mL) 87.2 � 47.2Progressive motilility (%) 60.1 � 11.1Normal morphology (%) 19.8 � 4.8An-;S- (%) 68.2 � 12.3An�;S- (%) 9.2 � 6.6An�;S� (%) 17.7 � 8.9An-;S�(%) 5.2 � 3.8TUNEL� (%) 11.3 � 4.6Ubiquitination (%) 68.4 � 20.1�Note: Values are mean � SD. Seminal parameters are fo
differences were found when samples were divided acc
Varum. Assays to monitor human sperm quality. Fertil Steril 2007.
our distinctive cell populations can be seen: [a] viable cells,
ertility and Sterility�
FIGURE 2
Populations of sperm defined by the annexin Vand TUNEL assays observed by fluorescencemicroscopy. Typical sperm cells detected by theannexin V (A–C) and TUNEL (D) assays (seeMaterials and Methods). (A–C) Annexin V is in redand Sytox is in green. Annexin V staining wasstrong in the head and midpiece (plus cytoplasmicdroplets) but also in the tail. (A) Sperm in earlyapoptosis (An�;S�); (B) sperm in late apoptosis(An�;S�); (C) nonviable sperm (An�;S�). (D)TUNEL� cells: TUNEL staining is in green andDNA is in blue. Viable sperm cells were notstained with annexin V, Sytox, or TUNEL. Bar �10 �m.
and TUNEL assays), and surface ubiquitinationthis study
A P2 OAT
86.1 � 55.3 37.1 � 31.7 4.5 � 3.039.6 � 16.1 25.7 � 17.4 14.7 � 13.717.5 � 3.1 12.2 � 4.4 8.7 � 3.149.8 � 17.7 50.8 � 11.6 47.1 � 12.914.7 � 13.3 9.6 � 8.5 15.3 � 17.829.2 � 18.5 25.0 � 12.1 19.8 � 5.26.3 � 5.7 15.7 � 13.8 18.1 � 14.2
19.7 � 8.7 20.6 � 4.8 21.9 � 9.567.1 � 11.7 58.1 � 16.6 64.5 � 17.6
r the whole population of samples; no statistically significantording to assay performed.
Varum. Assays to monitor human sperm quality. Fertil Steril 2007.
577

wflfaaSdslwTro
cnodd
cam(
ith negative staining for both annexin V and Sytox (nouorescence, An�;S�); [b] early apoptotic cells, positiveor annexin V but negative for Sytox (red, An�;S-); [c] latepoptotic cells, positive for both annexin V and Sytox (rednd green, An�;S�); [d] nonviable cells, positive only forytox (green, An�;S�). In Figure 1C, the typical cytometryot plot for the TUNEL assay found in this study is pre-ented, and it is possible to distinguish two different popu-ations: [i] the left one (dark spots) corresponds with spermith no DNA fragmentation (no green fluorescence,UNEL�), [ii] and the one on the right (lighter spots)
epresents spermatozoa with DNA fragmentation (green flu-
FIGURE 3
The annexin V assay carried out on samples from measthenozoospermic (A), oligoasthenoteratozoospermiparameters (P2) were analyzed by flow cytometry usifour sperm populations were defined by the assay (searly apoptosis (An�;S�); (C) sperm in late apoptosiindicate differences relative to N samples in each casstatistically significant comparisons.
Varum. Assays to monitor human sperm quality. Fertil Steril 2007.
rescence, TUNEL�). i
578 Varum et al. Assays to monitor human sperm quality
To ensure that the percentages of cells calculated by flowytometry accurately characterized each sample, a simulta-eous evaluation using fluorescence microscopy was carriedut on the same populations (Fig. 2). The results of theseistinct quantifications for both assays were statistically in-istinguishable (data not shown).
The annexin V assay allowed the quantification of per-entages of viable cells and cells with distinct degrees ofpoptosis in the different groups (Table 2; Fig. 3). Theeans of viable cell populations were significantly different
P�.0001) (Fig. 3A), and Tukey’s multiple comparison test
ith varying etiologies. Normozoospermic (N),AT), and samples with two abnormal seminalhe annexin V assay, and the percentages of theig. 1). (A) Viable sperm (An�;S�); (B) sperm inn�;S�); and (D) nonviable sperm (An�;S�). SignsP�.05; **P�.01; ***P�.001). See text for further
n wc (Ong tee Fs (Ae (*
ndicated that significant differences occur between N/A
Vol. 87, No. 3, March 2007

(agos(OasP
Pv(�(l(ilc
gflso
DteTta(ctlPpPmPps((
STflatet
pssPrcgodtr
vwpcpna((oa
ltflpdoWlps
cunoMi4fls8nq(
waPsn
F
P�.001), N/P2 (P�.01), and N/OAT (P�.01), but notmong A, P2, and OAT. No differences were found amongroups relatively to early apoptosis (Fig. 3B; P�.05). On thether hand, when late apoptosis was considered, the onlyignificant difference found was between N and A samplesFig. 3C; P�.05). Interestingly, N and A samples (as well asAT and P2) could not be distinguished in terms of nonvi-
ble sperm (Fig. 3D). However, N and A samples differedignificantly from both OAT and P2 populations (P�.01 and�.05, respectively).
When comparing annexin V populations using two-tailedearson’s correlation test, we found that the percentage ofiable cells negatively correlates with early apoptosisP�.0104; r � �0.3206), with nonviable cells (P�.0405; r
�0.2588), and, most strongly, with late apoptosisP�.0001; r � �0.7259). The only other significant corre-ation was between early apoptosis and nonviable cellsP�.0008; r � �0.4107). Thus, early apoptosis seemed tonversely vary with lack of cell viability but was not corre-ated with late apoptosis (P�.2817), which, in turn, did notorrelate with nonviable cells (P�.804).
Percentages of DNA fragmentation between the differentroups were calculated using the TUNEL assay coupled toow cytometry (Table 2). In this case, the only statisticallyignificant differences found were between N and all thether groups (N/A P�.01; N/P2 P�.001; N/OAT P�.01).
To assess the possible impact of sperm apoptosis andNA fragmentation on sperm quality, we further analyzed
he correlations between these indexes and seminal param-ters. When comparing results from the annexin V andUNEL assays carried out in the same samples, we observed
hat the only significant (and positive) correlation (P�.0152nd r � 0.4192) was found between DNA fragmentationTUNEL�) and lack of cell viability (An�;S�). The per-entage of TUNEL� spermatozoa and of nonviable sperma-ozoa (An�;S�) were negatively and significantly corre-ated with sperm concentration (P�.0180 and r � �0.3096;�.0258 and r � �0.2765, respectively); percentage ofrogressively motile cells (P�.0001 and r � �0.5190;�.0301 and r � �0.2713, respectively), and percentage oforphologically normal cells (P�.0020 and r � �0.3973;�.0034 and r � �0.3634, respectively). In contrast, theercentage of viable cells (An�;S�) was positively andignificantly correlated with both progressive motilityP�.0097 and r � 0.3211) and normal morphologyP�.0080 and r � 0.3313).
urface Ubiquitination, Semen Parameters, and Apoptosishe SUTI assay was carried out by flow cytometry anduorescence microscopy. In flow cytometry experiments, wenalyzed both the percentage of ubiquitinated entities andhe intensity of fluorescence. In the former case, no differ-nces were found between populations (see Fig. 4B), but in
he latter case, samples with at least one abnormal WHO wertility and Sterility�
arameter (concentration, motility, morphology) yielded atronger signal when compared with normal samples, ashown by the respective fluorescence means (Fig. 4A;�.0002). This is in agreement with what has been recently
eported (11), although in our case we used direct fluores-ence means and did not find any need to divide our histo-rams into quartiles, which could have added another layerf data constriction. On the other hand, similar to what wasescribed for the TUNEL assay, no differences were de-ected between the different populations with abnormal pa-ameters (A, P2, OAT, not shown).
When correlating ubiquitin fluorescence means with indi-idual sperm parameters, significant inverse correlationsere found with morphology (P�.0028; r � �0.4962),rogressive motility (P�.0094; r � �0.4390), and spermoncentration (P�.0472; r � �0.3427). Nevertheless, whenercentage of ubiquitinated entities was taken into account,o significant correlations between surface ubiquitinationnd sperm parameters were encountered for concentrationP�.2935 and r � 0.1391; Fig. 4C), progressive motilityP�.5693 and r � 0.07559; Fig. 4D), and normal morphol-gy (P�.5529 and r � 0.07882; Fig. 4E), and P values werelways quite high.
This contradicts recent findings (14) and may suggest aack of reproducibility for this relatively new assay. In ordero confirm these results, we used the SUTI assay coupled touorescence microscopy (Fig. 4B and F). We found severalatterns of labeling, with special incidence on the tail, andetermined that both normal and abnormal spermatozoa mayr may not be ubiquitinated in any given sample (Fig. 4F).hen surface ubiquitination was quantified by percentage of
abeled sperm cells, no differences were found betweenopulations (P�.2130), confirming our flow cytometry re-ults (Table 2; Fig. 4B).
Although our flow cytometry and fluorescence micros-opy results were in agreement in terms of percentage ofbiquitinated entities, and we know that in the former tech-ique only DNA-containing sperm cells are counted by thebserver, we decided to test our samples for the presence of540-positive bodies. We found that these structures were
ndeed abundant in OAT samples as described (14) (Fig.H), but not in all cases where a high ubiquitin meanuorescence was detected by flow cytometry (e.g., in Aamples). Furthermore, in 37 samples tested for M540 (14 N;A; 11 P2; 4 OAT), only in two of the OATs did we find
on–DNA-containing structures that were significantly ubi-uitinated and that were similar to what has been reportedFig. 4H and I).
To investigate further the nature of surface ubiquitination,e decided to monitor ubiquitin staining together with the
nnexin V assay to determine if ubiquination was related toS exposure (annexin V). Both assays were tested in theame samples to make sure that the percentage of ubiquiti-ated cells and annexin V–positive cells did not change
hen the techniques were carried out separately or simulta-579
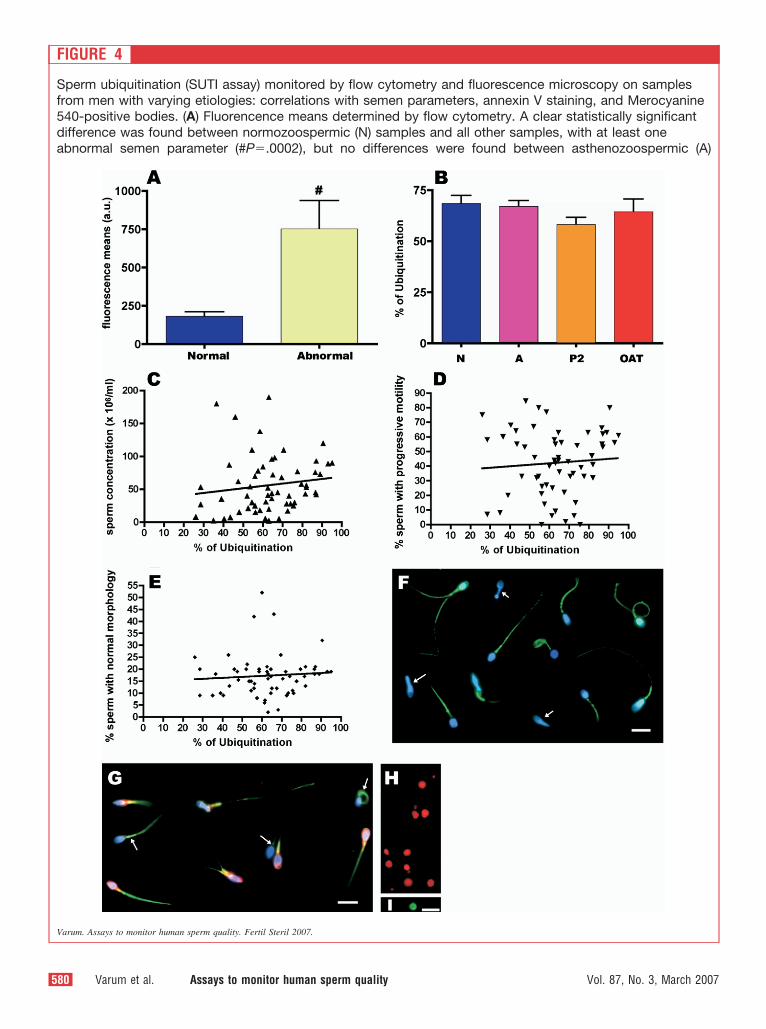
FIGURE 4
Sperm ubiquitination (SUTI assay) monitored by flow cytometry and fluorescence microscopy on samplesfrom men with varying etiologies: correlations with semen parameters, annexin V staining, and Merocyanine540-positive bodies. (A) Fluorencence means determined by flow cytometry. A clear statistically significantdifference was found between normozoospermic (N) samples and all other samples, with at least oneabnormal semen parameter (#P�.0002), but no differences were found between asthenozoospermic (A)
Varum. Assays to monitor human sperm quality. Fertil Steril 2007.
580 Varum et al. Assays to monitor human sperm quality Vol. 87, No. 3, March 2007
ncsmsaa(t
DOspdc
cpaabwo
Dafaeehccb
swsphgltOcagn
n ot
F
eously (not shown). Although some obviously defectiveells were not ubiquitinated (Fig. 4F), all annexin V–positiveperm cells were indeed ubiquitinated under fluorescenceicroscopy (Fig. 4G). However, we found no statistically
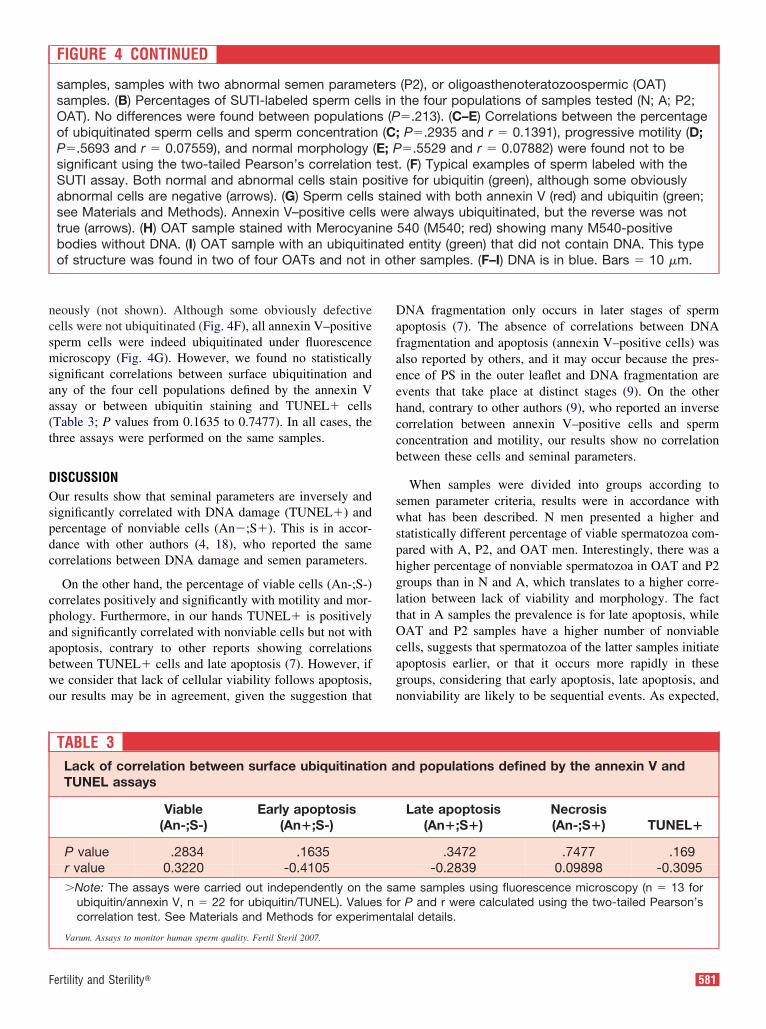
ignificant correlations between surface ubiquitination andny of the four cell populations defined by the annexin Vssay or between ubiquitin staining and TUNEL� cellsTable 3; P values from 0.1635 to 0.7477). In all cases, thehree assays were performed on the same samples.
ISCUSSIONur results show that seminal parameters are inversely and
ignificantly correlated with DNA damage (TUNEL�) andercentage of nonviable cells (An�;S�). This is in accor-ance with other authors (4, 18), who reported the sameorrelations between DNA damage and semen parameters.
On the other hand, the percentage of viable cells (An-;S-)orrelates positively and significantly with motility and mor-hology. Furthermore, in our hands TUNEL� is positivelynd significantly correlated with nonviable cells but not withpoptosis, contrary to other reports showing correlationsetween TUNEL� cells and late apoptosis (7). However, ife consider that lack of cellular viability follows apoptosis,ur results may be in agreement, given the suggestion that
FIGURE 4 CONTINUED
samples, samples with two abnormal semen paramesamples. (B) Percentages of SUTI-labeled sperm cellOAT). No differences were found between populationof ubiquitinated sperm cells and sperm concentrationP�.5693 and r � 0.07559), and normal morphologysignificant using the two-tailed Pearson’s correlationSUTI assay. Both normal and abnormal cells stain poabnormal cells are negative (arrows). (G) Sperm cellssee Materials and Methods). Annexin V–positive cellstrue (arrows). (H) OAT sample stained with Merocyanbodies without DNA. (I) OAT sample with an ubiquitinof structure was found in two of four OATs and not i
TABLE 3Lack of correlation between surface ubiquitinatioTUNEL assays
Viable(An-;S-)
Early apoptosis(An�;S-)
P value .2834 .1635r value 0.3220 -0.4105�Note: The assays were carried out independently on th
ubiquitin/annexin V, n � 22 for ubiquitin/TUNEL). Valuecorrelation test. See Materials and Methods for experim
Varum. Assays to monitor human sperm quality. Fertil Steril 2007.
ertility and Sterility�
NA fragmentation only occurs in later stages of spermpoptosis (7). The absence of correlations between DNAragmentation and apoptosis (annexin V–positive cells) waslso reported by others, and it may occur because the pres-nce of PS in the outer leaflet and DNA fragmentation arevents that take place at distinct stages (9). On the otherand, contrary to other authors (9), who reported an inverseorrelation between annexin V–positive cells and spermoncentration and motility, our results show no correlationetween these cells and seminal parameters.
When samples were divided into groups according toemen parameter criteria, results were in accordance withhat has been described. N men presented a higher and
tatistically different percentage of viable spermatozoa com-ared with A, P2, and OAT men. Interestingly, there was aigher percentage of nonviable spermatozoa in OAT and P2roups than in N and A, which translates to a higher corre-ation between lack of viability and morphology. The facthat in A samples the prevalence is for late apoptosis, whileAT and P2 samples have a higher number of nonviable
ells, suggests that spermatozoa of the latter samples initiatepoptosis earlier, or that it occurs more rapidly in theseroups, considering that early apoptosis, late apoptosis, andonviability are likely to be sequential events. As expected,
(P2), or oligoasthenoteratozoospermic (OAT)the four populations of samples tested (N; A; P2;�.213). (C–E) Correlations between the percentageP�.2935 and r � 0.1391), progressive motility (D;�.5529 and r � 0.07882) were found not to be. (F) Typical examples of sperm labeled with thee for ubiquitin (green), although some obviouslyned with both annexin V (red) and ubiquitin (green;re always ubiquitinated, but the reverse was not540 (M540; red) showing many M540-positived entity (green) that did not contain DNA. This typeher samples. (F–I) DNA is in blue. Bars � 10 �m.
nd populations defined by the annexin V and
Late apoptosis(An�;S�)
Necrosis(An-;S�) TUNEL�
.3472 .7477 .169-0.2839 0.09898 -0.3095
me samples using fluorescence microscopy (n � 13 forr P and r were calculated using the two-tailed Pearson’slal details.
terss ins (P(C;
(E; Ptestsitivstaiwe
ineate
n a
e sas foenta
581
wb
dtumagrruedrswupa
escqciimosatvsopucshm
atiatawwt(w
teslsu
apohstibtscs
AtFahSam
R
1
e also found statistically significant inverse correlationsetween DNA fragmentation and semen parameters (19).
Results with the SUTI assay were less clear becauseifferent conclusions can be reached, depending on whetherhe percentage of ubiquitinated cells or the means of ubiq-itin fluorescence are considered. Using SUTI fluorescenceeans determined by flow cytometry, we could clearly sep-
rate N samples from all the other groups (but not distin-uish between samples with different abnormal sperm pa-ameters), which is in accordance with what has beenecently described (11, 14). However, when percentages ofbiquitinated entities were considered, both by flow cytom-try and fluorescence microscopy, no statistically significantifference between groups was found. Furthermore, no cor-elation between percentage of surface ubiquitination andeminal parameters was evident, which is not in agreementith the recently reported positive correlation between ubiq-itination and semen parameters (especially normal mor-hology) and the suggestion that surface ubiquitination mayctually have a positive influence in sperm function (14).
Two possible explanations can be considered in order toxplain the discrepancy regarding correlations betweenperm parameters and mean ubiquitin fluorescence (flowytometry) and lack of correlation with percentage of ubi-uitinated cells (flow cytometry and fluorescence micros-opy): [a] the fluorescence of labeled sperm cells is morentense in samples with abnormal WHO parameters and thuss picked up by the flow cytometer in terms of fluorescenceeans, but it is not translated into differences in percentages
f labeled cells; [b] something else in the semen (but notperm) is being ubiquitinated, thus causing samples withbnormal WHO parameters to show a higher fluorescence inhe flow cytometer. Although intensity of staining of indi-idual cells did not seem to be very different betweenamples, the first hypothesis cannot be discounted. In termsf the second possibility, it was proposed (14) that M540-ositive semen bodies (Fig. 4H) may account for the highbiquitination rate monitored with flow cytometry, espe-ially in severe OAT samples. However, in our hands andamples, M540-positive bodies did not seem to explainigher ubiquitin fluorescence means in samples with abnor-al WHO parameters, certainly not in all cases.
Furthermore, no significant correlation between ubiquitinnd apoptotic markers (annexin V and TUNEL) was de-ected, contrary to what was found in other species, such asn bull sperm, where a high correlation between TUNEL�nd ubiquitinated spermatozoa was reported (20). Evenhough this result suggests that ubiquitination and apoptosisre independent processes, all cells labeled with annexin Vere ubiquitinated when dual ubiquitin–annexin V stainingas carried out. Finally, and although it has been proposed
hat ubiquitin is a universal marker for sperm abnormalities13), we found many clearly abnormal spermatozoa that
ere not ubiquitinated (Fig. 4F).582 Varum et al. Assays to monitor human sperm quality
Considering these results, and although differences be-ween patient populations cannot be discounted and mayxplain some of the reported discrepancies, we suggest thaturface sperm ubiquitination is not determined by morpho-ogic abnormalities alone and that whatever its biologicalignificance, there must be other factors that trigger surfacebiquitination.
In summary, viable cells, nonviable cells, DNA packaging,nd ubiquitin fluorescence intensity means (but not ubiquitin-ositive cell number) correlate with seminal parameters. Nonef the apoptotic markers correlate with ubiquitin labeling inuman sperm. The fact that other factors (not only morphology)eem to determine surface ubiquitination in sperm, as well ashe existence of major variations between published results,ndicates possible issues in assay reproducibility. In conclusion,iological markers, such as those related to sperm integrity andhe state of sperm DNA, can potentially be used to separateperm populations with distinct fertilizing potentials. This isertainly not yet the case for both annexin V surface binding orurface ubiquitination.
cknowledgments: S.V., C.B., A.P.S., and C.G.S. contributed equally tohis study. We thank Dr. Ana Barbosa, Dr. Raquel Brito, Conceição Dias,átima Veríssimo (University Hospitals of Coimbra), Alexandra Amaral,nd Joana Gonçalves (Center for Neuroscience and Cell Biology) for manyelpful discussions and technical assistance, and Prof. Agostinho Almeidaantos (University Hospitals of Coimbra) for continuous encouragementnd support. We also thank Sandra Gamboa, Paula C. Mota, and otherembers of the lab for many fruitful discussions.
EFERENCES1. Ozanon C, Chouteau J, Sutovsky P. Clinical adaptation of the sperm
ubuquitin tag immunoassay (SUTI): relationship of sperm ubiquityla-tion with sperm quality in gradient-purified semen samples from 93men from a general infertility clinic population. Hum Reprod 2005;20:2271–8.
2. World Health Organization. WHO Laboratory manual for the exami-nation of human semen and sperm-cervical mucus interaction. 4th ed.Cambridge: Cambridge University Press, 1999.
3. Evenson DP, Larson KJ, Jost LK. Sperm chromatin structure assay: itsclinical use for detecting sperm DNA fragmentation in male infertilityand comparisons with other techniques. J Androl 2002;23:25–43.
4. Gandini L, Lombardo F, Paoli D, Caponecchia L, Familiari G, Ver-lengia C, et al. Study of apoptotic DNA fragmentation in humanspermatozoa. Hum Reprod 2000;15:830–9.
5. Sakkas D, Mariethoz E, Manicardi G, Bizzaro D, Bianchi P, Bianchi U.Origin of DNA damage in ejaculated human spermatozoa. Rev Reprod1999;4:31–7.
6. Sinha Hikim AP, Swerdloff RS. Hormonal and genetic control of germcell apoptosis in the testis. Rev Reprod 1999;4:38–47.
7. Shen HM, Dai J, Chia SE, Lim A, Ong CN. Detection of apoptoticalterations in sperm in subfertile patients and their correlations withsperm quality. Hum Reprod 2002;17:1266–73.
8. Barroso G, Morshedi M, Oehninger S. Analysis of DNA fragmentation,plasma membrane translocation of phosphatidylserine and oxidativestress in human spermatozoa. Hum Reprod 2000;15:1338–44.
9. Oosterhuis GJE, Mulder AB, Kalsbeek-Batenburg E, Lambalk CB,Schoemaker J, Vermes I. Measuring apoptosis in human spermatozoa:a biological assay for semen quality? Fertil Steril 2000;74:245–50.
0. Muratori M, Piomboni P, Baldi E, Filimberti E, Pecchioli P, Moretti E.Functional and ultrastructural features of DNA-fragmented human
sperm. J Androl 2000;21:903–12.Vol. 87, No. 3, March 2007

1
1
1
1
1
1
1
1
1
2
F
1. Sutovsky P, Hausser R, Sutovsky M. Increased levels of sperm ubiq-uitin correlate with semen quality in men from an andrology laboratoryclinic population. Hum Reprod 2004;19:628–38.
2. Hochstrasser M. Ubiquitin – dependent protein degradation. Annu RevGenet 1996;30:405–39.
3. Sutovsky P, Terada Y, Schatten G. Ubiquitin-based sperm assay for thediagnosis of male factor infertility. Hum Reprod 2001;16:250–8.
4. Muratori M, Marchiani S, Forti G, Baldi E. Sperm ubiquitinationpositively correlates to normal morphology in human semen. HumReprod 2005;20:1035–43.
5. Muratori M, Porazzi I, Luconi M, Marchiani S, Forti G, Baldi E.Annexin V binding and merocyanine staining fail to detect humansperm capacitation. J Androl 2004;24:797–810.
6. Mota PC, Ramalho-Santos J. Comparison between different markers
for sperm quality in the cat: Diff-Quik as a simple optical technique toertility and Sterility�
assess changes in the DNA of feline epididymal sperm. Theriogenology2006;65:1360–75.
7. Kruger TF, Menkveld R, Stander FS, Lombard CJ, Van der Merwe JP,Van Zyl JA, et al.. Sperm morphologic features as a prognostic factorin in-vitro fertilization. Fertil Steril 1986;46:1118–23.
8. Irvine DS, Twigg JP, Gordon EL, Fulton N, Milne PA, Aitken RJ. DNAintegrity in human spermatozoa: relationships with semen quality. JAndrol 2000;21:33–43.
9. Huang CC, Lin DP, Tsao HM, Cheng TC, Liu CH, Lee MS. SpermDNA fragmentation negatively correlates with velocity and fertili-zation rates but might no affect pregnancy rates. Fertil Steril 2005;84:130 – 40.
0. Sutovsky P, Neuber E, Schatten G. Ubiquitin – dependent sperm qualitycontrol mechanism recognizes spermatozoa with DNA defects as revealed
by dual ubiquitin-TUNEL assay. Mol Reprod Dev 2002;61:406–13.583