characterization of epoxy resin including strain rate
TRANSCRIPT

Characterization of Epoxy Resin Including Strain RateEffects Using Digital Image Correlation System
Masoud Yekani Fard1; Yingtao Liu2; and Aditi Chattopadhyay3
Abstract: The mechanical response of epoxy resin Epon E 863 has been studied in tension, compression, and flexure. The epoxy resins havebeen tested at different strain rates ranging from 5:9 × 10�5 to 0:03 s�1. Two types of dog-bone geometries have been used in the tensiontests. Small sized cubic, prismatic, and cylindrical samples were used in compression tests. Beams with quarter deep notches or grooves weretested at their midpoints in flexural tests. Strains were measured by using a digital image correlation technique, extensometer, strain gages,and actuator. Observation of sample geometry during tension tests at constant elongation rate shows necking and crazing in Epon E 863.Cubic, prismatic, and cylindrical compression samples undergo a stress drop at yield, but only cubic samples experience strain hardeningbefore failure. Characteristic points of tensile and compressive stress strain relation and load deflection curve in flexure, such as proportionalelastic limit stress (PEL), ultimate tensile strength (UTS), compressive yield strength (CYS), and failure strain were measured and theirvariations with strain rate studied. DOI: 10.1061/(ASCE)AS.1943-5525.0000127. © 2012 American Society of Civil Engineers.
CE Database subject headings: Polymer; Tension; Compression; Bending; Material tests; Material properties; Strain rates;Measurement; Epoxy; Digital techniques.
Author keywords: Polymer; Tension; Compression; Bending; Material tests; Material properties; Strain rate; Measurement.
Introduction
Over the past several decades, significant advances have been madein understanding the constitutive stress-strain relationship of epoxyresin materials, enabling their use in a wide variety of engineeringapplications. One approach is to study the properties of individualneat resins under different kinds of loading. Polymeric materials areknown to exhibit different mechanical responses under tension andcompression (Ward and Sweeny 2004). A characteristic feature ofthe resins is their pronounced strain rate sensitivity. There is a largeamount of data in the literature related to mechanical properties ofdifferent polymers using samples with different sizes. Variousmethods of deflection and strain measurement were used in thesestudies (Littell et al. 2008; Gilat et al. 2007; Jordan et al. 2008; ShahKhan et al. 2001; Chen et al. 2001; Fiedler et al. 2001; Behzadi andJones 2005; Walley and Field 1994; Liang and Liechti 1996; G’Sellet al. 2002, G’Sell and Souahi 1997; Boyce and Aruda 1990; G’Sellet al. 2000; Buckley and Harding 2001). Littell et al. (2008) usedsmall test cylindrical specimens of Epon 862 with a length to diam-eter ratio of one for tension, compression, and shear tests at differ-ent strain rates and temperatures. Gilat et al. (2007) used smalldog-bone shaped specimens of E-862 and PR-520 with uniformthickness and reduced thickness and strain gages for tension and
shear tests. Jordan et al. (2008) investigated compressive propertiesof E-826 from low to high strain rates by using data from crossheaddisplacement. The nominal stress-strain relationship in compres-sion for low and medium strain rates using small cubes with alength to width ratio of one was investigated by Shah Khan et al.(2001). Chen et al. (2001) used an extensometer to conduct highstrain rate tension and compression tests on Epon 828/T-403 andpolymethyl methacrylate (PMMA) by using cylindrical specimenswith aspect ratios of 0.5. Fiedler et al. (2001) used strain gages tostudy yield and fracture behavior of an unreinforced epoxy resinunder tension, compression, and torsion by using dog-bone sam-ples with rectangular ross sections of 0.4 and 1 mm thicknessand small cubes with unit aspect ratios at a strain rate of667 μstr=s. All the samples in these tests failed in an unstable frac-ture mode and samples with 1 mm thickness failed prematurely. Nopostpeak behavior was captured in this study, and a maximumfracture strain of 5.8% was reported. Behzadi and Jones (2005)conducted compression tests on Araldite MY720 and AralditeMY0510 resins at various temperatures and strain rates to studythe yield behavior using modified data from crosshead displace-ments. Walley and Field (1994) studied the behavior of a largenumber of polymers at room temperature over strain rates rangingfrom 10�2 to 104 s�1 and observed that the yield stress is a functionof the logarithm of strain rate. Quantitative measure of the influenceof damage processes (crazing and cavitations) on the tensile con-stitutive equation and the kinetics of plastic instability were re-ported by G’Sell et al. (2002). A stress drop was observed atyield, and there was nearly no strain hardening in polyethylene ter-ephtalate and high-impact polystyrene small-sized parallel-pipedspecimens. Boyce and Arruda (1990) and G’Sell et al. (2000) haveshown that strain hardening of glassy polymers is interpreted inthe entropic forces, which are necessary to orient the macromolecu-lar chains connected by cross links or entanglement. Strain soften-ing at yield, followed by strain stiffening at higher strains incompression for different low and high strain rates has been re-ported by some researchers (Littell et al. 2008; Jordan et al. 2008;
1Graduate Student, Dept. of Mechanical and Aerospace Engineering,Arizona State Univ., Tempe, AZ 85287 (corresponding author). E-mail:[email protected]
2Graduate Student, Dept. of Mechanical and Aerospace Engineering,Arizona State Univ., Tempe, AZ 85287.
3Professor, Dept. of Mechanical and Aerospace Engineering, ArizonaState Univ., Tempe, AZ 85287.
Note. This manuscript was submitted on November 29, 2010; approvedon May 10, 2011; published online on May 12, 2011. Discussion periodopen until September 1, 2012; separate discussions must be submitted forindividual papers. This paper is part of the Journal of Aerospace Engi-neering, Vol. 25, No. 2, April 1, 2012. ©ASCE, ISSN 0893-1321/2012/2-308–319/$25.00.
308 / JOURNAL OF AEROSPACE ENGINEERING © ASCE / APRIL 2012
J. Aerosp. Eng., 2012, 25(2): 308-319
Dow
nloa
ded
from
asc
elib
rary
.org
by
Ari
zona
Sta
te U
niv
on 0
7/08
/19.
Cop
yrig
ht A
SCE
. For
per
sona
l use
onl
y; a
ll ri
ghts
res
erve
d.

Fiedler et al. 2001; Behzadi and Jones 2005; G’Sell and Souahi1997; Boyce and Arruda 1990; Buckley and Harding 2001). ShahKhan et al. (2001) and Chen et al. (2001) have observed fivedistinct stages in the compressive stress-strain behavior of somepolymers: linearly elastic, nonlinearly elastic, yield-like (peak)behavior, strain softening, and nearly perfect plastic flow. Ballatoreet al. (1990) showed that the mechanical behavior of test couponschange from ductile to brittle when the size scale is increased,whereas the geometrical shape remains unchanged. Three pointbending (3PB) tests were used to study the different environmentaland aging effects on the mechanical properties of various types offiber posts (Mannocci et al. 2001). Fergusson et al. (2006) used adigital speckle photogrammetry technique to study the effect ofdefects on flexural behavior of sandwich composite structures.
In literature, very few studies reported tension, compression,and flexural tests. A complete set of material properties consideringthe effect of sample geometry and size and the effect of measure-ment technique is not available. This paper describes the results oftension, compression, and flexural tests at different strain ratesranging from 5:9 × 10�5 to 0:03 s�1in the low and medium strainrate ranges. The results obtained from the strain gage, extensom-eter, cross head, and digital image correlation (DIC) techniques arepresented. True tensile and compressive stress-strain behavior of an
epoxy resin was investigated under different monotonic strain ratesat room temperature. An attempt was made to correlate the ultimatetensile strength (UTS) point, the tensile proportionality limit point(PEL), the compressive yield stress (CYS) point, and the compres-sive PEL point. The 3PB was selected as the loading technique, andthe strength and ductility of the epoxy resin under flexure wereinvestigated. In summary, the main goals of this study are (1) toevaluate the effect of geometry and size of sample on materialbehavior and the accuracy of different measurement techniques,(2) to study the postpeak behavior of polymeric material in tension,compression, and flexure, (3) to measure the fundamental materialproperties in tension and compression, (4) to study the effects ofstrain rate on mechanical properties, and (5) to obtain a relationbetween PEL state and the peak point in tension and compression.
Material and Specimens
Epoxy Resin Epon E 863 with a hardener EPI-CURE 3290 using a100/27 weight ratio was used in this study. The ASTM standardsD638 section 6.1 (2010), D695 sections 6.2 and 6.7 (2010), andD790 section 7 (2003) were considered for tensile, compressive,and flexural samples, respectively. Hobbiebrunken et al. (2007)showed that the size related matrix strength is much higher than
Fig. 1. (a) Dogbone tensile sample; (b) cube, prism, and cylinder compressive samples; (c) and (d) flexural samples
JOURNAL OF AEROSPACE ENGINEERING © ASCE / APRIL 2012 / 309
J. Aerosp. Eng., 2012, 25(2): 308-319
Dow
nloa
ded
from
asc
elib
rary
.org
by
Ari
zona
Sta
te U
niv
on 0
7/08
/19.
Cop
yrig
ht A
SCE
. For
per
sona
l use
onl
y; a
ll ri
ghts
res
erve
d.
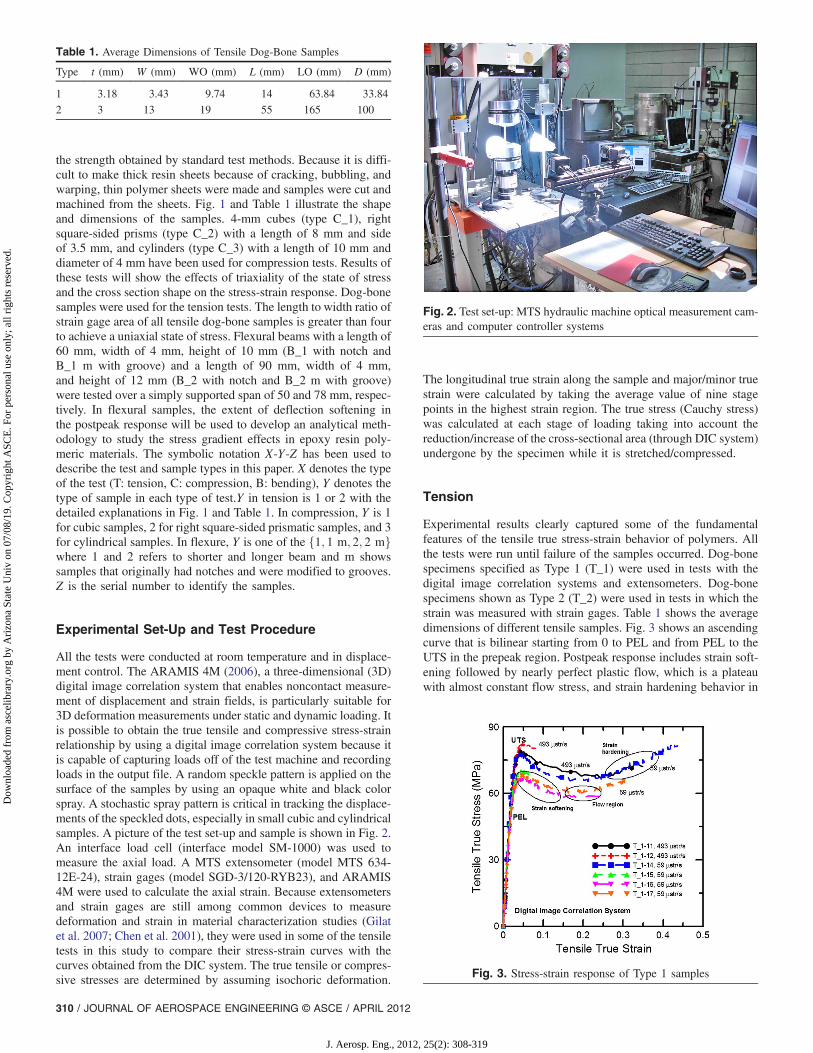
the strength obtained by standard test methods. Because it is diffi-cult to make thick resin sheets because of cracking, bubbling, andwarping, thin polymer sheets were made and samples were cut andmachined from the sheets. Fig. 1 and Table 1 illustrate the shapeand dimensions of the samples. 4-mm cubes (type C_1), rightsquare-sided prisms (type C_2) with a length of 8 mm and sideof 3.5 mm, and cylinders (type C_3) with a length of 10 mm anddiameter of 4 mm have been used for compression tests. Results ofthese tests will show the effects of triaxiality of the state of stressand the cross section shape on the stress-strain response. Dog-bonesamples were used for the tension tests. The length to width ratio ofstrain gage area of all tensile dog-bone samples is greater than fourto achieve a uniaxial state of stress. Flexural beams with a length of60 mm, width of 4 mm, height of 10 mm (B_1 with notch andB_1 m with groove) and a length of 90 mm, width of 4 mm,and height of 12 mm (B_2 with notch and B_2 m with groove)were tested over a simply supported span of 50 and 78 mm, respec-tively. In flexural samples, the extent of deflection softening inthe postpeak response will be used to develop an analytical meth-odology to study the stress gradient effects in epoxy resin poly-meric materials. The symbolic notation X-Y-Z has been used todescribe the test and sample types in this paper. X denotes the typeof the test (T: tension, C: compression, B: bending), Y denotes thetype of sample in each type of test.Y in tension is 1 or 2 with thedetailed explanations in Fig. 1 and Table 1. In compression, Y is 1for cubic samples, 2 for right square-sided prismatic samples, and 3for cylindrical samples. In flexure, Y is one of the f1; 1 m; 2; 2 mgwhere 1 and 2 refers to shorter and longer beam and m showssamples that originally had notches and were modified to grooves.Z is the serial number to identify the samples.
Experimental Set-Up and Test Procedure
All the tests were conducted at room temperature and in displace-ment control. The ARAMIS 4M (2006), a three-dimensional (3D)digital image correlation system that enables noncontact measure-ment of displacement and strain fields, is particularly suitable for3D deformation measurements under static and dynamic loading. Itis possible to obtain the true tensile and compressive stress-strainrelationship by using a digital image correlation system because itis capable of capturing loads off of the test machine and recordingloads in the output file. A random speckle pattern is applied on thesurface of the samples by using an opaque white and black colorspray. A stochastic spray pattern is critical in tracking the displace-ments of the speckled dots, especially in small cubic and cylindricalsamples. A picture of the test set-up and sample is shown in Fig. 2.An interface load cell (interface model SM-1000) was used tomeasure the axial load. A MTS extensometer (model MTS 634-12E-24), strain gages (model SGD-3/120-RYB23), and ARAMIS4M were used to calculate the axial strain. Because extensometersand strain gages are still among common devices to measuredeformation and strain in material characterization studies (Gilatet al. 2007; Chen et al. 2001), they were used in some of the tensiletests in this study to compare their stress-strain curves with thecurves obtained from the DIC system. The true tensile or compres-sive stresses are determined by assuming isochoric deformation.
The longitudinal true strain along the sample and major/minor truestrain were calculated by taking the average value of nine stagepoints in the highest strain region. The true stress (Cauchy stress)was calculated at each stage of loading taking into account thereduction/increase of the cross-sectional area (through DIC system)undergone by the specimen while it is stretched/compressed.
Tension
Experimental results clearly captured some of the fundamentalfeatures of the tensile true stress-strain behavior of polymers. Allthe tests were run until failure of the samples occurred. Dog-bonespecimens specified as Type 1 (T_1) were used in tests with thedigital image correlation systems and extensometers. Dog-bonespecimens shown as Type 2 (T_2) were used in tests in which thestrain was measured with strain gages. Table 1 shows the averagedimensions of different tensile samples. Fig. 3 shows an ascendingcurve that is bilinear starting from 0 to PEL and from PEL to theUTS in the prepeak region. Postpeak response includes strain soft-ening followed by nearly perfect plastic flow, which is a plateauwith almost constant flow stress, and strain hardening behavior in
Table 1. Average Dimensions of Tensile Dog-Bone Samples
Type t (mm) W (mm) WO (mm) L (mm) LO (mm) D (mm)
1 3.18 3.43 9.74 14 63.84 33.84
2 3 13 19 55 165 100
Fig. 2. Test set-up: MTS hydraulic machine optical measurement cam-eras and computer controller systems
Fig. 3. Stress-strain response of Type 1 samples
310 / JOURNAL OF AEROSPACE ENGINEERING © ASCE / APRIL 2012
J. Aerosp. Eng., 2012, 25(2): 308-319
Dow
nloa
ded
from
asc
elib
rary
.org
by
Ari
zona
Sta
te U
niv
on 0
7/08
/19.
Cop
yrig
ht A
SCE
. For
per
sona
l use
onl
y; a
ll ri
ghts
res
erve
d.
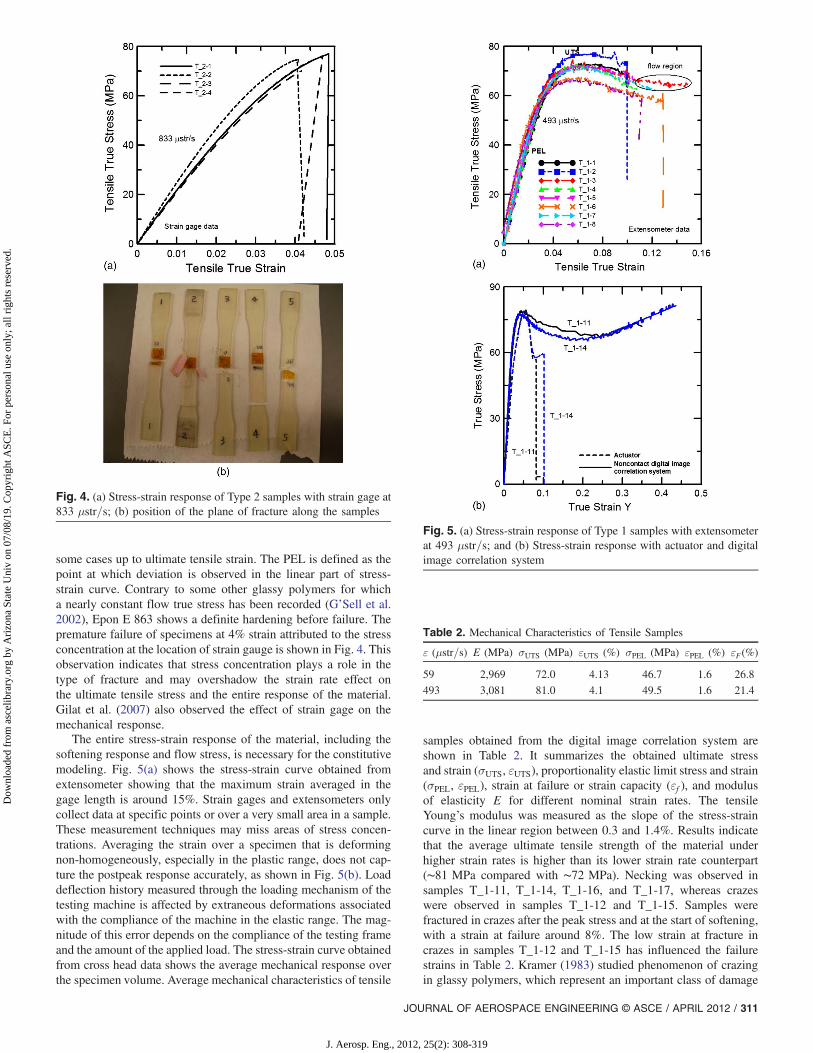
some cases up to ultimate tensile strain. The PEL is defined as thepoint at which deviation is observed in the linear part of stress-strain curve. Contrary to some other glassy polymers for whicha nearly constant flow true stress has been recorded (G’Sell et al.2002), Epon E 863 shows a definite hardening before failure. Thepremature failure of specimens at 4% strain attributed to the stressconcentration at the location of strain gauge is shown in Fig. 4. Thisobservation indicates that stress concentration plays a role in thetype of fracture and may overshadow the strain rate effect onthe ultimate tensile stress and the entire response of the material.Gilat et al. (2007) also observed the effect of strain gage on themechanical response.
The entire stress-strain response of the material, including thesoftening response and flow stress, is necessary for the constitutivemodeling. Fig. 5(a) shows the stress-strain curve obtained fromextensometer showing that the maximum strain averaged in thegage length is around 15%. Strain gages and extensometers onlycollect data at specific points or over a very small area in a sample.These measurement techniques may miss areas of stress concen-trations. Averaging the strain over a specimen that is deformingnon-homogeneously, especially in the plastic range, does not cap-ture the postpeak response accurately, as shown in Fig. 5(b). Loaddeflection history measured through the loading mechanism of thetesting machine is affected by extraneous deformations associatedwith the compliance of the machine in the elastic range. The mag-nitude of this error depends on the compliance of the testing frameand the amount of the applied load. The stress-strain curve obtainedfrom cross head data shows the average mechanical response overthe specimen volume. Average mechanical characteristics of tensile
samples obtained from the digital image correlation system areshown in Table 2. It summarizes the obtained ultimate stressand strain (σUTS, εUTS), proportionality elastic limit stress and strain(σPEL, εPEL), strain at failure or strain capacity (εf ), and modulusof elasticity E for different nominal strain rates. The tensileYoung’s modulus was measured as the slope of the stress-straincurve in the linear region between 0.3 and 1.4%. Results indicatethat the average ultimate tensile strength of the material underhigher strain rates is higher than its lower strain rate counterpart(∼81 MPa compared with ∼72 MPa). Necking was observed insamples T_1-11, T_1-14, T_1-16, and T_1-17, whereas crazeswere observed in samples T_1-12 and T_1-15. Samples werefractured in crazes after the peak stress and at the start of softening,with a strain at failure around 8%. The low strain at fracture incrazes in samples T_1-12 and T_1-15 has influenced the failurestrains in Table 2. Kramer (1983) studied phenomenon of crazingin glassy polymers, which represent an important class of damage
Fig. 5. (a) Stress-strain response of Type 1 samples with extensometerat 493 μstr=s; and (b) Stress-strain response with actuator and digitalimage correlation system
Table 2. Mechanical Characteristics of Tensile Samples
ε (μstr=s) E (MPa) σUTS (MPa) εUTS (%) σPEL (MPa) εPEL (%) εF(%)
59 2,969 72.0 4.13 46.7 1.6 26.8
493 3,081 81.0 4.1 49.5 1.6 21.4
Fig. 4. (a) Stress-strain response of Type 2 samples with strain gage at833 μstr=s; (b) position of the plane of fracture along the samples
JOURNAL OF AEROSPACE ENGINEERING © ASCE / APRIL 2012 / 311
J. Aerosp. Eng., 2012, 25(2): 308-319
Dow
nloa
ded
from
asc
elib
rary
.org
by
Ari
zona
Sta
te U
niv
on 0
7/08
/19.
Cop
yrig
ht A
SCE
. For
per
sona
l use
onl
y; a
ll ri
ghts
res
erve
d.

mechanisms. The interaction between the two modes of failure,brittle fracture attributed to unstable crack growth and plastic in-stability, indicates that the mode of failure in tension cannot beidentified for Epon E 863.
Fig. 6 shows the longitudinal strain distribution and the locationof high strain corresponding to necking. The strain distribution isaffected in the softening regime in which a high degree of non-linearity exists. Deformation is seen to localize in fine shear bandsthat grow and multiply within the neck. The necking of the speci-men causes nonuniform strain and stress distribution in the remain-ing cross section. Under uniaxial tension, plastic instability isnucleated after the yield point because of softening, whereas neckpropagation is favored by the increasing hardening at large truestrains (20%), as shown in Figs. 3 and 6 (sample T_1-11). Fig. 7shows the nonsymmetrical distribution of the major strain in stage131 corresponding to the peak stress area. It is clear that crazesstarted from one edge near the top of the strain gage area in planeswhose normal are in the direction of tensile stress. The main reasonfor this phenomenon is probably stress concentration near thefree surface in which plane stress governs. The type of fractureand failure mode affects the strain at failure. The ultimate strains
for crazing and necking types of failure are around 8 and 35%,respectively. Results obtained from the digital image correlationsystem show that increasing strain rate increases UTS around7% and slightly increases the initial elastic modulus.
Compression
To develop constitutive relations for epoxy resins under differentkinds of loading conditions, strength, ductility, and the stress-straincurve should be independent of geometrical shapes of the speci-men. The quasi static compressive test results on cubic, prismatic,and cylinder samples, are shown in Figs. 8–10. The figures clearlyshow some of the fundamental features of the compressive stress-strain behavior of epoxy resin samples with different geometries.These discrete features are a bilinear ascending curve startingfrom 0 to PEL and from PEL to the CYS in the prepeak region.The postpeak response includes strain softening followed by anearly perfect plastic flow, which is a plateau with either nearlyconstant flow stress or a small softening slope up to ultimatecompression strain in prismatic and cylindrical samples. Postpeakresponse in cubic samples includes strain softening followed by
Fig. 6. Distribution of εy in necking in stage 170 out of 190 stages in sample T_1-11
312 / JOURNAL OF AEROSPACE ENGINEERING © ASCE / APRIL 2012
J. Aerosp. Eng., 2012, 25(2): 308-319
Dow
nloa
ded
from
asc
elib
rary
.org
by
Ari
zona
Sta
te U
niv
on 0
7/08
/19.
Cop
yrig
ht A
SCE
. For
per
sona
l use
onl
y; a
ll ri
ghts
res
erve
d.
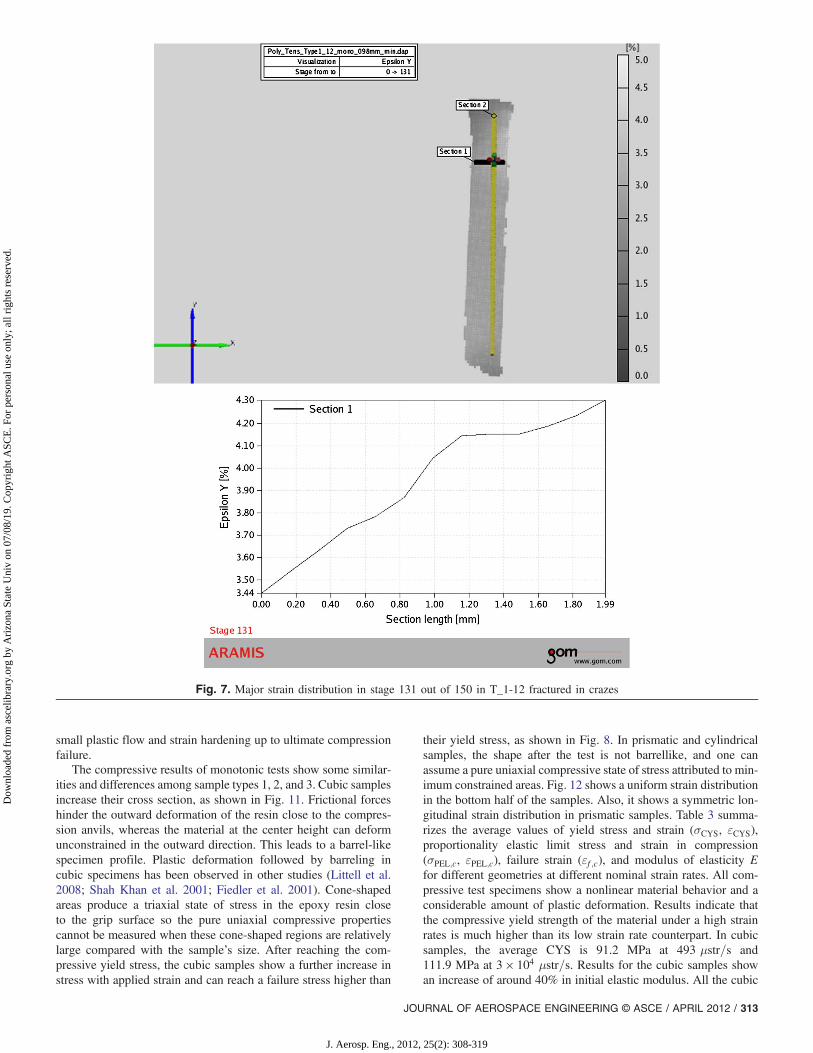
small plastic flow and strain hardening up to ultimate compressionfailure.
The compressive results of monotonic tests show some similar-ities and differences among sample types 1, 2, and 3. Cubic samplesincrease their cross section, as shown in Fig. 11. Frictional forceshinder the outward deformation of the resin close to the compres-sion anvils, whereas the material at the center height can deformunconstrained in the outward direction. This leads to a barrel-likespecimen profile. Plastic deformation followed by barreling incubic specimens has been observed in other studies (Littell et al.2008; Shah Khan et al. 2001; Fiedler et al. 2001). Cone-shapedareas produce a triaxial state of stress in the epoxy resin closeto the grip surface so the pure uniaxial compressive propertiescannot be measured when these cone-shaped regions are relativelylarge compared with the sample’s size. After reaching the com-pressive yield stress, the cubic samples show a further increase instress with applied strain and can reach a failure stress higher than
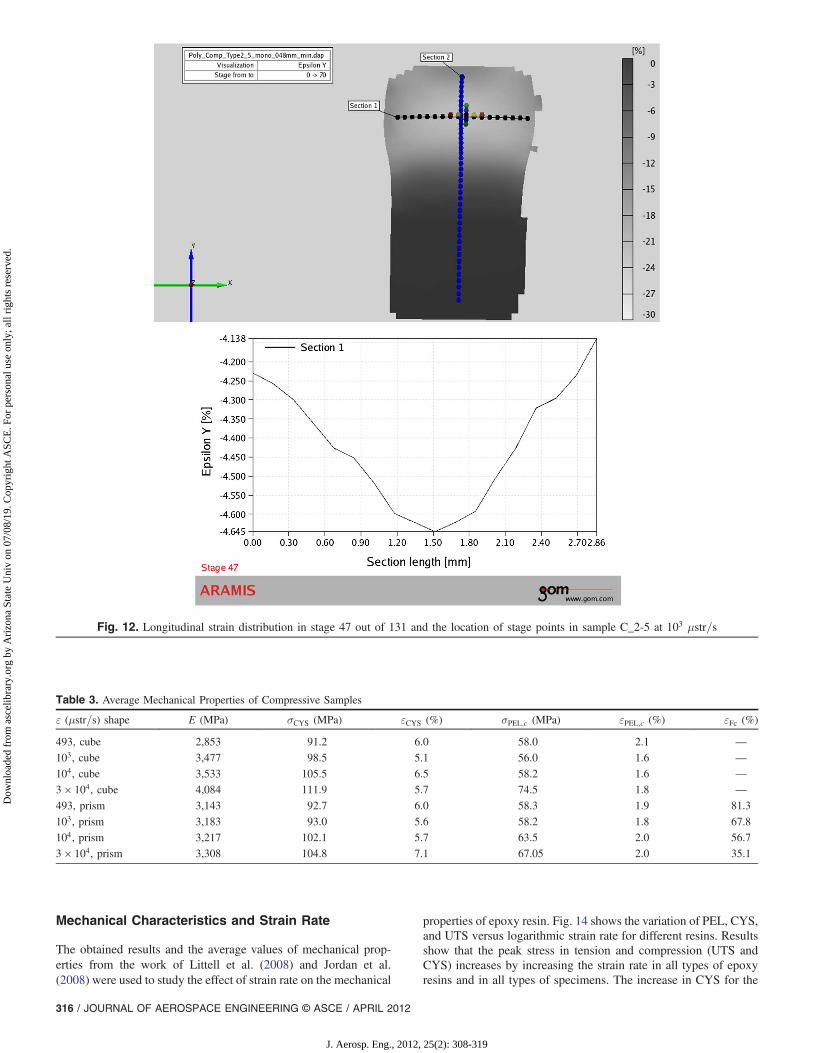
their yield stress, as shown in Fig. 8. In prismatic and cylindricalsamples, the shape after the test is not barrellike, and one canassume a pure uniaxial compressive state of stress attributed to min-imum constrained areas. Fig. 12 shows a uniform strain distributionin the bottom half of the samples. Also, it shows a symmetric lon-gitudinal strain distribution in prismatic samples. Table 3 summa-rizes the average values of yield stress and strain (σCYS, εCYS),proportionality elastic limit stress and strain in compression(σPEL;c, εPEL;c), failure strain (εf ;c), and modulus of elasticity Efor different geometries at different nominal strain rates. All com-pressive test specimens show a nonlinear material behavior and aconsiderable amount of plastic deformation. Results indicate thatthe compressive yield strength of the material under a high strainrates is much higher than its low strain rate counterpart. In cubicsamples, the average CYS is 91.2 MPa at 493 μstr=s and111.9 MPa at 3 × 10⁴ μstr=s. Results for the cubic samples showan increase of around 40% in initial elastic modulus. All the cubic
Fig. 7. Major strain distribution in stage 131 out of 150 in T_1-12 fractured in crazes
JOURNAL OF AEROSPACE ENGINEERING © ASCE / APRIL 2012 / 313
J. Aerosp. Eng., 2012, 25(2): 308-319
Dow
nloa
ded
from
asc
elib
rary
.org
by
Ari
zona
Sta
te U
niv
on 0
7/08
/19.
Cop
yrig
ht A
SCE
. For
per
sona
l use
onl
y; a
ll ri
ghts
res
erve
d.
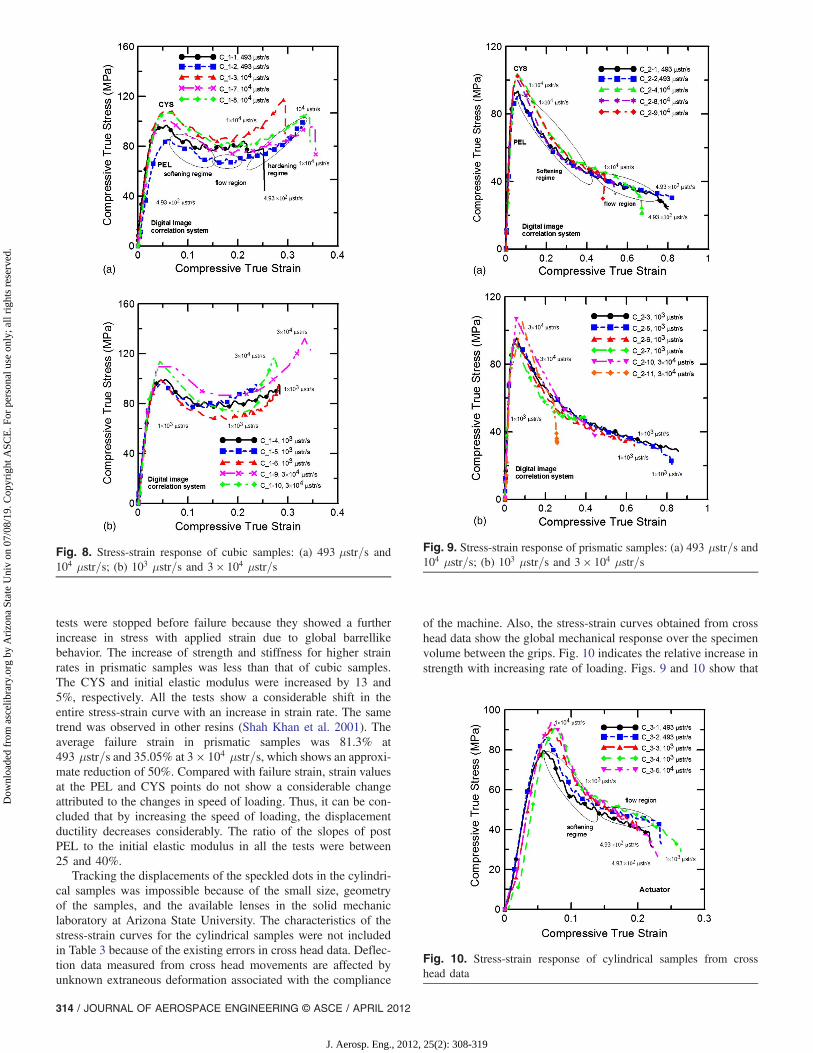
tests were stopped before failure because they showed a furtherincrease in stress with applied strain due to global barrellikebehavior. The increase of strength and stiffness for higher strainrates in prismatic samples was less than that of cubic samples.The CYS and initial elastic modulus were increased by 13 and5%, respectively. All the tests show a considerable shift in theentire stress-strain curve with an increase in strain rate. The sametrend was observed in other resins (Shah Khan et al. 2001). Theaverage failure strain in prismatic samples was 81.3% at493 μstr=s and 35.05% at 3 × 10⁴ μstr=s, which shows an approxi-mate reduction of 50%. Compared with failure strain, strain valuesat the PEL and CYS points do not show a considerable changeattributed to the changes in speed of loading. Thus, it can be con-cluded that by increasing the speed of loading, the displacementductility decreases considerably. The ratio of the slopes of postPEL to the initial elastic modulus in all the tests were between25 and 40%.
Tracking the displacements of the speckled dots in the cylindri-cal samples was impossible because of the small size, geometryof the samples, and the available lenses in the solid mechaniclaboratory at Arizona State University. The characteristics of thestress-strain curves for the cylindrical samples were not includedin Table 3 because of the existing errors in cross head data. Deflec-tion data measured from cross head movements are affected byunknown extraneous deformation associated with the compliance
of the machine. Also, the stress-strain curves obtained from crosshead data show the global mechanical response over the specimenvolume between the grips. Fig. 10 indicates the relative increase instrength with increasing rate of loading. Figs. 9 and 10 show that
Fig. 8. Stress-strain response of cubic samples: (a) 493 μstr=s and104 μstr=s; (b) 103 μstr=s and 3 × 10⁴ μstr=s
Fig. 9. Stress-strain response of prismatic samples: (a) 493 μstr=s and104 μstr=s; (b) 103 μstr=s and 3 × 10⁴ μstr=s
Fig. 10. Stress-strain response of cylindrical samples from crosshead data
314 / JOURNAL OF AEROSPACE ENGINEERING © ASCE / APRIL 2012
J. Aerosp. Eng., 2012, 25(2): 308-319
Dow
nloa
ded
from
asc
elib
rary
.org
by
Ari
zona
Sta
te U
niv
on 0
7/08
/19.
Cop
yrig
ht A
SCE
. For
per
sona
l use
onl
y; a
ll ri
ghts
res
erve
d.

there is not a significant difference in the flow stress beyond theCYS point at different strain rates. The results clearly illustrate thatprismatic and cylindrical samples show the same material behaviorconfirming the strain softening behavior followed by a stress flowplateau and failure. By comparing the average mechanical proper-ties of compression and tension stress-strain curves at 493 μstr=s,it is observed that Epon E 863 is stronger in compression than intension. The average CYS is around 92 MPa, whereas the averageUTS value is 81 MPa.
Flexure
All the samples initially had quarter deep notches at the middleof the beam, but half of the samples were modified by cuttingout the material around the notch and making a groove. A notchor groove at the middle of the 3PB beam offers the advantage thatfracture happens at the middle of the beam, and consequently, itfacilitates monitoring of the samples with DIC system. The loadingrates corresponding to the desired strain rates ranging from59 μstr=s to 493 μstr=s were calculated approximately on the basis
of the elastic linear assumption and geometry of samples (ASTM2003). The load deflection behavior for sample types B_1, B_1 m,and B_2, B_2 m are shown in Fig. 13. The load initially in-creases proportionally to deflection before passing through a kneepoint called LOP. The load keeps increasing with a reduced slopeup to the maximum point known as MOR, followed by a deflec-tion softening and final failure. Fig. 13 shows that samples B_1 m-4to B_1 m-6 illustrate more ductile behavior than samples B_1-1to B_1-3. Results indicate that MOR of the material underhigher loading rates is higher than its lower rate counterpart(111.9 MPa in sample B_1-3 compared with 106.08 MPa forsample B_1-2). It was observed that increasing the rate of load-ing slightly increases the initial stiffness of the sample. SamplesB_1 (notch) and B_1 m (groove) were fractured after the peakload and after showing a considerable amount of softening. BeamType 2 with notch and groove (B_2 and B_2 m) were tested attwo speeds of 0:4 mm=min and 1:02 mm=min. Sample B_2-2failed prematurely before reaching its load carrying capacity. Re-sults of B_2 m-4 and B_2 m-6 show that increasing the speed ofloading by three times increases the initial stiffness and MOR byaround 13%.
Fig. 11. Longitudinal strain distribution in stage 146 out of 277 and the location of stage points in sample C_1-1 at 493 μstr=s
JOURNAL OF AEROSPACE ENGINEERING © ASCE / APRIL 2012 / 315
J. Aerosp. Eng., 2012, 25(2): 308-319
Dow
nloa
ded
from
asc
elib
rary
.org
by
Ari
zona
Sta
te U
niv
on 0
7/08
/19.
Cop
yrig
ht A
SCE
. For
per
sona
l use
onl
y; a
ll ri
ghts
res
erve
d.
Mechanical Characteristics and Strain Rate
The obtained results and the average values of mechanical prop-erties from the work of Littell et al. (2008) and Jordan et al.(2008) were used to study the effect of strain rate on the mechanical
properties of epoxy resin. Fig. 14 shows the variation of PEL, CYS,and UTS versus logarithmic strain rate for different resins. Resultsshow that the peak stress in tension and compression (UTS andCYS) increases by increasing the strain rate in all types of epoxyresins and in all types of specimens. The increase in CYS for the
Fig. 12. Longitudinal strain distribution in stage 47 out of 131 and the location of stage points in sample C_2-5 at 103 μstr=s
Table 3. Average Mechanical Properties of Compressive Samples
ε (μstr=s) shape E (MPa) σCYS (MPa) εCYS (%) σPEL;c (MPa) εPEL;c (%) εFc (%)
493, cube 2,853 91.2 6.0 58.0 2.1 —103, cube 3,477 98.5 5.1 56.0 1.6 —104, cube 3,533 105.5 6.5 58.2 1.6 —3 × 10⁴, cube 4,084 111.9 5.7 74.5 1.8 —493, prism 3,143 92.7 6.0 58.3 1.9 81.3
103, prism 3,183 93.0 5.6 58.2 1.8 67.8
104, prism 3,217 102.1 5.7 63.5 2.0 56.7
3 × 10⁴, prism 3,308 104.8 7.1 67.05 2.0 35.1
316 / JOURNAL OF AEROSPACE ENGINEERING © ASCE / APRIL 2012
J. Aerosp. Eng., 2012, 25(2): 308-319
Dow
nloa
ded
from
asc
elib
rary
.org
by
Ari
zona
Sta
te U
niv
on 0
7/08
/19.
Cop
yrig
ht A
SCE
. For
per
sona
l use
onl
y; a
ll ri
ghts
res
erve
d.

prismatic sample of Epon E 863 is less than the increase in cubicsamples. The increase occurred bilinearly for Epon E 826, a linearincrease in low and medium strain rate up to 1 s�1 and a sharperlinear increase between 1 s�1 and 104 s�1. Generally, PEL stressesin tension and compression in all types of specimens were found to
be relatively less sensitive to strain rate. Figure 14 indicates thatcompressive PEL stress in Epon E 862 decreases slightly by in-creasing strain rate and then increases. No data are available instrain rates higher than 0.03 and 0:1 s�1 for E 863 and E 862, re-spectively. Fig. 15 illustrates the effect of increasing strain rates onthe modulus of elasticity of three epoxy resins. The results indicatethat the modulus of elasticity increases with increasing strain rate.Foreman et al. (2010) observed that at a higher strain rate, the resinhas less time to dissipate energy and therefore, will yield at a higherstress and has a correspondingly higher modulus. Strain rate influ-ence on the compression failure strain of Epon E 863 is shown inFig. 15. Compression failure strain decreases substantially from81.3% at 493 μstr=s to 35.05% at 0:03 s�1. Table 3 shows no sig-nificant change in PEL strain, whereas strains at peak stress pointsalmost show a near ascending order with increasing strain rate. Thesame trend has been observed on the increase in strain at yieldstress (G’Sell and Souahi 1997). However, no change in strain atmaximum stress with increasing strain rates was recorded in thecase of vinylester resin (Shah Khan et al. 2001). Symbols enclosedin circles in Figs. 14 and 15 indicate overlapping data. Quantitativeestimates of stress at the PEL point based on UTS and CYS pointsfor E 863 are made in Figs. 16 and 17. Results show that PEL stressis around 60% of CYS and UTS in the strain rate range upto 0:03 s�1. Also, it is shown that PEL is approximately 65% ofCYS in the medium strain range of 0:03 s�1.
Fig. 13. Load deflection curves for (a) sample types B_1 and B_1 mand (b) sample types B_2 and B_2 m
Fig. 14. Variations of PEL, CYS, and UTS with strain rates
Fig. 15. Variations of modulus of elasticity and failure strain withstrain rates
JOURNAL OF AEROSPACE ENGINEERING © ASCE / APRIL 2012 / 317
J. Aerosp. Eng., 2012, 25(2): 308-319
Dow
nloa
ded
from
asc
elib
rary
.org
by
Ari
zona
Sta
te U
niv
on 0
7/08
/19.
Cop
yrig
ht A
SCE
. For
per
sona
l use
onl
y; a
ll ri
ghts
res
erve
d.

Conclusions
The mechanical properties of epoxy resin under tension, com-pression, and flexure (3PB) with different specimen shapes and atdifferent strain rates has been investigated. Initilly,the stress-strainresponse was found to be linear, indicating elastic behavior,
followed by nonlinear plastic deformation. Plastic deformationswere observed in thin samples when a noncontact techniquewas used for measuring deformation and strain. Epoxy resin EponE 863 shows high failure strain in tension. However, considerableexperimental scatter associated with fracture attributed to crazeswas observed in tension samples. Failure by crazing was observed,whereas material deformed plastically. Cubic, prismatic, and cylin-drical samples showed different compression behavior. Cubic sam-ples, after reaching the compressive yield stress, showed a gradualdrop in the stress-strain curve followed by strain stiffening at highstrain values and reached a fracture stress higher than their yieldstress. In the prismatic and cylindrical samples, the shape afterthe test was not barrel-like; therefore, it is correct to assume a pureuniaxial compressive state of stress because of minimum con-strained areas. Results of the compression tests show that a pris-matic sample with aspect ratio greater than two results in muchbetter uniaxial compressive state of stress than cubic samples. In-crease in the strain rate increases peak stress in tension and com-pression and modulus of elasticity. The strain at yield was found tobe relatively less sensitive to strain rate in Epon E 863. Strain atfailure of polymeric specimens decreases as speed of load in-creases. Results show that PEL in compression and tension couldbe estimated between 60 and 65% of CYS and UTS for low andmedium strain rates. Load deflection curves, after reaching themaximum load capacity, showed deflection softening behaviorthrough a drop in flexural load carrying capacity. The results showthat samples with grooves illustrate more ductile behavior thansamples with notches. Increase in the rate of loading increasesthe initial stiffness and MOR in flexure.
Acknowledgments
The authors gratefully acknowledge the support of this researchby the Army Research Office, AMSRD-ARL-RO-SI ProposalNumber 49008-EG, Agreement Number W911NF-07-1-0132, Pro-gram Manager: COL. Reed F. Young. We also thank Dr. DallasKingsbury from Arizona State Univ. for assistance in conductingthe tests.
References
ARAMIS. (2006). “User’s manual for 3-D image photogrammetry.” GOMmbH, Braunschweig, Germany.
ASTM. (2003). “Standard test method for flexural properties of unrein-forced and reinforced plastics and electrical insulatins materials.”D790-03, West Conshohocken, PA.
ASTM. (2010a). “Standard test method for compressive properties of rigidplastics.” D695-10, West Conshohocken, PA.
ASTM. (2010b). “Standard test method for tensile properties of plastics.”D638-10, West Conshohocken, PA.
Ballatore, E., Carpinteri, A., Ferrara, G., and Melchiorri, G. (1990). “Mixedmode fracture energy of concrete.” Eng. Fract. Mech., 35(1–3),145–157.
Behzadi, S., and Jones, F. (2005). “Yielding behavior of model epoxymatrices for fiber reinforced composites: Effect of strain rate andtemperature.” J. Macromol. Sci. Phys., 44(6) 993–1005.
Buckley, C. P., and Harding, J. (2001). “Deformation of thermosettingresins at impact rates of strain, Part I: experimental study.” J. Mech.Phys. Solids, 49(7), 1517–1538.
Boyce, M. C., and Arruda, E. M. (1990). “An experimental and analyticalinvestigation of the large strain compressive and tensile response ofglassy polymers.” Polym. Eng. Sci., 30(20), 1288–1298.
Chen, W., Lu, F., and Cheng, M. (2001). “Tension and compression testsof two polymers under quasi-static and dynamic loading.” Polym. Test.,21(2), 113–121.
Fig. 16. Variations of PEL with CYS for (a) low and (b) medium strainrate
Fig. 17. Variations of PEL with UTS for low strain rates
318 / JOURNAL OF AEROSPACE ENGINEERING © ASCE / APRIL 2012
J. Aerosp. Eng., 2012, 25(2): 308-319
Dow
nloa
ded
from
asc
elib
rary
.org
by
Ari
zona
Sta
te U
niv
on 0
7/08
/19.
Cop
yrig
ht A
SCE
. For
per
sona
l use
onl
y; a
ll ri
ghts
res
erve
d.

Fergusson, A. D., Puri, A., Morris, A., and Dear, J. P. (2006). “Flexuraltesting of composite sandwich structures with digital speckle photo-grammetry.” Appl. Mech. Mater., 5(6), 135–144.
Fiedler, B., Hojo, M., Ochiai, S., Schulte, K., and Ando, M. (2001). “Fail-ure behavior of an epoxy matrix under different kinds of static loading.”Compos. Sci. Technol., 61(11), 1615–1624.
Foreman, J. P., Porter, D., Behzadi, S., Curtis, P. T., and Jones, F. R. (2010).“Predicting the thermo mechanical properties of an epoxy resin blend asa function of temperature and strain rate.” Composites Part A, 41(9),1072–1076.
Gilat, A., Goldberg, R. K., and Roberts, G. D. (2007). “Strain rate sensi-tivity of epoxy resin in tensile and shear loading.” J. Aerosp. Eng.,20(2), 75–89.
G’Sell, C., and Souahi, A. (1997). “Influence of cross linking on theplastic behavior of amorphous polymers at large strains.” J. Eng. Mater.Technol., 119(3), 223–227.
G’Sell, C., Hiver, J. M., and Dahoun, A. (2002). “Experimental characteri-zation of deformation damage in solid polymers under tension, andits interrelation with necking.” Int. J. Solids Struct., 39(13–14),3857–3872.
G’Sell, C., Hiver, J. M., and Gehin, F. (2000). “Real-time quantitativedetermination of volume variations in polymers under plastic strain.”Deformation, yield and fracture of polymers, The Institute of Metals,London, 371–374.
Hobbiebrunken, T., Fiedler, B., Hojo, M., and Tanaka, M. (2007).“Experimental determination of the true epoxy resin strength usingmicro-scaled specimens.” Compos. Appl. Sci. Manuf., 38(3), 814–818.
Jordan, J. L., Foley, J. R., and Siviour, C. R. (2008). “Mechanical propertiesof Epon 826/DEA epoxy.” Mech. Time-Depend Mater., 12(3),249–272.
Kramer, E. J. (1983). “Crazing in polymers.” Adv. Polym. Sci., 52, 1–56.Liang, Y. M., and Liechti, K. M. (1996). “On the large deformation and
localization behavior of an epoxy resin under multiaxial stress state.”Int. J. Solids Struct., 33(10), 1479–1500.
Littell, J. D., Ruggeri, C. R., Goldberg, R. K., Roberts, G. D.,Arnold, W. A., and Binienda, W. K. (2008). “Measurement of epoxyresin tension, compression, and shear stress- strain curves over a widerange of strain rates using small test specimens.” J. Aerosp. Eng., 21(3),162–173.
Mannocci, F., Sherriff, M., and Watson, T. F. (2001). “Three-point bendingtest of fiber posts.” J. Endod., 27(12), 758–761.
Shah Khan, M. Z., Simpson, G., and Townsend, C. R. (2001). “A compari-son of the mechanical properties in compression of two resins.” Mater.Lett., 52(3), 173–179.
Walley, S. M., and Field, J. E. (1994). “Strain rate sensitivity of polymersin compression from low to high rates.” DYMAT J., 1(3), 211–227.
Ward, I. M., and Sweeney, J. (2004). Mechanical properties of solidpolymers, Wiley, Chichester, UK.
JOURNAL OF AEROSPACE ENGINEERING © ASCE / APRIL 2012 / 319
J. Aerosp. Eng., 2012, 25(2): 308-319
Dow
nloa
ded
from
asc
elib
rary
.org
by
Ari
zona
Sta
te U
niv
on 0
7/08
/19.
Cop
yrig
ht A
SCE
. For
per
sona
l use
onl
y; a
ll ri
ghts
res
erve
d.