characterization of dexter hysol's · a characterization of dexter hysol's modified ......
TRANSCRIPT
DTIC File Copy
WRDC-TR-89-4102
A CHARACTERIZATION OF DEXTER HYSOL'S MODIFIEDACETYLENE-TERMINATED BISPHENOL-A PREPREG SYSTEM:XAS/AF-8
PERRY R. WAGNERSTRUCTURAL MATERIALS BRANCHNONMETALLIC MATERIALS DIVISION
(0
N JULY 1989
R-
N FINAL REPORT FOR PERIOD NOVEMBER 1987 - JULY 1988
I
APPROVED FOR PUBLIC RELEASE -- DISTRIBUTION IS UNLIMITED
OTICLECTE D
b NOVO619
MATERIALS LABORATORYWRIGHT RESEARCH & DEVELOPMENT CENTERAIR FORCE SYSTEMS COMMANDWRIGHT-PATTERSON AIR FORCE BASE, OHIO 45433-6533
89 _i 005

UNCLASSIFIEDSECURITY CLASSIFICATION OF THIS PAGE
Form ApprovedREPORT DOCUMENTATION PAGE OMB No. 0704-0188
la. REPORT SECURITY CLASSIFICATION lb. RESTRICTIVE MARKINGS
Unclassified
2a. SECURITY CLASSIFICATION AUTHORITY 3. DISTRIBUTION/AVAILABILITY OF REPORTApproved for public release;
2b. DECLASSIFICATION /DOWNGRADING SCHEDULE Distribution is umlimited
4. PERFORMING ORGANIZATION REPORT NUMBER(S) S. MONITORING ORGANIZATION REPORT NUMBER(S)
WRDC-TR-89-4 1026a. NAME OF PERFORMING ORGANIZATION 6b. OFFICE SYMBOL 7a. NAME OF MONITORING ORGANIZATION
Materials Laboratory (if applicable)WRDC/AFSC WRDC/MLBC
6c. ADDRESS (City, State, and ZIP Code) 7b. ADDRESS (City, State, and ZIP Code)
WRDC/MLBC
WPAFB, OH 45433-6533
8a. NAME OF FUNDING/SPONSORING 8b. OFFICE SYMBOL 9. PROCUREMENT INSTRUMENT IDENTIFICATION NUMBERORGANIZATION (If applicable)
6c. ADDRESS (City, State, and ZIP Code) 10. SOURCE OF FUNDING NUMBERS
PROGRAM PROJECT ITASK WORK UNITELEMENT NO. NO. NO ACCESSION NO
6210F 2419 03 101 l. TIT E (Include Security Classification)
A Characterization of Dexter Hysol's Modified Acetylene-Terminated Bisphenol-A PrepregSystem: YAS/AF-8"
12 PERSONAL AUTHOR(S)
Wapner, Perry R.13a. TYPE OF REPORT 13b. TIME COVERED 14. DATE OF REPORT (YearMonth,Day) 15. PAGE COUNT 41
Final 7 FROM NI 87 TO1 i Jul 89 ,16. SUPPLEMENTARY NOTATION
17. COSATI CODES 18. SUBJECT TERMS (Continue on reverse if necessary and identify by block number)FIELD GROUP SUB-GROUP ,prepreg, acetylene-terminated resin, advanced composites,
mechanical properties, ductility,
19. ABSTRACT (Continue on reverse if necessary and identify by block number)
The objective of this research effort is to characterize an advanced composite prepregsystem. The material under consideration is Dexter Hysol's modified acetylene-terminatedbisphenol-A resin on continuous XAS-typie graphite fibers. Hysol asserts that this modifiedcompsoite system retains the 400-425°F use temperature associated with state-of-the-artacetylene-terminated resin prepreg systems while achieveing a 64% increase in Mode I fracturt'ughness. Our investigation shows that although the ductility was improved, other mechan-cal properties were severely degraded when test coupons were evaluated at 350'F andsaturated with water.
20. DISTRIBUTION/ AVAILABILITY OF ABSTRACT 21. ABSTRACT SECURITY CLASSIFICATION91 UNCLASSIFIED/UNLIMITED 0l SAME AS RPT. rl DTIC USERS lUnclaRsified
22a NAME OF RESPONSIBLE INDIVIDUAL 22b. TELEPHONE (Include Area Code) 22c OFFICE SYMBOLPerry R. Wagner (513) ?55-9058 WRDC/
DO Form 1473, JUN 86 Previous editions are obsolete. SECURITY CLASSIFICATION OF THIS PAGE
UNCLASSIFIED

FOREWORD
This technical report is the culmination of a 9 month research effort extending fromNovember 1987 to July 1988. The author is Perry R. Wagner, whose background isthe mechanical testing of composites. The work was performed at the MaterialsLaboratory, Wright Research & Development Center located at Wright-Patterson AFB,Ohio.
Acevsion For
D' I C" 7 "----- A--
j!S .. .
]ii

ACKNOWLEDGEMENTS
I would like to thank the following individuals, all of whom made invaluable
contributions during this research effort: Brian Rice, Ron Cornwell, Chuck Fowler, Ken
Lindsay, Bill Price, and Bill Ragland. The aforementioned are members of the
University of Dayton Research Institute on-site contract at Wright-Patterson AFB, Ohio.
. . .. • • • • i i v i

TABLE OF CONTENTS
SECTION PAGE
I INTRODUCTION 1
II BACKGROUND 2
III EXPERIMENTAL PROCEDURES 4
A PREPREG CHARACTERIZATION 4B PANEL FABRICATION 5C PHYSICAL TESTING 6D MECHANICAL TESTING 7
IV EXPERIMENTAL RESULTS 16
A PHYSICAL PROPERTIES DATA 16B MECHANICAL DAIA 16
V DISCUSSION 24
A PHYSICAL TEST DATA 24B MECHANICAL TEST DATA 24C COMPARISON TO MANUFACTURER'S DATA 29D COMPARISON TO ALTERNATIVE TOUGHENED AT SYSTEMS 30
VI CONCLUSIONS 32
VII REFERENCES 33
V

LIST OF FIGURES
FIGURE PAGE
1. ATB and ATS Chemical Structures .................................................................. 32. Bagging Schematic for Consolidation of Panels ........................................... 63. Schematic of the Mode I Test Coupon .......................................................... 104. Panel #1: Cut-Out Schematic of Flex and Shear Specimens ................... 115. Panel #2: Cut-Out Schematic of Tension, Flex, and Shear Specimens ...... 12
6. Panels #3,#6: Cut-Out Schematic of In-Plane Shear Specimens ........... 137. Panel #4: Cut-Out Schematic of Edge Delamination Specimens ....... 148. Panel #5: Cut-Out Schematic of Mode I and Mode II Specimens ....... 159. Differential Scanning Calorimeter Trace of XAS/AF-8 ............................... 1710. Thermogravimetric Analysis of XAS/AF-8 ..................................................... 1811. Rheometric Output of As-Cured XAS/AF-8 Prepreg .................................... 1912. Rheometric Output of As-Cured XAS/AF-8 Laminate .................................. 2013. Photomicrographs of XAS/AF-8 Panel #5 ..................................................... 2114. Moisture Weight Gain vs. Time for Three Batches of XAS/AF-8 ................ 2315. XAS-AF-8 00-4 Point Flex Hot/Wet Data ........................................................ 2516. XAS/AF-8 0°-3 Point Flex Hot/Wet Data ........................................................ 2617. XAS/AF-8 0°-4 Point Shear Hot/Wet Data ..................................................... 2718. XAS/AF-8 Short Beam Shear Hot/Wet Data ............................................... 2719. XAS/AF-8 In-Plane Shear Hot/Wet Data ..................................................... 28

LIST OF TABLES
TABLE PAGE
1. Cure and Postcure Cycles Provided by Hysol for XASA/AF-8 Prepreg .......... 5
2. Mechanical Test Matrix Used to Analyze XAS/AF-8 ................................................ 7
3. Mechanical Tests and Pertinent Test Data ................................. 8
4. Density and Fiber Volume Data for XAS/AF-8 Panels ....................................... 21
5. Completed Mechanical Test Matrix for XAS/AF-8 Composite .......................... 22
6. Comparison of Specimen Size with Average Percent Water Absorptionfor XAS/A F-8 Specim ens .................................................................................. 24
7. A Portion of Hysol's XAS/AF-8 Mechanical Data ............................................... 29
8. Completed Mechanical Test Matrix for T-300/CATB-44 Composite ................ 30
VI 1

I. INTRODUCTION
The WRDC Materials Laboratory has an ongoing effort to evaluate new materialswhich have demonstrated a potential use on future Air Force weapon systems.Typically, a modified composite prepreg system, which has been developed under
Materials Laboratory contractual efforts, warrants further in-house investigation. SUchmaterial systems are reserved for new hires desiring experience in composiesfabrication and characterization. It was under these circumstances that this researchinvestigation was initiated. The data reported here is not design data. On the contrary,
this effort can be classified as an initial material screening.
The material to be examined is a composite prepreg system consisting of Hysol-
Grafil continuous graphite fibers impregnated with a modified ("toughened") acetylene-
terminated bisphenol-A resin. The system was purported to have a 4000-425°F usetemperature and a Mode I fracture toughness value higher than that of previous resinprepregs.
II. BACKGROUND
With the inception and use of graphite/epoxy technology, the design of manystructural applications has changed significantly. Specifically, the Air Force haschanged many of their load-bearing aircraft components from aluminum alloys tographite/epoxy. The major drawback to this composite system, however, is itshygroscopic nature.1 The polar groups within the epoxy matrix attract water whichthen serves as a plasticizer, lowering the glass transition temperature (Tg) of the matrixand, thus, limiting the use temperature of the composite system and structure. It wasthis problem that encouraged the development of resins with better "hot/wet"characteristics--resins whose properties do not degrade as rapidly as the epoxy resinsupon exposure to higher temperatures and humidities. Bismaleimide, polyimide, andAT imide resins were developed to solve this problem. AT (acetylene terminated)molecules were first conceived in the 1960's. They can sustain use temperatures of
5000-600°F for limited periods of time. In addition, AT resins were touted as beingpractically insensitive to moisture and easily processable for organic matrix structuralcomposite applications. Their hydrophobic nature was indeed a reality, but their easein processing was not confirmed. These AT resins were brittle. And, their cost wasnearly $200/lb. Thus, the Materials Laboratory again sponsored contractual programs
to augment the structure of the AT molecule in hopes of improving its processingcharacteristics and lowering its cost. The resulting ATB (acetylene-terminated
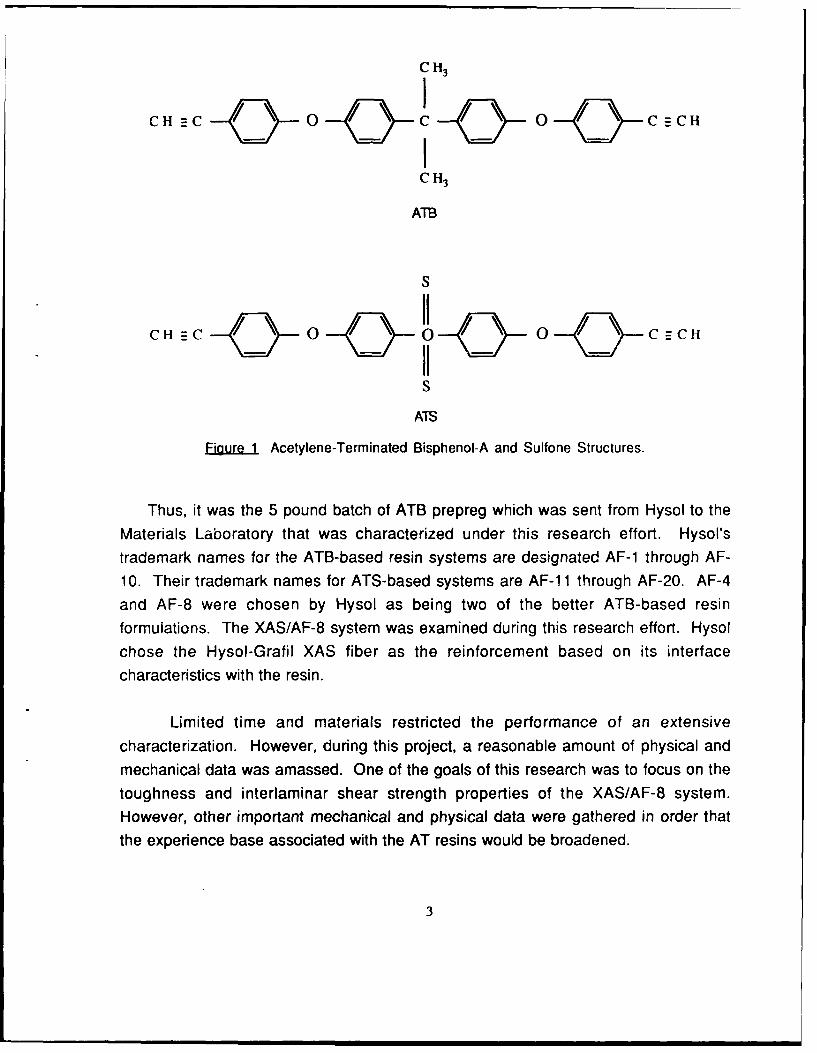
bisphenol-A) and ATS (acetylene terminated sulfone) molecules are shown in Figure
1. Contracts were established with Dexter Hysol and American Cyanamid in 1985 to"toughen" the ATB and ATS resins. The formulated AT resins were scaled up andapplied to graphite fibers. The resulting prepreg was shipped in 5 pound batches tovarious airframe corporations and to the Materials Laboratory. 2
2
C H3
12ItC H -C Q _0 _ _C Q _0 C_0 C H
UCH3A'rB
S
- I-C --
S
ATS
Figure 1 Acetylene-Terminated Bisphenol-A and Sulfone Structures.
Thus, it was the 5 pound batch of ATB prepreg which was sent from Hysol to the
Materials Laboratory that was characterized under this research effort. Hysol's
trademark names for the ATB-based resin systems are designated AF-1 through AF-10. Their trademark names for ATS-based systems are AF-1 1 through AF-20. AF-4
and AF-8 were chosen by Hysol as being two of the better ATB-based resinformulations. The XAS/AF-8 system was examined during this research effort. Hysol
chose the Hysol-Grafil XAS fiber as the reinforcement based on its interface
characteristics with the resin.
Limited time and materials restricted the performance of an extensive
characterization. However, during this project, a reasonable amount of physical andmechanical data was amassed. One of the goals of this research was to focus on the
toughness and interlaminar shear strength properties of the XAS/AF-8 system.However, other important mechanical and physical data were gathered in order that
the experience base associated with the AT resins would be broadened.
3

III. EXPERIMENTAL PROCEDURES
A. Prepreg C .; cterization
The 5 pound batch of prepreg was received from Hysol on 12 May 1987 and wasj)aced in cold storage. Prior to cutting up the prepreg into sections for lay-up, several
physical property tests were performed as a matter of course. Samples were
sectioned from the Hysol prepreg and were tested in a DuPont 910 differential
scanning calorimeter (DSC) with an Omnitherm Controller. The experiment was run
from room temperature to 4000C in nitrogen at a ramp rate of 10°C/min. The DSC run
was performed to gain insight into the material's thermal properties such as the heat of
reaction, the temperature at which the exotherm begins and the maximum exotherm
temperature.
On a replicate section of Hysol prepreg, a thermogravimetr, analysis (TGA) was
performed using a DuPont 951 model with an Omnitherm Controller. Similar to the
DSC, the TGA was operated from room temperature to 4000C in nitrogen at a ramp
rate of 10°C/min. The figures of merit with respect to TGA are percent residue [(initial
weight-final weight)/initial weight] and temperature at onset of volatilization.
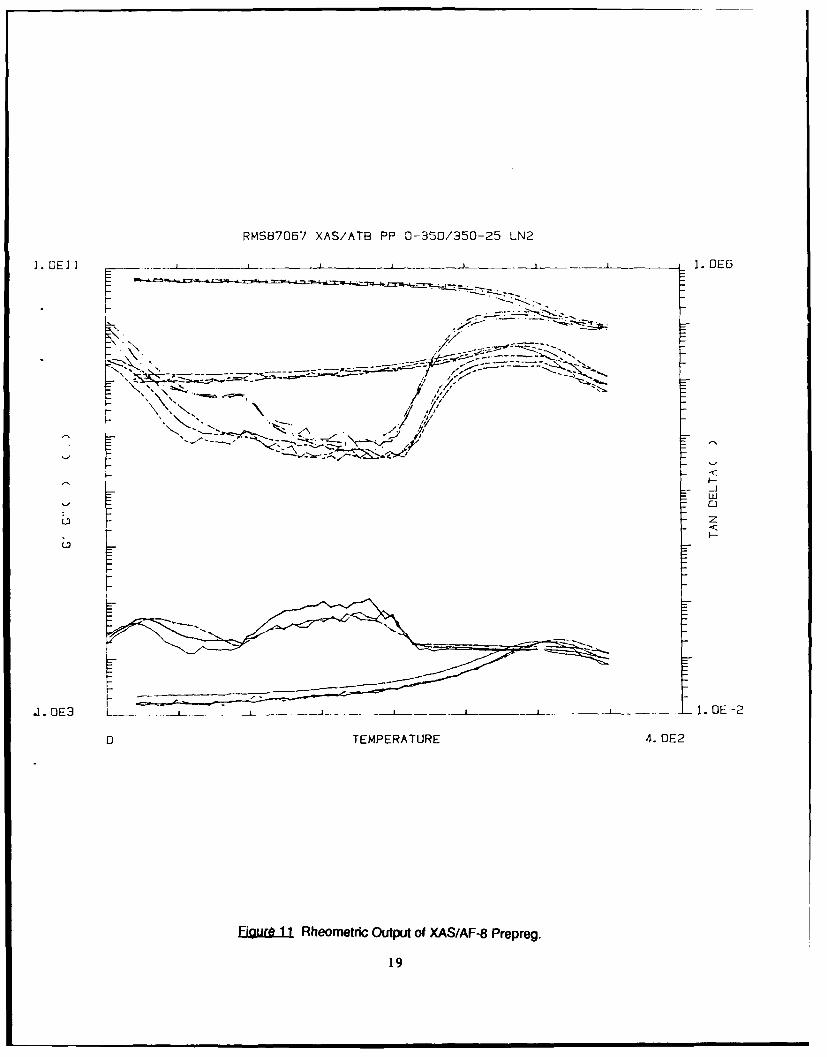
In order to obtain a basic understanding of the rheological behavior of the Hysol
material, two specimens were run through an RMS 7200 rheological characterization
unit. The first run was made using a 10-ply, unidirectional prepreg sample (1.25" x
0.47" x 0.063"). The second sample (1.95" x 0.50" x 0.075") was a 12-ply,
unidirectional cured composite (its cure cycle being the same as was used for all the
consolidation runs). Both samples were cycled in the RMS from room temperature to
3500C and back to room temperature at a rate of 20C/min. Both tests were performed
in nitrogen. Each of the two experiments was performed at three different frequencies
(0.16 Hz, 1.6 Hz, and 15.92 Hz). The curves generated from these tests provide a
good deal of information about the material, most importantly its glass transition
temperature. The storage modulus, loss modulus, and the ratio of these two terms
were recorded at each frequency as a function of temperature. The as-cured sample
was run through the RMS to see if the material had fully cured.

B. Panel Fabrication
A total of six panels were cut from the prepreg roll, laid up into various orientations,
bagged, and finally cured in a Thermal Equipment Autoclave (model 8397). A
schematic describing the bagging procedure is shown in Figure 2. The cure cycle and
post-cure cycles (Table 1) were used for all six panels.
Table 1 Manufacturer's Cure And Post-cure Cycles for XAS/AF-8 Prepreg.
XAS/AF-8 Cure Cycle
Pressurize to 100 psiHeat-up to 2350F at 2-30F/minute.
Hold at 250°F for 30 minutes.Heat-up to 3550F at 2-30F/minute.
Hold at 355°F for 300 minutes.Cool down at 1-20F/minute.
XAS/AF-8 Post-Cure Cycle
Heat-up to 511°F at 30F/minute.Hold at 511OF for 240 minutes.
Cool down at 30F/minute
C. Physical Testing
Every panel was exposed to a series of physical evaluations in order to check for
noticeable delaminations and/or voids and to determine the overall laminate density
and fiber volume. C-scans of all six panels were performed on a Testech Ultrasonic
Immersion system. From each of the panels, a section (approximately 1 square inch)
was reserved for photomicrographs, density, and fiber volume coupons. The
photomicrograph specimen was mounted in epoxy and photographed at various
magnifications (i.e., 150X and 300X) with an Olympus camera. Other specimens from
the section were weighed both in water and in air to obtain the density. These same
specimens were then placed in a heated sulfuric acid bath for several hours. The
residual fibers were weighed and the fiber, matrix, and void percent content by volume
were calculated. Fiber and resin specific gravity values were obtained from the
manufacturer to be used in these calculations.

10
-/
SPECIFICATIONS
1- MOLD RELEASE ON CAUL PLATE2- CORK DAM3- POUROUS TEFLON COATED GLASS FABRIC; SIDES ARE FOLDED
AROUND AND TAPED WITH HIGH TMPERATURE TAPE TO FORMA PACKAGE WHICH INCLUDES SPECIFICATION NTMBERS, 4 THROUGH11.
4- BLEEDER CLOTH (1 for 12"X12", 2 FOR 6"X9")5- POUROUS TEFLON COATED GLASS FABRIC6- LAMINATE7- NONPOUROUS TEFLON COATED GLASS FABRIC8- BLEEDER CLOTH9- POUROUS TEFLON COATED GLASS FABRIC
10- CAUL PLATE11- NONPOUROUS TEFLON COATED GLASS FABRIC12- GLASS FABRIC13- VACUUM BAG
Figure 2 Bagging Schematic For Consolidation of Panels.
6

D. Mechanical Testing
The six panels were machined into coupons which were then subjected to the test
matrix shown in Table 2. The number of specimens performed under a given test andgiven condition is shown in brackets. This matrix provides for a rudimentary
mechanical analysis of the ATB material. All of the tests are static in nature. The
mechanical properties obtained from this test matrix can be classified into two groups:
those that fill the compliance matrix and those that describe the fracture behavior of the
material. Tests which supply information to the compliance matrix are 0-4 point flex,
00-3 point flex, 0-4 point shear, short beam shear, 90-4 point flex, 00-tension and+45 0-tension. The Mode I, Mode II, and edge delamination tests provide insight into
the composite's fracture characteristics.
It is rare that a mechanical test (even one that is performed meticulously under the
strictest standards) provides a "true", inherent material property. In the test matrix ofTable 2, only the 00-tension and ±450-tension tests offer true material properties. The
former measures the longitudinal strength and modulus, while the latter measures thein-plane shear strength and modulus. The flex and shear coupons, on the other hand,
are exposed to such biaxial (and even triaxial) states of stress that the resulting data
fall under severe scrutiny from the research community. 3 ,4 The test data are furtherconfused when the test coupons are exposed to humidity and/or tested at elevatedtemperatures. 5
Table 2 Mechanical Test Matrix Used To Analyze XAS/AF-8.
Test Temperature 74 250 350 74 250 350Aging Conditions Dry Dry Dry Wet Wet Wet
Mechanical Test0°-4 Point Flex [5] [5] [5] [5] [5] [5]0°-3 Point Flex [5] [5] [51 [5] [5] [5]
0°-4 Point Shear [5] [51 [5] [5] [5] [5]Short Beam Shear [5] [5] [ 5] [ 5] [5] [ 5]900-4 Point Flex [5] [5]
Mode 1 [5100-Tension [ 5 ]
+/-45 0-Tension [5] [5] [51 [51Edge Delamination [5 1
Mode I [ 5 ]
7

0 ! 0
c0 CUO-
as- 0D co -N N C W~ N -L CC C) M C CV) Cu 0 0 Cu
m u 0 0 -0 m 00 D 00 0 0 0 ( E 0 v
0. 0 0 W 0 U V , t
(D0 2 2 D 0
Cl) 0 0 0
0 000 CON
< Hj
o -C 0 uV n r O c c ) L ) V 0 -
cN CO N 00 N N Cq0 CD 0 -~
= 0n
0 m -i a)C: co
Co- Co C? CD C
0 COcnJNM
n U) N) C CD
U)C: Cn
0
C 0 00 0 0 0 0 0 0-
EC .20 0000 0 00C>0 0CH
CDD
00
M 7 00 0) +
C)0 0 00000
zz -
0 C')C 0)D 0 0
Co- l C NCD0~ 0 - . )
0 0 0 0 + M
0 L
8

previous caveats noted, the tests in Table 2 will be further discussed with respect to
other key test parameters. Table 3 provides a comprehensive overview of the
important data associated with each mechanical test. Miscellaneous information
related to Table 3 is noted below.
The 0-4 point flex and 0-3 point flex tests were performed to measure an estimate
of the properties parallel to the fiber. The 90-4 point flex test investigate I
properties perpendicular to the fiber axis. The 0-4 point shear and short beam shear
tests provide an estimate of the interlaminar shear properties.
There are no standardized methods to date for the Mode I, Mode II, and edge
delamination tests. However, the ASTM D30 committee is presently reviewing these
three tests. All are very well documented and are in the round robin stage. The edge
delamination test provides insight into the Mode I fracture toughness of a composite
material. The coupon's geometry and loading conditions are identical to those of the
00-tension coupon. The sides of the edge delamination coupon are polished and/or
marked with a white paint so that ply delaminations can be easily observed. The key
parameters for this test are the initial modulus, stress at delamination, ultimate strength
and ultimate strain-to-failure. The Mode I test coupons were machined from a 12-ply
unidirectional laminate. The last 1" of the panel has a Teflon release ply positioned
halfway through the panel thickness. Aluminum tabs were adhesively bonded to the
cracked region of the coupon and then pulled apart. The Mode I test measures theMode I-type fracture toughness (GIc). Figure 3 shows a schematic of the Mode I test
coupon.
The Mode II test coupons originated from the same panel from which the Mode I
coupons were machined. And, thus, the Mode II test coupons have the same "starter
crack." However, the Mode II coupons were tested in a 3-point flex mode with a span
of 4". As the crosshead is engaged, the "starter crack" lengthens. From the loads and
lengths recorded, a Mode II fracture toughness term is generated.
It is of particular interest with polymer matrix composites to understand how they will
survive in hot/wet environments. Table 2 shows that various coupons were moisture-
aged prior to testing at a range of temperatures. Three test temperatures were chosen(74 0F, 250°F and 3500 F) in order that the material's high-temperature behavior be
sufficiently examined. A specimen tested under "wet" conditions is one that has been
fully saturated with water. Individual specimens were
9

tIIN
N N
-LIN
5
SPECIFICATIONS
1- ALUMINUM4 T-TABS2- 6/32-INCH DIAMETER3- EXTENSOMIETER ADJUST
MENT SCPEW 8DIN4- TEFLON STARTER CRACK5- SPECIMEN (THIS SIDE
COVERED WITH TYPE-WRITER CORRECTIONFLUID AND) MARKEDEVERY ONE-HALF INCH,STARTING 2 INCHESFROM CENTER OF T-TAB)
Figure 3 Schematic of the Mode I Test Coupon.

saturated by placing them in a beaker of water in an oven whose temperature was set
at 1600F. All of the wet specimens were moisture-aged in three separate batches for
convenience. Samples from each batch wee weighed periodically and after a
sufficient amount of time had elapsed (when the weight increase was observed tolevel off), the specimens were removed for mechanical testing. Mechanical testing ofmoisture-aged specimens at high temperatures requires that the saturated specimen
remain at temperature no longer than 5 to 10 minutes. Any exposure beyond this tim,;
will drive the water from the specimen.
0°- P in Flex
00 3 F oirt F ex
PHOTOMICROGRAPH
900-4 pt. flex 2,)_ - 1or)
0~
S I" rt B e m Shbar C -
Figure 4 Panel #1: Cut-out Schematic of Flex and Shear Specimens.
11

A cutting-plan schematic was made for each panel so that specimen machiningwould be straightforward and efficient. Unfortunately, randomization of specimenlayout was not feasible as this would make the task of sectioning the panels inefficient.The cutting schematics of each of the six panels is shown in Figures 4 through 8.These plans were adhered to as rigorously as possible.
0 -4 Poi it lex
00-Tension 0 -3 oi it Flex
-r
0:_
0
0-
0L iRAh S eafea_ _he__r
Figure 5 Panel #2: Cut-out Schematic of Tension, Flex and Shear Specimens.
12

The methods for data reduction are given in the ASTM standards. They were
followed as prescribed. For the Mode I, Mode II and Edge Delamination tests, the datareduction schemes specified by the latest round robin version were followed.
0
0
00
FIiue Panels #3,6: Cut-out Schematic of In-plane Shear Specimens.
13

a.
00
0
0M(L
Figure.7 Panel #4: Cut-out Schematic of Edge Delamnination Specimens.
14

-1 Teflon Strip
Mode 1 0
I-0ModI
a.
EXTRA
Figure 8 Panel #5: Cut-out Schematic of Mode I and Mode II Specimens.
15
IV. EXPERIMENTAL RESULTS
A. Physical Properties Data
As the prepreg was being laid-up, it was noticed that it did not have much tack. In
addition, it appeared non-homogeneous in places (black in spots and shiny in others).
Figures 9 through 12 illustrate the results of the DSC, TGA and rheometrics data.
Figure 9 shows the heat of reaction for the ATB prepreg to be 28.5 mcal/mg. The
exotherm began at 2100C and peaked at approximately 2550C. Figure 10 shows the
onset of volatilization to begin at 1690C. The residual weight percent at 4000C is
94.9%. The onset of gelation occurs at approximately 2250C. (Figure 11: RDS of
prepreg section.) The RDS of the cured laminate section (Figure 42) shows the Tg to
read roughly 2950C with a torsional frequency equal to 1.6 Hz and a torsional strain of
0.08%.
The ultrasonic c-scans of the six panels appeared to have no delaminations or
voids; no anomalies were noticed. The photomicrographs taken from the panels at
150x and 300x displayed no unusually large voids or resin-rich areas. Representative
photographs from panel #5 are displayed in Figure 13. Density and fiber volume data
for all panels are listed in Table 4. Two specimens from panel #5 (5.a and 5.b) were
run as a check because the calculated percent fiber volume was lower than that of any
other panel. Both fiber volume calculations from panel #5 support the notion that this
panel is resin-rich, despite the fact that the panel's photomicrographs appear normal.
B. Mechanical Data
Table 5 is a summary sheet depicting the pertinent mechanical data obtained from
the test matrix. Included in this table are the percent fiber volume in the composite
coupons, the percent weight gain due to moisture absorption and the failure modes
from each test. For each row (or test), the strength, modulus, shear strength andfracture toughness properties represent averages of five specimens.
16

Sample: HYSOL AF8/XAS - Uperator: W. A. PRICESize, 9.4 mg 1) "S C Disk ID: %L1'Y6ER 49Run No: 1123 OMNITHERM DATA SYSTLM File No: :I C. !,T .,: .Date: NOV/19/87 09: 10 Plottod: N[&.i' 9",'87 [O: UI
------ 4---4 --- -4-- -1---4 -4- --- -A--- ---- --- 4 4- --4- -4 1 4 4 4 -A-6.74 BATCH# LH946
25 4. 6 C "
II* MEIHO) *
SAMPLE RATIE- 6 +AT- 2E 50) acl 9
#START FINAJ RATE TIME GAS
-9.1 1 20 400 10 NIT
(P3a'-1
-9.26
E
t U--9. 8 2+'
-10. --4 + - 4 ---, -- -*----- - --- +--- ---.-.-- +- ....-------- - -4- .... _ -- - --- -..
20 60 100 140 180 220 260 300 340 380 42 0 46UTemp (eq C)
Figur Differential Scanning Calorimeter Trace of XAS/AF-8 Prepreg.
17

Somp1e: HYSOL A-B,'XAS Oporotor: W.A. PRICESi ze: 1 1. 7271 m T G ,'A Disk 103 NUMBER 49Run No,: 1 -;43 7 - H TLFI3 ,R .
Ru >i: - J•T1 _F,, DATA SYSTEM FIle o: D 40. DAT 'Date: [)EC/10,al 15: 01 Plotted: DEC/10/87 '.:3
-) - -4 -4 A --4 - 4 4 +-- - -4 -- - -4 4 -4 -4112. D BATCH #LH946
I~ a2. alflck158.8 0C
4.554 x(11.2) 227 7 OC9 6. Oci t; 249.3 °C 94.92% RssId,
( " . ) - * METHOD .
Fj4. , T "SAMPLE RATE- 8
T START FINAL RATE TIME GAS- . 1 20 400 14 NIT
48. oaT -
C 3.7). .T
32. nO L
to.. I-16. 00t
i.0)
+ --- - -- - 4 - -- - 4- - - + - -j
2 60 i10 140 180 220 260 300 340 380 4210 460
Temp (Dog C)
FiguLe10 Thermogravimetric Analysis of XAS/AF-8 Prepreg.
18
RMS87067 XAS/ATB PP 0-350/350-25 LN2
hODEI]_ _ _ _ _ _ _ _ __ _ _ _ _ _ _ I.0E5
/k
// ~~i'
.I.OE3~, 1.fE0 TEMPRATUR 4.IE
haur I Rhemetic utpu ofXASAF-8PrerJg
19

RMS87068 ATB/'XAS PC O-350,'350-OC LN2
1.0E OEI.
STEMPERATURE 4. 0E2
Figure 1 Rheometric Output of AS-cured XAS/AF-8 Laminate.
20

2'.4/. **
.. .. #
150 x 300 x
Figure 13 Photomicrographs of XAS/AF-8 Panel #5.
Table 4 Density And Fiber Volume Data For XAS/AF-8 Panels.
Specific Specific Specific Percent Fiber Percent MatrixPanel Gravity Gravity of Gravity of of Specimen of Specimen
Number of Specimen Fiber Matrix (by volume) (by volume)
1 1.60 1.79 1.21 63 372 1.59 1.79 1.21 63 373 1.59 1.79 1.21 63 374 1.59 1.79 1.21 62 38
5.a 1.57 1.79 1.21 59 415.b 1.56 1.79 1.21 58 426 1.59 1.79 1.21 62 38
A plot of the average specimen weight gain versus time for the three batches of
moisture-aged specimens is shown in Figure 14. Each batch of specimens achieved
100% saturation in approximately 40 days.21

Table 5Completed >echanical Test Matrix for XAS/AF-8 Composite
Percent Temperature Moisture ILSTest Fiber by (IF) Gain Strength Modulus Strength Failure Comments
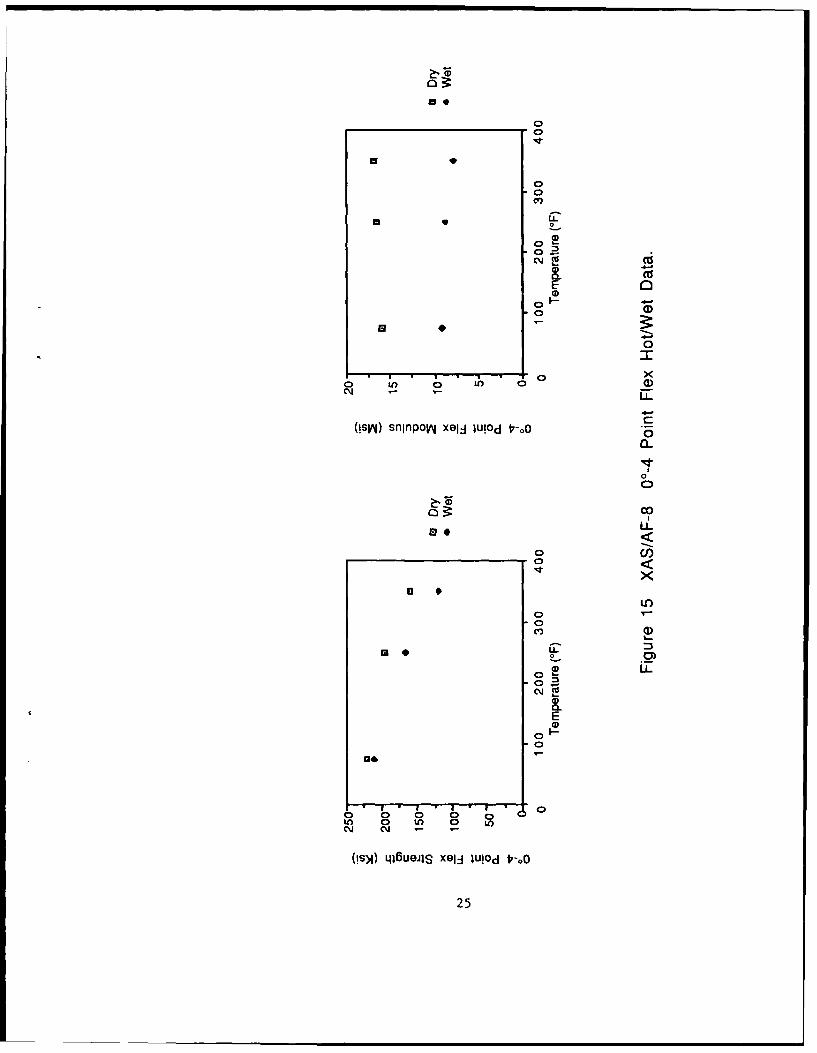
Volume 74 250 350 (Percent) (Ksi) (Msi) (Ksi) Mode0'-4 Pt. Flex 63 Dry 220 16.0 J
Dry 196 16.6" Dry 160 16.8 "" Wet 0.75 210 9.1 "
Wet 0.75 166 8.8 "
Wet 0.75 119 7.80°-3 Pt. Flex Dry 234 15.3 21
Dry 197 14.8Dry 169 15.1
Wet 0.75 229 15.3Wet 0.75 199 15.6
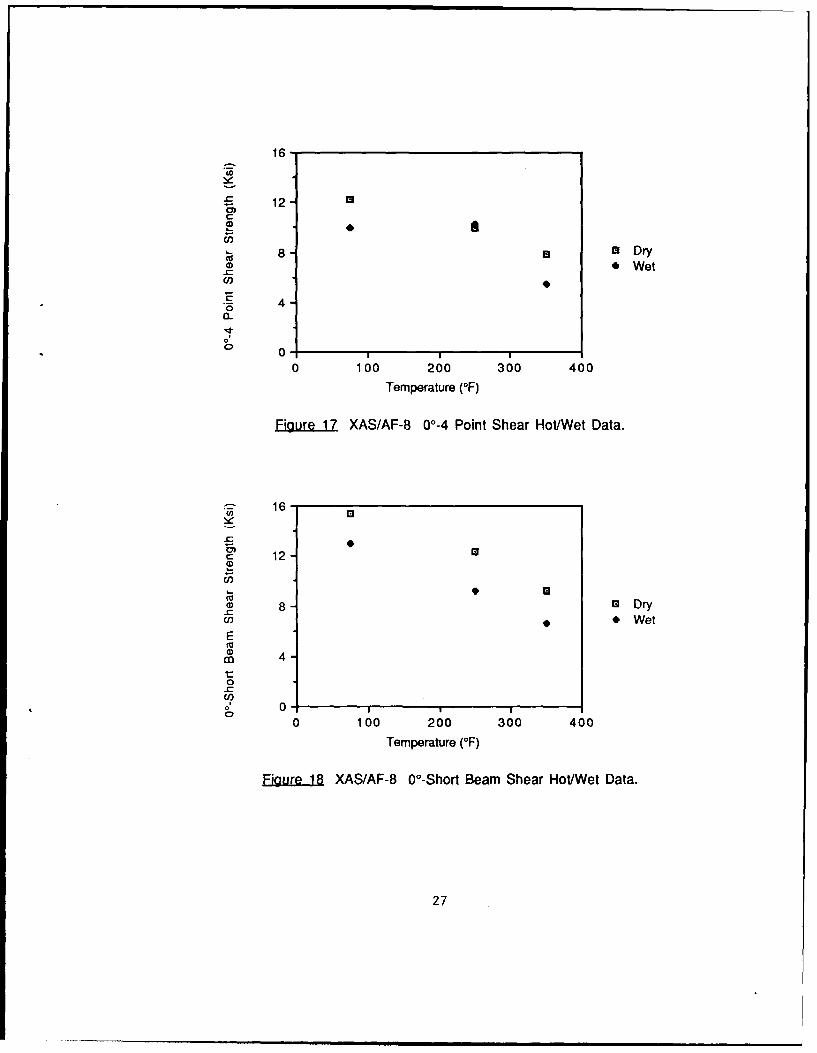
Wet 0.75 142 14.701-4 Pt. Shear Dry 12.2 [3]
Dry 99 Dry 7.8
Wet 0.75 10.0 4 _
Wet 0.75 10.3Wet 0.75 5.4 "
0°-SBS Dry 15.4 _
Dry 12.3Dry 9.2
Wet 0.63 13.0Wet 0.63 9.2
" Wet 0.63 6.690'-4 Pt. Flex "_Dry 10.0 1.5 151
Wet 0.83 7.1 1.5Mode II 58 Dry' [61 [A)
0"-Tension 63 Dry 292 19.3 [7_ [B]t/-45' Tension 63 Dry 9.3 0.71 [81 jC]
63 Dry 9.4 0.47 [D]62 Wet 0.93 8.9 0.81 [E
62 Wet 0.95 7.4 0.35 " [F]Eoge Delam. 63 Dry 41.6 6.1 1[1 [GJ
Mode l 58 Dry [10] [H1
[1] Mixed Mode: Compression & IA] Fracture Toughness = 6.53 in-lbiin^2
Interlaminar Shear (based on the compliance reduction method)[2] Compression [B] Strain to Failure = 0.014 in./in.[3] Interlaminar Shear [C] Strain to Failure = 0.034 in./in.[4] Compression Buckling [D] Strain to Failure = 0.027 In./in.[5] Tension [E] Strain to Failure = 0.033 in./in.[6] Mode II Delamination [F] Strain to Failure = 0.033 in./in.[7] Complete Splintering of test coupon [G] Stress at Delamination = 18.0 Ksi[8] Inplane Shear Strain to Failure = 0.011 in./in.[9] Mixed Mode: Modes 1,11 Delamination [H] Fracture Toughness = 2.22 in-lb/in^2
[10] Mode I Delamination (based on the empirical reduction method)
22

0.80
0.6
* 0.4.aM
0.2 Batch #1
0 .0 - - ,0 20 40 60 80
Time (days)
1.0~
0.8
Cd 0.6 n 0.64%0. 0.6-
0.4 0
0.2 Batch #2
0 .0
0 20 40 60 80Time (days)
1.0-
0.8 a [ 082%
0 0.6 .
S 0.4
0.2 Batch #3
0.0 *IP
0 20 40 60 80Time (days)
FiourJ Moisture Weight Gain Versus Time For Three Batches of XAS/AF-8.
23

V. DISCUSSION
A. Physical Test Data
The relatively low fiber volume of panel #5 can be attributed to the panel's
thickness. Panel #5, being 24 plies thick, was autoclave cured with the same number
of bleeder plies used on the rest of the panels. Thus, some excess resin remained in
Panel #5 as it cured, causing its fiber volume fraction to be lower than expected.
Consider the average percent weight gains for the three moisture-aged batches.
Table 6 compares the typical specimen size of each batch with the final average
percent weight gain of that batch. As the specimen size increases, the percent weight
gain also increases, suggesting that moisture absorption is a function of the specimen
geometry.
Table 6 Comparison of Specimen Size With Average PercentWater Absorption for XAS/AF-8 Specimens.
Nominal Coupon Geometry Average PercentBatch Length Width Thickness Weight Gain
Number (in.) (in.) (in.) @ 100% Saturation
2 1.0 0.5 0.07 0.641 3.0 0.5 0.07 0.753 9.0 1.0 0.05 0.82
B. Mechanical Test D=t
The hot/wet data of Table 5 is reproduced graphically in Figures 15 through 19.
Both strength and modulus are plotted as a function of temperature and percent water
weight gain. These figures show tremendous reduction in properties from room
temperature/dry conditions to 3500F/100% H20 saturated conditions for almost every
parameter investigated. Thus, the manufacturer's claim of resilient hot/wet properties
is questioned.
24
(D
030
0
01~ 4-
(!~q nlpo4x~zlll~ t-0 0
*00
0 l
c'rJ
m 0~0 .0)
0-2
oCC4
UE(D)
* . 0 in0)LC*4 CM -
(!S)) 41MIS GIJ ul~dirLL
25E

UCV
0
EUE
0
00
CV)
0
00~ ~ <,0 U
00
C)v00
T LLo .
(D.
o 0)0 0U) 0 O
C~j 0'-
OSA)ql~uJlS ~l~llulc'J--
26a
16
12-
0)
Fu WetC"-
0 M
E
o
o 4 _ _ _ _
0 100 200 300 400Temperature (°F)
Fiaure 1 XAS/AF-8 0-4 Point Shear Hot/Wet Data.
16-
c 12 U
O 8 0 Dryr'-o • •Wet
E(U0
0-
0 0 10O0 200 300 400
Temperature (°F)
Fiour 18 XAS/AF-8 0°-Short Beam Shear Hot/Wet Data.
27

030
0
E
00M-
(!1~)sninpo~yjP94eS eueld-ul /
asCL
Cf)
00
a. c
EW0Cl
a *)
0 0
(!s4)qluejS eeS eel- o
28 U

C. Comparison IQ Manufacturer's D=
Of the manufacturer's mechanical data reported on the XAS/AF-8 system, only afraction overlaps with and is, thus, comparable to the data generated under thisresearch effort. That portion of the manufacturer's data is reported in Table 7 6. Much
of the Hysol mechanical data are higher than that recorded in-house. Hysol's tensiledata, flex data, in-plane shear strength, and delamination strength are all higher thanour data. The interlaminar shear data reported by Hysol are approximately equal tothe in-house data, perhaps slightly lower at the wet conditions. We report a highervalue for Mode I as compared to Hysol, but this may be due to fiber bridging. Overall,
the Hysol values appear higher than documented here. Whether or not this differenceis significant is as yet undetermined. The higher values are not the result of anunusually high fiber volume fraction because Hysol reports Vf= 61 ±1%.
Table 7 A Portion of Hysol's XAS/AF-8 Mechanical Data.
Temperature ILS FractureTest (OF) Strength Modulus Strength Toughness
74 250 350 (Ksi) (Msi) (Ksi) in-lb/inA2)00 Flex Dry 258 17.5
Dry 219 17.7Wet 245 17.6
____ ___ ___Wet 146 16.9_ _ _ _ _
00 IL Shear Dry Wet 14.2Dry 8.0
Wet 15.4Wet 6.5
900-4 Pt. Flex Dry 11.60°-Tension Dry 322 20.8
+/-450 Tension Wet 17.0 0.35Edge Delam. Dry 23.2*
Mode I Dry 1.8
* Stress at delamination
The Hysol final technical report states that their moisture-aged coupons gained, onthe average, only 0.04% in weight over the first 7 days. Contrast this value to anaverage value of 0.54% reported by our research (see Figure 14). Perhaps it is thisincrease in moisture absorption which is responsible for the decrease in hot/wet
2)

properties. There is no reasonable postulation at this time why our coupons gained
more water than Hysol's coupons.
D. Comparison to Alternative Toughened AT System
Table 8 Completed Mechanical Test Matrix For T-300/CATB-44
Percent Temperature Moisture ILS FractureTest Fiber by (OF) Gain Strength Modulus Strength Toughness
Volume 74 250 350 (Percent) (Ksi) (Msi) DKsi) (in-lb/inA2)00-4 Pt. Flex 61 Dry 247 17.5
_ Dry 195 17.1" Wet 0.93 222 16.7
_ Wet 0.93 128 16.500-3 Pt. Flex " Dry 234 14.5
_ Dry 203 15.2" Wet 0.88 240 19.7" Wet 0.88 166 7.6
00-4 Pt. Shear " Dry 12.4
65 Dry 8.861 Wet 1.03 11.765 Wet 1.03 5.3
00-SBS 61 Dry 13.9_ Dry 10.7" Wet 1.05 13.3
" Wet 1.05 7.3900-4 Pt. Flex 61 Dry 8.7 1.5
61 Wet 0.91 6.9 1.5Mode 11 Dry 1.64
00-Tension 61 Dry 241 17.3+/-451 Tension 64 Dry 10.1 0.95
64 Dry 10.9 0.9364 Wet 1.48 6.8 0.58
Edge Delam. uDry J 19.4"Mode I Dry 0.59
* Stress at delamination
Table 8 shows the mechanical data reported by Curliss 7 on American Cyanamid's
"toughened" acetylene-terminated resin system. The mechanical tests which are mostimportant in quantifying the materials hot/wet and toughness properties are the flexure,shear, ±450-tension and Mode I tests. In comparing the two data sets, it appears asthough the flex and shear properties show similar strength and modulus reductions asa function of increasing temperature and water gain. The Mode I data from the
30

XAS/AF-8 system is much higher (by a factor of four) than that of the T-300/CATB-44
system. Again, the unusually high Mode I value may be the result of fiber bridging.
However, this piece of data initially suggests that Hysol's toughening system is more
effective than American Cyanamid's system.
31

VI. CONCLUSIONS
The procedures used to fabricate the composite laminates from the XAS/modifiedATB prepreg were followed rigorously. Strict standards were followed whereapplicable. And, consistent procedures were followed where standards had yet to bewritten. The laminate physical data appeared relatively normal, suggesting that themechanical data is a valid (but limited) profile of the material's intrinsic properties.Direct comparison of mechanical test data between two materials can be difficultbecause oftentimes key particulars associated with the test are not reported. Thespan-to-depth ratio of flexural tests, the failure modes on all tests and percent fibervolume data are all necessary in order to make a reasonable comparison between
materials.
The XAS/AF-8 system falls short of its supposedly improved hot/wet properties.However, the material's Mode I fracture toughness remains intact. Contrast this data toprevious claims that AT systems are, in general, unmanageable in the lay-up stages,difficult to process and brittle. From all of this it appears as though the tougheningprocess has yet to be optimized. Further investigations looking to optimize the AT'stoughness--hot/wet trade-off may wish to concentrate on the problem of high moisture
gain.
32

VII REFERENCES
1. Browning, C. E., The Mechanisms of Elevated Temperature Property Losses In
Epoxy Matrix Composites After Exposure To High Humidity Environments, Doctoral
Thesis, University of Dayton, 1976.
2. Hedberg, Frederick L., Polymer Chemist, Materials Laboratory, Wright-PattersonAir Force Base, Ohio; In-house memorandum, 1987.
3. Whitney, J. M., Browning, C. E., On Short Beam Shear Tests for CompcsiteMaterials, Experimental Mechanics, Vol. 25, No. 3, 294-300, September 1985.
4. Wagner, P. R., Use Of The Four Point Flex Test for Examining The CompressionStress-Strain Behavior Of Unidirectional Composites, 34 th International SAMPESymposium, May 8-11, 1989.
5. Whitney, J. M., Husman, G. E., Use of the Flexure Test for DeterminingEnvironmental Behavior of Fibrous Composites, Experimental Mechanics, Vol. 18, No.5, 185-190, May 1978.
6. Steiner, Paul A., McKillen, John M., Dexter Hysol Final Report for Work
Performed Under USAF Contract F33615-84-C-5115.
7. Curliss D. B., Physical And Mechanical Properties of American Cyanamid's
Acetylene-Terminated Prepreg System: T-300/CATB-44, AFWAL-TR-88-4243.
33 *U.S. GOVERNMENT PRINTING OFFICE: 1989 -74-056/24011