characterization of commercial plgas by ... - research square
TRANSCRIPT

Characterization of Commercial PLGAs by NMRSpectroscopyJing Sun
University of MichiganJennifer Walker
University of MichiganMoritz Beck-Broichsitter
Merck KGaASteve Schwendeman ( [email protected] )
University of Michigan
Research Article
Keywords: PLGA, blockiness, block length, degradation, NMR spectroscopy.
Posted Date: March 30th, 2021
DOI: https://doi.org/10.21203/rs.3.rs-325988/v1
License: This work is licensed under a Creative Commons Attribution 4.0 International License. Read Full License
Version of Record: A version of this preprint was published at Drug Delivery and Translational Researchon August 20th, 2021. See the published version at https://doi.org/10.1007/s13346-021-01023-3.

Characterization of Commercial PLGAs by NMR Spectroscopy
Jing Suna, Jennifer Walkera, Moritz Beck-Broichsitterb and Steven P. Schwendemana, c*
a Department of Pharmaceutical Sciences and the Biointerfaces Institute, University of Michigan, North Campus Research Complex, 2800 Plymouth
Road, Ann Arbor, MI, 48109, United States;
b MilliporeSigma a Business of Merck KGaA, Frankfurter Strasse 250, D-64293, Darmstadt, Germany;
c Department of Biomedical Engineering, University of Michigan, 2200 Bonisteel Ave., Ann Arbor, MI, 48109, United States.
* Corresponding author. Department of Pharmaceutical Sciences and the Biointerfaces Institute, University of Michigan, North Campus Research
Complex, 2800 Plymouth Road, Ann Arbor, MI, 48109, United States. E-mail address: [email protected] (S.P. Schwendeman).

Abstract
Poly(lactic-co-glycolic acid) (PLGA) is among the most common of biodegradable polymers studied in various
biomedical applications such as drug delivery and tissue engineering. To facilitate the understanding of the often
overlooked PLGA microstructure on important factors affecting PLGA performance, we measured four key
parameters of 17 commonly used commercial PLGA polymers (Resomer®, Expansorb®, Purasorb®, Lactel®, and
Wako®) by NMR spectroscopy. 1HNMR and 13CNMR spectra were used to determine lactic to glycolic ratio (L/G
ratio), polymer end-capping, glycolic blockiness (Rc), and average glycolic and lactic block lengths (LG and LL). In
PLGAs with a labeled L/G ratio of 50/50 and acid end capping, the actual lactic content slightly decreased as molecular
weight increased in both Resomer® and Expansorb®. Whether or not acid- or ester-, termination of these PLGAs was
confirmed to be consistent with their brand labels. Moreover, in the ester end-capped 75/25 L/G ratio group, the
blockiness value (Rc) of Resomer® RG 756S (Rc: 1.7) was highest in its group; whereas for the 50/50 acid end-capped
group, Expansorb® DLG 50-2A (Rc: 1.9) displayed notably higher values than their counterparts. Resomer® RG 502
(LL: 2.6, LG: 2.5) and Expansorb® DLG 50-2E (LL: 2.5, LG: 2.6) showed the lowest block lengths, suggesting they
may undergo a steadier hydrolytic process compared to random, heterogeneously distributed PLGA.
Key words: PLGA, blockiness, block length, degradation, NMR spectroscopy.

Graphical Abstract
G LX Polymer Chain Termination
X=OH or n
L/G Ratio
PLGA Microstructure Variations: Characterization by NMR
Block Length, Blockiness
GL L G L G
GL G LG
L
G
Alternating
Increased blockiness and
block length L

1. Introduction
Polymeric biomaterials are widely used in commercial biomedical products in the past several decades.1, 2
Poly(lactic-co-glycolic acid) or poly(lactide-co-glycolide) (PLGA) is a thermoplastic co-polyester comprised of
various ratios of its monomers and is hydrolyzed in vivo into non-toxic lactic and glycolic acid, that are metabolized
in the tricarboxylic acid cycle and eliminated via carbon dioxide and water.3-5 Due to its biocompatibility,
biodegradability, and ease of processing, PLGA has been further developed in areas such as tissue engineering (e.g.,
bone regeneration,6-9 wound dressing,10-12 vascular grafting13, 14), medical imaging,15, 16 and drug delivery,17-19
especially for long-acting release formulations.20-22 Several widely used PLGA-based commercial medical devices 23
and drug products have also been developed, such as Supralimus®,24 a coronary sirolimus-eluting stent coated with a
blend of PLGA/PLA/PVP, and the Lupron Depot® microspheres and Zoladex® implant,25, 26 both of which are
luteinizing hormone-releasing hormone analog, continuous long-acting release formulations.
Nuclear magnetic resonance (NMR) spectroscopy, the physical phenomenon of nuclei in a magnetic field first
observed by F. Bloch and E.M. Purcell who received the Nobel Prize in physics in 1952,27, 28 has been explored in
various areas such as pharmaceutical analysis and clinical diagnostics.29 Similar to other forms of spectroscopy, NMR
spectra results from the transitions between different energy states of the dipole-carrying atomic nuclei isotopes (1H,
13C, 15N and 31P).30, 31 NMR technology is highly specific, precise, and non-invasive, and thus, is well-established for
structural elucidation and confirmation of small to large molecules.32-34 Combined with quantitative analysis, NMR
methods have been further used in pharmaceutics and pharmacokinetics to determine composition, impurities, and
metabolites.35, 36 Another sub-field in which NMR is heavily applied is polymer science. Typically, copolymers are
comprised of different repeating monomers which possess a wide range of mechanical and biological properties.37, 38
As an example, NMR can be used to determine the polymer molecular weight, component ratios, monomer sequences,
and microstructure,39 all of which affect both in vitro and in vivo behavior of polymers. Furthermore, several studies
have used NMR spectroscopy to characterize copolymers such as PLGA to determine their solubility, amphiphilicity
and hydrolysis mechanism/rate.40-42 As an example, Garner et al.43 have reported an analytical protocol to confirm the
key properties of PLGAs used in commercial drug products, namely the ratio of lactic and glycolic acid (L/G ratio)
and nature of polymer end-capping.

Microscopic PLGA properties such as L/G ratio, molecular weight and end-capping, are primary polymer factors
impacting the subsequent behaviors of PLGA formulations such as their degradation and drug release behavior.44
Beyond these polymer properties, there are manufacturing and formulation variables such as formulation processes,
size/geometry, presence of excipients, and the drug itself that all serve a considerable role in product performance, but
the scope of this research is to investigate fundamental polymer properties.45, 46 The PLGA microstructures such as
monomer sequence distribution along the polymer chain, described by the block length and blockiness, is often
overlooked and rarely reported, though it is expected to have an effect on the hydrolytic degradation profile. The
blockiness of PLGA measures the relative occurrence of glycolyl-glycolyl compared to glycolyl-lactyl linkages while
the block length measures the average length of the glycolic and lactic linkages in one segment.47 The increased
reactivity of glycolic monomers has been previously studied and Vey et al. determined that the glycolic unit (G-G
bond) consistently hydrolyzes 1.3 times faster than the lactic unit across different L/G ratio polymer films submerged
in phosphate buffer.48-50 Due to the increased reactivity of the glycolic-glycolic linkage, the increase in blockiness or
block length will lead to an accelerated hydrolysis of PLGA. It was recently reported that sequenced PLGAs with a
“true” alternating microstructure,51 exhibited a slower swelling, more gradual loss of molecular weight and a longer
preservation of morphology compared to the more ‘blocky’ counterparts synthesized by ring-opening polymerization
(ROP).
As a commonly used non-toxic biomaterial in many FDA-approved products, various commercial PLGA
polymers across different brands and with different features (MW, L/G ratio, and end-capping) have been widely
investigated. However, for many of these commercial PLGA polymers, properties such as block length and blockiness
remain unclear and have yet to be systematically analyzed. Hence, in this work, using NMR spectroscopy as an
accurate method, we investigated 17 commonly-used PLGAs to compare separated into 4 different groups of similar
composition, and obtained four critical chemical properties, namely L/G ratio, end-capping, blockiness and block
length. We compared the different polymer portfolios of 5 manufacturers, Expansorb®, Resomer®, Purasorb®, Lactel®,
and Wako®. Not all manufacturers had the same breadth of polymers available, e.g., there are not two polymers from
Expansorb® to compare with Lactel®, thus not all brands were compared in each group. The potential impact of these
data on physicochemical properties such as degradation is discussed and will be investigated directly in future
publications and depth analysis of erosion behavior and drug release properties of these polymers. Hence, these results

could help bridge the gap between the parameters obtained from PLGA microstructures and subsequent performance,
providing guidance for further biomedical and drug delivery applications.
2. Materials and methods
2.1. Materials
All Expansorb® polymers were provided by Merck KGaA (Germany). Resomer® and Purasorb® polymers, Wako®
7515 and Lactel® DL-PLG B6007-2 were purchased from Sigma Aldrich (US), Corbion (The Netherlands), Wako
Pure Chemical Industries, Ltd (Japan) and Lactel (US), respectively. All polymers used in this investigation were the
racemic (D,L) form of lactide or lactic acid. Table 1 summarizes the polymers utilized/analyzed in this study.
Deuterated chloroform, deuterated benzene, and ColorSpec® NMR tubes (5 mm × 7 in, parameter 800 MHz frequency)
were acquired from Sigma Aldrich (US). Hexafluoro-isopropanol was from Supelco Ltd (US).
2.2. Nuclear magnetic resonance (NMR) spectroscopy
NMR scanning was performed using a Varian vnmr-500 MHz (11.7 Tesla) Premium Shielded NMR spectrometer
(US) running Vnmrj software (the NMR Facility of the University of Michigan Chemistry Department, US) for
1HNMR and 13CNMR. NMR spectra are available in the Supporting Information.
2.2.1. Lactic/glycolic ratio (L/G ratio) calculation
Each PLGA sample was weighed out (~5 mg) and dissolved in deuterated chloroform (CDCl3) (0.5 mL), then
pipetted into an NMR tube. The spectrum of every sample was collected by 1HNMR spectroscopy (16 scans, 0.5 s
relaxation delay, and 45-degree pulse angle). L/G ratios were determined by comparing proton intensities at chemical
shifts 5.2 ppm and 4.8 ppm.43 The peak at 5.2 ppm represents a single proton of the lactic unit while the peak of 4.8
ppm represents two protons of the glycolic unit. Hence the mole fractions of lactic (mL) and glycolic (mG) units were
calculated from peak integrations (p) of each component, as shown below:

2.2.2. End-capping analysis
Each PLGA sample was weighed (~15 mg), dissolved in deuterated chloroform (CDCl3) (0.75 mL), and then the
resulting polymer solutions pipetted into an NMR tube. The end-capping of PLGA polymers were confirmed by
13CNMR. The relative molecular weight of the ester end-cap is smaller than the PLGA polymer, thus, the signal
collection should be performed with the maximized signal-to-noise ratio. A Z-restored spin-echo pulse sequence was
used with a 30-degree observation pulse, a 3-s inter pulse delay, and a 0.55-s data acquisition time and a total of 12,000
scans were acquired over 12.5 h.52 Generally, PLGA polymers have two types of end caps: ester and acid end caps. In
the 13C NMR spectrum, methyl units at the end of the alkyl chain appear very far upfield at a chemical shift of 14 ppm,
which is used to confirm an ester end-capping of PLGA polymer. Acid end-capping was confirmed by the absence of
this ester-specific peak at 14 ppm in their NMR spectrum.43
2.2.3. Blockiness analysis
The blockiness was determined by high-resolution 13CNMR.43 These spectra were collected from 50 mg/mL
polymer solutions (25 mg) in CDCl3 (0.5 mL). These spectra were analyzed for the different monomer sequence
distributions. This was done by using a pulse sequence without NOE enhancement, and employing a 30-degree 13C
observe pulse, a 2.0 s inter-pulse delay, a 4.6 s relaxation delay, and a 0.4 s acquisition time. Total acquisition time
was approximately 4 h and 50 mins to give an accurate signal-to-noise ratio.
Blockiness represents the heterogeneity of PLGA and is determined by the glycolic unit sequence distribution
according to the glycolic carbonyl group located in the chemical shift 166-167 ppm in high-resolution 13CNMR
spectrum. The upfield G-G peak (IG-G) represents the glycolyl-glycolyl carbonyl; while the downfield G-L peak (IG-L)
represents a glycolyl-lactyl carbonyl. Blockiness values can be calculated according to two methods. One is calculated
by the definition of Skidmore et al.,53 in which Rc value is obtained by the ratio of IG-G to IG-L; while the other is
reverse Rcms (the ratio of IG-L to IG-G) by the definition of Hausberger and DeLuca44 representing the ratio of the two
carbonyl peaks. Here, we use the Rc value to describe blockiness.

2.2.4. Block length analysis
The block lengths were determined by high-resolution 13CNMR.54 Each PLGA sample was weighed (20 mg) and
dissolved in a mixture of hexafluoro-2-propanol (10 mg/mL) for enhanced dissolving capacity and deuterated benzene
for the lock signal (V/V=5/1), and then solutions were pipetted into a NMR tube. The number of transients was 5000,
with a relaxation delay of 10 s. The average sequence lengths in monomer units L and G, which could be calculated
from the relative dyad splitting intensities of the carbonyl carbon of the lactyl-lactyl, lactyl-glycolyl, glycolyl-glycolyl
and glycolyl-lactyl signals (IG-G, IG-L: signal intensities of glycolyl-glycolyl and glycolyl-lactyl bonds; IL-L, IL-G: signal
intensities of lactyl-lactyl and lactyl-glycolyl bonds at chemical shift ~172 ppm and ~169 ppm):
3. Results and discussion
3.1. Lactic/glycolic unit ratio (L/G ratio) calculation
In the molecular properties of PLGA polymers, the L/G ratio is an important factor determining its macroscopic
properties. Lactic acid units are more hydrophobic than glycolic units, so the hydrophobicity of PLGA polymer
increases with an increasing L/G ratio in the non-crystalline groups of racemic PLGA 50/50 to 100/00, leading to
different properties and behaviors.43 For instance, in T.G. Park’s study of PLGA degradation,55 PLGA 50/50
microspheres (polymer manufacturer: Medisorb) exhibited very sharp Tg peaks around 120-130oC at day 14 and broad
Tg peaks at day 33; whereas PLGA 70/30 microspheres (polymer manufacturer: Polysciences) showed multiple small
Tg peaks at day 14. These results imply that crystallization was generated due to different degradation processes
associated with an increasing lactic unit content. The lactic-lactic bond is also more stable than the glycolic-glycolic
bond as further supported by the relative stability of the lactyl-lactic acid dimer in water relative the linear dimer of
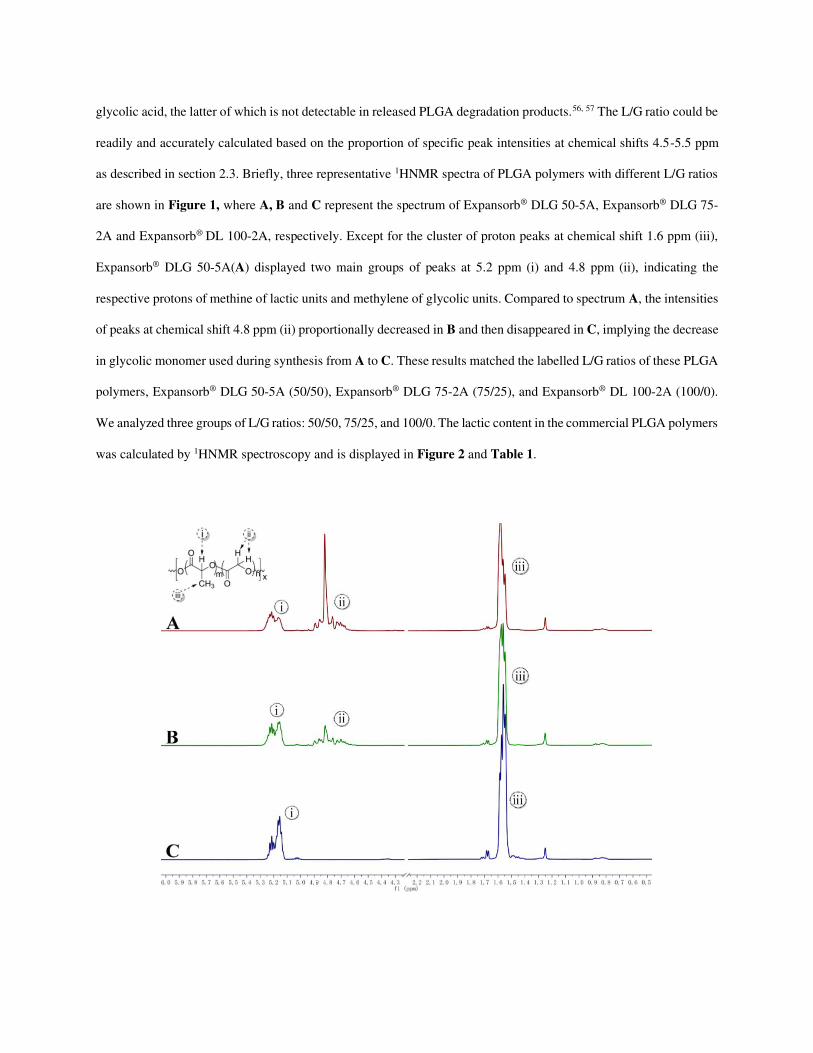
glycolic acid, the latter of which is not detectable in released PLGA degradation products.56, 57 The L/G ratio could be
readily and accurately calculated based on the proportion of specific peak intensities at chemical shifts 4.5-5.5 ppm
as described in section 2.3. Briefly, three representative 1HNMR spectra of PLGA polymers with different L/G ratios
are shown in Figure 1, where A, B and C represent the spectrum of Expansorb® DLG 50-5A, Expansorb® DLG 75-
2A and Expansorb® DL 100-2A, respectively. Except for the cluster of proton peaks at chemical shift 1.6 ppm (iii),
Expansorb® DLG 50-5A(A) displayed two main groups of peaks at 5.2 ppm (i) and 4.8 ppm (ii), indicating the
respective protons of methine of lactic units and methylene of glycolic units. Compared to spectrum A, the intensities
of peaks at chemical shift 4.8 ppm (ii) proportionally decreased in B and then disappeared in C, implying the decrease
in glycolic monomer used during synthesis from A to C. These results matched the labelled L/G ratios of these PLGA
polymers, Expansorb® DLG 50-5A (50/50), Expansorb® DLG 75-2A (75/25), and Expansorb® DL 100-2A (100/0).
We analyzed three groups of L/G ratios: 50/50, 75/25, and 100/0. The lactic content in the commercial PLGA polymers
was calculated by 1HNMR spectroscopy and is displayed in Figure 2 and Table 1.

Figure 1. Characteristic proton peaks of PLGA polymers in 1HNMR spectra (CDCl3, 500 MHz). A, B and C represent
the spectra of three PLGAs with L/G ratio of 50/50, 75/25 and 100/0, respectively (Expansorb® DLG 50-5A,
Expansorb® DLG 75-2A and Expansorb® DLG 100-2A). Labels corresponding to the peaks of (i) and (iii) are the
protons of methine and side methyl groups in lactic mer units, respectively; (ii) protons of methylene in glycolic mers.
Table 1. Macromolecular properties of commercial PLGA polymers.
Brand & product
Labelled
lactic
acid %
Molecular
weighta
kDa
Inherent
viscosityb
dL/g
Lot No.
End-cap
Average block
length
LL LG
Expansorb® DLG 50-2E 50 17 0.21 C100011425 Ester 2.5 2.6
Expansorb® DLG 50-2A 50 13 0.19 PP10056489 Acid 4.4 4.2
Expansorb® DLG 50-5A 50 48 0.47 PP10059967 Acid 4.0 4.0
Expansorb® DLG 75-9E 75 136 0.95 C100011427 Ester 6.7 2.4
Expansorb® DLG 75-2A 75 8 0.12 PP10056560 Acid 6.9 2.5
Expansorb® DL 100-2A 100 14 0.18 PP10059963 Acid NA NA
Resomer® RG 502 50 14.7 0.20 BCCB0256 Ester 2.6 2.5
Resomer® RG 502H 50 14 0.22 BCBZ7916 Acid 3.0 3.0
Resomer® RG 504H 50 52.9 0.57 BCBX4108 Acid 2.9 2.9
Resomer® RG 756S 75 NR 0.90 BCBZ4420 Ester 5.8 1.7
Resomer® RG 752H 75 13.4 0.22 BCBw4713 Acid 8.5 2.6
Resomer® R 202H 100 16.9 0.24 BCBV6665 Acid NA NA
Purasorb® PDLG 5004A 50 NR 0.37 1110001124 Acid 3.4 3.2

Purasorb® PDLG 7502A 75 NR 0.19 1802003617 Acid 7.8 2.7
Purasorb® PDL 02A 100 NR 0.22 1703003820 Acid NA NA
Wako® 7515 75 NR 0.18 TWO.1257 Acid 10.6 1.4
Lactel® DL-PLG B6007-2P 75 NR 0.81 A17-068 Ester 5.5 2.1
aMW reported from manufacturer certificate of analyses, determined by GPC. bExpansorb® i.v.: 0.5% in chloroform,
25°C. Resomer® inherent viscosity (i.v.): 0.1% in chloroform at 25°C. Purasorb® PDLG 5004A i.v.: 0.5 g/dL in
chloroform at 25°C. Purasorb® PDLG 7502A, and Purasorb® PDL 02A i.v.: 1 g/dL in chloroform at 25°C. Lactel®
i.v.: 0.5 g/dL in chloroform at 30°C. Wako i.v. method not reported. NR=not reported.
Figure 2. Calculated molar lactic acid content (%) of different branded PLGAs as assessed by 1HNMR spectroscopy
(CDCl3, 500 MHz). A, B and C represent these groups of PLGAs with L/G ratio of 50/50, 75/25 and 100/0,
respectively.
From the data set described, some notable trends were observed, although clearly a higher quantity of lots and/or
polymer molecular weights would be needed for more definitive conclusions. The first trend observed was that for
L/G ratio of 50/50 (Figure 2A), the lactic content decreased as the molecular weight (as reported in the product

certificate of analysis) increased when compared within the same manufacturer. For example, the L/G ratio of
Resomer® RG 502H (14 kDa) > Resomer® RG 504H (52.9 kDa) and Expansorb® DLG 50-2A (13 kDa) > Expansorb®
DLG 50-5A (48 kDa). A second trend was observed where Resomer® polymers with ester end-capping displayed a
higher lactic content than their comparable polymers with acid end-capping, e.g., L/G of Resomer® RG 502 >
Resomer® RG 502H. For L/G ratios of 75/25 (Figure 2B), Resomer® polymers were found to most closely match the
listed L/G ratio, e.g., Resomer® RG 756S (75.25/24.75) and Resomer® 752H (75.26/24.74). In the L/G ratio 75/25
ester end-capped group, although the lactic content did not follow a trend with its MW or inherent viscosity (i.v.), the
lactic contents were lowest in these high molecular weight polymers, e.g., Resomer® RG 756S (i.v.=0.90 dL/g,
75.25/24.75) > Expansorb® DLG 75-9E (0.95 dL/g, 73.28/26.72) > Lactel® DL-PLG B6007-2P (0.81 dL/g,
72.53/27.47). For polymers with an L/G ratio of 100/0 (Figure 2C), Resomer® R 202H and Expansorb® DL 100-2A
displayed exactly 100% lactic content, although surprisingly, Purasorb® PDL 02A revealed a low level of glycolic
impurities (98.61/1.39). We also observed that the lactic content slightly decreased as the molecular weight of PLGA
increased, which could be attributed to the synthesis of the PLGA polymer. In either the ring-opening or direct
polycondensation, the PLGA product mainly undergoes three steps: chain initiation, chain growth and termination.
During polymerization, glycolic monomers are more reactive and add to the growing polymer chain easier than lactic
monomers.58 As the chain-length grows the molecular weight of the intermediate increases, leading to an increase in
steric hinderance at the hydroxyl reaction site.59 Thus, the higher the molecular weight and the longer the reaction
proceeds, there may be an increase in smaller chains forming where the more reactive glycolic monomers are
preferentially added compared to lactic monomers.60
When other factors such as molecular weight and concentration are similar among polymers, the L/G ratio could
affect the solubility of low molecular weight PLGA monomers, as the affinity with water increases as the content of
more hydrophilic glycolic monomers increases (L/G ratio decreased).43 Moreover, L/G ratio is well known to influence
the degradation rate of PLGA in vitro and in vivo.55, 61 As lactic content increases, this creates a more hydrophobic
and sterically hindered environment, thus hydrolysis of the PLGA is delayed.62, 63As reported,55 PLGA polymers with
different L/G ratios could degrade with very complicated morphological changes, such as decreases in Tg, appearance
of double glass transitions and evolution of crystalline melting peaks. Firstly, the ester bonds of the glycolic unit
(glycolic-glycolic acid) are preferentially cleaved compared to those of the lactic unit (lactic-lactic acid) due to its

inherent higher reactivity with water and/or its greater hydrophilicity; secondly, compared to the more hydrophobic
PLA (PLGA 100/0), the amorphous PLGA is considered to possess a greater extent of water hydration. For these
reasons, it could be concluded that PLGA with low L/G ratio would undergo a faster degradation than those of high
L/G ratio, containing PLA. However, PGA (PLGA 0/100) does not display a more rapid degradation in vitro or in
vivo. The typical rank of degradation is PLGA 50/50 > PGA (PLGA 0/100) > PLA (PLGA 100/0).64 PGA with all
glycolic units displays higher crystallinity (melting point is ~220 °C) and chain packing (density is ~1.58 g/cm3)
compared with both PLGA and PLA polymers, leading to better mechanical strength and slower degradation.65, 66
3.2. End-group analysis
There are two common types of end groups of commercial linear PLGA, terminating in carboxylic acid or
aliphatic esters, with the other end of the polymer chain terminated by a single hydroxyl group. In synthesis of PLGA
polymer, hydroxyl containing compounds such as water, lactic acid, or an alcohol, are used for initiators in acid end-
capped polymer, while an aliphatic alcohol, such as 1-dodecanol is used as the initiator for obtaining an ester end-
capped polymer.43, 67 As mentioned in section 2.4, in 13CNMR spectrum, the distinct difference between acid- and
ester-modified end caps of PLGA is the carbon peak of the methyl group of the aliphatic chain in the ester end-cap at
a chemical shift of 14 ppm. The side methyl unit of lactic monomers should appear at a chemical shift of 16 ppm, so
there is a clear split between the different methyl groups.52 As shown in Figure 3, in the 13CNMR spectrum of
Expansorb® DLG 50-2E (B), the first methyl peak appears very high upfield (red arrow, chemical shift of 14 ppm),
suggesting an ester-modified end cap in its structure; while no signal was observed at the same point in the 13CNMR
spectrum of Expansorb® DLG 50-2A (A), suggesting an acid end group. All the 17 commercial PLGA polymers were
analyzed by 13CNMR spectroscopy and the data is presented in Table 1. Five polymers, including Lactel® DL-PLG
B6007-2P, Expansorb® DLG 75-9E, Resomer® RG 756S, Resomer® RG 502 and Expansorb® DLG 50-2E, were
verified that they possessed ester-modified end caps; while the remaining PLGA polymers had the acid end group.
These results all coincided with their brand labels.

Figure 3. 13CNMR (CDCl3, 500 MHz) spectra of two representative PLGAs with acid-/ester-modified end-cap. A is
Expansorb® DLG 50-2A and B is Expansorb® DLG 50-2E. The red arrow directs carbon signal at upfield chemical
shift (14 ppm) of the methyl group at the terminal of aliphatic ester bond.
End-capping is considered an important index influencing the behavior of PLGA hydrolysis. Compared to the
PLGA polymers with an acid end group, ester end-capping decreases the rate of hydrolysis. This can be explained by
two aspects:68 first, ester-modification masks the carboxyl group at the chain terminus, enhancing the hydrophobicity
and decreasing water uptake of PLGA polymers; second, the ester end-cap impedes the acid-mediated autocatalysis
of the acid end-capped PLGA polymers. For example, Tracy et al.69 described that the ester-capped PLGA polymer
degraded 2-3 times slower in vitro and 3-4 times slower in vivo than the uncapped (acid-capped) PLGA polymer with
similar molecular weights. Most research70, 71 shows that ester end-capped PLGA-based formulations generally display
a substantially slower hydrolysis rate and slower drug release compared to PLGA with acid end capping, but this
process is obviously affected by multiple parameters.

3.3. Monomer sequence analysis
Numerous reports have discussed the influence of PLGA composition (L/G ratio and end-capping) and molecular
weight on its behavior, however, little is known about the effects of the intrachain sequence. Most PLGA polymers
are obtained by ring-opening polymerization. However, in this process, the monomers of lactide and glycolide usually
do not undergo a uniform distribution (random or alternating sequenced) with each other, and actually generate
multiple short randomly distributed blocks of lactyl-lactyl (L-L) and glycolyl-glycolyl (G-G) linkages along the
polymer chain.73 With all other factors equal, the sequence distribution, defined as the term “blockiness”, may result
in differences leading to variations in PLGA solubility and degradation behavior. The “blockiness” can be calculated
according to two descriptions, one by the definition of Skidmore et al.,53 in which Rc value is obtained by the ratio of
IG-G to IG-L; while the other is the Rcms value (the ratio of IG-L to IG-G) by the definition of Hausberger and DeLuca.44
In this paper, we chose the former as the term investigated below since the former result could more straightly present
impact of G-G units on PLGA polymer hydrolysis and degradation. As mentioned in section 2.5, based on the different
chemical molecular environments of the carbonyl carbons in G-G (blue) and glycolyl-lactyl (G-L, red) bonds (shown
in Figure 4), the blockiness value (Rc) can be calculated by dividing the peak intensities located at chemical shift
166-167 ppm.43 In this cluster of two peaks, the upfield peak represents the carbonyl of a glycolic unit connecting to
another glycolic unit (IG-G) while the downfield peak (IG-L) represents the carbonyl of a glycolic connected with a lactic
unit.

Figure 4. 13CNMR spectra (CDCl3, 500 MHz) of carbonyl regions of glycolic mer units of the representative
Expansorb® DLG 50-2E. The red area is intensity of the carbonyl peak of glycolic mers adjacent to lactic mers, while
the blue zone represents the intensity of the carbonyl peak of a glycolic mers adjacent to another glycolic mers.
Blockiness describes the monomer sequence distribution and is affected by multiple factors, especially L/G ratio.
Therefore, it is important to consider blockiness value within groups of PLGAs of the same class of MW, racemic
lactic acid/lactide, end-capping, L/G ratio, etc. Blockiness values (Rc) were calculated by 13CNMR spectroscopy and
are presented in Figure 5. In the group of high molecular weight, ester-capped PLGA polymers with L/G ratio of
75/25, the blockiness value of Resomer® RG 756S (Rc=1.7) was notably higher than that of Expansorb® DLG 75-9E
(Rc=0.5) and Lactel® DL-PLG B6007-2P (Rc=0.6). In the lower molecular weight range (9-15 kDa) acid-capped
PLGA 75/25, Expansorb® DLG 75-2A (Rc=1.3) had the highest blockiness compared to others, and Resomer® RG
752H (Rc=0.7) and Wako® 7515 (Rc=0.6) displayed a slightly higher blockiness than Purasorb® PDLG 7502A
(Rc=0.5). Moreover, in the L/G ratio of 50/50 acid-capped group, the order of blockiness in same weight range (44

kDa-58 kDa) was Purasorb® PDLG 5004A (Rc=1.6) > Resomer® RG 504H (Rc=1.3) > Expansorb® DLG 50-5A
(Rc=0.7). Moreover, there was a slight increase of blockiness between Expansorb® DLG 50-2E (Rc=1.4) and
Resomer® RG 502 (Rc=1.5). Notably, the blockiness of Expansorb® DLG 50-2A (Rc: 1.9) was significantly higher
than that of Resomer® RG 502H (Rc=1.4). Additionally, the three PLA polymers, Purasorb® PDL 02A, Resomer® R
202H and Expansorb® DL 100-2A, naturally had no blockiness due to the absence of glycolic units in their structure.
These results verified the increase of blockiness occurs as L/G ratio decreases, as mentioned above. Except for
Resomer® RG 756S (Rc=1.7) and Expansorb® DLG 75-2A (Rc=1.3), 50/50 PLGA polymers, such as Expansorb®
DLG 50-2A (Rc=1.9) and Expansorb® DLG 50-5A (Rc=0.7), displayed a higher blockiness than those with L/G ratio
of 75/25, such as Resomer® RG 752H (Rc=0.7) and Lactel® DL-PLG B6007-2P (Rc=0.6). The probability of
increased G-G blocks decreases as the lactic content increases from 50/50 to 75/25 of L/G ratio.54 Moreover, in the
L/G ratio of 75/25 group, Resomer® PLGA and Expansorb® polymers showed an inverse relationship of blockiness
values in their low and high molecular weight ranges, e.g., Resomer® RG 756S (Rc=1.7) is higher than Expansorb®
DLG 75-9E (Rc=0.5), while Expansorb® DLG 75-2A (Rc=1.3) is higher than Resomer® RG 752H (Rc=0.7). From
this data, we can conclude that blockiness values of the PLGA polymers differed, although these products were
labelled with the same L/G ratio or molecular weight even within the same brand, increasing the complexity of
sourcing PLGA for biomedical products.
Blo
ck
ine
ss
va
lue
(R
c)
Exp
an
so
rb D
LG
50-2
E
Exp
an
so
rb D
LG
50-2
A
Exp
an
so
rb D
LG
50-5
A
Reso
mer R
G 5
02
Reso
mer R
G 5
02H
Reso
mer R
G 5
04H
Pu
raso
rb P
DL
G 5
004A
Exp
an
so
rb D
LG
75-2
A
Reso
mer R
G 7
52H
Pu
raso
rb P
DL
G 7
502A
Wako 7
515
Exp
an
so
rb D
LG
75-9
E
Reso
mer R
G 7
56S
Lacte
l D
L-P
LG
B6007-2
P
Exp
an
so
rb D
L 1
00-2
A
Reso
mer 2
02H
Pu
raso
rb P
DL
02A
0 .0
0 .5
1 .0
1 .5
2 .0
2 .5L /G 5 0 /5 0 L /G 7 5 /2 5 L /G 1 0 0 /0
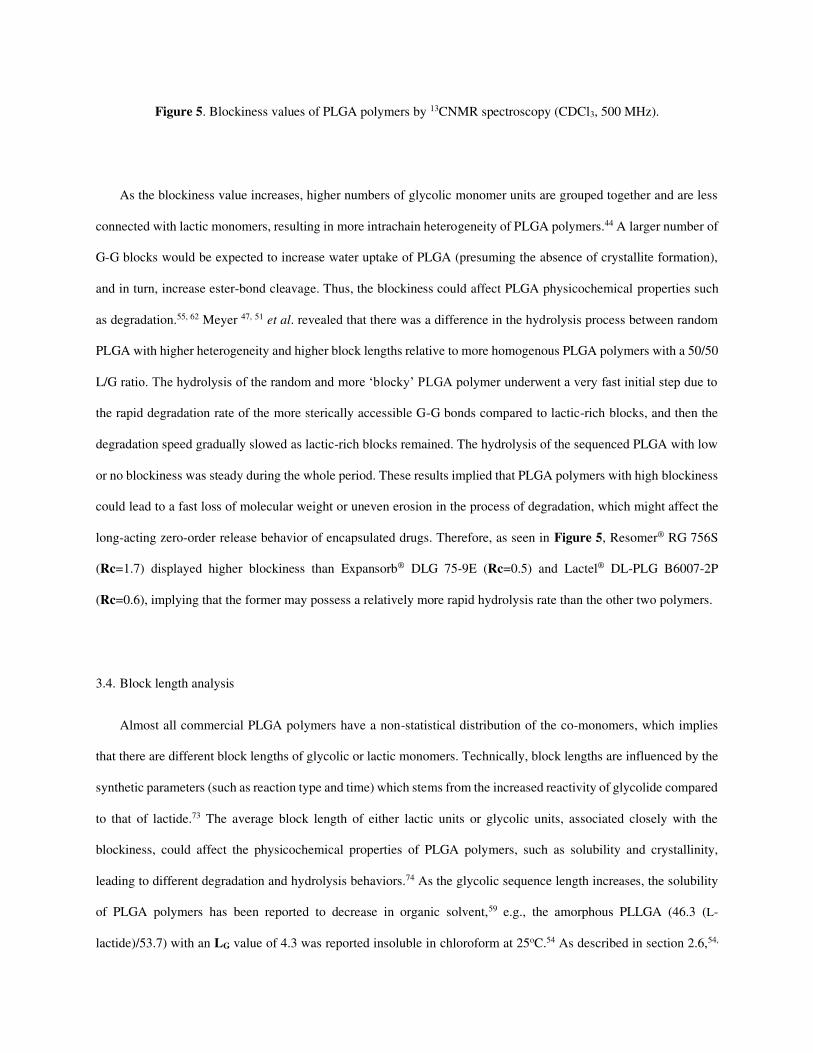
Figure 5. Blockiness values of PLGA polymers by 13CNMR spectroscopy (CDCl3, 500 MHz).
As the blockiness value increases, higher numbers of glycolic monomer units are grouped together and are less
connected with lactic monomers, resulting in more intrachain heterogeneity of PLGA polymers.44 A larger number of
G-G blocks would be expected to increase water uptake of PLGA (presuming the absence of crystallite formation),
and in turn, increase ester-bond cleavage. Thus, the blockiness could affect PLGA physicochemical properties such
as degradation.55, 62 Meyer 47, 51 et al. revealed that there was a difference in the hydrolysis process between random
PLGA with higher heterogeneity and higher block lengths relative to more homogenous PLGA polymers with a 50/50
L/G ratio. The hydrolysis of the random and more ‘blocky’ PLGA polymer underwent a very fast initial step due to
the rapid degradation rate of the more sterically accessible G-G bonds compared to lactic-rich blocks, and then the
degradation speed gradually slowed as lactic-rich blocks remained. The hydrolysis of the sequenced PLGA with low
or no blockiness was steady during the whole period. These results implied that PLGA polymers with high blockiness
could lead to a fast loss of molecular weight or uneven erosion in the process of degradation, which might affect the
long-acting zero-order release behavior of encapsulated drugs. Therefore, as seen in Figure 5, Resomer® RG 756S
(Rc=1.7) displayed higher blockiness than Expansorb® DLG 75-9E (Rc=0.5) and Lactel® DL-PLG B6007-2P
(Rc=0.6), implying that the former may possess a relatively more rapid hydrolysis rate than the other two polymers.
3.4. Block length analysis
Almost all commercial PLGA polymers have a non-statistical distribution of the co-monomers, which implies
that there are different block lengths of glycolic or lactic monomers. Technically, block lengths are influenced by the
synthetic parameters (such as reaction type and time) which stems from the increased reactivity of glycolide compared
to that of lactide.73 The average block length of either lactic units or glycolic units, associated closely with the
blockiness, could affect the physicochemical properties of PLGA polymers, such as solubility and crystallinity,
leading to different degradation and hydrolysis behaviors.74 As the glycolic sequence length increases, the solubility
of PLGA polymers has been reported to decrease in organic solvent,59 e.g., the amorphous PLLGA (46.3 (L-
lactide)/53.7) with an LG value of 4.3 was reported insoluble in chloroform at 25oC.54 As described in section 2.6,54,

75 the block lengths of both lactic and glycolic unit sequences can be accurately calculated from the peak intensities
of the dyad splitting of carbonyl carbons in the 13CNMR spectroscopy (seen in Figure 6). If there was a truly random
distribution of lactic and glycolic units in PLGA 50/50, the theoretical values of block lengths (both LL and LG) should
be near or equal to 2.76 Lower values are also theoretically gotten when a “transesterification” process occurs during
the period of reaction.
As shown in Table 1, both LL and LG of these commercial PLGA polymers were typically >2, showing the non-
ideal random distributions of the lactic and glycolic units. In the group with an L/G ratio 50/50, low molecular weight
PLGA polymers (~12 kDa) including both Resomer® RG 502 (LL=2.6, LG=2.5) and Expansorb® DLG 50-2E (LL=2.5,
LG=2.6) displayed lower block lengths than the other polymers evaluated. For a moderate molecular-weight range (32
kDa-58 kDa), Resomer® RG 504H displayed the lowest block lengths (LL=2.9 and LG=2.9) compared to Expansorb®
DLG 50-5A (LL=4.0, LG=4.0) and Purasorb® PDLG 5004A (LL= 3.4, LG=3.2). These PLGA polymers with shorter
block lengths of both lactic and glycolic units would be expected to undergo a steadier rate of hydrolysis compared to
a PLGA with random heterogeneity. Moreover, in the group of low molecular weight PLGA polymers with L/G ratio
of 75/25, there were significantly larger LL values than LG values, especially for Wako® 7515 (LL=10.6, LG=1.4),
Resomer® RG 752H (LL=8.5, LG=2.6) and Purasorb® PDLG 7502A (LL=7.8, LG=2.7). An increase in lactic block
length (LL) due to the increased proportion of lactic acid in the L/G ratio is expected, whereas the glycolic block
lengths (LG) are more informative of the PLGA sequence distribution. Wako® 7515 PLGA is produced by
polycondensation (PC) in contrast with the most common ring opening polymerization (ROP) method. Here, it is
interesting to point out that the Wako polymer had the lowest glycolic block length within its class. Both ROP and PC
can result in long block lengths due to the increased reactivity of glycolide or glycolic acid,59, 67 yet it has been shown
that very low block lengths can be achieved in PC by increasing the reaction time and although lower block lengths
can also similarly be achieved in ROP, even a dramatically long reaction time does not necessarily result in a
completely homogeneously sequenced structure.77 Furthermore, combined with high blockiness, the long block length
of glycolic units (LG) meaning more reactive G-G bonds would be expected to contribute to the increased hydrolytic
rate in the initial step of PLGA degradation. For instance, when all other variables are considered equal or similar,
which is usually difficult to achieve, Expansorb® DLG 50-2A (Rc: 1.9, LG: 4.2) would be expected to have increased

initial degradation rate compared to Expansorb® DLG 50-5A (Rc: 0.7, LG: 4.0) and Resomer® RG 502H (Rc: 1.4, LG:
3.0), respectively.
Figure 6. 13CNMR spectra (hexafluoro-2-propanol/benzenze-d6, 500 MHz) of the carbonyl regions of PLGA polymer
(representative is Expansorb® DLG 50-5A). Shown as the arrows, the areas of pink (L-G), brown (L-L), blue (G-G)
and red (G-L) represent the intensities of the carbonyl peak of lactic mer units adjacent to glycolic mers units, lactic
adjacent to lactic, glycolic adjacent to glycolic, and glycolic adjacent to lactic, respectively.
4. Conclusion
Four important properties describing the chemical microstructures of 17 commercial PLGA polymers across 5
different brands and varying L/G ratio, end-capping, and molecular weights have been investigated by 1H and 13CNMR
spectroscopy. Overall, polymers with similarly labeled properties from different manufacturers are quite comparable.

It was observed that within groups of similar L/G ratio and molecular weights, different brands of PLGA polymers
possessed distinct blockiness and block lengths, which could lead to diverse behaviors. Based on these measured
values, it is anticipated that when other parameters are in the same range, the PLGA polymers with low blockiness
and shorter block lengths of both glycolic and lactic monomers may show more uniform erosion and steady
degradation rates. In theory, these methods could be used as a guide for polymer selection across multiple fields,
especially long-acting release of drugs. Further research on the correlation between these properties and PLGA
degradation process and PLGA drug release in vitro and in vivo will be reported by our lab soon.
Supporting Information
1HNMR Spectra of Commercial PLGA Polymers
Declarations
Funding
This study was supported by a fund from MilliporeSigma a Business of Merck KGaA, Darmstadt, Germany.
Conflicts of interest
The authors declare no competing financial interest.
Availability of data and material
All data generated or analyzed during this study are included in this published article and its supplementary
information files.
Code availability
Not applicable
Ethics approval
Not applicable
Consent to participate
Not applicable
Consent for publication
All authors whose names appear on the submission approved the version to be published.

References
1. Song R, Murphy M, Li C, Ting K, Soo C, Zheng Z. Current development of biodegradable polymeric materials
for biomedical applications. Drug Des Devel Ther 2018, 12, 3117-3145.
2. Vert M. Polymeric biomaterials: strategies of the past vs. strategies of the future. Prog Polym Sci 2007, 32, 755-
761.
3. Li J, Nemes P, Guo J. Mapping intermediate degradation products of poly(lactic-co-glycolic acid) in vitro. J
Biomed Mater Res B Appl Biomater 2018, 106 (3), 1129-1137.
4. Schmitt EA, Flanagan DR, Linhardt RJ. Degradation and release properties of pellets fabricated from three
commercial poly(D,L-lactide-co-glycolide) biodegradable polymers. J Pharm Sci 1993, 82 (3), 326-9.
5. Vert M, Mauduit J, Li S. Biodegradation of PLA/GA polymers: increasing complexity. Biomaterials 1994, 15
(15), 1209-1213.
6. Jose MV, Thomas V, Johnson KT, Dean DR, Nyairo E. Aligned PLGA/HA nanofibrous nanocomposite scaffolds
for bone tissue engineering. Acta Biomater 2009, 5 (1), 305-315.
7. Kim SS, Sun Park M, Jeon O, Yong Choi C, Kim BS. Poly(lactide-co-glycolide)/hydroxyapatite composite
scaffolds for bone tissue engineering. Biomaterials 2006, 27 (8), 1399-1409.
8. Zhang P, Hong Z, Yu T, Chen X, Jing X. In vivo mineralization and osteogenesis of nanocomposite scaffold of
poly(lactide-co-glycolide) and hydroxyapatite surface-grafted with poly(L-lactide). Biomaterials 2009, 30 (1), 58-70.
9. Zhu Y, Wang Z, Zhou H, Li L, Zhu Q, Zhang P. An injectable hydroxyapatite/poly(lactide-co-glycolide)
composite reinforced by micro/nano-hybrid poly(glycolide) fibers for bone repair. Mater Sci Eng C Mater Biol Appl
2017, 80, 326-334.
10. Liu FJ, Guo R, Shen MW, Cao XY, Mo XM, Wang SY, Shi XY. Effect of the porous microstructures of
poly(lactic-co-glycolic acid)/carbon nanotube composites on the growth of fibroblast cells. Soft Mater 2010, 8, 239-
253.
11. Kim HL, Lee JH, Kwon BJ, Lee MH, Han DW, Hyon SH, Park JC. Promotion of full-thickness wound healing
using epigallocatechin-3-O-gallate/poly (lactic-co-glycolic acid) membrane as temporary wound dressing. Artif
Organs 2014, 38, 411-417.
12. Kumbar SG, Nukavarapu SP, James R, Nair LS, Laurencin CT. Electrospun poly(lactic acid-co-glycolic acid)
scaffolds for skin tissue engineering. Biomaterials 2008, 29, 4100-4107.
13. Choi JY, Jung KY, Lee C, Cho SK, Jheon SH, Lim JO. Fabrication and in vivo evaluation of the electrospun
small diameter vascular grafts composed of elastin/PLGA/PCL and heparin-VEGF. Tissue Eng Regen Med 2010, 7,
149-154.
14. Kim MJ, Kim JH, Yi G, Lim SH, Hong YS, Chung DJ. In vitro and in vivo application of PLGA nanofiber for
artificial blood vessel. Macromol Res 2008, 16, 345-352.
15. Cheng FY, Wang SP, Su CH, Tsai TL, Wu PC, Shieh DB, Chen JH, Hsieh PC, Yeh CS. Stabilizer-free
poly(lactide-co-glycolide) nanoparticles for multimodal biomedical probes. Biomaterials 2008, 29 (13), 2104-2112.
16. Reul R, Tsapis N, Hillaireau H, Sancey L, Mura S, Recher M, Nicolas J, Coll JL, Fattal E. Near infrared labeling
of PLGA for in vivo imaging of nanoparticles. Polym Chem 2012, 3, 694-702.

17. Mahmoud MY, Steinbach-Rankins JM, Demuth DR. Functional assessment of peptide-modified PLGA
nanoparticles against oral biofilms in a murine model of periodontitis. J Control Release 2019, 297, 3-13.
18. Zerrillo L, Que I, Vepris O, Morgado LN, Chan A, Bierau K, Li Y, Galli F, Bos E, Censi R, Di Martino P, van
Osch G, Cruz LJ. pH-responsive poly(lactide-co-glycolide) nanoparticles containing near-infrared dye for
visualization and hyaluronic acid for treatment of osteoarthritis. J Control Release 2019, 309, 265-276.
19. Zhu SS, Xing H, Gordiichuk P, Park J, Mirkin CA. PLGA spherical nucleic acids. Adv Mater 2018, 30 (22),
1707113-1707119.
20. Jiang WL, Mangesh RKG, Deshpande C, Schwendeman SP. Biodegradable poly(lactic-co-glycolic acid)
microparticles forinjectable delivery of vaccine antigens. Adv Drug Deliver Rev 2005, 57, 391-410.
21. Wischke C, Schwendeman SP. Principles of encapsulating hydrophobic drugs in PLA/PLGA microparticles. Int
J Pharm 2008, 364 (2), 298-327.
22. Zhu G, Mallery SR, Schwendeman SP. Stabilization of proteins encapsulated in injectable poly (lactide-co-
glycolide). Nat Biotechnol 2000, 18 (1), 52-57.
23. Behrens AM, Lee NG, Casey BJ, Srinivasan P, Sikorski MJ, Daristotle JL, Sandler AD, Kofinas P.
Biodegradable-polymer-blend-based surgical sealant with body-temperature-mediated adhesion. Adv Mater 2015, 27
(48), 8056-8061.
24. Lemos PA, Bienert I. The supralimus sirolimus-eluting stent. Expert Rev Med Devices 2013, 10 (3), 295-300.
25. Kaufmann M, Jonat W, Kleeberg U, Eiermann W, Janicke F, Hilfrich J, Kreienberg R, Albrecht M, Weitzel HK,
Schmid H. Goserelin, a depot gonadotrophin-releasing hormone agonist in the treatment of premenopausal patients
with metastatic breast cancer. German Zoladex Trial Group. J Clin Oncol 1989, 7 (8), 1113-1119.
26. Perez-Marreno RCF, Gleason D, Loizides E, Wachs B, Tyler RC. A six-month, open-label study assessing a new
formulation of leuprolide 7.5 mg for suppression of testosterone in patients with prostate cancer. Clin Ther 2002, 24,
1902-1914.
27. Kemp, W. Background physics and biography of NMR. NMR in Chemistry 1986, 200-209.
28. Purcell EM, Ramsey NF. On the possibility of electric dipole moments for elementary particles and nuclei. Phys
Rev 1950, 78, 807.
29. Holzgrabe U, Malet-Martino M. NMR spectroscopy in pharmaceutical and biomedical analysis. J Pharm Biomed
Anal 2014, 93, 1-2.
30. Keeler J. Understanding NMR spectroscopy. Wiley 2005.
31. Levitt M. Spin dynamics: basics of nuclear magnetic resonance. Wiley 2008.
32. Taylor AA. A guy with a machine: using NMR to study biological macromolecules. J Biol Chem 2017, 292 (52),
21381-21382.
33. Breton RC, Reynolds WF. Using NMR to identify and characterize natural products. Nat Prod Rep 2013, 30 (4),
501-524.
34. Powers R. The current state of drug discovery and a potential role for NMR metabolomics. J Med Chem 2014,
57 (14), 5860-5870.
35. Tanaka R, Inagaki R, Sugimoto N, Akiyama H, Nagatsu A. Application of a quantitative (1)H-NMR ((1)H-
qNMR) method for the determination of geniposidic acid and acteoside in Plantaginis semen. J Nat Med 2017, 71 (1),
315-320.

36. Walker GS, Bauman JN, Ryder TF, Smith EB, Spracklin DK, Obach RS. Biosynthesis of drug metabolites and
quantitation using NMR spectroscopy for use in pharmacologic and drug metabolism studies. Drug Metab Dispos
2014, 42 (10), 1627-1639.
37. Duncan R, Vicent MJ. Polymer therapeutics-prospects for 21st century: the end of the beginning. Adv Drug Deliv
Rev 2013, 65 (1), 60-70.
38. Dhal PK, Polomoscanik SC, Avila LZ, Holmes-Farley SR, Miller RJ. Functional polymers as therapeutic agents:
concept to market place. Adv. Drug Deliv. Rev 2009, 61 (13), 1121-1130.
39. Izunobi JU, Higginbotham CL. Polymer molecular weight analysis by 1HNMR spectroscopy. J Chem Educ 2011,
88, 1098-1104.
40. Dahlberg C, Fureby A, Schuleit M, Dvinskikh SV, Furó I. Polymer mobilization and drug release during tablet
swelling. A1H NMR and NMR microimaging study. J Control Release 2007, 122, 199-205.
41. Fabián Vaca Chávez KS. Time-domain NMR observation of entangled polymer dynamics: universal behavior
of flexible homopolymers and applicability of the tube model. Macromolecules 2011, 44 (6), 1549-1559.
42. Izunobi JU, Higginbotham CL. Microstructure characterization and thermal analysis of hybrid block copolymer-
a-methoxy-poly(ethylene glycol)-block-poly[e-(benzyloxycarbonyl)-L-lysine] forbiomedical applications. J Mol
Struc 2010, 977, 153-164.
43. Garner J, Skidmore S, Park H, Park K, Choi S, Wang Y. A protocol for assay of poly(lactide-co-glycolide) in
clinical products. Int J Pharm 2015, 495 (1), 87-92.
44. Hausberger AG, DeLuca PP. Characterization of biodegradable poly(D,L-lactide-co-glycolide) polymers and
microspheres. J Pharm Biomed Anal 1995, 13 (6), 747-60.
45. Busatto C, Pesoa J, Helbling I, Luna J, Estenoz D. Effect of particle size, polydispersity and polymer degradation
on progesterone release from PLGA microparticles: Experimental and mathematical modeling. Int J Pharm 2018, 536
(1), 360-369.
46. Santovena A, Alvarez-Lorenzo C, Concheiro A, Llabres M, Farina JB. Rheological properties of PLGA film-
based implants: correlation with polymer degradation and SPf66 antimalaric synthetic peptide release. Biomaterials
2004, 25 (5), 925-931.
47. Washington MA, Swiner DJ, Bell KR, Fedorchak MV, Little SR, Meyer TY. The impact of monomer sequence
and stereochemistry on the swelling and erosion of biodegradable poly(lactic-co-glycolic acid) matrices. Biomaterials
2017, 117, 66-76.
48. Cai Q, Shi GX, Bei JZ, Wang SG. Enzymatic degradation behavior and mechanism of Poly(lactide-co-glycolide)
foams by trypsin. Biomaterials 2003, 24, 629-638.
49. Kamei S, Imoune Y, Okada H, Yamada M, Ogawa Y, Toguchi H. New method for analysis of biodegradable
polyesters by high-performance liquid chromatoaphy after alkali hydrolysis. Biomaterials 1992, 13 (14), 953-959.
50. Vey E, Rodger C, Booth J, Claybourn M, Miller AF, Saiani A. Degradation kinetics of poly(lactic-co-glycolic)
acid block copolymer cast films in phosphate buffer solution as revealed by infrared and Raman spectroscopies. Polym
Degrad Stabil 2011, 96 (10), 1882-1889.
51. Li J, Rothstein SN, Little SR, Edenborn HM, Meyer TY. The effect of monomer order on the hydrolysis of
biodegradable poly(lactic-co-glycolic acid) repeating sequence copolymers. J Am Chem Soc 2012, 134 (39), 16352-
16359.
52. Xia Y, Moran S, Nikonowicz EP, Gao X. Z-restored spin-echo 13C 1D spectrum of straight baseline free of
hump, dip and roll. Magn Reson Chem 2008, 46 (5), 432-435.

53. Skidmore S, Hadar J, Garner J, Park H, Park K, Wang Y, Jiang XJ. Complex sameness: separation of mixed
poly(lactide-co-glycolide)s based on the lactide:glycolide ratio. J Control Release 2019, 300, 174-184.
54. Grijpma DW, Nijenhuis AJ, Pennings AJ. Synthesis and hydrolytic degradation behaviour of high-molecular-
weight L-lactide and glycolide copolymers. Polymer 1990, 31, 2201-2206.
55. Park TG. Degradation of poly(lactic-co-glycolic acid) microspheres: effect of copolymer composition.
Biomaterials 1995, 16 (15), 1123-1130.
56. Ding AG, Schwendeman SP. Determination of water‐soluble acid distribution in poly(lactide‐co‐glycolide). J.
Pharm Sci 2004, 93 (2), 322-331.
57. Ding AG, Shenderova A, Schwendeman SP. Prediction of microclimate pH in poly(lactic-co-glycolic acid) films.
J Am Chem Soc 2006, 128 (16), 5384-5390.
58. Rodriguez-Galan A, Franco L, Puiggali J. Handbook of biodegradable polymers; isolation, synthesis,
characterization and applications. 2011, 26 (5), 133-154.
59. Lan P, Zhang YP, Gao QW, Shao HL, Hu XC. Studies on the synthesis and thermal properties of copoly(L-lactic
acid/glycolic acid) by direct melt polycondensation. J Appl Polym Sci 2004, 2163-2168.
60. Gao QW, Lan P, Shao HL, Hu XC. Direct synthesis with melt polycondensation and microstructure analysis of
poly(L-lactic acid-co-glycolic acid). Polym J 2002, 34 (11), 786-793.
61. Qiao MX, Chen D, Ma XC, Liu YJ. Injectable biodegradable temperature-responsive PLGA-PEG-PLGA
copolymers: synthesis and effect of copolymer composition on the drug release from the copolymer-based hydrogels.
Int J Pharm 2005, 294, 103-112.
62. Lu L, Garcia CA, Mikos AG. In vitro degradation of thin poly(DL-lactic-co-glycolic acid) films. J Biomed Mater
Res 1999, 46 (2), 236-244.
63. Mittal G, Sahana DK, Bhardwaj V, Ravi Kumar MN. Estradiol loaded PLGA nanoparticles for oral
administration: effect of polymer molecular weight and copolymer composition on release behavior in vitro and in
vivo. J Control Release 2007, 119 (1), 77-85.
64. Grayson AC, Voskerician G, Lynn A, Anderson JM, Cima MJ, Langer R. Differential degradation rates in vivo
and in vitro of biocompatible poly(lactic acid) and poly(glycolic acid) homo- and co-polymers for a polymeric drug-
delivery microchip. J Biomater Sci Polym Ed 2004, 15 (10), 1281-1304.
65. Yu C, Bao J, Xie Q, Shan G, Bao Y, Pan P. Crystallization behavior and crystalline structural changes of
poly(glycolic acid) investigated via temperature-variable WAXD and FTIR analysis. Cryst Eng Comm 2016, 18 (40),
7894-7902.
66. Hurrell S, Cameron RE. The effect of buffer concentration, pH and buffer ions on the degradation and drug
release from polyglycolide. Polym Int 2003, 52 (3), 358-366.
67. Dechy-Cabaret O, Martin-Vaca B, Bourissou D. Controlled ring-opening polymerization of lactide and glycolide.
Chem Rev 2004, 104, 6147-6176.
68. Houchin ML, Topp EM. Chemical degradation of peptides and proteins in PLGA: a review of reactions and
mechanisms. J Pharm Sci 2008, 97 (7), 2395-404.
69. Tracy MA, Ward KL, Firouzabadian L, Wang Y, Dong N, Qian R, Zhang Y. Factors affecting the degradation
rate of poly(lactide-co-glycolide) microspheres in vivo and in vitro. Biomaterials 1999, 20 (11), 1057-62.
70. Samadi N, Abbadessa A, Di Stefano A, van Nostrum CF, Vermonden T, Rahimian S, Teunissen EA, van
Steenbergen MJ, Amidi M, Hennink WE. The effect of lauryl capping group on protein release and degradation of
poly(D,L-lactic-co-glycolic acid) particles. J Control Release 2013, 172 (2), 436-443.

71. Su ZX, Shi YN, Teng LS, Li X, Wang LX, Meng QF, Teng LR, Li YX. Biodegradable poly(D, L-lactide-co-
glycolide) (PLGA) microspheres for sustained release of risperidone: zero-order release formulation. Pharm Dev
Technol 2011, 16 (4), 377-384.
72. Avgoustakis K, Nixon JR. Biodegradable controlled release tablets 1: preparative variables affecting the
properties of poly(lactide-co-glycolide) copolymers as matrix forming material. Int J Pharm 1991, 70, 77-85.
73. Engwicht A, Girreser U, Muller BW. Characterization of co-polymers of lactic and glycolic acid for supercritical
fluid processing. Biomaterials 2000, 21, 1587-1593.
74. Engwicht A, Girreser U, Muller BW. Critical properties of lactide-co-glycolide polymers for the use in
microparticle preparation by the Aerosol solvent extraction system. Int J Pharm 1999, 185, 61-72.
75. Kricheldorf HR, Mang T, Jonte JM. Polylactones. 1. Copolymerization of glycolide and e-caprolactone.
Macromolecules 1984, 17, 2173-2181.
76. Barskaya IG, Lyudvig YB, Tarasov SG, Godovskii YK. Cationic copolymerization of glycolide with dl-lactide.
Polym Sci USSR 1983, 25(6), 1497-1503.
77. Yin HH, Wang R, Ge H, Zhang XQ, Zhu ZG. Synthesis and structure control of L‐lactic acid-glycolic acid
copolymer by homo‐copolymerization. J Appl Polym Sci 2015, 132, 41566-41573.

Figures
Figure 1
Characteristic proton peaks of PLGA polymers in 1HNMR spectra (CDCl3, 500 MHz). A, B and C representthe spectra of three PLGAs with L/G ratio of 50/50, 75/25 and 100/0, respectively (Expansorb® DLG 50-5A, Expansorb® DLG 75-2A and Expansorb® DLG 100-2A). Labels corresponding to the peaks of (i) and(iii) are the protons of methine and side methyl groups in lactic mer units, respectively; (ii) protons ofmethylene in glycolic mers.

Figure 2
Calculated molar lactic acid content (%) of different branded PLGAs as assessed by 1HNMRspectroscopy (CDCl3, 500 MHz). A, B and C represent these groups of PLGAs with L/G ratio of 50/50,75/25 and 100/0, respectively.

Figure 3
13CNMR (CDCl3, 500 MHz) spectra of two representative PLGAs with acid-/ester-modi�ed end-cap. A isExpansorb® DLG 50-2A and B is Expansorb® DLG 50-2E. The red arrow directs carbon signal at up�eldchemical shift (14 ppm) of the methyl group at the terminal of aliphatic ester bond.

Figure 4
13CNMR spectra (CDCl3, 500 MHz) of carbonyl regions of glycolic mer units of the representativeExpansorb® DLG 50-2E. The red area is intensity of the carbonyl peak of glycolic mers adjacent to lacticmers, while the blue zone represents the intensity of the carbonyl peak of a glycolic mers adjacent toanother glycolic mers.

Figure 5
Blockiness values of PLGA polymers by 13CNMR spectroscopy (CDCl3, 500 MHz).

Figure 6
13CNMR spectra (hexa�uoro-2-propanol/benzenze-d6, 500 MHz) of the carbonyl regions of PLGApolymer (representative is Expansorb® DLG 50-5A). Shown as the arrows, the areas of pink (L-G), brown(L-L), blue (G-G) and red (G-L) represent the intensities of the carbonyl peak of lactic mer units adjacent toglycolic mers units, lactic adjacent to lactic, glycolic adjacent to glycolic, and glycolic adjacent to lactic,respectively.
Supplementary Files
This is a list of supplementary �les associated with this preprint. Click to download.
GraphicalAbstract.jpg
SupportInformationJS07272020spsf.pdf