characterization of a1-cu-li alloy 2090 near net shape
TRANSCRIPT

N AS A / TM- 1998-207668
Characterization of A1-Cu-Li Alloy 2090
Near Net Shape Extrusion
M. J. Birt
Analytical Services & Materials, Inc., Hampton, Virginia
M. S. Domack
Langley Research Center, Hampton, Virginia
R. A. Harley and W. D. Pollock
Analytical Services & Materials, Inc., Hampton, Virginia
National Aeronautics and
Space Administration
Langley Research CenterHampton, Virginia 23681-2199
May 1998

Acknowledgments
The authors would like to thank the other major participants who contributed to the program, specifically: Alcoa (K. P.
Armanie); Boeing Aerospace and Defense Group (B. W. Libbey); Langley Research Center (T. T. Bales, W. B.
Lisagor, J. A. Wagner); Marshall Space Flight Center (T. P. Vaughn); the National Institute of Standards and Tech-
nology (P. T. Purtscher); and Philips Laboratory, Air Force Systems Command (Lt. B. Pham) in the United States.
The authors also wish to acknowledge the contributions made by researchers at the All-Russia Institute of Aviation
Materials (J. Fridlyander) and the All-Russia Institute of Light Alloys (V. Davydov) in the Commonwealth of
Independent States.
IThe use of trademarks or names of manufacturers in this report is for accurate reporting and does not constitute an Iofficial endorsement, either expressed or implied, of such products or manufacturers by the National Aeronautics and [Space Administration. [
Available from the following:
NASA Center for AeroSpace Information (CASI)7121 Standard Drive
Hanover, MD 21076-1320
(301) 621-0390
National Technical Information Service (NTIS)
5285 Port Royal Road
Springfield, VA 22161-2171
(703) 487-4650

Contents
List of Tables ........................................................................... v
List of Figures ......................................................................... vi
Nomenclature ........................................................................ viii
Abstract ............................................................................... 1
1. Introduction .......................................................................... 1
2. Extruded Panels ....................................................................... 2
2.1. Presentation of Data for Tables and Figures .............................................. 2
2.2. Material and Processing ............................................................. 2
2.3. Inspection ........................................................................ 4
3. Experimental Procedure ................................................................ 4
3.1. Microstructural Characterization ...................................................... 4
3.2. Tensile Tests ...................................................................... 5
3.3. Fracture Tests ..................................................................... 5
3.3.1. Part-through surface crack fracture tests ............................................. 5
3.3.2. Through-crack fracture tests ....................................................... 5
3.4. Welding .......................................................................... 5
3.5. Corrosion Tests .................................................................... 6
3.5.1. Exfoliation .................................................................... 6
3.5.2. Stress corrosion ................................................................ 7
4. Results and Discussion ................................................................. 7
4.1. Microstructural Characterization ...................................................... 7
4.1.1. Metallography ................................................................. 7
4.1.2. Texture analyses ................................................................ 8
4.2. Tensile Properties ................................................................. 14
4.3. Fracture Properties ................................................................ 21
4.3.1. Part-through surface crack tests ................................................... 21
4.3.2. Through-crack fracture tests ...................................................... 22
4.4. Welding ......................................................................... 29
4.4.1. Weldment tensile properties ...................................................... 29
4.4.2. Weldment fracture properties ..................................................... 29
4.5. Corrosion ....................................................................... 32
4.5.1. Exfoliation ................................................................... 33
4.5.2. Stress corrosion ............................................................... 34
5. Concluding Remarks .................................................................. 38
6. References .......................................................................... 39
Appendix A---Test Specimen Layout ....................................................... 42
Appendix B--Test Specimens ............................................................ 48
Appendix C--Test Results ............................................................... 57
o.i111


List of Tables
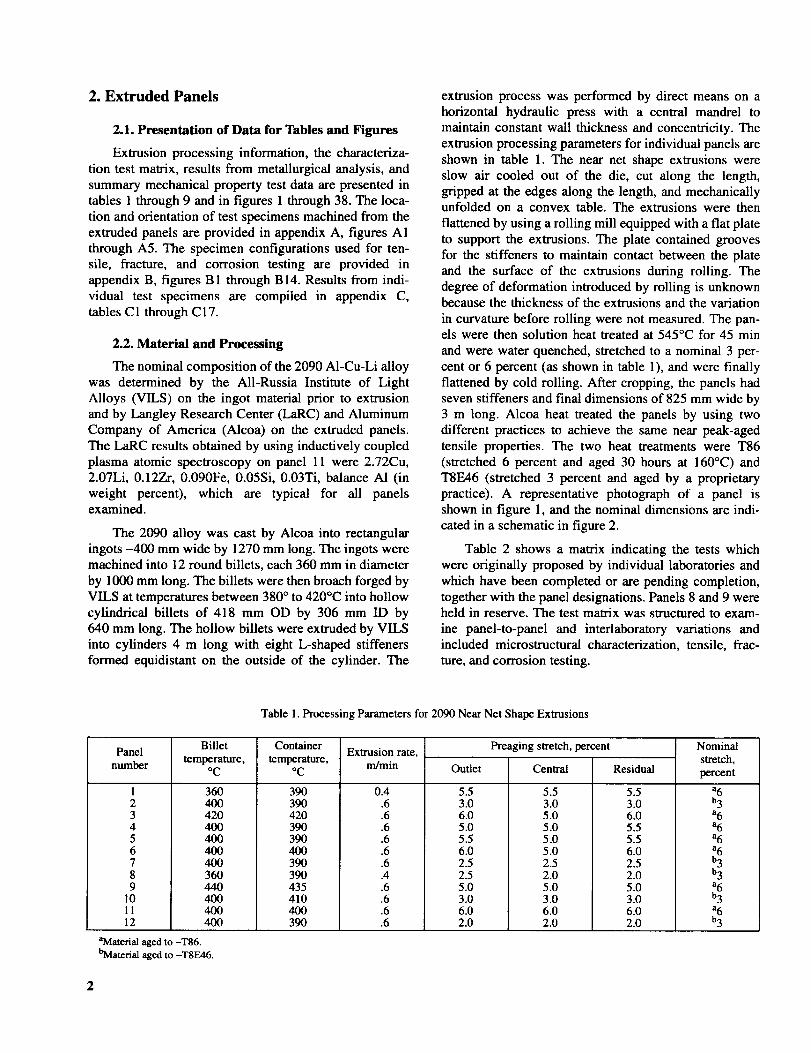
Table 1.
Table 2.
Table 3.
Table 4.
Table 5.
Table 6.
Table 7.
Table 8.
Table 9.
Table C 1.
Table C2.
Table C3.
Table C4.
Table C5.
Table C6.
Table C7.
Table C8.
Table C9.
Table C10.
Table C 11.
Table C 12.
Table C 13.
Table C 14.
Table C 15.
Table C 16.
Table C 17.
Processing Parameters for 2090 Near Net Shape Extrusions ............................ 2
Test Matrix To Characterize 2090 Near Net Shape Extruded Panels ...................... 4
Summary of Variable Polarity Plasma Arc Welding (VPPAW) Parameters for
2090 Near Net Shape Extrusion .................................................. 6
Summary of Surface Crack (PS(T)) Fracture Results ................................. 21
Summary of Tensile Properties of Welded 2090 and 2219 Alloys ....................... 32
Summary of Weldment Surface Crack (PS(T)) Fracture Results ........................ 32
Summary of Exfoliation Results for 2090 Products .................................. 33
Summary of Long Transverse Stress Corrosion Test Results for 2090and 2219 Products ............................................................ 35
Summary of Short Transverse SCC Test Results for 2090 and 2219 Products .............. 37
Alcoa Tensile Data at 25°C, Panels 1 and 10 ....................................... 57
Boeing Aerospace Tensile Data at 25°C, Panels 4 and 7 .............................. 57
Boeing Aerospace Tensile Data at -196°C, Panel 4 .................................. 57
LaRC Tensile Data at 25°C, Panels 11, 6, 4, and 2 ................................... 58
MSFC Tensile Data at 25°C, Panels 11 and 2 ....................................... 59
MSFC Tensile Data at -196°C, Panels 11 and 2 ..................................... 59
MSFC Tensile Data at -253°C, Panels 11 and 2 ..................................... 60
Boeing Aerospace Surface Crack (PS(T)) Fracture Tests, Panels 4 and 7 ................. 60
NIST Surface Crack (PS(T)) Fracture Tests, Panel 6 ................................. 61
Tensile Properties for 2090 Near Net Shape Extrusion and Other Aluminum Products ....... 61
Boeing Aerospace Weldment Tensile Data, Panels 4 and 7 ............................ 62
Boeing Aerospace Weldment Surface Crack (PS(T)) Fracture Tests, Panels 4 and 7 ........ 62
NIST Weldment Surface Crack (PS(T)) Fracture Tests, Panel 3 ........................ 63
Alcoa Exfoliation Test Data for 2090-T86 Extrusion, Panel 6 .......................... 63
Alcoa MASTMAASIS Exfoliation Test Data for 2090-T86 Extrusion, Panel 6 ............ 63
LaRC Direct-Tension Stress Corrosion Data for 2090-T86 Extrusion, Panel 6 ............. 64
LaRC Stress Corrosion Data for the Modified c-Ring Specimen,
2090-T86 Extrusion, Panel 6 .................................................... 64

List of Figures
Figure
Figure
Figure
Figure
Figure
Figure
Figure
Figure
Figure
Figure
Figure
Figure
Figure
Figure
Figure
Figure
Figure
Figure
Figure
Figure
Figure
Figure
Figure
Figure
Figure
Figure
Figure
1. Extruded 2090 panel in as-received condition ....................................... 3
2. Schematic section of extruded panel (nominal dimensions in mm) ....................... 3
3. Triplanar optical micrograph of center of skin (anodized by using Barker's reagent
and viewed under cross-polarized light) ............................................ 8
4. Triplanar optical micrograph of center of cap (anodized by using Barker's reagent
and viewed under cross-polarized light) ............................................ 8
5. Skin-stiffener cross section showing microstructural variations resulting from extrusion
process (anodized with Barker's reagent and viewed under cross-polarized light) ........... 9
6. Texture results for midplane of cap .............................................. 10
7. Texture results for midplane of web .............................................. 11
8. Texture results for midplane of skin .............................................. 12
9. Texture results for midplane of base ............................................. 13
10. Panel-to-panel variation in yield strength and elongation to failure. Results for all
LT skin tests at 25°C for each panel (bars represent range of data) ...................... 14
11. Variation in yield strength and elongation to failure along panel length. Results for
panel 11 L skin, LT skin, and LT base at 25°C. Bars represent range of data .............. 15
12. Variation in stress-strain behavior with respect to panel element and orientation.
Individual tests at 25°C from center of panel 11 .................................... 15
13. Variation in yield strength and elongation to failure with panel element. LaRC results
for panels 6 and 11 (T86) and panel 2 (T8E46) at 25°C. Bars represent range of data ....... 15
14. Variation in yield strength with temperature for various 2090 product forms and
2219 plate. Bars represent range of data ........................................... 17
15. Variation in elongation to failure with temperature for various 2090 product forms
and 2219 plate. Bars represent range of data ....................................... 17
16. Through-thickness cross section of tensile failure in base tested at 25°C in the
LT orientation ............................................................... 18
17. Typical intersubgranular tensile failure at 25°C showing pancake-shaped grains ........... 18
18. Typical tensile failure in skin tested at 25°C in 45 ° orientation ......................... 19
19. Typical tensile failure in skin tested at -196°C in LT orientation ....................... 20
20. Effect of surface crack shape and temperature on toughness. Results for individual
tests at NIST on panel 6 in T-S orientation ........................................ 22
21. Comparison of surface crack test results from Boeing Aerospace for 2090 extrusions
with 2090 plate .............................................................. 22
22. Through-thickness cross sections of 2090 PS(T) fracture specimens (anodized
with Barker's reagent and viewed under cross-polarized light) ......................... 23
23. Fracture surface of PS(T) specimen in L-S orientation at 25°C ......................... 24
24. Fracture surface of PS(T) specimen in T-S orientation at 25°C ......................... 25
25. Fracture surface of PS(T) specimen in L-S orientation at -196°C ....................... 26
26. Fracture surface of PS(T) specimen in T-S orientation at -196°C ....................... 27
27. Comparison of the resistance to stable tearing of 2090-T86 extrusion with
2219-T87 plate in L-T orientation at 25°C. Data from M(T) specimens .................. 28
vi

Figure28.
Figure29.
Figure30.
Figure31.
Figure32.
Figure33.
Figure34.
Figure35.
Figure36.
Figure37.
Figure38.FigureA1.FigureA2.FigureA3.FigureA4.FigureA5.FigureB1.
FigureB2.FigureB3.FigureB4.FigureB5.FigureB6.FigureB7.FigureB8.FigureB9.FigureB10.
FigureB11.
FigureB12.FigureB13.FigureB14.
Effectof orientationonfracturebehaviorof 2090-T86extrusionat25°C.DatafromM(T)specimens......................................................... 28Effectof temperatureonfracturebehaviorof2090-T8E46extrusioninL-Torientation.DatafromM(T)specimens....................................... 28Effectof stretchonfracturebehaviorof 2090extrusioninL-Torientationat25°C.DatafromM(T)specimens..................................................... 28Effectof stretchonfracturebehaviorof2090extrusioninT-Lorientationat25°C.DatafromM(T)specimens..................................................... 28SEMfractographyof 2090-T8E46extrusionM(T)specimenstestedat25°CinL-Torientation............................................................ 30
SEMfractographyof 2090-T8E46extrusionM(T)specimenstestedat-196°CinL-Torientation............................................................ 31
Generalappearanceof2090-T86exfoliationspecimensafterEXCOanddrybottomMASTMAASISexposures............................................... 34The2090-T86MASTMAASISexfoliationspecimensillustratingpittingattackwithundercutting............................................................ 34Variationinbreakingstresswithexposurestressfor2090-T86longtransversedirect-tensionspecimens.Barsrepresentrangeofdata............................... 35Longtransverse2090-T86direct-tensionspecimenillustratingpittingattackalongmaterialflowlinesassociatedwithextrusionprocess........................... 36Pittingattackon2090-T86modifiedc-ring........................................ 38Specimenlocationsinpanel2 .................................................. 43Specimenlocationsinpanel6 .................................................. 44Specimenlocationsinpanel11................................................. 45Specimenlocationsinpanel4 .................................................. 46Specimenlocationsinpanel7 .................................................. 47LaRCandAlcoasubsizetensilespecimen(full-panelthickness).Dimensionsareinmm.................................................................. 48
MSFCtensilespecimen(full-panelthickness).Dimensionsareinmm................... 48BoeingAerospacebasemetaltensilespecimen.Dimensionsareinmm.................. 48NISTlargePS(T)specimen(full-panelthickness).Dimensionsareinmm............... 49NISTsmallPS(T)specimen(full-panelthickness).Dimensionsareinmm............... 49BoeingAerospacePS(T)specimen.Dimensionsareinmm........................... 50LaRCM(T)specimen(full-panelthickness).Dimensionsareinmm.................... 50BoeingAerospaceweldmenttensilespecimen.Dimensionsareinmm.................. 51BoeingAerospaceweldmentPS(T)specimen.Dimensionsareinmm................... 52AlcoaexfoliationcorrosiontestspecimenforEXCOtest(full-panelthickness).Dimensionsareinmm........................................................ 52
AlcoaexfoliationcorrosiontestspecimensfordrybottomMASTMAASIStest(full-panelthickness).Dimensionsareinmm...................................... 53LaRCdirect-tensionstresscorrosionspecimen..................................... 54LaRCmodifiedc-ringstresscorrosionspecimen.Dimensionsareinmm................ 55Loadingmethodsandresultingtensilestressesformodifiedc-ringspecimen............. 56
vii

Nomenclature
Alcoa
ASTM
a
a/c
B
CIS
C
DB
dA/dK
ED
E.D.
EDS
El
ET
EXCO
GTA
HAZ
ID
Kcv
K1eKRkN
L
LaRC
LCF
LS
L-S
LT
L-T
MAM
MASTMAASIS
MSFC
M(T)
NIST
OD
ODF
PS(T)
S
Snet
s,,
s,
Aluminum Company of America
American Society for Testing and Materials
crack depth
aspect ratio of crack depth to half-surface crack length
overall specimen thickness
Commonwealth of Independent States
width of notch
dry bottom (MASTMAASIS) test
fatigue crack growth rate
rating per ASTM G34 denoting very severe exfoliation
extrusion direction
energy dispersive spectroscopy
elongation
Space Shuttle external tank
exfoliation corrosion
gas tungsten arc welding
heat affected zone
inner diameter
impact toughness
effective mode I stress intensity
crack extension resistance
breaking load
longitudinal (extrusion) direction
Langley Research Center
low cycle fatigue
metallurgical plane containing both L and S orientations
fracture plane normal to L with propagation in S direction
metallurgical plane containing both L and T orientations
fracture plane normal to L with propagation in T direction
metric aerospace materials
modified acetic acid salt intermittent spray
Marshall Space Flight Center
middle-crack tension specimen
National Institute of Standards and Technology
outer diameter
orientation distribution function
part-through surface crack specimen
short transverse (thickness) direction
net section stress
ultimate stress
yield stress
oo.Vlll

SAE
SCC
SEM
SPEC
T
T.D.
TL
T-L
TS
T-S
VIAM
VILS
VPPAW
W
WDS
%s3G
Society of Automotive Engineers
stress corrosion cracking
scanning electron microscope
specification
long transverse (width) direction
transverse direction
denotes metallurgical plane containing both T and L orientations
denotes fracture plane normal to T with propagation in L direction
denotes metallurgical plane containing both T and S orientations
denotes fracture plane normal to T with propagation in S direction
All-Russia Institute of Aviation Materials
All-Russia Institute of Light Alloys
variable polarity plasma arc welding
specimen width
wavelength dispersive spectroscopy
yield stress
vertical up welding position
ix


Abstract
Aluminum-lithium (Al-Li) alloy near net shape extrusions are being evaluated for
potential application in launch vehicle structures. The objective of this study was to
determine tensile and fracture properties, corrosion resistance, and weldability of
integrally stiffened panels of AI-Cu-Li alloy 2090 in the T8 temper. The microstruc-
ture was predominantly unrecrystallized. Texture analyses revealed the presence of
fiber components in the stiffeners and a combination of fiber and rolling components
in the skin. Variations in grain morphology and texture through the extruded cross
section were correlated with the tensile, fracture, and corrosion behavior. Tensile
strengths at room and cryogenic temperatures of the 2090 extrusions were similar to
other 2090 product forms and were higher than aluminum alloy 2219-T87, the pri-
mary structural material in the Space Shuttle external tank," however, ductilities were
lower. The fracture resistance of the 2090 extrusion was lower than 2219-T87 plate at
room temperature. At cryogenic temperatures, tensile ductility and fracture behavior
of the 2090 extrusion were similar to other 2090 product forms but were lower than
2219-T87 plate. The exfoliation and stress corrosion resistance of the 2090 extrusion
compared favorably with the characteristics of other 2090 product forms. Theweldability and weldment properties of the extrusions were similar to 2090 and
2219 plates.
1. Introduction
Low density aluminum-lithium (AI-Li) alloys offersignificant cost-saving advantages over conventional alu-
minum alloys where weight is a premium. For example,
the cost-to-orbit of a kilogram of payload is more than
$4400 in an existing launch vehicle such as the Atlas/
Centaur (ref. 1). Therefore, the structural weight savings
achieved by using A1-Li alloys convert directly into pay-
load savings. Launch vehicle components, including cry-
otanks and dry bay structures in the Space Shuttle
external tank (ET), are possible applications where A1-Li
alloys could replace conventional aluminum alloys.
Manufacture of the ET currently involves integrally
machining thick plate 2219 aluminum alloy, which pro-
duces in excess of 80 percent scrap material. Since the
material cost of A1-Li alloys is approximately three to
five times higher than 2219 A1 alloy, near net shape man-
ufacturing processes (including extrusion, spin forming,
and roll forging), in which material scrap is reduced to
-15 percent, are being considered as alternatives for theET (ref. 2).
A collaborative team effort was established between
several laboratories to examine and evaluate the proper-
ties of Al-Cu-Li alloy 2090 in the form of a near net
shape extrusion. The team included Langley Research
Center (LaRC), Marshall Space Flight Center (MSFC),
the National Institute of Standards and Technology
(NIST), Philips Laboratory, Air Force Systems Com-
mand, and private industry (Aluminum Company of
America (Alcoa) and Boeing Aerospace) laboratories in
the United States, together with the All-Russia Institute
of Aviation Materials (VIAM), and the All-Russia Insti-
tute of Light Alloys (VILS) in the Commonwealth of
Independent States (CIS). The preliminary results and
interpretation of the study presented herein on the 2090
near net shape extrusions are part of an ongoing effort
and cover work completed to date by laboratories in theUnited States.
The objective of the study was to determine the
effect of the near net shape extrusion process on the
properties of 2090 and the feasibility of producing, by
extrusion, an integrally stiffened panel similar to amachined barrel section used in the structure of the ET.
In producing the extruded panels, no effort was made to
meet any specific design requirement for aerospace AI
alloy products. The extruded panels were fabricated on a
best effort basis by using an extrusion press and die
which were regularly used for the extrusion of a variety
of commercial AI alloys but that had not been modified
for the 2090 alloy. In order to address the ET serviceconditions, tensile and fracture testing was conducted at
both cryogenic and room temperatures. Weldability and
corrosion resistance were also major concerns because
most Al cryotanks are welded during fabrication, and
once fabricated, tanks may be stored for a considerable
length of time before use. Therefore, tensile and fracture
data from weldments and general corrosion and stress
corrosion cracking data were also obtained for the near
net shape extrusion. In the study, data generated for the
2090 near net shape extrusion have been compared with
other 2090 product forms and conventional aerospace
aluminum alloys, where appropriate.
2. Extruded Panels
2.1. Presentation of Data for Tables and Figures
Extrusion processing information, the characteriza-
tion test matrix, results from metallurgical analysis, and
summary mechanical property test data are presented in
tables 1 through 9 and in figures 1 through 38. The loca-
tion and orientation of test specimens machined from the
extruded panels are provided in appendix A, figures A 1
through A5. The specimen configurations used for ten-
sile, fracture, and corrosion testing are provided in
appendix B, figures B1 through B14. Results from indi-
vidual test specimens are compiled in appendix C,
tables C 1 through C 17.
2.2. Material and Processing
The nominal composition of the 2090 AI-Cu-Li alloy
was determined by the All-Russia Institute of Light
Alloys (VILS) on the ingot material prior to extrusion
and by Langley Research Center (LaRC) and Aluminum
Company of America (Alcoa) on the extruded panels.
The LaRC results obtained by using inductively coupled
plasma atomic spectroscopy on panel 11 were 2.72Cu,
2.07Li, 0.12Zr, 0.090Fe, 0.05Si, 0.03Ti, balance A1 (in
weight percent), which are typical for all panels
examined.
The 2090 alloy was cast by Alcoa into rectangular
ingots -400 mm wide by 1270 mm long. The ingots were
machined into 12 round billets, each 360 mm in diameter
by 1000 mm long. The billets were then broach forged by
VILS at temperatures between 380 ° to 420°C into hollow
cylindrical billets of 418 mm OD by 306 mm ID by
640 mm long. The hollow billets were extruded by VILS
into cylinders 4 m long with eight L-shaped stiffeners
formed equidistant on the outside of the cylinder. The
extrusion process was performed by direct means on a
horizontal hydraulic press with a central mandrel to
maintain constant wall thickness and concentricity. The
extrusion processing parameters for individual panels are
shown in table 1. The near net shape extrusions were
slow air cooled out of the die, cut along the length,
gripped at the edges along the length, and mechanically
unfolded on a convex table. The extrusions were then
flattened by using a rolling mill equipped with a flat plate
to support the extrusions. The plate contained grooves
for the stiffeners to maintain contact between the plate
and the surface of the extrusions during rolling. The
degree of deformation introduced by rolling is unknown
because the thickness of the extrusions and the variation
in curvature before rolling were not measured. The pan-
els were then solution heat treated at 545°C for 45 min
and were water quenched, stretched to a nominal 3 per-
cent or 6 percent (as shown in table 1), and were finally
flattened by cold rolling. After cropping, the panels had
seven stiffeners and final dimensions of 825 mm wide by
3 m long. Alcoa heat treated the panels by using two
different practices to achieve the same near peak-aged
tensile properties. The two heat treatments were T86
(stretched 6 percent and aged 30 hours at 160°C) and
T8E46 (stretched 3 percent and aged by a proprietary
practice). A representative photograph of a panel is
shown in figure 1, and the nominal dimensions are indi-
cated in a schematic in figure 2.
Table 2 shows a matrix indicating the tests which
were originally proposed by individual laboratories and
which have been completed or are pending completion,
together with the panel designations. Panels 8 and 9 were
held in reserve. The test matrix was structured to exam-
ine panel-to-panel and interlaboratory variations and
included microstructural characterization, tensile, frac-
ture, and corrosion testing.
Table 1. Processing Parameters for 2090 Near Net Shape Extrusions
Panel
number
123456789
101112
Billet
temperature,°C
360400420400400400400360440400400400
Container
temperature,°C
390390420390390400390390435410400390
Extrusion rate,
m/min
0.4.6.6.6.6.6.6.4.6.6.6.6
Outlet
5.53.06.05.05.56.02.52.55.03.06.02.0
Preaging stretch, percent
Central Residual
5.5 5.53.0 3.05.0 6.05.0 5.55.0 5.55.0 6.02.5 2.52.0 2.0
5.0 5.03.0 3.06.0 6.02.0 2.0
Nominal
stretch,
percent
a6b3a6a6a6a6b3b3a6b3a6b3
aMaterial aged to -T86.
bMaterial aged to -T8E46.

250mm
Figure1.Extruded2090panelinas-receivedcondition.
____._f _ j _ 14_/
Cap. ' Web
S
LTv
Figure 2. Schematic section of extruded panel (nominal dimensions in mm),

Table 2. Test Matrix To Characterize 2090 Near Net Shape Extruded Panels
Tests
Laboratories
BoeingAerospace
LaRC MSFC VIAM, VILS
Panel 2,4,6, 11 2, 3, 11 4,7 5, 12
Wet chemistry (a) (a)Hydrogen concentration (a)Optical metallography (a) (b) (a)TEM (a)Texture (b)
Tensile (ASTM E8)RT (a) (a) (a) (a)LN 2 (a) (a) (a)LH 2 or LHe (a) (a)
Fatigue (a), (e)
(b), (c)(b),(c)(b), (c)
(b)(b)
_turetoughnessRTLN2LH2orLHe
NIST Alcoa
3,6 1,6,10(a)(a)(a)
(a)
(a)
(a), (d)(a), (d)(a), (d)
(a)Corrosion
General corrosionStress corrosion
(a), (d)(a), (d)
(a), (f), (g)(a), (f)(a), (f)
(a)(a)(a)
Weldabifity (a) (a) (a)
(a)Inspection
Dimensions and internal flaws
aComplete.bin progress.CKR.dKle.eI.,CF,dAIdN at 25°C and -253°C.fKcu.Slmpact.
2.3. Inspection
Panels 4 and 7 were inspected for dimensional toler-
ances and general quality by the Boeing Defense andAerospace Group. The panels were nondestructively
examined by visual, dye penetrant, and ultrasonic inspec-
tion. Panels were investigated with regard to internal
defects, surface corrosion, and damage. Visually, the sur-
faces of the panels appeared discolored in certain areas;
dye penetrant examination associated these areas with
microporosity (<0.5 mm) and macroporosity (-1.3 ram)as a result of surface corrosion. Ultrasonic examination,
using a scan with a resolution of -1 mm diameter,revealed that there were no internal defects. Test speci-
mens were taken from areas which were obviously free
of corrosion damage and other surface defects. Undervisual examination it was noted that some stiffeners were
bent, and damage in the form of surface gouges was
present. Dimensional tolerances were measured in accor-dance with Society of Automotive Engineers (SAE)
specification Metric Aerospace Materials (MAM) 2205(ref. 3). Although the thickness of the panels met the
specification, measurements of the waviness between the
stiffeners and the flatness of the panels did not meet nor-
mally allowed manufacturing tolerances for aerospace
aluminum alloy extruded shapes in the United States
(ref. 3).
3. Experimental Procedure
3.1. Microstructural Characterization
Metallurgical examination and texture analysis were
performed by LaRC to characterize the microstructure
associated with processing and to correlate results with
tensile, fracture, and corrosion properties. Optical metal-
lography specimens to examine grain morphology were
anodized by using Barker's reagent and were viewed
under cross-polarized light. Triplanar micrographs were
prepared from samples taken from the skin and cap of
panel 11. A full cross section was prepared in the T-S
plane to include both stiffener and skin from panels 2, 6,
and 11. Additional specimens were prepared by using
Graft-Sargent reagent and conventional bright field
viewing conditions to look for constituent particles.
Energy dispersive spectroscopy (EDS) and wavelength
dispersive spectroscopy (WDS) were used to identify
constituent particles.
Measurementsof preferredorientationwerecarriedoutby AlcoaandLaRCtodeterminetheeffectsof tex-tureonmechanicalproperties.Thetexturedataincludedin thisreportweregeneratedatLaRConpanel11.Inallcases,specimensfor textureexaminationweretakenfromthemidplaneofthepanelelementtocorrelatewiththedatafromtensileandfracturespecimens.DatawerecollectedbyusingtheSchultzbackwardreflectiontech-niqueoveranarea-24mmindiameter.
3.2.Tensile Tests
Tensile tests were conducted by Alcoa (panels 1
and 10), Boeing Aerospace (panels 4 and 7), LaRC (pan-
els 2, 4, 6, and 11), and MSFC (panels 2 and 11), as
shown in table 2. Specimens were machined from several
locations along the length of each panel, as shown in
appendix A. For panels 2, 6, and 11, multiple specimens
were machined at each tensile location at positions in thestiffener and in the skin as shown in the detail view in
figures A1 through A3. Individual specimen orientations
and locations are shown for panels 4 and 7 in figures A4
and A5. Layouts were not provided by test labs for pan-
els 7 and 10. Testing was performed, where possible, in
the longitudinal (extrusion) direction (L), and in the 45 °
and long transverse (LT) orientations with respect to the
extrusion direction (L). The test specimen configurations
are shown in appendix B, figures B1 through B3. Tensile
data were obtained by using specimens which were eitherfull thickness or that were machined about the midplane
to -3.2 mm, which is the existing external tank (ET) wall
thickness. Tests were conducted at three temperatures:ambient (25°C), liquid nitrogen (-196°C), and liquid
hydrogen (-253°C). Testing was in accordance with
American Society for Testing and Materials (ASTM)
B557-84 (ref. 4) or ASTM E8-89 (ref. 5). Boeing
Aerospace and Marshall Space Flight Center (MSFC)
tested standard size specimens, and Alcoa and LaRC
tested subsize specimens. The actual number of speci-mens tested and the dimensions are indicated in
appendix C, tables C1 through C7. Elongation to failurewas determined by measuring across fitted halves of
fractured specimens with gauge marks (MSFC, Alcoa) or
by subtracting the calculated elastic strain from the totalmeasured strain (LaRC). Although each laboratory tested
a different size tensile specimen and different methods
were used to determine elongation to failure, all proce-dures were in accordance with ASTM B557-84 or E8-89.
Examination of tensile specimen fracture surfaces was
performed at LaRC on specimens tested at 25°C by
LaRC and at -196°C by Boeing Aerospace.
3.3. Fracture Tests
Fracture testing was carried out by using part-
through surface crack (PS(T)) and through crack speci-
mens to determine residual strength and fracture resis-
tance, respectively. Boeing Aerospace and the National
Institute of Standards and Technology (NIST) performed
the part-through surface crack tests, and LaRC conducted
the through-crack tests. Fracture behavior was deter-
mined over a range of temperatures in both the transverse
and longitudinal directions with respect to the extrusion
direction. Testing was in accordance with the relevant
ASTM specifications as indicated in section 3.3.1.
3.3.1. Part-through surface crack fracture tests.
Surface crack fracture tests were performed on skin
material and weldments by Boeing Aerospace (panels 4
and 7) and by NIST (panel 6) in accordance with ASTM
E740-88 (ref. 6). Part-through surface crack specimens
were machined in both the L-S (denotes fracture plane
normal to L with propagation in the short transverse
direction) and T-S orientations, as shown in appendix A,
figures A2, A4, and A5. In all cases specimens weretaken from skin material with the stiffeners machined
off. NIST tested specimens which were the full skin
thickness (4.0 to 4.9 mm), shown in appendix B, fig-
ures B4 and B5, while Boeing Aerospace tested speci-
mens which were machined about the midplane to the
existing ET wall thickness (3.2 mm), as shown in
figure B6. Surface cracks were either semicircular or
semielliptical with dimensions for individual specimens
shown in appendix C, tables C8 and C9. Surface cracktests were conducted at three temperatures: ambient
(25°C), liquid nitrogen (-196°C), and liquid helium
(-269°C). Optical microscopy and scanning electron
microscopy (SEM) were used to examine the fracturesurfaces.
3.3.2. Through-crack fracture tests. Fracture tough-
ness behavior was characterized from crack growth resis-
tance tests (R-curves) performed on skin material at
LaRC (panels 2 and 11) in accordance with ASTM
E561-86 (ref. 7). Crack growth was measured by using
the compliance technique. The R-curves were generatedfrom full thickness middle-cracked tension (M(T)) speci-
mens machined from several locations along the length
of the extrusion in the L-T and T-L orientations, as
shown in appendix A, figures A1 and A3. As with the
part-through surface crack tests, specimens were takenfrom skin material with the stiffeners machined off. The
dimensions of the test specimens are shown in
appendix B, figure B7. Tests were conducted at two tem-peratures: ambient (25°C) and liquid nitrogen (-196°C).
Optical microscopy and SEM microscopy were used toexamine the fracture surfaces.
3.4. Welding
Panels 4 and 7 were evaluated for weldability by
Boeing Aerospace, while MSFC evaluated panel 3. The

locationof weldpanelspecimensforpanels4 and7areshowninappendixA, figuresA4andA5,respectively.Aspecimenlayoutwasnotprovidedforpanel3.Sectionsfrompanelswerevariablepolarityplasmaarcwelded(VPPAW)andinspectedin accordancewith MSFC-SPEC-504C(ref.8).Weldingparameterswerevariedtodetermineweldschedules,whichareshownin table3.Sectionsweldedat MSFCwerefull thicknessand229or279mmwideby610mmlong,whilethoseweldedatBoeingAerospacewere152mmwideby610mmlongandweremachinedfromthemidplaneto anominal3.2(2.7to 3.8)mm.Stiffenersweremachinedoff priortowelding.Jointpreparationat BoeingAerospacecon-sistedof drymachiningtheabuttingedges,followedbychemicalcleaningandwirebrushing.MSFCalsodry-machinedtheabuttingedgesbutusedmanualscrapingprior to welding.Thefiller wire was2319A1alloy,whichhasbecomestandardforAI-Cu-Lialloysjoinedbyarcweldingprocesses(refs.9 and10).Clampingtech-niquesweremodifiedbyBoeingAerospacetoaccommo-dateflatnessandthicknessvariations.All sectionswereweldedin the3G (verticalup)positionwith inertgasbacksideshielding.BoeingAerospacemeasuredtheweldmenttensilepropertiesby usingthe specimenshowninappendixB,figureB8.BoeingAerospaceeval-uatedfracturebehavioronpanels4 and7by usingthespecimenshownin figure B9, andN/ST evaluatedpanel3,weldedatMSFC,byusingthespecimenshownin figureB5.
3.5. Corrosion Tests
Corrosion studies were performed to determine how
the extrusion process affected the corrosion properties of
near peak-aged 2090. Corrosion tests were performed on
panel 6 by LaRC and Alcoa to document the corrosionresistance, to evaluate whether material flow associated
with the extrusion process created preferential corrosion
paths, and to show that residual stresses did not exist in
magnitudes that would support stress corrosion cracking.
Properties in the short transverse orientation of the stiff-ener web and in the transverse orientation beneath the
web were of particular interest because short transverse
stress corrosion failures have been reported in 2090 thick
plate (ref. 11). All corrosion tests were performed with
material from the location shown in appendix A,figure A2. The orientation and dimensions of the corro-
sion test specimens are provided in appendix B,
figures B 10 through B 13.
3.5.1. Exfoliation. Alcoa conducted exfoliation
tests by using both the exfoliation corrosion (EXCO) test
described in ASTM G34-90 (ref. 12), and the dry
bottom modified acetic acid salt intermittent spray(MASTMAASIS) test described in ASTM G85-85,
Annex 2 (ref. 13), and by Colvin and Murtha (ref. 14).The EXCO test involves continuous immersion in an
acidified salt solution followed by visual inspection of
the specimen surface. Specimens from the 2090 extru-
sion were exposed for four days, as is recommended in
ASTM G34 for 2XXX aluminum alloys, and were
inspected and rated daily. The MASTMAASIS proce-
dure is a modified salt spray test and involves cyclic
exposure to an acidified salt fog within an environmental
chamber. Dry bottom refers to an additional test modifi-
cation which requires draining residual liquid from the
chamber during the drying cycle to lower the chamber
Table 3. Summary of Variable Polarity Plasma Arc Welding (VPPAW) Parameters for 2090 Near Net Shape Extrusion
(a) Welding Schedule
Lab Pass Welding Welding Travel rate, Wire feed Wire Electrode Orificecurrent, A voltage, diameter, diameter, b diameter,
volts mm/s rate, mm/s mm mm mm
MSFC Root 95 22.6 4.1 23.3 1.6 3.96 3.18Cover 70 21 3.6 4.2 1.6 3.96 3.18
Boeing Root a60,48 31 3.2 15.2 1.6 3.18
aPulsed current, 0.250 s at 60 A, 0.150 s at 48 A.bType,2-percent thoriatedtungsten.
(b) Welding Gas Flow Rates
Backside shieldLab Pass Shield gas Shield gas flow Plasma gas flow
rate, l/s gas flow rate, Plasma gas rate, 1/sl/s
MSFC Root Helium 0.55 0.79 Argon 0.04
Cover Helium 0.55 0.55 Argon 0.02Boeing Root Helium 0.79 0.79 75% argon,
25% helium

humidity.Specimensfrom the 2090extrusionwereexposedfor four weekswith inspectionandratingatone-,two-,andfour-weekintervals.Forbothprocedures,specimenevaluationis basedoncomparisonwithstan-dardphotographsprovidedinASTMG34-90toratetheextentof attack.Two specimenconfigurationswereused:onewhichtestedtheskinbetweenstiffeners,asshowninappendixB, figuresB10andB1l(b), andonewhichtestedboth skin andstiffeners,as showninfigureB11(a).Specimensfromtheskinwereexposedtoeachof theEXCOandMASTMAASISenvironments.TwoextrusionsectionswereexposedbythedrybottomMASTMAASISprocedure,onewiththestiffenersfacingupandtheotherwiththestiffenersfacingdown.Metal-lographicsectionswerepreparedafterexposuretodeter-minethecorrosionmorphology.
3.5.2. Stress corrosion. LaRC performed stress cor-
rosion testing by using both direct-tension and modified
c-ring specimens. Direct-tension specimens (appendix B,
fig. B12(a)) were prepared and tested according to
ASTM G49-85 (ref. 15). The specimens were machined
in the long transverse orientation with the middle of thereduced section centered beneath the stiffener web, as
shown in appendix B, figure B12(b). Specimens were
initially loaded to applied stress levels equivalent to
25 percent, 50 percent, and 75 percent of the yield stress
(Sy) under constant displacement conditions. The speci-men exposure load was based on LT base mechanical
properties and was verified by specimen extension that
was measured with an extensometer for each specimen
during loading. Triplicate specimens were exposed for
40 days to a 3.5-percent NaC1 solution by alternateimmersion according to ASTM G44-88 (ref. 16). Resid-
ual strength measurements (breaking load divided by
original cross-sectional area) were obtained for each
specimen after exposure. Unstressed specimens were
also exposed to determine the reduction in residual
strength due to general corrosion. Metallographic sec-
tions were prepared from selected specimens to examine
the corrosion morphology.
A modified c-ring specimen was devised to test thestress corrosion resistance of the stiffener web under
short transverse loading. Modified c-ring specimens
were machined to include the stiffener cap and web as
well as skin material extending to either side of the web
(appendix B, fig. B 13). Two loading methods were usedto control the location of tensile stresses, as illustrated in
appendix B, figure B14. In the first method, fig-
ure B14(a), the stiffener cap was pulled down, causingtensile stresses on the outer surface of the web and at the
fillet formed by the web-skin intersection. In the second
method, figure B14(b), the stiffener cap was pushed up,
causing tensile stresses on the inside surface of the web
and at the fillets formed by the cap-web and the web-skin
intersections. A modified c-ring instrumented with strain
gauges was used to evaluate the strains in the web and at
the web-skin and cap-web fillet during loading. The
resulting strain distribution with specimen height, mea-
sured at the loading bolt, was used as a loading curve for
the specimens. The c-rings were loaded such that the
maximum stress was 70 percent Sy. Short transversemechanical properties were not measured; therefore, the
c-ring loads were based on the LT base mechanical prop-erties. The stiffener web was coated with wax for one
specimen loaded by each method in an attempt to local-
ize cracking at the fillet that might result in separation of
the stiffener. Specimens were exposed to a 3.5-percent
NaC1 solution by alternate immersion according to
ASTM G44-88 for 75 days. Metallographic sections
were prepared after exposure to examine corrosion
morphology.
4. Results and Discussion
4.1. Microstructural Characterization
The microstructure of the 2090 near net shape extru-
sion was found to be predominantly unrecrystallized and
elongated parallel to the extrusion axis, which is com-
mon for extruded A1-Li products (refs. 17 through 20).
The unrecrystallized microstructure is a result of the -9:1
extrusion ratio (the ratio of the cross-sectional area of the
billet to extrusion) (refs. 17 and 21), which is lower than
is typically found in commercial A1-Li extrusion practice
(>20:1) (ref. 18). There were differences in grain mor-
phology within the extruded section as a result of localvariations in the extrusion aspect ratio (width to thick-
ness of the extrusion). Texture analysis revealed that type
and strength of texture components also varied through-
out and confirmed a predominantly unrecrystallized
microstructure, with small amounts of recrystallization in
regions of higher aspect ratio.
4.1.1. Metallography. Optical macrographs of pan-
els 2, 6, and 11 indicated that the grain morphology was
similar for these three panels. Further metallographic
examination was performed on panel 11 only. Triplanar
micrographs of the skin and cap for panel 11 are shown
in figures 3 and 4, respectively. The structures shown are
typical, regardless of location along the length of the
panel. Figure 3 reveals that a pancake-shaped grain mor-
phology dominated the skin, which is similar to that of a
rolled product (refs. 19 and 20). High aspect ratio (>20:1)extrusions would be expected to have a microstructure of
pancake-shaped grains similar to a rolled product
(ref. 19). Figure 4 shows that the grain morphology was
fibrous in the cap, which corresponds to an extrusion

LT2090skin
ST2090skin LL2090skin300X
Figure3.Triplanar optical micrograph of center of skin (anodizedby using Barker's reagent and viewed under cross-polarizedlight).
LT 2090 cap
ST 2090 cap LS 2090 cap
300X
Figure 4. Triplanar optical micrograph of center of cap (anodizedby using Barker's reagent and viewed under cross-polarizedlight).
8
formed at a low aspect ratio (refs. 17, 19, and 20). In an
axisymmetric extrusion, where the aspect ratio is close to
unity, the grain structure will be fibrous (ref. 19). In this
study the lowest extrusion aspect ratios were found in the
cap (-4:1), while the skin had an aspect ratio >25:1.
The typical variation in grain structure through the
cross section is summarized in figure 5. On the stiffener
side of the skin, large recrystallized grains were observed
on the surface. These large grains were not observed
under the cap or web of the stiffener. Their presence sug-
gests local deformation during processing that was suffi-
cient to promote recrystallization. This deformation
presumably occurred during the rolling process to flatten
the panels. Subsequent growth of recrystallized grains
likely occurred during solution heat treatment and aging.
The complex microstructures in the web and the base
are shown schematically in figure 5(a). Selected micro-
graphs that illustrate the different grain structures withinthese areas are also included in figures 5(b) through (e).The microstructure in the web consisted of areas of
pancake-shaped grains with distinct orientations.Pancake-shaped grains in the web were of lower aspect
ratio than those found in the skin. (The extrusion aspect
ratio of the web was approximately 6:1.) Adjacent to the
surface of the web the grains were inclined in a manner
corresponding to material flow during extrusion
(fig. 5(b)). The core of the web contained an area of
pancake-shaped grains oriented perpendicular to the skin
(fig. 5(c)). The grains were offset from the midplane of
the web nearer the cap side of the stiffener and had a
lower aspect ratio in the TS plane than the inclined grainsat the surfaces.
The microstructure in the base was comprised of a
mixture of grain structures. The microstructure on the
non-stiffened side was essentially the same as the major-
ity of the skin. The material flow lines present in the
grain structure followed the contours of the fillet at the
junction of the web with the skin (fig. 5(d)). At the center
of the base, the microstructure was similar to the cap and
appeared fibrous (fig. 5(e)).
Specimens prepared by using Graft-Sargent reagentthat were viewed under conventional bright field condi-
tions had large stringers aligned in the direction of mate-
rial flow. EDS and WDS analyses revealed that the
stringers contained A1, Cu, and Fe and were likely
A1CuFe constituent particles, which are commonly found
in A1-Li alloys (refs. 22 and 23).
4.1.2. Texture analyses. The results obtained from
preferred orientation measurements are shown in fig-
ures 6 through 9. Data are presented in the form of { 111 }
pole figures and orientation distribution function (ODF)
plots, which were constructed using the { 111 }, {200},

::::; Fibrous
//_ Angledpancake
IIIIII PancakeMixture of pancake
:. and fibrousPancake
Z23 Recrystallized grains
Fillet
iiiii;iii !: i Cap
/ Web
(a) Panel element schematic.
Ii'; ,i i
! _ii
(b) Web, region 1. (c) Web, region 2.
(d) Base, region 3. (e) Base interior, region 4.
Figure 5. Skin-stiffener cross section showing microstructural variations resulting from extrusion process (anodized with Barker's reagentand viewed under cross-polarized light).
and {220} partial pole figures. The ODF analyses were
plotted following the Bunge notation with _2 sections
held constant from 0° to 90 ° in multiples of 5 °. Data
were corrected by using measured background intensities
and a calculated defocusing correction.
Cap: The {111} pole figure and the ODF plot
obtained from material in the midplane of the cap are
shown in figure 6. These plots indicate that the texturewas a combination of the fiber components present. Both
the <111> and the <112> fiber components were
observed, with the <111> fiber being predominant. The
<111 > fiber would be expected to increase yield strength
values to a greater extent than the < 112> fiber (refs. 21
and 24).
Web: Texture samples for the web were taken from
the region identified in figure 5(c). The texture was simi-lar to an extruded tube and exhibited a well-developed
<112> fiber component, as shown in figure 7. A small
degree of recrystallization was observed from the texture
data, which were identified from the Goss component,
{001 } <110>.
Skin: The {111 } pole figure and the ODF plotobtained from material in the center of the skin
are shown m figure 8. This figure indicates that the

E.D.
'1 /
I IT.D.
(a) {111 } pole figure.
0 5
q
25 30
10
35
15 20
40 45
50 55 60 65
a
80 85 90
(b) ODF plot with constant tp2 sections.
Figure 6. Texture results for midplane of cap.
75
70
n.p-
Midplane ofcap
10

E.D.
(a) { 111 } pole figure.
L_/O _,_ I.j 5 _.A LJlO
25 30
0
_2
J 15
o
35 /
8_
L_ _- 20
<3
45ts_J
Midplane ofch web
(b) ODF plot with constant (I)2 sections.
Figure 7. Texture results for midplane of web.
11

(a) { 111 } pole figure.
0
- / ^ / ix..,"
t _, 0
C _ C O , b o 0 0
° ° '(_ _ _ _ _ ( Midplaneof(/_ s n r3 z /_ _ /A/ (_ t skin
(b) ODF plot with constant q)2 sections.
Figure 8. Texture results for midplane of skin.
12

(a){111}polefigure.
] T.D.
_o_ _
0
,o_7_,;_
O 0
_W2
tPi
Midplane ofbase
(b) ODF plot with constant Ipz sections.
Figure 9. Texture results for midplane of base.
13

microstructure was predominantly unrecrystallized and
that the rolling component, Brass { 110} <112>, had thehighest intensity values. There were limited quantities of
the recrystallization components, Cube {001 } <100> and
Goss, together with the <112> fiber texture found in thestiffener.
Base: The complex microstructure in this region,
shown in figure 5(e), resulting from extrusion and rolling
produced a range of textures, as shown in figure 9. The
major component was the <111> fiber. The <001> fiber
was observed to a lesser degree. There were also ele-
ments of the rolling component, Copper { 112} <I11>,
together with some recrystallization (Goss component).
4.2. Tensile Properties
Complete tensile data obtained by each of the partic-
ipating laboratories are shown in appendix C, tables C1
through C7. The tensile properties were obtained for the
various panel elements to characterize the near net shape
extrusion. In addition, tensile properties in the L and LT
orientation were required to support calculation of frac-
ture toughness. Pressure vessels, such as the ET, are
proof tested to establish the maximum undetected flaw
size in the wall of the vessel; therefore, adequate yield
strength is required in the LT orientation to support the
hoop stresses resulting from pressurization. Data for theLT base, the L skin, and the LT skin are discussed in
terms of variation between panels, with location alongthe panel length, with position and orientation in panel
elements, with temper, and with test temperature.
Panel-to-panel variation: Tensile data for four T86
(6-percent stretch) panels (1, 4, 6, and 11), tested at four
different laboratories (Alcoa, Boeing Aerospace, LaRC,
and MSFC), were evaluated to examine panel-to-panel
6o0
500
4oo
30o
"o 200o
1o0
o Yield strength• Elongation
oo §
Panel 1 4 4 6
Lab Alcoa Boeing LaRCAerospace
11
16
14
6
2
011
MSFC
12 E8
l0 _8g
Figure 10. Panel-to-panel variation in yield strength and elonga-tion to failure. Results for all LT skin tests at 25°C for each
panel (bars represent range of data).
14
variation. The yield strengths and elongations to failure
for the panels are shown in figure 10 and represent aver-
ages of all LT skin tests at 25°C on each panel. The yieldstrengths for panels 6 (LaRC) and 11 (MSFC) were simi-
lar, with average values within 5 percent of each other.
The yield strength of panel 1 was about 10 percent belowthe average for panels 6 and 11; however, the result for
panel 1 was from a single test. The yield strength for
panel 4 was lowest, with the average (LaRC and Boeing
Aerospace data) about 16 percent below the average forpanels 6 and 11. Review of the processing parameters
(table 1) for these panels could not explain the lower
yield strength of panel 4, suggesting that these differ-
ences may be related to the post-extrusion processing
(flattening). There was considerable variation in the
elongation-to-failure data, with values over the range of
-2 percent to -9 percent, making panel-to-panel compar-
isons difficult. Elongation-to-failure values differed sub-
stantially between laboratories for tests on the same
panel where strength measurements were similar, for
example, LaRC and MSFC data for panel 11. Some
experimental error in the data may have been introduced
because of the different techniques used to measure elon-
gation to failure, as discussed in section 3.2; however, it
is difficult to reconcile such large variations because all
techniques were in accordance with ASTM specifica-
tions. The variation in average elongation may be related
to the different numbers of specimens tested at the vari-ous laboratories.
Panel length variation: Data for panel 11 (from
LaRC and MSFC) were reviewed to assess the variation
in tensile properties along the length of the near net shape
extruded panel. Room temperature yield strength and
elongation to failure are shown in figure 11 and in appen-dix C, tables C4 and C5, for the L skin, the LT skin, and
the LT base orientations measured at three panel loca-
tions. The data plotted in figure 11 represent averages ofduplicate tests from LaRC and single tests from MSFC.
The yield strength for each orientation decreased from
the front to the back end of the panel, with the reduction
ranging from 7 percent for the L skin to 14 percent forthe LT base. This reduction may be associated with
recovery processes due to billet heating during extrusion
(ref. 17). Optical metallography of the microstructure at
locations along the length of the panel did not indicate
evidence of recrystallization. However, texture analyses
at the midplane of the skin revealed the presence of
recrystallization. The relative degree of recrystallization
along the panel length was not determined. The data in
figure 11 indicate that the room temperature elongationto failure increased from front to back for the LT skin but
decreased for the L skin. The variation in elongation for
the LT base was not as systematic, but there was an over-all increase from front to back for both the LaRC and

60O
_, 500
400
'- 300o_
"O
._ 200
100
o Yield strength, LT base LaRC
• Elongation, LT base LaRC
o Yield strength, L skin LaRC
• Elongation, L skin LaRC
II Yield strength, LT base MSFC
• Elongation, LT base MSFC
a Yield strength, LT skin MSFC
• Elongation, LT skin MSFC
All
O0 AllO0 A
llO°
10
0 0Front Center Back
Position along length
t_
6O
4_O
2
Figure 11. Variation in yield strength and elongation to failurealong panel length. Results for panel I 1 L skin, LT skin, and LT
base at 25°C. Bars represent range of data.
MSFC data. The differences in LaRC and MSFC values
may be related to the different methods used to measure
elongation to failure.
MSFC data at -196°C and-253°C for the L skin, the
LT skin, and the LT base for panel 11 (provided in
appendix C, tables C6 and C7) also exhibit a similar
reduction in yield strength from the front to the back end
of the panel. Elongations to failure did not exhibit a clear
trend from the front to the back of the panel in either the
L or the LT orientations.
Stress-strain behavior: The variation in the stress-
strain behavior at 25°C for the base, cap, and skin is
shown by the curves in figure 12. The data shown are for
panel 11 and are typical of the results obtained on other
panels. AI-Li extrusions with axisymmetric shapes and a
concomitant <111> fiber texture tend to have high yield
strength and low elongation to failure, whereas extru-
sions of high aspect ratio, which exhibit rolling-type
textures, tend to have lower strengths and higher elonga-
tions to failure (refs. 19 and 21). The present data for the
2090 extrusions tend to support these observations, and
as figure 12 shows, the highest overall stress-strain
curves are associated with areas of the extrusion that
have low aspect ratio (cap and base), while areas of high
aspect ratio have lower strength with the highest elonga-
tion to failure observed in the 45 ° skin. Where regions of
700
600
5OO
_. 400
g, 300
200
100
lo.°°- .... . _.
45 ° skin
L base
LT skin
L cap
i ! i i [ i , , , 1 I
0 .05 .10 .15Strain
Figure 12. Variation in stress-strain behavior with respect to panel
element and orientation. Individual tests at 25°C from center of
panel l 1.
mixed microstructure exist (base), the changes in grain
structure (pancake-shaped to fibrous) appear to override
textural differences, and the elongations to failure are
more dependent upon grain alignment in the base-fillet
region that results from grain flow during extrusion.
Panel element variation: Tensile yield strength and
elongation to failure are plotted in figure 13 from LaRC
data shown in appendix C, table C4, for several panel
elements and orientations. The T86 data represent aver-
ages of room temperature tests for each panel element
along the length of panel 11 and the front of panel 6. The
T8E46 data represent averages of room temperature tests
for each panel element at the middle of panel 2. Trends in
yield strength for each panel element were the same for
700
600
500
400
300
"o.o 200
100
On
_ll oII
II
o T86 yield strength• T86 elongation
II T8E46 yield strength
• T8E46 elongation
L 45 ° LT L L L LT
skin skin skin cap web base base
Panel element
Figure 13. Variation in yield strength and elongation to failurewith panel element. LaRC results for panels 6 and 11 (T86) and
panel 2 (T8E46) at 25°C. Bars represent range of data.
15

the two tempers. Yield strengths were highest for the L
base and the L cap and lowest for the 45 ° skin. The L and
the LT skin, the L web, and the LT base had similar yield
strengths. Both the L and the LT base had low elongation
to failure, with values under 4 percent. Elongation to fail-
ure was highest for the 45 ° skin in the T86 temper and
for the L cap in the T8E46 temper. The L cap, the web,
the skin, and the LT skin had similar elongations tofailure.
The yield strengths and elongations to failure could
be directly related to the texture and grain morphologies
in individual panel elements. The highest strengths were
associated with regions of fibrous grains and the < 111 >
fiber texture (cap and base). Lower strengths were asso-
ciated with rolling type textures, the <112> fiber compo-
nent (skin and web), and with pancake-shaped grain
morphologies. The skin material exhibited the lowest
strength and highest elongation to failure in the 45 ° ori-
entation with similar strength and elongation to failure inthe L and the LT orientations. These results are similar to
other unrecrystallized AI-Li alloys in sheet and plate
(refs. 25 through 27) and compare favorably with the
expected behavior predicted by the texture data, dis-cussed in section 4.1.2.
Aluminum alloy extrusions generally retain amixture of <111> and <100> fiber textures when the
extruded cross section is axisymmetric (aspect ratio
-1:1) (refs. 19 and 24). The yield strength of an axisym-
metric extrusion of an AI-Li-Cu alloy (where most grainswere oriented within 5 ° of the <111> fiber axis) was
shown to be 27 percent higher than an extrusion with an
aspect ratio of 8:1 (ref. 21). In the present study, the 2090
near net shape extrusion had an aspect ratio which variedfrom 4:1 to 25:1 and contained a number of texture com-
ponents which were dependent upon position in the crosssection. The room temperature tensile results obtained
for panel 11 in appendix C, table C4, showed that thematerial in the skin, which had an aspect ratio of 25:1,
typically had -10 to 20 percent lower yield strength in
the extruded direction than did the material in the cap and
base, which had an aspect ratio of 4-6:1. Tempus,
Scharf, and Calles (ref. 19) also observed that the tensile
strength of extruded 8090 A1-Li alloy was reduced by
-10 percent when the aspect ratio was increased from 1:1
to -7:1, with a corresponding transition from a fiber to a
rolling texture.
Yield strength and elongation to failure for three
panel elements (L skin, LT skin, and LT base) at 25°C,
-196°C, and -253°C are shown in appendix C, tables C5
through C7. The variation in yield strength with tempera-
ture was the same for both the T86 (panel 11) and the
T8E46 (panel 2) tempers. The average yield strengths
increased with decreasing temperature for all elements,
16
and the relative strengths of the panel elements were
the same at each temperature. Elongations to failure
increased with decreasing temperature for the L skin andremained relatively constant for the LT orientations.
Effect of temper: Cold work typically improves the
tensile properties of 2090 alloy by promoting a higher
dislocation density and therefore more sites for nucle-
ation of the strengthening precipitate, T 1 (AI2CuLi), dur-
ing aging (refs. 28 and 29). Therefore, the 6-percent
stretch material (T86) should have higher yield strength
than the 3-percent stretch material (T8E46). However, by
using different aging practices, the near net shape
extruded panels were aged to produce the same target
mechanical properties; therefore, the properties should
be similar, regardless of temper. The yield strengths at25°C for the skin in the L, the LT, and the 45 ° orienta-
tions (fig. 13) were nearly identical for both stretch lev-
els. The average yield strengths were slightly higher in
the T86 condition for the L cap, the L web, and the L
base than in the T8E46. The average yield strength wasless in the T86 condition for the LT base; however, the
T8E46 data fall within the range of the T86 data. An
exception to these observations is reflected in the yield
strength of panel 4 (T86), appendix C, tables C2 and C4,
which was observed to be lower than the other 6-percent
stretch panels (fig. 10), and was also less than the yield
strength of panel 2 (T8E46), appendix C, tables C4and C5. Elongation values for T86 and T8E46 overlap
for every panel element except LT and 45 ° skin. As
stated earlier and as illustrated in figure 13, panel ele-
ment position has a greater effect on yield strength for
the near net shape extruded panels than does the temper.
Comparisons with other alloys and product
forms: The tensile properties for panel 11 were com-
pared with published results for other 2090 A1-Li alloy
products and 2219 Al alloy sheet and plate, as shown in
appendix C, table C10 (refs. 1 l, and 30 through 34). Ten-sile data for the near net shape extruded panel included in
table C10 represent averages of all tests performed at
MSFC on panel skin for each orientation and temperature
regardless of location along the panel length. Data for
2219 and 2090 plate are shown for comparison as the ET
is integrally machined from thick plate. Data for a 2090
T-section extrusion is included for similar product com-
parison. Yield strength data plotted in figure 14 are aver-
ages of L and LT. The yield strength of the near net
shape extruded panels was comparable to other 2090
products at room temperature and slightly lower at
reduced temperatures, as shown in figure 14. The 2090
products were higher strength than 2219 at all tempera-
tures, and the yield strengths increased by about the same
amount with decreasing temperature. Values of elonga-
tion to failure shown in figure 15 are for the LT orienta-
tion only. The values for 2219 were higher than 2090

700
600
500
400l=O
300
200>-
100
• 2090-T86 near net shape extrusion• 2090-T86 extrusion (refs. 11 and 32)• 2090-T81 plate, 12.7 mm (refs. 11, 30, and 34)• 2090-T81 plate, 19.1 mm (ref. 30)• 2219-T87 plate 38.1 mm (ref. 31)
-253 -196 25
Temperature, °C
Figure 14. Variation in yield strength with temperature for various2090 product forms and 2219 plate. Bars represent range ofdata.
14
_12
_1o
d 80
_ 60
m 4
• 2090-T86 near net shape extrusion• 2090-T86 extrusion (ref. 32)• 2090-T81 plate, 12.7 mm (refs. 11, 30, and 34)• 2090-T81 plate, 19.1 mm (ref. 30)• 2219-T87 plate, 38.1 mm (ref. 31)
t •
-253 -196 25Temperature, °C
Figure 15. Variation in elongation to failure with temperature forvarious 2090 product forms and 2219 plate. Bars representrange of data.
products at room temperature and increased with reduc-
tion in temperature. Elongation to failure for the 2090
products did not exhibit consistent trends with decreasing
temperature. Transverse elongation for the near net shape
extruded panel increased with reduction in temperatureto -196°C, followed by a decrease with further reduction
to -253°C. Data for the 19-mm plate exhibit the reverse
trend, with a decrease in elongation to -196°C followed
by an increase to -253°C. Data for the 12-mm plate
decrease with each reduction in temperature. The com-
bined data for the 2090 products represented, however,
show a clear trend of decreasing elongation with reduc-
tion in temperature. The L orientation data shown in
appendix C, table CI0, for the near net shape extruded
panel and for the 1.6-mm sheet indicate a trend similar to
the LT orientation for the near net shape extruded panel:
an increase with reduction to -196°C, followed by a
decrease with reduction to -253°C. Conversely, elonga-
tion in the L orientation for the 2090 plate products
increased with decreasing temperature; however, the val-
ues were still below 2219 at each temperature. The data
for a T8E46 extruded panel (panel 2), shown in appen-
dix C, tables C5 through C7, indicate increased strength
with reduction in temperature, while elongation first
increased and then decreased. These data agree with the
findings of Glazer et al. (ref. 35) for 2090-T8E41 plate.
Fractography: Fractographic examinations of ten-
sile specimens were carried out at LaRC on specimens
tested at 25°C by LaRC and at -196°C by Boeing
Aerospace. Fractured tensile specimens were examined
from the web and cap (L), from the base (L and LT), and
from the skin (L, LT, and 45°). The macroscopic fracture
was related to the grain morphology (grain shape and
alignment), which varied with panel element as shown in
figure 5. The microscopic mode of failure was predomi-
nantly by intersubgranular separation, regardless of test
temperature or specimen position and orientation. Con-
stituent particles, which were revealed in the metallo-
graphic studies, were occasionally observed on the
fracture surfaces, although they did not play a dominant
role in the fracture process.
Tensile specimen fractography of the base in the L
and LT orientations showed that macroscopic fracture
was dependent upon grain orientation associated with
material flow during extrusion. Figure 16 shows that the
LT base specimens typically fractured at an angle to the
tensile axis. The primary fracture tended to follow
boundaries of pancake-shaped grains which were aligned
with the fillet, as was shown in figure 5(d). Microscopi-
cally, failure was intersubgranular, as shown in figure 17.
Fracture was more complex in the L base specimens and
included an interior region of fiat fracture and two areasof slant fracture. The flat fracture was associated with the
region of mixed fibrous and pancake-shaped grainsshown in figure 5(e), and the areas of slant fracture were
associated with the pancake-shaped grains aligned in the
fillet, figure 5(d). The strengthening contribution of the
region of mixed fibrous and pancake-shaped grains
resulted in higher yield strength in the L base than in the
LT base (fig. 13). Elongations to failure were low for
both orientations and were related to the grain boundaries
approximately parallel to the critically resolved shearstress.
The tensile fracture of all skin specimens was by
macroscopic shear. Grain boundary delamination was
observed in specimens tested in the 45 ° orientation at
17

0.4mm
Figure16.Through-thicknesscross section of tensile failure in base tested at 25°C in the LT orientation.
5 _tm
Figure 17. Typical intersubgranular tensile failure at 25°C showing pancake-shaped grains.
18

0.5 mm
(a) Low-magnification micrograph showing steps caused by delamination.
25 _m
(b) High-magnification micrograph showing delamination along grain boundaries.
Figure 18. Typical tensile failure in skin tested at 25°C in 45 ° orientation.
19

lmm
(a) Low-magnification fractograph showing extensive delamination.
(b) High-magnification fractograph showing intersubgranular separation.
Figure 19. Typical tensile failure in skin tested at -196°C in LT orientation.
5 _tm
20

25°C, as shown in figure 18. Delamination was more
evident in specimens tested at -196°C, as seen on the
fracture surface shown in figure 19(a), than at 250C,
although only the LT orientation was examined. Consis-
tent with room temperature and other panel element tests,
intersubgranular separation was the predominant micro-
scopic failure mode, as shown in figure 19(b). Other
investigators (refs. 35 and 36) have observed similar
fracture behavior in unrecrystallized 2090-T81 and in
2090-T8E41 plate.
4.3. Fracture Properties
As stated earlier, the ET is proof tested to determine
the maximum undetected flaw size in the vessel wall. It
is not economical to proof test the ET at the cryogenic
use temperature; however, since the fracture toughness
of 2219 increases at cryogenic temperatures, proof test-
ing can be done at ambient temperature. To determine
whether the fracture properties for the near net shape
2090 extrusion exhibited a trend of increasing toughness
with decreasing temperature, fracture data were obtained
at room and cryogenic temperatures. Fracture testing on
the 2090 extrusion was carried out by using specimens
containing either part-through surface cracks (to simulate
a defect in the welded ET) or by using through cracks (to
determine the extent of stable crack growth). Testing was
performed to determine the effects of crack geometry,
orientation, temperature, and temper on the fracture
behavior of the near net shape extrusion and to enable
comparison to be made with other 2090 product forms
and conventional AI alloys.
4.3.1. Part-through surface crack tests. Surface
crack data generated at Boeing Aerospace (panels 4
and 7) and NIST (panel 6) for extruded skin material are
shown in appendix C, tables C9 and C10, respectively,
and are summarized in table 4. Data from all tests per-
formed were evaluated to identify trends in material per-
formance regardless of the validity requirements of
ASTM E740-88. The residual strength and toughness
(Kle) were determined as a function of crack geometry,
orientation, temperature, and temper.
Surface crack geometry: NIST examined the effect
of crack geometry on toughness behavior with T-S orien-
tation specimens by using two crack shapes, semiellipti-
cal and semicircular. As indicated in the notes of table 4,
the crack geometries examined were such that a/c (the
ratio of crack depth to half-surface crack length) was in
the range of 0.28 to 0.38 for semielliptical and 0.72 to
0.94 for semicircular cracks. For the NIST fracture data
(summarized in table 4), Kle values were overall highest
for the semielliptical crack. The semielliptical crack
showed a trend for increased residual strength and Kle
with decreasing temperature, as shown for Kle in
figure 20, whereas the data for the semicircular crack
decreased from 25°C to -196°C with no further
degradation from -196°C to -269°C. The data in table 4
also indicate that the residual strength and Kle values for
2090 alloy plate (ref. 37) were generally superior to the
2090 extrusion for a specimen containing a similarly
shaped crack, that is, crack geometries c and d. The
residual strengths and Kte values of the 2219 plate
(ref. 38) were significantly higher than the 2090 extru-
sion, considering relative specimen widths (table 4
Table 4. Summary of Surface Crack (PS(T)) Fracture Results
Temperature, Residual Kle (MPa 4rm)Laboratory Alloy/condition W, mm a/c °C Orientation strength, MPa
25 T-S 393.6 + 6.9 40.3 + 0.1L-S 383.7 + 7.9 38.4 + 0.8
BoeingAerospace
NIST
Ref. 37
2090-T86
Panel 4
5-percent stretch
2090-T8EA6
Panel 7
2.5-percent stretch
2090-T86
Panel 6
6-percent stretch
2090-T81
64
102
64
102
0.48-0.54
(semicircular)
0.28-0.38
(semielliptical)
0.72--0.94
(semicircular)
0.48-0.55
(semicircular)
T-SL-S
333.7437.4 + 7.2
-196
25 T-S 373.0 37.9L-S 337.1 33.2
-196
25-196-269
25-196-269
T-SL-S
T-S
T-ST-S
T-ST-ST-S
T-SL-S
T-SL-S
25
192.3406.8
204.5 + 17.5244.0 + 13.0274.0 + 7.0
366.5 + 30.5316.5 + 29.5322.0 + 14.0
339.5440.8
405.7514.5
33.843.5 + 0.8
19.240.7
31.2 + 2.634.0+ 1.337.6 + 0.9
27.8±4.223.1±1.923.7±0.9
32.942.5
40.050.3
-196
Ref. 38 2219-T87 38.2 1.16-1.20 25 T-S 435 79.8(semicircular) - 196 T-S 521 100.1
21

60
50
40
30
20
10
0
• Semielliptical crack
O Semicircular crack
8 o0
-269°C -196°C 25°CTempemture
Figure 20. Effect of surface crack shape and temperature ontoughness. Results for individual tests at NIST on panel 6 in T-Sorientation.
notes). Similar observations have been made on 2.3- and
3.2-mm 2090-T81 plate, where residual strengths were
found to be 6 percent less than 2219-T87 plate of thesame thickness (ref. 38).
Orientation and temperature: Boeing Aerospace
tested samples in the L-S and T-S orientations with semi-
circular crack geometries. The data plotted in figure 21
show that for both 2090 tempers (T86 and T8E46), theL-S orientation was tougher than T-S at -196°C and
that the T-S orientation was tougher than L-S at 25°C.
Earlier tests (ref. 37) on similar specimens of 19.l-mm
2090-T81 plate machined to 3.2 mm showed that the
toughness increased for both T-S and L-S orientations
with a decrease in temperature, as shown in figure 21.
This result would therefore imply that the reverse trendin the data at 25°C for the 2090 extrusion is related to
extrusion or post-extrusion processing.
Temper: Boeing Aerospace examined the effect of
temper on the toughness of the near net shape extrusion.
The data plotted in figure 21 show that the T86 temper
(6-percent stretch) was slightly tougher than the T8E46
temper (3-percent stretch) regardless of orientation or
test temperature. Both T86 and TSE46 materials exhibit a
reduction in the Kte value with decreasing temperature in
the T-S orientation, as shown in table 4 and in figure 21.
The reason for the loss in toughness in the T-S orienta-
tion is unclear; however, it is probably related to process-
ing because the mechanical properties of A1-Li alloys
typically improve with increasing amounts of preagingstretch (refs. 18, 29, and 39).
Fractography: LaRC carried out fractographic
examinations on the T86 part-through surface crack
(PS(T)) specimens from panel 4 tested at Boeing
22
60
50
40
30
20
10
o tO*
O*
O*
wt g_O*
• T86o T8E46• T81 plate (ref. 37)• Single test• Duplicate test
L-S T-S L-S T-S-196°C 25°C
Orientation
Figure 21. Comparison of surface crack test results from BoeingAerospace for 2090 extrusions with 2090 plate.
Aerospace. Photomicrographs of through-thickness frac-
tured sections, examined by using polarized light, are
shown in figure 22. These micrographs indicate that thespecimens tested at 25°C in both the L-S and the T-S ori-
entations had slant fracture, while those tested at -196°C
exhibit flat fracture. This phenomenon has been observed
by other workers (refs. 40 and 41) and has been attrib-
uted to a change in the stress state in the test sample asthe temperature decreases.
The electron micrographs shown in figures 23
through 26 display features of the order of subgrain size,
which indicate that microscopically, failure occurred
by intersubgranular separation for both L-S and T-Sorientations at 25°C and-196°C. Similar observations
have been made on 2090-T8E41 plate (ref. 36) where it
was noted that failure mode was unchanged with test
temperature over the range 25°C to -269°C. Macroscop-
ically, grain boundary delaminations were observed onlyin specimens tested at -196°C and were more evident
in the L-S specimens (fig. 25) than the T-S specimens(fig. 26). Grain boundary delamination was not observed
during fracture at 25°C. Increases in the fracture tough-ness of AI-Li alloys with decreasing temperature have
been attributed in part to the process of delamination
toughening, which results from the splitting of grainboundaries as the crack tip advances (refs. 40 and 41).
While delaminations were present on the fracture sur-
faces of specimens tested at -196°C, the delaminations
were not sufficiently deep or numerous enough to
explain the differences in the toughness values with
temperature.
4.3.2. Through-crack fracture tests. Results from
middle-cracked tension (M(T)) specimens machined
from skin material panels I 1 and 2 and tested at LaRC
are presented in the form of R-curves in figures 27

(a) T-S specimen tested at 25°C.
50 p.m
(b) L-S specimen tested at 25°C.
50 _tm
50 _tm
(c) T-S specimen tested at -196°C.
50 ktm
(d) L-S specimen tested at -196°C.
(e) Schematic of PS(T) fracture surface showing location of cross sections.
Figure 22. Through-thickness cross sections of 2090 PS(T) fracture specimens (anodized with Barker's reagent and viewed under cross-
polarized light).
23

lmm
(a) Through-thickness cross section.
750 I.tm 20 _tm
(b) Top view of cross section. (c) Area in center of figure 23(b).
Figure 23. Fracture surface of PS(T) specimen in L-S orientation at 25°C.
24

500 _tm
(a) Through-thickness cross section.
500 _tm 20 _m
(b) Top view of cross section. (c) Area in center of figure 24(b).
Figure 24. Fracture surface of PS(T) specimen in T-S orientation at 25°C.
25

500 I.tm
(a) Through-thickness cross section.
500 l.tm 20 _tm
(b) Top view of cross section. (c) Area in center of figure 25(b).
Figure 25. Fracture surface of PS(T) specimen in L-S orientation at -196°C.
26

%
500 _tm
(a) Through-thickness cross section.
500 l.tm 20 grn
(b) Top view of cross section. (c) Area in center of figure 26(b).
Figure 26. Fracture surface of PS(T) specimen in T-S orientation at -196°C.
27

120
100
_ 60_4o
20
2090
2219 (ref. 31)
.... 1 .... i .... | .... i
0 10 20 30 40
Aa, mm
Figure 27. Comparison of the resistance to stable mating of 2090-
T86 extrusion with 2219-T87 plate in L-T orientation at 25°C.
Data from M(T) specimens.
120
100
L_ 80
60
20
...... L-T
........... T-L
, i ' ; .... 1'0'Aa, mm
Figure 28. Effect of orientation on fracture behavior of 2090-T86
extrusion at 25°C. Data from M(T) specimens.
120
100
k_ 80ell
60
.,_4o
20
__ 25°C
............ 196°C
' ' ' .... 1.0 .... '5 15
Aa, mm
Figure 29. Effect of temperature on fracture behavior of 2090-
TSE46 extrusion in L-T orientation. Data from M(T) specimens.
through 31. The width of the specimens was insufficient
to maintain elastic conditions at all values of the applied
load, and the net section stress exceeded yield; hence, the
tests do not meet the requirements of ASTM E561-86
and are invalid. Furthermore, because of the overall wav-
28
120
100
80_" 60
20
.......°°°.°°..
.... ...°°'"" ....
..... °."
.......... •.......... 2090-T8E46 (3-percent stretch)
_" 2090-T86 (6-percent stretch)
.... .... 1.0 .... 1'5
Aa, mm
Figure 30. Effect of stretch on fracture behavior of 2090 extrusion
in L-T orientation at 25°C. Data from M(T) specimens.
120
100
1_ 8o_" 60
_"_ 40:
20
.,=,l
0 5
2090-T8E46 (3-percent stretch)
2090-T86 (6-percent stretch)
.... llO .... I15
Aa, mm
Figure 31. Effect of stretch on fracture behavior of 2090 extrusion
in T-L orientation at 25°C. Data from M(T) specimens.
iness in the specimens, crack length determination with
the compliance technique was difficult. Therefore, only a
limited number of tests have been completed. Alternative
specimen designs and techniques for crack length mea-
surement are currently being explored to overcome this
problem. A comparison between the R-curves obtained
for the 2090 extrusion and the 2219-T87 (ref. 31) plate,
machined down to the same thickness, is shown in
figure 27. The R-curves are plotted as a function of
orientation, temper, and temperatttre in figures 28
through 31.
Orientation: The variation in stable tearing with ori-
entation is illustrated in figure 28 for the T86 material,
tested at 25°C. The R-curves indicate that the resistance
to stable tearing is higher in the L-T orientation than in
the T-L orientation. The material in the skin is predomi-
nantly unrecrystallized, as shown by the texture data.
R-curve tests on other unrecrystallized AI-Li alloys have
exhibited a similar trend with orientation (refs. 26
and 27) in that the toughness of rectangular and
T-section extrusions was approximately halved in the

T-L orientation when compared with the L-T orientation
at 25°C. Therefore, the loss in toughness in the T-L ori-
entation in the present study is likely a result of the
effects of preferred orientation resulting from the unre-
crystallized grain structure.
Temper: The effect of the T86 temper (6-percent
stretch) and the T8E46 temper (3-percent stretch) onR-curve behavior was determined at 25°C in both the
L-T and T-L orientations. As shown in figure 30, the
R-curve in the L-T orientation is higher for the T86 mate-
rial. The data in figure 31 indicate the opposite trend for
the T-L orientation, although only limited data from onetest in each orientation are available. Other investigators
have observed a similar trend in the fracture toughness of
AI-Li alloys in the T8X temper with orientation (refs. 26
and 42).
Temperature: One test has been completed to dateat -196°C. The test was on T8E46 material in the L-T
orientation and is shown for comparison with a 25°C test
in figure 29. A drop in the resistance to stable tearing
was observed with decreasing temperature from 25°C to
-196°C. However, this is not typical behavior for 2090
alloy in sheet and plate form, which would be an
expected increase in crack growth resistance; therefore,
no attempt has been made to draw conclusions from onedata set.
Fraetography: The fracture surfaces of the T8E46
material (panel 2) were examined after testing in the L-Torientation at 25°C and -196°C. The fractography of the
M(T) specimens was very similar to the PS(T) specimensdescribed earlier. Optical microscopy revealed large
shear lips and slant fracture at 25°C and flat fracture at
-196°C. The scanning electron micrographs of the frac-
ture surfaces, taken close to the fatigue crack where sta-
ble crack growth would be expected to occur, are shown
in figures 32 and 33. The fractographs indicate that fail-
ure occurred by intersubgranular separation at both tem-
peratures. The figures also show that grain boundarydelamination was absent in the specimen tested at 25°C;
however, minor delaminations were present at -196°C.
Constituent particles were not observed on the fracture
specimen surfaces.
4.4. Welding
Based on visual appearance of the welded sections,
Boeing Aerospace found no observable difference
between welded specimens of 2090 sheet, used for weld
schedule development, and the near net shape extrusion
of equal thickness. Boeing Aerospace used a single passweld schedule on both the sheet and extrusion, as shown
in table 3. The weldments were inspected to the require-ments of MSFC-SPEC-504C with respect to surface and
internal defects and were found acceptable.
MSFC noted that much less heat input (15 amps)
was required to produce an acceptable weld on the
2090 alloy extrusion when compared with another A1-Li
alloy, 2095. A cover pass, as shown in table 3, was
required due to undercut in some sections of the weld.
Radiographic examination of the welds revealedsome scattered microporosity along the weld toes;
however, the welds were acceptable per specification,MSFC-SPEC-504C.
4.4.1. Weldment tensile properties. Weldment ten-
sile properties at 25°C and -196°C for 2090 extrusions
welded by Boeing Aerospace are compared to 2090-T81
plate and 2219-T87 sheet (ref. 31) in table 5. The 2090
extrusion data represent properties averaged for four T86
welded panels and for one T8E46 welded panel, with
complete data shown in appendix C, table C 11. For both
orientations, weldments exhibited higher yield and ulti-
mate strengths at -196°C than at 25°C. At both tempera-tures, weldments of 2090-T8E46 extrusion had the
highest yield and ultimate strengths of all the product
forms compared. At 25°C the 2090-T86 extrusions had a
higher ultimate strength than the 2090-T81 plate or2219-T87 sheet. At -196°C, the 2090-T86 extrusion had
a higher ultimate strength than the 2090-T81 plate and a
slightly lower ultimate strength than 2219-T87 sheet.
Boeing Aerospace observed that failure of the weldsof the 2090 extrusion occurred in the heat-affected zone
(HAZ) of the weld. The reduction in properties in the
HAZ compared to the parent metal was overaging and
softening that resulted from thermal cycling during
welding (ref. 43).
4.4.2. Weldment fracture properties. The 2090 near
net shape extrusion weld metal fracture data, generated
by Boeing Aerospace and NIST, are summarized in
table 6 and shown in detail in appendix C, tables C12and C13. Data for welded 2090-T81 plate and 2219-T87sheet are also shown in table 6. All surface crack tests
were invalid according to ASTM E740-88, as indicated
in tables C12 and C13. All specimens were tested with
the surface crack positioned in the fusion zone of the
weldments. The mechanical properties in the fusion zoneaxe not related to those of the worked skin material
because the melting and solidification during welding
removes any effect of prior processing. Therefore, no dif-
ference in fracture data was expected or observed for
comparable crack geometries, with respect to productform, stretch, or orientation.
Boeing Aerospace reported that the fracture tough-
ness of both the 2090 plate and the extrusion weldments
were similar (ref. 37). The residual strength and Kleincreased for both the extrusion and the sheet weldments
at -196°C when compared with 25°C. Again, there
29

(a) Low-magnification micrograph of fracture surface.
100 gm
20 p.m
(b) High-magnification micrograph showing intersubgranular separation.
Figure 32. SEM fractography of 2090-T8FA6 extrusion M(T) specimens tested at 25°C in L-T orientation.
30

100 _tm
(a) Low-magnification micrograph of fracture surface and grain boundary delamination.
20 I.tm
(b) High-magnification micrograph showing intersubgranular separation.
Figure 33. SEM fractography of 2090-T8E46 extrusion M(T) specimens tested at -196°C in L-T orientation.
31

Table 5. Summary of Tensile Properties of Welded 2090 and 2219 Alloys
Alloy/condition
2090-T86
Product
form
Exla'usion
Welding
process Sy (MPa) Su (MPa) Sr (MPa)VPPA
Orientation
196.5
25°C
296.4
-196°C
206.8
Su (MPa)
358.5
LT 175.2 313.4 222.7 368.0
2090-T8E46 Extrusion VPPA L 219.1 337.6 270.9 413.3
2090-T81 (ref. 37) Plate VPPA L 156.8 296.8 205.8 377.8
LT 171.1 286.6 198.9 332.3
2219-T87 (ref. 31) Sheet GTA 195.1 279.2 218.5 376.4
Table 6. Summary of Weldment Surface Crack (PS(T)) Fracture Results
Temperature, ResidualLaboratory Alloy/condition W, mm a/c oC Orientation Kle (MPa _)strength, MPa
25 T-S 218.2+ 1.0 21.5 :t:0L-S 212.7 + 2.4 20.3 + 0.3
Boeing
Aerospace(VPPA)
NIST
(VPPA)
Ref. 37
(VPPA)
Ref. 31
(GTA)
2090-T86Panel 4
5-percent stretch
2090-T8E46
Panel 7
2.5-percent stretch
2090-T86
Panel 6
6-percent stretch
2090-T81
2219-T87
102
64
64
102
95
0.42-0.46
(semicircular)
0.26--0.32
(semielliptical)
0.72-0.94
(semicircular)
0.42-0.46
(semicircular)
0.26--0.27
(semielliptical)
-196 T-SL-S
245.4 + 1.4230.3 + 15.9
24.4 + 0.822.4 + 1.3
25 T-S 213.7 21.8
-196 T-S 248.2 24.7
25
-269
25
-269
T-S
T-S
T-S
T-S
T-SL-S
T-SL-S
25
176.0 + 15.0
208.0
207.5 + 8.5
252.5 + 4.5
204.6210.1
241.3238.3
-196
24.1 +0.6
27.0
14.3 + 0.4
19.2 + 0.4
20.820.9
23.024.4
25 209.6 34.0
-196 237.2 40.0
-269 256.5 39.0
was no effect of either stretch for the extrusions, or of
orientation for the extrusions or plate, on the toughness
reported by Boeing Aerospace.
As shown in table 6, weldments tested by NIST
exhibited an increase in toughness for both the semicir-
cular and semielliptical cracks with decreasing tempera-
tures from 25°C to -269°C. Residual strengths for the
semielliptical crack were slightly lower than for the
semicircular crack at both 25°C and -269°C. Toughness
values were higher for the semielliptical crack at both
temperatures; however, the calculated fracture toughness
values were not valid according to ASTM E740-88, as
general yielding occurred at 25°C, and stable crack
growth was observed at -269°C. Macroscopically, speci-
mens fractured at 25°C had large shear lips, while those
tested at -269°C exhibited flat fracture. Under micro-
scopic examination, there was a transition from dimpled
rupture at 25°C to intergranular fracture at -269°C.
In general, the residual strength values for the extru-
sion weldments generated by Boeing Aerospace and
NIST compare well with data for gas tungsten arc (GTA)
welded 2219-T87 (ref. 31), as shown in table 6. How-
ever, the Kle values for the 2219-T87 weldments are
nearly twice those of the 2090 near net extrusions.
4.5. Corrosion
Corrosion resistance is highest for 2090 in peak-aged
tempers and is maintained with either slight underaging
or slight overaging (near peak-aged) (refs. 11, 14, 44,
and 45). However, corrosion resistance is greatly
reduced with severe underaging (refs. 44 and 46) or over-
aging (ref. 47). The 2090 near net shape extrusions
exhibited comparable exfoliation and stress corrosion
resistance to peak and near peak-aged 2090 plate, sheet,
and extruded products. Complete tabulated test data
for panel 6 are included in appendix C, tables C14
through C17. The corrosion tests were for screening pur-
poses only and were not intended to develop a material
rating; however, the results were evaluated relative to
ASTM G64-91 (ref. 48) and NASA MSFC-SPEC-522B
(ref. 49).
32

ASTM G64-91 classifies the resistance of aluminum
alloys to stress corrosion cracking with ratings A (very
high) through D (low), based on laboratory test results
from multiple lots of material and on service history. To
meet an A rating requires no specimen fractures in labo-
ratory tests with exposure stress at 75 percent of the spec-
ified minimum yield strength and no record of service
problems. The MSFC specification sets the criteria for
selection of materials for launch vehicle application and
provides both design guidelines to control stress corro-
sion cracking and tables of recommended materials,
based on laboratory testing and service experience.
Materials are grouped in three tables, identified as 1, 2,
and 3, and referenced as high, moderate, or low resis-
tance to stress corrosion cracking, respectively. The cur-
rent external tank material 2219 is rated A by ASTM
G64-91 and is considered table 1 material by MSFC-
SPEC-522B for all products in T6 and T8 tempers. Stress
corrosion test results in the present study indicate the
2090-T8 extrusion would be rated A by ASTM G64-91
and should be sufficient for table 1 inclusion by MSFC-SPEC-522B.
4.5.1. Exfoliation. The exfoliation results for the
2090 extrusion, summarized in table 7, indicate that
moderate exfoliation occurred during the EXCO test,
while only pitting occurred during the dry bottomMASTMAASIS test. The general appearance of the
specimens after exposure is shown in figure 34.
The EXCO test was developed for 2XXX and 7XXX
series aluminum alloys and has been documented to pro-
duce overly severe ratings for A1-Li alloys (ref. 14),
which develop corrosion pits during exposure to the
EXCO environment. The pits undercut the surface,
resulting in flaking of the undercut material. This flaking
is mistaken for exfoliation during visual inspection and
rating and accounts for the ED rating applied to the 2090
extrusions (refs. 11 and 14) and plate (ref. 14) shown in
table 7. The dry bottom MASTMAASIS test has been
shown to produce results for AI-Li alloys that correlate
well with atmospheric exposures (ref. 14). The test also
accurately discriminates between resistant and suscepti-
ble tempers of 2090. The MASTMAASIS data shown intable 7 indicate the performance of the near net shape
extrusion is similar to 2090 plate and extruded products
in the T8 condition (refs. 11 and 14). The EXCO test also
indicated that exfoliation occurred for the near net shape
extrusion, again illustrating the severity of the EXCOtest.
Metallographic sections taken from the base and skin
of the test samples confirmed that for both EXCO and
MASTMAASIS exfoliation test exposures, the corrosion
morphology was broad shallow pitting. A representative
example of the corrosion morphology is shown in
figure 35. The pits were elongated and aligned with grainboundaries in the skin and along material flow lines inthe base. The sections do not exhibit the delaminations
usually associated with exfoliation (ref. 12); however,there was considerable material dissolution which would
be expected in pitting. The extent of corrosion was simi-lar for the extrusion sections exposed by the dry bottom
MASTMAASIS procedure with the stiffeners facing upor down.
Table 7. Summary of Exfoliation Results for 2090 Products
Product form Condition
Near net shape extrusion 50.8-mm x 101.6-mm skin panel T86
Near net shape extrusion 50.8-mm x 152.4-mm extrusion T86section with two stiffeners
10-mm-thick extruded bar (ref. 14) T86
T-stiffened extrusion (ref. 1!) T86
12.7-mm-thick plate (ref. 14) T81
aRatings per ASTM G34-90:
N no appreciable attack
P pitting
EA superficial exfoliation
EB moderate exfoliation
EC severe exfoliation
ED very severe exfoliation
EXCO(4 day)
Dry bottomMASTMAASIS
(4 week)
EBa pa
P
ED P
ED P
ED P
33

Figure34.Generalappearanceof2090-T86exfoliationspecimensafterEXCOanddrybottomMASTMAASISexposures.
50 _tm 100 ktm
(a) Parallel to skin surface. (b) Along flow lines in fillet associated with extrusion process.
Figure 35. The 2090-T86 MASTMAASIS exfoliation specimens illustrating pitting attack with undercutting.
4.5.2. Stress corrosion.
Direct-tension tests: The direct-tension tests of the
2090 near net extrusion resulted in no failures (specimen
fracture) after 40 days exposure with stress as high as
80 percent of the material yield stress. The results are
34
summarized as pass or fail tests in table 8 for comparisonwith published results for 2090 and 2219 in similar tem-
per or product forms (refs. 11, 44, and 50). The data indi-
cate that the 2090 near net shape extrusion in the T86(peak-aged) condition retained the resistance to stress
corrosion cracking documented for other peak and near

Table8.Summaryof Long Transverse Stress Corrosion Test Results for 2090 and 2219 Products
Alloy/product Condition Orientation Exposure stress, Exposure time, NF/NT aform MPa (% Sy) days
2090 LT 136 (25) 0/3Near net shape T86 Beneath 273 (50) 40 0/3
extrusion stiffener 409 (80) 0/32090
14-mm x 60-mm 140 (25) 0/2extruded bar Near peak aged LT 210 (38) 90 0/2
(ref. 44) 280 (50) 0/2
209012.7-mm-thick plate T81 LT 414 (75) 30 0/5
(ref. 11)2219
12.7-mm-thick plate T87 LT 270 (75) 90 0/3(ref. 50)
aNF/NT,number failed/number tested.
peak-aged 2090 product forms and performed equally
well to peak-aged 2219.
Resistance to stress corrosion can also be determined
with direct-tension specimens by measurements of post
exposure residual strength. Residual strengths, expressed
as breaking stress (failure load/original cross-sectional
area), are plotted in figure 36 for specimens exposed at
several stress levels. The breaking stress was reduced by
about 12 percent for the unstressed specimens exposed
for 40 days, with only an additional 3-percent reduction
for the highest stress exposures. The data indicate that
the reduction in breaking stress was due primarily to gen-
eral corrosion. Bucci et al. (ref. 11) observed similar cor-
rosion performance with a 12.7-mm 2090-T86 plate
(6-percent and 10-percent losses in residual strength for
unstressed and 75 percent Sy, respectively). In compari-son, data from direct-tension tests with 12.7-mm-thick
2219-T87 (peak-aged) plate indicated a 30-percent
reduction in residual strength for LT specimens stressed
to 75 percent Sy and exposed by alternate immersion in a3.5-percent NaC1 solution (ref. 50).
Metallographic sections from direct-tension speci-
mens confirmed pitting attack, with pits undercutting the
specimen surface along grain-subgrain boundaries.While there were no stress corrosion cracks observed in
the stressed specimens, the pits were opened into broad,
deep fissures. All direct-tension specimens failed away
from the center of the reduced section during the break-
ing stress tests, with macroscopic fracture along bound-
aries of pancake-shaped grains aligned with the fillet, as
was shown in figure 5(d). Additional specimens exposed
at 0 percent and 75 percent Sy were used to further exam-ine the corrosion morphology; therefore, the specimenswere not failed in tension. One of these sections, shown
t_L
_g
<
600
500
400
O
No exposure 10% Sy 25% Sy 50% Sy 80% SylI 40 day exposure, alternate immersion I
[ in 3.5-percent NaCI I
Figure 36. Variation in breaking stress with exposure slress for2090-T86 long transverse direct-tension specimens. Bars repre-sent range of data.
in figure 37, illustrates that the pits undercut along flowlines associated with the extrusion process. The pits were
nearly equiaxed at the center of the reduced section and
undercut parallel to the specimen surface. The micro-
structure at this position at the base of the stiffener
exhibited mixed-pancake and fibrous grains, as shown in
figure 5(e), with grain boundaries generally aligned
parallel to the skin surface. To either side of the center of
the reduced section, the pits were deep fissures and
undercut at an angle following grain boundaries. The
35
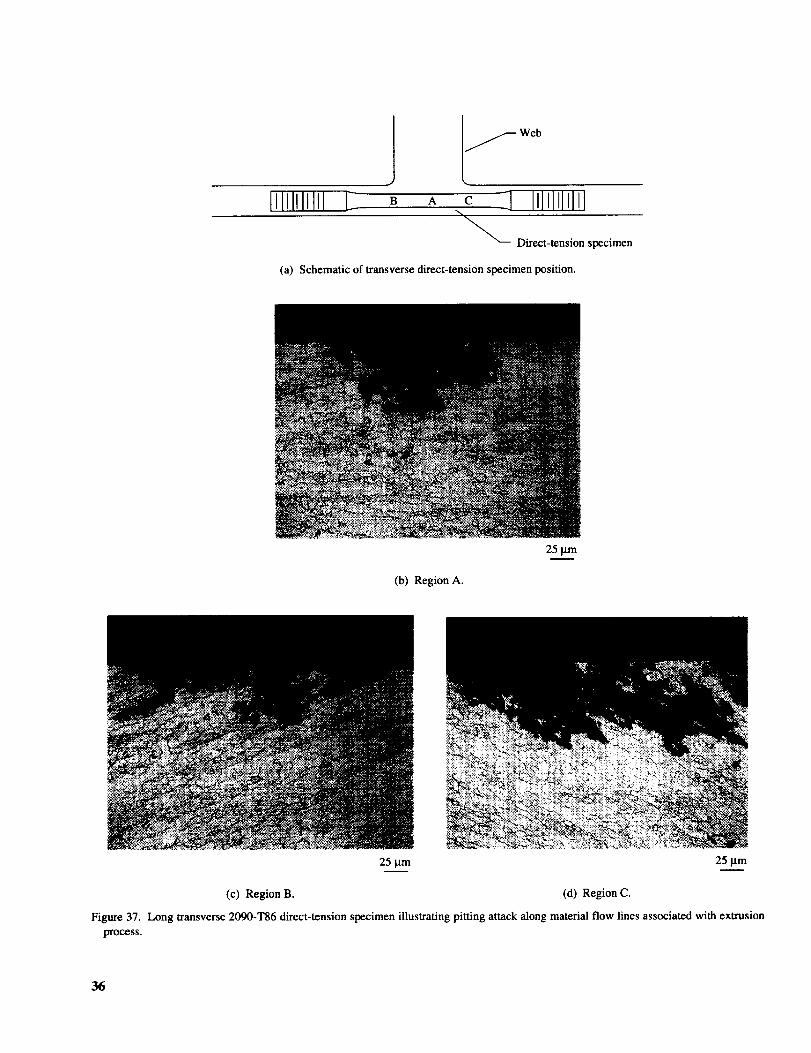
I webIIIIIIIII _- B A c -2 IIIIIIIIII1
Direct-tension specimen
(a) Schematic of transverse direct-tension specimen position.
(b) Region A.
25 0m
Figure 37.
process.
25 0a'n 25 I.tm
(c) Region B. (d) Region C.
Long transverse 2090-T86 direct-tension specimen illustrating pitting attack along material flow lines associated with extrusion
36
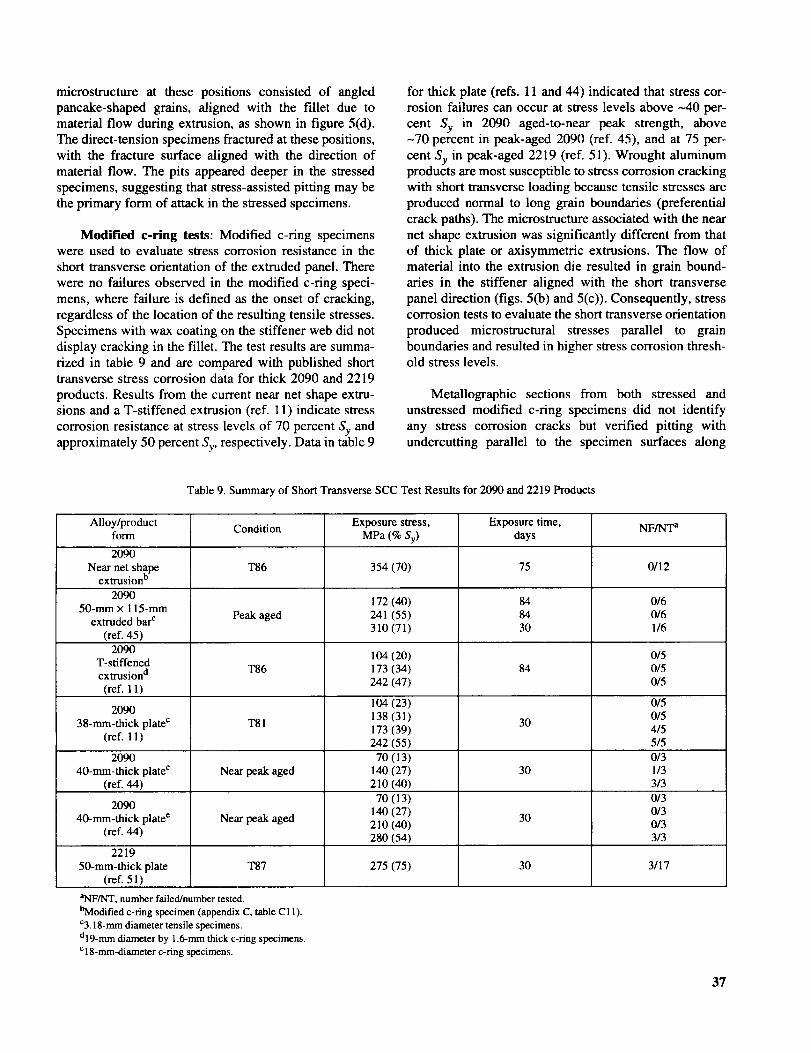
microstructure at these positions consisted of angled
pancake-shaped grains, aligned with the fillet due tomaterial flow during extrusion, as shown in figure 5(d).
The direct-tension specimens fractured at these positions,
with the fracture surface aligned with the direction of
material flow. The pits appeared deeper in the stressed
specimens, suggesting that stress-assisted pitting may be
the primary form of attack in the stressed specimens.
Modil_ed e-ring tests: Modified c-ring specimenswere used to evaluate stress corrosion resistance in the
short transverse orientation of the extruded panel. There
were no failures observed in the modified c-ring speci-
mens, where failure is defined as the onset of cracking,
regardless of the location of the resulting tensile stresses.
Specimens with wax coating on the stiffener web did not
display cracking in the fillet. The test results are summa-
rized in table 9 and are compared with published shorttransverse stress corrosion data for thick 2090 and 2219
products. Results from the current near net shape extru-
sions and a T-stiffened extrusion (ref. 11) indicate stress
corrosion resistance at stress levels of 70 percent Sy and
approximately 50 percent Sy, respectively. Data in table 9
for thick plate (refs. 11 and 44) indicated that stress cor-
rosion failures can occur at stress levels above -40 per-
cent Sy in 2090 aged-to-near peak strength, above-70 percent in peak-aged 2090 (ref. 45), and at 75 per-
cent Sy in peak-aged 2219 (ref. 51). Wrought aluminumproducts are most susceptible to stress corrosion cracking
with short transverse loading because tensile stresses are
produced normal to long grain boundaries (preferential
crack paths). The microstructure associated with the near
net shape extrusion was significantly different from that
of thick plate or axisymmetric extrusions. The flow of
material into the extrusion die resulted in grain bound-
aries in the stiffener aligned with the short transverse
panel direction (figs. 5(b) and 5(c)). Consequently, stresscorrosion tests to evaluate the short transverse orientation
produced microstructural stresses parallel to grain
boundaries and resulted in higher stress corrosion thresh-old stress levels.
Metaliographic sections from both stressed and
unstressed modified c-ring specimens did not identify
any stress corrosion cracks but verified pitting with
undercutting parallel to the specimen surfaces along
Table 9. Summary of Short Transverse SCC Test Results for 2090 and 2219 Products
Alloy/product Condition Exposure stress, Exposure time, NF/NT aform MPa (% Sy) days
2090Near net shape T86 354 (70) 75 0/12
extrusion b
2090 172 (40) 84 0/650-mm x 115-mm
extruded bar c Peak aged 241 (55) 84 0/6
(ref. 45) 310 (71) 30 1/6
2090 104 (20) 0/5T-stiffenedextrusiond T86 173 (34) 84 0/5(ref. 11) 242 (47) 0/5
104 (23) 0/52090 138 (31) 30 0/5
38-mm-thick plate c T81 173 (39) 4/5(ref. 1 l) 242 (55) 5/5
2090 70 (13) 0/340-mm-thick plate c Near peak aged 140 (27) 30 1/3
(ref. 44) 210 (40) 3/370 (13) 0/3
2090 140 (27) 0/340-mm-thick plate e Near peak aged 210 (40) 30 0/3
(ref. 44) 280 (54) 3/3
221950-mm-thick plate T87 275 (75) 30 3/17
(ref. 51)
aNF/NT, number failed/number tested.
I_Modified c-ring specimen (appendix C, table C 11).
c3.18-mm diameter tensile specimens.
dl9-mm diameter by 1.6-mm thick c-ring specimens.
el8-mm-diameter c-ring specimens.
37

(a)RegionAwebloadedintension.
100_tm
• " i.? "_;' _'..
100 lam
(b) Region B web loaded in compression.
200 _tm
Resulting tensilestresses
| ii
(c) Region C fillet loaded in tension. (d) Tensile stress at outer web/radius.
Figure 38. Pitting attack on 2090-T86 modified c-ring.
grain-subgrain boundaries associated with material flow,
as shown in figure 38. The pits on tensile surfaces were
deeper, with less undercutting, but still did not develop
prominent crack fronts. The unstressed specimens con-
firmed that residual stresses were not present in magni-
tudes that would support stress corrosion cracking.
The current test results from direct-tension and mod-
ified c-ring specimens for panel 6 (T86) indicate stress
corrosion resistance which would support an A rating
according to ASTM G64-91 and should be sufficient for
inclusion in table 1 according to MSFC-SPEC-522B.
Additional testing is required to certify a material rating;however, based on the current corrosion data, the 2090
near net shape extrusion appears to be a viable substitu-
tion for 2219 for cryotank application.
38
5. Concluding Remarks
The results from this study discuss work which has
been completed as part of an ongoing program. As such,
this document is primarily a data report with analyses
and conclusions based upon all data available at the time
of writing. The near net shape extrusions were produced
in the Commonwealth of Independent States (CIS) on a
best effort basis by using available unmodified produc-
tion equipment. Therefore, although the present evalua-tion in the United States shows that the extrusions do not
meet current United States manufacturing tolerances
for extruded aluminum shapes, other AI-Li alloys and
modified production techniques currently under develop-
ment in the CIS and in the United States will hopefully
produce better quality near net shape products.

The2090microstructurewascomplexasaresultofthenearnetshapeextrusionprocess.Thematerial exhib-
ited microstructural directionality parallel to the extru-
sion axis throughout the cross section. The grain
structure was predominantly unrecrystallized; grains
were fibrous in the cap and pancake-shaped in the skin,with a mixture of both in the web and in the base.
The results of the texture analysis were consistent
with an unrecrystallized material containing isolated
areas of recrystallized grains. The cap and the web had
predominantly fiber textures which were <111> and<112>, respectively. The skin had a Brass texture while
the base had a mixture of the < 111 > fiber and the Copper
rolling textures.
The preferred orientation and grain flow patterns
exhibited by the microstructure influenced the tensile
properties and the fracture behavior. The tensile proper-
ties were comparable with typical values reported for
other 2090 product forms. The variation in the 45 ° off-
axis properties was a result of the unrecrystallized natureof the microstructure.
The cap and the base had the highest strength, prima-
rily as a result of the fibrous grain structure and <111>fiber texture. The lowest strengths were measured in the
45 ° direction in the skin, which is typical of anisotropic,
unrecrystallized material. There was a small reduction in
yield strength from the front to the back of the extrusion;
however, elongation to failure did not vary systemati-
cally with panel length. Trends in the tensile behavior
with respect to temperature were not discernible due toinconsistencies in the data.
The main thrust of the fracture tests was to determine
the effect of temperature on toughness. Toughness data
were obtained from specimens in the longitudinal and
long transverse orientations. Fracture toughness tests at
Langley Research Center (LaRC) using M(T) specimens
exhibited a decrease in toughness with decreasing tem-
perature in the T-L orientation. Residual strength tests on
surface crack specimens performed by Boeing Aerospace
exhibited decreasing toughness with decreasing tempera-
ture in the T-S orientation and increasing toughness with
decreasing temperature in the L-S orientation. Data gen-
erated by NIST indicated that toughness was dependent
on the surface crack geometry and test temperature.
The extrusion proved readily weldable by the
VPPAW process. Mechanical properties of the extrusion
weldments compared favorably to those of welded 2090
sheet and plate. There was a trend of lower tensile
strength and toughness in the weldment compared to theskin material.
Corrosion resistance of the extrusion was compara-
ble to other peak-aged 2090 product forms, indicating
that the extrusion process did not affect the corrosionresistance. There were no exfoliation or stress corrosion
failures in the tests performed. The only form of corro-
sion observed was pitting as a result of preferential attack
along grain boundaries, which delineated material flow
associated with the extrusion process. There were nostress corrosion cracks observed in stressed or unstressed
specimens, suggesting that the microstructure does not
contain preferential paths for sustained stress corrosion
cracking and that residual stresses could not support
stress corrosion cracking. Corrosion resistance was com-
parable to peak-aged 2219 plate.
Based on the available data from the fracture tests, it
is unlikely that the 2090 near net shape extrusions could
be considered a viable replacement for 2219-T87 in the
current external tank (ET) structure where damage toler-
ance at cryogenic temperatures is required, such as in the
liquid hydrogen or liquid oxygen tanks. Near net shape
extrusions of 2090 could be considered as a replacement
in the intertank structure, where failure due to buckling is
more important and stiffness is the desirable property.
NASA Langley Research CenterHampton, VA 23681-2199December 11, 1997
6. References
1. Kaminski, T.; Willner, E.; Kerr, J.; and Taketani, H.:Aluminum-Lithium in Space Applications. Aluminum-Lithium, M. Peters and P.-J. Winkler, eds., DGM, 1991,
pp. 1311-1314.
2. Swanson, G. M.; Loechel, L. W.; Hartley, P. J.; and Bolstad,D.A.: Net Shape Processes and Properties of Weldalite TM
Components. Aluminum-Lithium, M. Peters and P.-J. Winkler,eds., DGM, 1991, pp. 981-986.
3. SAE Aerospace Material Specification MAM2205A: Toler-ances, Metric Aluminum Alloy and Magnesium Alloy Extru-sions. SAE International, Oct. 1983. URL: http://www.sae.org,Accessed December 3, 1997.
4. Standard Methods of Tension Testing Wrought and CastAluminum- and Magnesium-Alloy Products. ASTM Designa-tion: B 557-84, Volume 03.01 of the 1989 Annual Book ofASTM Standards, 1989, pp. 50--60.
5. Standard Test Methods of Tension Testing of Metallic Materi-als. ASTM Designation: E 8-89, Volume 03.01 of the 1989Annual Book of ASTM Standards, 1989, pp. 131-146.
6. Standard Practice for Fracture Testing With Surface-CrackTension Specimens. ASTM Designation: E 740-88, Vol-ume 03.01 of the 1989 Annual Book of ASTM Standards,1989, pp. 674-681.
39

7. Standard Practice for R-Curve Determination. ASTM Desig-
nation: E 561-86, Volume 03.01 of the 1989 Annual Book of
ASTM Standards, 1989, pp. 570-581.
8. Anon.: Welding, Aluminum Alloys. MSFC-SPEC-51MC, Nov.
1990, pp. 1-39.
9. Martukanitz, R. E; Natalie, C. A.; and Knoefel, J. O.: The
Weldability of an AI-Li-Cu Alloy. J. Metals, vol. 39, no. 1l,
Nov. 1987, pp. 38-42.
10. Lippold, John C.: Weld Solidification Cracking in Commercial
AI-Li Alloys. Advances in Joining Newer Structural Materi-
als, Pergamon Press, 1990, pp. 263-270.
11. Bucci, R. J.; Malcolm, R. C.; Colvin, E. L.; Murtha, S. S.; and
James, R. S.: Cooperative Test Program for the Evaluation of
Engineering Properties of Aluminum-Lithium Alloy 2090-T8X
Sheet, Plate, and Extrusion Products. Alcoa Rept. No. NSWC-
TR-89-106, Sept. 1989. (Available from DTIC as
AD-BI41340L.)
12. Standard Test Method for Exfoliation Corrosion Susceptibility
in 2XXX and 7XXX Series Aluminum Alloys (EXCO Test).
ASTM Designation: G 34-90, Volume 03.02 of the 1992
Annual Book of ASTM Standards, 1992, pp. 127-132.
13. Standard Practice for Modified Salt Spray (Fog) Testing.
ASTM Designation: G 85-85, Volume 03.02 of the 1992
Annual Book of ASTM Standards, 1992, pp. 357-361.
14. Coivin, E. L.; and Murtha, S. J.: Exfoliation Erosion Testing of
AI-Li Alloys 2090 and 2091. Proceedings of the 5th Interna-
tional Aluminum-Lithium Conference--Aluminum-Lithium
Alloys, 1989, pp. 1251-1260.
15. Standard Practice for Preparation and Use of Direct Tension
Stress-Corrosion Test Specimens. ASTM Designation:
G 49-85, Volume 03.02 of the 1992 Annual Book of ASTM
Standards, 1992, pp. 189-193.
16. Standard Practice for Evaluating Stress Corrosion Cracking
Resistance of Metals and Alloys by Alternate Immersion in
3.5% Sodium Chloride Solution. ASTM Designation:
G 44-88, Volume 03.02 of the 1992 Annual Book of ASTM
Standards, 1992, pp. 170-173.
17. Reynolds, M. A.; and Creed, E.: The Development of 8090
and 8091 Alloy Extrusions. J. de Phys., Suppl., vol. 48, Sept.
1987, pp. C3-195-C3-207.
18. Parson, N. C.; and Sheppard, T.: Extrusion Processing of
AI-Mg-Li Alloys. Proceedings of the Third International
Aluminum-Lithium Conference Aluminum-Lithium Alloys III,
C. Baker, E J. Gregson, S. J. Harris, and C. J. Peel, eds.,
London, Inst. of Metals, 1986, pp. 222-232.
19. Tempus, G.; Scharf, G.; and Calles, W.: Influence of Extrusion
Process Parameters on the Mechanical Properties of
A1-Li-Extrusions. J. de Phys., Suppl., vol. 48, Sept. 1987,
pp. C3-187-C3-193.
20. Dinsdale, K.; Hams, S. J.; and Noble, B.: Relationship
Between Microstructure and Mechanical Properties of
Aluminum-Lithium-Magnesium Alloys. Aluminum-Lithium
Alloys, Metall. Soc. of AIME, 1981, pp. 101-118.
40
21. Palmer, I. G.; Lewis, R. E.; and Crooks, D. D.: The Design and
Mechanical Properties of Rapidly Solidified AI-Li-X Alloys.
Aluminum-Lithium Alloys, Metall. Soc. of AIME, 1981,
pp. 241-262.
22. Lin, E S.; Chakrabortty, S. B.; and Starke, E. A., Jr.:
Microstructure-Property Relationships of Two AI-3Li-
2Cu-0.2Zr-XCd Alloys. Meteorol. Trans., voi. 13A, 1982,
pp. 401-410.
23. Kar, R. J.; Bohlen, J. W.; and Chanani, G. R.: Correlation of
Microstructures, Aging Treatments, and Properties of AI-Li-
Cu-Mg-Zr I/M and P/M Alloys. Proceedings of the Second
International Aluminum-Lithium Conference---Aluminum-
Lithium Alloys II, Metall. Soc. of AIME, 1984, pp. 255-285.
24. Dillamore, I. L.; and Roberts, W. T.: Preferred Orientation in
Wrought and Annealed Metals. Metall. Rev., vol. 10, no. 39,
1965, pp. 271-380.
25. Gregson, P. J.; and Flower, H. M.: Microstructural Control of
Toughness in Aluminum-Lithium Alloys. Acta Metall.,
vol. 33, Mar. 1985, pp. 527-537.
26. Reynolds, M. A.; Gray, A.; Creed, E.; Jordan, R. M.; and
Titchener, A. E: Processing and Properties of Alcan Medium
and High Strength A1-Li-Cu-Mg Alloys in Various Product
Forms. Proceedings of the Third International Aluminum-
Lithium Conference--Aluminum-Lithium Alloys I11, London,
Inst. Metals, 1986, pp. 57-65.
27. Grimes, R.; Reynolds, M. A.; Titchener, A. E; Greaves, M. S.;
Strassheim, I.; and Warrington, D.: The Commercial Manufac-
ture of 8090 Plate, Sheet and Extrusions. Aluminum-Lithium,
M. Peters and E-J. Winkler, eds., DGM, 1991, pp. 3-14.
28. Cassada, W. A.; Shiflet, G. J.; and Starke, E. A., Jr.: The Effect
of Plastic Deformation on TI Precipitation. J. de Phys., Suppl.,
vol. 48, Sept. 1987, pp. C3-397-C3-406.
29. Rioja, R. J.; Bretz, E E.; Sawtell, R. R.; Hunt, W. H.; and
Ludwiczak, E. A.: Precipitation Reactions, Strength and
Toughness of AI-Li-Cu Alloys. Proceedings of the Interna-
tional Conference--Aluminum Alloys: Their Physical and
Mechanical Properties, Eng. Mater. Advis. Serv., Ltd., 1986,
pp. 1781-1797.
30. Reed, R. E; Purtschere, E T.; Simon, N. J.; McCloskey, J. D.;
and Walsh, R. E: Aluminum Alloys for ALS Cryogenic Tanks:
Comparative Measurements of Cryogenic Mechanical Proper-
ties of AI-Li Alloys and Alloy 2219. NISTIR-3979, Feb. 1993.
31. Engstrom, W. L.: Determination of Design Allowable
Properties--Fracture of 2219-T87 Aluminum Alloy. NASA
CR-115388, 1972.
32. Buscemi, Charles D.; and Chin, Ernest S. C.: Characterization
of X2090 AI-Li-AIloy. Proceedings of the Twentieth Annual
Technical Meeting of the International Metallographic
Society, H. J. Cialoni, G. W. E. Johnson, M. E. Blum, and
G.V. Vander Voort, eds., Intern. Metall. Soc./ASM Intern.,
1988, pp. 221-230.
33. Venkateswara Rao, K. T.; and Ritchie, R. O.: Fracture-
Toughness Behavior of 2090-T83 Aluminum-Lithium Alloy

Sheetat AmbientandCryogenicTemperatures.Scripta
Metall., vol. 23, July 1989, pp. 1129-1134.
34. ALCOA Alloy 2090. Alloy Digest, Sept. 1989.
35. Morris, J. W., Jr.; Glazer, J.; Verzasconi, S. L.; and Sawtell, R.:
Mechanical Behavior of Aluminum-Lithium Alloys at Cryo-
genic Temperatures. Metall. Trans. A-Phys. MetaU. Mater
Sci., vol. 18A, Oct. 1987, pp. 1695-1701.
36. Glazer, J.; Verzasconi, S. L.; Dalder, E. N. C.; Yu, W.; Emigh,
R. A.; Ritchie, R. O.; and Morris, J. W., Jr.: Cryogenic
Mechanical Properties of AI-Cu-Li-Zr Alloy 2090. Advances
in Cryogenic Engineering Materials, R. P. Reed and A. F.
Clark, eds., Plenum Press, 1986, pp. 397-404.
37. Libbey, B. W.; and Finger, R. W.: Evaluation of Extruded 2090
AI-Li Wide Stiffened Panels (ADP 3105R) Test Data.
AD-B69014L. Boeing Co., Sept. 1992.
38. Tack, W. T.; and Loechel, L. W.: Use of Applied Fracture
Mechanics Principles to Evaluate the Cryogenic Fracture
Toughness of Alloy 2090. Aluminum-Lithium, M. Peters and
P.-J. Winkler, eds., DGM, 1991, pp. 415-420.
39. Lee, E. W.; and Frazier, W. E.: The Effect of Stretch on the
Microstructure and Mechanical Properties of 2090 A1-Li.
Scripta Metall., vol. 22, Jan. 1988, pp. 53-57.
40. Dorward, R. C.: Cryogenic Toughness of A1-Cu-Li Alloy AA
2090. Scripta MetaU., vol. 20, Oct. 1986, 1379-1383.
41. Venkateswara Rao, K. T.; and Ritchie, R. O.: Mechanisms
Influencing the Cryogenic Fracture-Toughness Behavior of
Aluminum-Lithium Alloys. Acta Metall. Mater., vol. 38, Nov.
1990, pp. 2309-2326.
42. Gayle, Frank W.; Tack, William Troy; Heubaum, Frank H.;
and Pickens, Joseph R.: High Toughness, High Strength
Aluminum Alloy Design and Practice. Aluminum-Lithium,
M. Peters and E-J. Winkler, eds., DGM, 1991, pp. 203-208.
43. Kearns, W. H., ed.: Welding Handbook--Metals and Their
Weldability. American Welding Soc., 1982, p. 318.
44. Dorward, R. C.; and Hasse, K. R.: Stress Corrosion Character-
istics of A1CuLi AA 2090 Alloy. Corrosion, vol. 44, no. 12,
Dec. 1988, pp. 933-941.
45. Colvin, E. L.; Murtha, S. J.; and Syss, R. K.: Stress Corrosion
Cracking Susceptibility of Alloy 2090. Proceedings of the
International Conference Aluminum Alloys: Their Physical
and Mechanical Properties, 1986, pp. 1853-1867.
46. Vasud6van, A. K.; Ziman, E R.; Jha, S. C.; and Sanders,
T. H., Jr.: Stress Corrosion Resistance of AI-Cu-Li-Zr Alloys.
Aluminum-Lithium Alloys I11, C. Baker, E J. Gregson, S. J.
Harris, and C. J. Peel, eds., London, Inst. Metals, 1986,
pp. 303-309.
47. Meletis, E. I.: Stress Corrosion Cracking Properties of 2090
AI-Li Alloy. Corrosion Cracking, V. S. Goel, ed., ASM Int.,
1986, pp. 315-326.
48. Standard Classification of Resistance to Stress-Corrosion
Cracking of Heat-Treatable Aluminum Alloys. ASTM Desig-
nation: G 64-91, Volume 03.02 of the 1992 Annual Book of
ASTM Standards, 1992, 236-238.
49. Design Criteria for Controlling Stress Corrosion Cracking.
MSFC-SPEC-522B, Nov. 1977.
50. Humphries, T. S.: Stress Corrosion of Aluminum Alloy 2219
Plate and Forging. NASA TM-79479, 1964.
51. Humphries, T. S.; and Nelson, E. E.: Seacoast Stress Corro-
sion Cracking of Aluminum Alloys. NASA TM-82393, 1981.
41

Appendix A
Test Specimen Layout
Figures A1 through A5 present the location and orientation of specimens machined from panels 2, 6, 11, 4, and 7.For panels 2, 6, and 11, multiple specimens were machined at each tensile location at positions in the stiffener and in theskin as shown in the detail view in figures A1 through A3.
42

r_
rj
0
o
c_
0
E
0
E
v
,_ i_i_!'!i_:i_"" _'_,,°, _ o,
1
o_ o_r_ _ _
_ _ _ E _o
E
<
43

i j i!iiiiiiiIi
°6
..1 ..1.-.
'!
H !
II"II
II
I1=
I-L)
0
tiei _ O0 0I
////////x/ i I / i i,
V////////,', \
V/}//////}_ ">,
L\\\\\\\\ _ •
t,,,\ .",.\\\\\\\\
\_mo_aj (,L),_I N
I///////z _m:_.I (,I.)Sd/
"///////: / / / / / / /z oJn_.tj(,L)SdI
t
1|_ : _ : ::_ : _:: : : _ i::fi ii iiii
K\\NNNNN\\\bxN\ _am:m_ (J.)Sd \\
b,.\ .x,,\\\\\\'x,\L\\\'x'x\\\\ \"iNN 0_; CL)Sak\\\\\\\\" ,'V,
o_ _ _ °,'_ i '7 "_
e-
,d
O
O
_o
_D
_L
44

o_
0
f_
g_
o__bc_
45

2
<
e_
0
L_
r,q
<
46

C_
O
47

Appendix B
Test Specimens
Figures B1 through B13 show specimen configurations used for tensile, fracture, and corrosion tests. Figure B14shows schematically the loading methods used for the c-ring stress corrosion tests.
Figure B 1. LaRC and Alcoa subsize tensile specimen (full-panel thickness). Dimensions are in mm.
44.45 TYP--_
A _ R = 12.7 TYP19.05 TYP
--_ 171.45
1_ 12.7 DIA TYI
Figure B2. MSFC tensile specimen (full-panel thickness). Dimensions are in mm.
203
# 1_ 57.15------_ . TYP
Figure B3. Boeing Aerospace base metal tensile specimen. Dimensions are in mm.
NI1
48

139.7
1__ 89 ----_
203
457.2
F Surface crackj
R = 38.1 TYP
101.6
r
Figure B4. NIST large PS(T) specimen (full-panel thickness). Dimensions are in mm.
m
eBB
%
A
101.6
_2
,,*-- R = 38.1 TYP
Surface crack
/-j63.5
127
381
Figure B5. NIST small PS(T) specimen (full-panel thickness). Dimensions are in mm.
I
I i i
!
tie
49

O
O
O
O
o f
L = 305
I_d
/"--R = 19TYP _'_
i "_'J } *:J\\
Surface crack I
A-A
I _--" Grip holes
I/] 0/
O
O
O
A
W= 102
B = 3.2 mm
--V2c
A_L B.EDM starter notch J _?= 0.67B
a/c = 0.50
Figure B6. Boeing Aerospace PS(T) specimen. Dimensions are in mm.
Through crack----_ Grip holes --_
o0 0 0 0
0 0
0 0 0 0
o _ o
A
160
V
I__ 480 _I -'q"_-Figure B7. LaRC M(T) specimen (full-panel thickness). Dimensions are in mm.
50

203
12.7 _"'F 9.50DIATYP
6_lb _ 2-5
.___9.1
®
®25.4
6.35 DIA TYP
m m
m m
m mm
m m
m m
m m
m m
m m
m
mml
m
m
4.32
.ll_m 3.30 weld vicinity
(approximate)
Figure B8. Boeing Aerospace weldment tensile specimen. Dimensions are in mm.
51
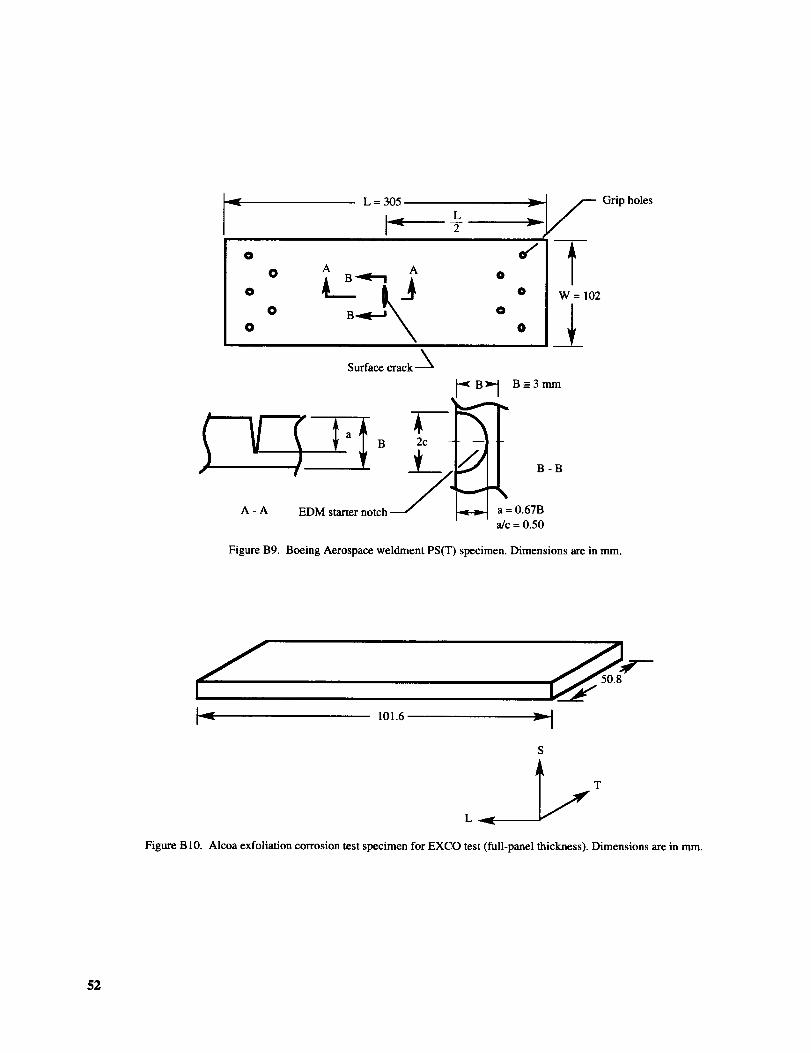
O
L = 305
_'_ 2
0 A A @
o O B O
O
O
O
W= 102
Surface crack -_
._ B_._ B=3mm
B-B
- A EDM starter notch _ = 0.67Ba/c = 0.50
Grip holes
Figure B9. Boeing Aerospace weldment PS(T) specimen. Dimensions are in mm.
I _ 101.6
L
S
Figure B 10. Alcoa exfoliation corrosion test specimen for EXCO test (full-panel thickness). Dimensions are in ram.
52

I A 152.44
(a) Extrusion section with two stiffeners.
J/'I]_._ 127 _ [
L
S
T
(b) Skin specimen.
Figure B 11. Alcoa exfoliation corrosion test specimens for dry bottom MASTMAASIS test (full-panel thickness). Dimensions are in mm.
53

3.81 DIA
ItltJIJilil R = 3.175 TYP i
IIIIIIIIIII!-
19.05
50.8
3.175 DIA
llltltlllllv
(a) Direct-tension specimen. Dimensions are in mm.
/-_ Web
_ Direct-tension specimen
(b) Schematic of direct-tension specimen position.
Figure B 12. LaRC direct-tension stress corrosion specimen.
54

J
I_..I-""
i
Figure B
cr
--_ 699_--
.' :1
| II
50.8
Ir
6.35 DIA
TYP
cr
25.4
| |
|
| |
| |
| |
12.7-._ 25.4
13. LaRC modified c-ring stress corrosion specimen. Dimensions are in mm.
r
55

Resulting tensilestresses
(a) Tensile stresses at outer web/fillet.
0 i| 0
Resulting tensilestresses
(b) Tensile stresses at inner web/fillet.
Figure B 14. Loading methods and resulting tensile stresses for modified c-ring specimen.
56

Appendix C
Test Results
Tables C 1 through C 17 present results for individual test specimens from tensile, fracture, and corrosion testing.Table C 10 includes average tensile test results for panel 11 and reference literature results for 2219 and 2090 products.
Table CI. Alcoa Tensile Data at 25°C, Panels 1 and 10
Specimen
l-L1l-L2l-L3
l-L4l-L5
1-LT61-LT7
10-L110-L210-L310-L410-L5
10-LT610-LT7
Nominal
stretch,
percent
Orientation
LLLLL
LTLT
LLLLL
LTLT
Location
SkinBaseWeb
Web-capCap
BaseSkin
SkinBaseWeb
Web-capCap
BaseSkin
Gauge
length,mm
25.425.425.425.425.425.425.4
25.425.425.425.425.425.4
25.4
Thickness,
mm
4.1974.1644.1974.1904.1854.1884.211
4.2014.2044.1784.1914.1964.1804.183
Width,
mm
6.3886.3376.4146.3636.3636.337
6.325
6.3636.350
6.3506.3506.3506.3636.350
Breakingload,kN
14.97216.177
15.63515.81315.77715.17214.665
15.16816.83615.56815.72415.39515.55914.843
Sy, MPa
494.0599.0538.0555.0541.0510.0473.0
509.0620.0546.0548.0525.0536.0497.0
S u, MPa
558.0613.0580.0593.0592.0572.0551.0
567.0631.0587.0591.0578.0585.0558.0
El,
percent
6.06.06.07.0
a5.09.04.0
8.07.08.0
a8.0
8.09.04.0
aBroke outside gauge mark.
Specimen
4TY-A1
4TY-B 14TY -C 14TX-A 14TX-B 14TX -C 1
7TY-A 17TY-B 17TY-C17TX-A 17TX-B 17TX-C 1
Table C2. Boeing Aerospace Tensile Data at 25°C, Panels 4 and 7
Nominal
stretch,
percent
Orientation
LLL
LTLTLT
LLL
LTLT
LT
Location
SkinSkinSkinSkinSkinSkin
SkinSkinSkinSkinSkin
Skin
Gauge
length,mm
50.850.850.850.850.8
50.8
50.850.850.850.850.850.8
Thickness,
mm
3.1883.2133.2003.1623.2003.162
3.1883.1623.2003.1753.2003.188
Width,
mm
12.75112.75112.76412.73812.71312.738
12.71312.73812.75112.70012.73812.751
Breakingload,
kN
20.90620.01620.59421.57221.35022.240
23.10722.72923.04121.77322.19622.062
Sy, MPa
452.0429.0452.0486.0439.0468.0
510.0521.0516.0
451.0492.0
492.0
Su, MPa
514.0489.0504.0536.0525.0552.0
570.0565.0587.0540.0545.0543.0
El,
percent
4.54.03.56.57.08.5
9.06.59.59.59.08.0
Specimen
4TX-A24TX-B24TX-C2
Table C3. Boeing Aerospace Tensile Data at -196°C, Panel 4
Nominal
stretch,
percent
IOrientation
LTLTLT
Location
SkinSkinSkin
Gauge
length,mm
50.850.850.8
Thickness,
mm
3.1753.2003.213
Width,
mm
12.73812.73812.751
Breakingload,kN
23.84123.26324.064
Sy, MPa
442.0427.0461.1
S u, MPa
589.0571.0587.0
El,
percent
14.513.0
9.5
57

Table C4. LaRC Tensile Data at 25°C, Panels 11, 6, 4, and 2
Specimen
(a)
1l-T11l-T11l-T21l-T211-T311-T3
6-T46-T4
Nominal
stretch,
percent
Orientation
LLLLLL
LL
Location
Skin
SkinSkinSkinSkinSkin
Skin
Skin
Gauge
length,mm
25.425.425.425.425.425.4
25.4
25.4
Thickness
mm
4.224.223.593.593.633.62
4.184.29
Width,mm
6.346.326.326.336.326.35
6.356.32
Breakingload,
kN
15.2815.2712.8812.8312.5412.39
15.0415.27
Sy, MPa
532.0
(b)515.0509.0490.0496.0
513.0520.0
S u, MPa
571.0572.0567.0564.0547.0551.0
567.0562.0
El,
percent
7.4
(b)4.95.63.83.7
5.27.1
4-TY 6 L Skin 25.4 4.63 6.27 15.19 457.0 523.0 3.54-TY 6 L Skin 25.4 4.46 6.25 14.33 446.0 514.0 4.4
2-T5 3 L Skin 25.4 3.20 6.39 11.51 501.0 563.0 5.02-T5 3 L Skin 25.4 3.19 6.43 11.57 506.0 564.0 4.0
1 l-T2 6 LT Skin 25.4 3.65 6.33 13.52 546.0 584.0 6.711 -T2 6 LT Skin 25.4 3.66 6.33 13.56 548.0 585.0 7.51 I-T3 6 LT Skin 25.4 3.60 6.35 13.03 506.0 569.0 7.011-T3 6 LT Skin 25.4 3.59 6.32 13.04 511.0 575.0 7.4
6-T4 6 LT Skin 25.4 3.55 6.29 12.66 524.0 568.0 7.26-T4 6 LT Skin 25.4 3.72 6.33 13.24 512.0 562.0 8.8
6.246.27
428.0392.0
SkinSkin
4.244.63
25.425.4
522.0478.0
LTLT
13.81
13.86
4-TX4-TX
5.35.0
2-T5 3 LT Skin 25.4 3.33 6.32 12.12 524.0 575.0 6.62-T5 3 LT Skin 25.4 3.34 6.41 12.30 521.0 574.0 5.2
2-T5 3 45 ° Skin 25.4 3.53 6.37 11.62 448.0 516.0 6.02-T5 3 45 ° Skin 25.4 3.52 6.48 11.57 440.0 507.0 7.5
11 -T2 6 L Cap 25.4 5.48 6.32 21.61 596.0 627.0 5.91 l-T2 6 L Cap 25.4 4.44 6.24 17.46 611.0 629.0 7.611 -T3 6 L Cap 25.4 5.45 6.36 21.65 595.0 624.0 6.111 -T3 6 L Cap 25.4 4.30 6.39 17.18 599.0 624.0 5.2
6-T4 6 L Cap 25.4 4.62 6.26 18.08 598.0 625.0 7.46-T4 6 L Cap 25.4 4.64 6.32 18.35 594.0 626.0 6.0
2-T5 3 L Cap 25.4 5.55 6.32 21.58 583.0 615.0 6.92-T5 3 L Cap 25.4 5.49 6.35 21.46 582.0 615.0 7.4
ll-T2 6 L Web 25.4 5.39 6.31 19.62 531.0 577.0 7.01l-T2 6 L Web 25.4 5.39 6.38 19.70 522.0 572.0 5.01I-T3 6 L Web 25.4 4.64 6.36 17.17 532.0 581.0 5.11l-T3 6 L Web 25.4 5.46 6.34 20.02 520.0 578.0 5.7
6-T4 6 L Web 25.4 5.61 6.31 20.13 519.0 569.0 5.96-T4 6 L Web 25.4 5.62 6.30 20.08 517.0 568.0 4.9
6-T4 6 L Base 25.4 4.27 6.29 16.64 598.0 620.0 3.36-T4 6 L Base 25.4 4.47 6.30 17.55 613.0 624.0 3.8
2-T5 3 L Base 25.4 3.57 6.31 13.72 592.0 609.0 4.92-T5 3 L Base 25.4 3.55 6.32 13.60 590.0 606.0 2.8
BaseBaseBaseBaseBaseBase
11 -TI
1 I-TI1 I-T21 I-T21 I-T311 -T3
14.9114.9212.0212.0612.4211.27
25.425.425.425.425.425.4
564.0562.0562.0559.0544.0538.0
6.326.326.336.346.346.33
4.194.193.383.403.603.31
LTLTLTLTLTLT
533.0523.0514.0
508.0469.0467.0
1.02.43.74.63.44.0
6-T4 6 LT Base 25.4 3.99 6.23 14.17 518.0 564.0 3.46-T4 6 LT Base 25.4 3.86 6.32 13.75 516.0 563.0 3.3
2-T5 3 LT Base 25.4 2.93 6.40 10.65 528.0 567.0 2.22-T5 3 LT Base 25.4 2.91 6.39 10.51 527.0 564.0 3.0
aSpecimen location:
T1 front of panel 11T2 middle of panel 11T3 back of panel 11T4 front of panel 6T5 middle of panel 2
TX Boeing Aerospace specimen, panel 4TY Boeing Aerospace specimen, panel 4
bNot available.
58

Table C5. MSFC Tensile Data at 25°C, Panels 11 and 2
Specimen Nominal Gauge Thickness, Width, Breaking El,stretch, Orientation Location length, mm mm load, kN Sy, MPa S u, MPa percent
(a) percent mm (b) (b) (b)
ll-T1 6 L Skin 50.8 NA NA NA 517.0 547.0 2.5ll-T1 6 L Skin 50.8 NA NA NA 513.0 541.0 4.1
1 l-T1 6 LT Skin 50.8 NA NA NA 565.0 585.0 2.01 l-T2 6 LT Skin 50.8 NA NA NA 541.0 577.0 3.21 l-T3 6 LT Skin 50.8 NA NA NA 514.0 563.0 5.0
11-TI 6 LT Base 50.8 NA NA NA 563.0 587.0 0.91 I-T2 6 LT Base 50.8 NA NA NA 528.0 567.0 0.8
1 l-T3 6 LT Base 50.8 NA NA NA 483.0 534.0 1.6
2-T5 3 L Skin 50.8 NA NA NA 515.0 548.0 3.4
2-T5 3 LT Skin 50.8 NA NA NA 543.0 582.0 4.3
2-T5 3 LT Base 50.8 NA NA NA 530.0 572.0 1.3
aSpecimen location:TI frontofpane111T2 middle of panel 11T3 back of panel 11T5 middle of panel 2
bNA indicates not available.
Table C6. MSFC Tensile Data at -196°C, Panels 11 and 2
Specimen
(a)
1l-T111-T211 -T211 -T31l-T3
1l-T11l-T11l-T2ll-T211-T31l-T3
11-TI11-TI11 -T21I-T211 -T31l-T3
Nominal
stretch,
percent
6
66
66
6
Orientation
LTLTLTLTLTLT
LTLTLTLTLTLT
Location
SkinSkinSkinSkinSkin
SkinSkinSkinSkinSkinSkin
BaseBaseBaseBaseBaseBase
Gauge
length,mm
50.850.850.850.850.8
50.850.850.850.850.850.8
50.850.850.850.850.850.8
Thickness,
mm
(b)NANANANANA
NANANANANANA
NANANANANANA
Width,
mm
(b)NANANANANA
NANANANANANA
NANA
NANANANA
2-T5 3 L Skin 50.8 NA NA2-T5 3 L Skin 50.8 NA NA
SkinSkin
Base
Base
2-T52-T5
2 -T52-T5
NANA
NANA
LTLT
LTLT
50.850.8
50.850.8
NANA
NANA
Breakingload, kN
(b)
NANANANANA
NANANANANANA
NANANANANANA
Sy, MPa
556.0585.0557.0543.0521.0
(c)(c)(c)
610.0571.0554.0
612.0620.0592.0591.0540.0541.0
Su, MPa
604.0663.0614.0668.0656.0
627.0544.0730.0656.0703.0688.0
621.0650.0650.0645.0626.0623.0
El,
percent
2.14.22.69.89.2
(c)(c)(c)1.98.88.2
1.01.3
1.82.8
2.71.6
NA 532.0 607.0 2.9NA 534.0 654.0 8.3
689.0
650.0
627.0621.0
NANA
NANA
605.0604.0
530.0546.0
3.13.3
2.90.5
aSpecimen location:T1 front of panel 11T2 middle of panel I1
T3 back of panel 11T5 middle of panel 2
bNA indicates not available.
CSpecimen broke outside gauge marks.
59

Table C7. MSFC Tensile Data at -253°C, Panels 11 and 2
Specimen(a)
1 I-T11 I-T111-T211-T211 -T31l-T3
1I-TI1I-T21l-T21l-T311-T3
1l-T11 l-T11 I-T211 -T211-T3
Nominal
stretch,
percent
Orientation
LL
LLLL
LTLT
LTLTLT
LTLTLTLTLT
Location
SkinSkinSkinSkinSkinSkin
SkinSkinSkinSkin
Skin
Base
BaseBaseBaseBase
2-T5 3 L Skin
LTLT
2-T52-T5
SkinSkin
Gauge
length,mm
50.850.850.850.850.850.8
50.850.850.850.850.8
50.850.850.850.850.8
50.8
50.850.8
Thickness,
mm
fb)
NANANANANANA
NANANANANA
NANANANANA
NA
NANA
Width,mm
(b)
NANANANANANA
NA
NANANANA
NANA
NANA
NA
NA
NANA
Breaking
load, kN
(b)
NANANANANANA
NANANANANA
NANANANANA
NA
NANA
S r MPa
611.0611.0585.0572.0532.0541.0
659.0614.0614.0563.0558.0
641.0642.0586.0590.0562.0
532.0
Su, MPa
667.0664.0641.0653.0
619.0658.0
670.0
625.0665.0633.0632.0
683.0671.0662.0687.0641.0
659.0
El,
percent
3.2¢2.42.43.83.25.0
0.4
(d)1.42.32.5
0.90.72.32.61.9
6.2
604.0 662.0 1. !
616.0 663.0 (d)
2-T5 3 LT Base 50.8 NA NA NA 523.0 610.0 Cl.72-T5 3 LT Base 50.8 NA NA NA 539.0 625.0 2.6
aSpecimen location:TI front of panel 11T2 middle of panel 11T3 back of panel 11T5 middle of panel 2
bNA indicates not available.
dSpecimen broke at gauge mark.Specimen broke outside gauge marks.
Table C8. Boeing Aerospace Surface Crack (PS(T)) Fracture Tests, Panels 4 and 7
Specimen(a)
4FX-14FX-34FY-14FY-34FX-44FY-24FY-4
7FX-17FY-17FX-27FY-2
Nominal
stretch,
percent
Temperature,°C
25252525
-196-196-196
2525
-196-196
Orientation
T-ST-SL-SL-ST-SL-SL-S
T-SL-ST-SL-S
W, mm
63.5063.4763.5063.4563.4763.4563.47
63.5563.5363.4763.47
a, mm
2.822.642.67
2.572.672.362.41
2.692.49
2.462.41
2C, mm
10.299.969.739.78
10.039.96
10.11
9.939.839.88
10.01
B, mm
3.353.433.353.333.403.383.51
3.303.533.383.38
Residual
strength,MPa
386.75400.54375.72391.58
333.67430.19
c444.66
372.97337.12
c192.34c406.75
Snet,
MPa
433.09442.54415.49431.89416.63368.71369.62
470.76486.56211.17446.21
g/e _ _
MPa _/m
e40.22e40.44b37.59b39.12b33.85b42.75
b,c44.29
b37.92b33.19
c19.23b,c40.66
aSemicircular flaws, a/c _ 0.48 to 0.54.
bNot valid per ASTM E740-88, Section X3.2.2, crack depth (a) and remaining ligan_nt (B-a) not greater than 0.5(Klelt_ys) 2.CNot valid per ASTM E740-88, Section 6.3.2.2, fatigue crack less than 5 percent of final crack depth.
60

Table C9. NIST Surface Crack (PS(T)) Fracture Tests, Panel 6
Specimen
(a)
A 1-RTA2-RTA3-LN2A4-LN2A5-LHeA6-LHe
B 1-RTB2-RT
B3-LN2B4-LN2B5-LHeB6-LHe
Nominal
stretch,
percent
Temperature,°C
2525
-196-196-269-269
2525
-196-196-269-269
Orientation
T-ST-ST-ST-ST-ST-S
T-ST-ST-ST-ST-ST-S
W, mm a, mm 2c, mm
101.60 3.87 19.97101.60 3.74 19.95101.60 2.93 20.32101.60 2.85 19.53101.60 2.84 19.41101.60 2.75 20.25
63.50 2.62 7.4463.50 2.44 5.9763.50 2.44 6.1863.50 2.41 6.4663.50 2.84 6.4663.50 2.41 6.34
B, mm
4.104.084.084.104.054.05
4.164.054.034.054.054.08
Semielliptical flaws, a/c = 0.28 to 0.38; semicircular flaws, a/c = 0.72 to 0.38.ot valid per ASTM E740-88, Section X3.2.2, crack depth (a) and remaining ligament (B-a) not greater
Residual
strength,MPa
187.00220.00231.00257.00281.00267.00
397.00336.00346.00287.00308.00336.00
Srlet,
MPa
218.69255.94260.14287.34314.18298.53
421.21351.40362.8O301.15319.26352.06
b28.60b33.70b32.70b35.20b38.50b36.70
b32.0023.6024.9021.2022.8024.50
than 0.5( Klelt_ys)2.
Table C10. Tensile Properties for 2090 Near Net Shape Extrusion and Other Aluminum Products
Product
form
Thickness,
mmTemperature,
oC
Longitudinal
El,
percent
Transverse
El,
percent
Ref.
Sy, MPa S u, MPa Sy, MPa S u, MPa
2090-T86 Ext 25 515.0 544.0 3.3 540.0 563.0 3.4 (a)2090-T86 Ext -196 552.0 641.0 5.6 578.0 658.0 6.3 (a)2090-T86 Ext -253 575.0 655.0 3.3 602.0 645.0 1.7 (a)
2219-T87 Sheet 1.6 25 401.6 480.8 9.8 397.9 482.9 10.1 312219-T87 Sheet 1.6 -196 462.7 589.9 15.0 452.7 597.1 12.0 312219-T87 Sheet 1.6 -253 493.0 640.9 16.8 509.2 694.0 14.2 31
2219-T87 Plate 38.1 25 370.1 456.4 10.0 359.9 450.7 10.0 312219-T87 Plate 38.1 - 196 449.1 579.3 11.9 437.4 569.9 12.4 312219-T87 Plate 38.1 -253 501.8 703.3 15.7 482.4 683.8 13.1 31
2090-T86 Ext T-section 25 572.3 575.0 7.9 530.9 544.7 7.4 112090-T86 Ext T-section 25 537.8 567.5 6.0 457.1 486.1 11.0 32
2090-T8 Sheet 1.6 25 505.0 549.0 6.8 332090-T8 Sheet 1.6 -196 568.0 674.0 8.0 332090-T83 Sheet 1.6 25 510.2 551.6 6.3 496.4 537.8 7.8 11
252525
-196-196-253
503.3544.7558.5551.6599.9591.0
579.2648.1665.0
2090-T81 Plate2090-T81 Plate2090-T81 Plate2090-T81 Plate2090-T81 Plate2090-T81 Plate
530.9586.1593.0613.7717.1715.0
606.8737.8836.0
12.712.712.712.712.712.7
7.07.68.09.0
14.012.0
8.010.015.0
503.3551.6551.6565.4627.4613.0
558.5620.6663.0
19.119.119.1
544.7586.1586.1606.8696.4666.0
599.9689.5764.0
2090-T81 Plate2090-T81 Plate2090-T81 Plate
2.06.26.01.06.01.0
6.03.04.0
25-196-253
301134303430
303030
aMSFC data from panel 11.
61

Table C11. Boeing Aerospace Weldment Tensile Data, Panels 4 and 7
Specimen
W4AX-T1W4AX-T3W4AX-T4W4AX-T6
W4AX-T2W4AX-T5
W4BX-T1W4BX-T3W4BX-T4W4BX-T6W4BX-T2W4BX-T5
Nominal
stretch,
percent
Orientation
LLLLLL
LLLLLL
Temperature,°C
2525
2525
-196-196
25252525
-196-196
Gauge
length,mm
25.425.425.425.425.425.4
25.425.425.425.425.425.4
Thickness,
mm
2.882.792.852.742.672.87
3.483.483.433.383.53
3.43
Width,mm
25.3525.4025.5025.3725.3725.25
25.5525.4025.50
25.3225.3525.43
Sy, MPa
173.7182.0177.9182.0236.5226.1
170.3164.1173.0
177.9206.8221.3
S u, MPa
331.6325.4337.8325.4393.6381.9
295.1282.0292.3312.3320.6338.5
El,
percent
7.09.0
10.07.05.06.0
6.09.07.08.05.05.0
W4CX-T3 6 L 25 25.4 3.18 25.53 175.8 318.5 9.0W4CX -T4 6 L - 196 25.4 3.20 25.43 405.4
164.1175.1167.5177.9191.7206.1
LLLLLL
WSAX-T1WSAX-T3WSAX-T4WSAX-T6WSAX-T2WSAX-T5
25.5825.5525.5325.5325.4025.63
295.1297.1252.3302.0368.8295.8
25252525
-196-196
3.713.683.813.583.663.78
25.425.425.425.425.425.4
8.09.06.0
11.05.05.0
W4CY-T1 6 LT 25 25.4 3.73 25.43 196.5 296.4 6.0W4CY-T2 6 LT -196 25.4 3.78 25.73 206.8 358.5 7.0
25252525
-196-196
25252525
-196-196
WSBY-TIWSBY-T3WSBY-T4WSBY-T6WSBY-T2WSBY-T5
W7AX-T1W7AX-T3W7AX-T4W7AX-T6W7AX-T2W7AX-T5
164.8151.7168.2142.7213.0198.5
219.2222.0195.1239.9266.8275.1
3.233.453.483.633.253.66
2.722.773.513.12
2.722.90
LTLTLTLTLT
LT
LLLLLL
320.6297.1294.4275.1406.7348.8
336.4342.6297.8373.7413.6413.0
25.425.425.425.425.425.4
25.425.425.425.4
25.425.4
25.6525.5325.6826.6725.6525.15
25.2725.2725.4022.8625.3225.15
9.09.0
10.09.0
10.010.0
9.09.06.08.05.05.0
Table C12. Boeing Aerospace Weldment Surface Crack (PS(T)) Fracture Tests, Panels 4 and 7
Specimen
(a)
W4AX-F1W4BX-F 1
W4CY-F 1W4CY-F4W4AX-F2W4BX-F2W4CY-F2W4CY-F3
Nominal
stretch,
percent
Temperature,°C
25252525
-196-196-196-196
Orientation
T-ST-SL-SL-ST-ST-SL-SL-S
W, mill
101.55101.55101.55101.35101.63101.47101.42101-52
a, mm
2.392.031.912.012.181.962.061.93
2C, mm
8.849.128.899.029.639.129.278.99
W7AX-F1 3 25 T-S 101.55 2.46 9.80W7AX-F2 3 -196 T-S 101.55 2.41 9.55
B, mm
2.392.542.842.512.592.772.672.62
3.073.10
Residual
strength,MPa
c219.23217.16215.09
c210.27244._246.81
c214.40c246.12
Snet,
MPa
232.05230.14225.47222.65227.54260.39259.74226.95
MPa ,fro
b'c21.43b21.54b20.00
b,c20.66b25.17b23.63
b'c21.10b,c23.63
213.71 259.42 b21.76248.18 263.32 b24.73
asemicircular flaws, a/c = 0.48 to 0.54.
bNot valid per ASTM E740-88, Section X3.2.2, crack depth (a) and remaining ligament (B-a) not greater than 0.5(KlelOys) 2.CNot valid per ASTM E740-88, Section 7.2, variation in specimen thickness greater than 5 percent.
62

Table C13. NIST Weldment Surface Crack (PS(T)) Fracture Tests, Panel 3
Specimen
(a)
Nominal
stretch,
percent
Temperature,oC
Orientation
Wl-2/W2-2 6 25 T-SW3-1/W5-1 6 25 T-SW4-1/W5-2 6 -269 T-S
Wl-I/W2-1 6 25 T-SW3-1/W5-1 6 25 T-SW4-1/W5-2 6 -269 T-SW 1-2/W2-2 6 -269 T-S
W, mm a, mm 2c, mm B, mm
63.50 3.26 20.87 4.4963.50 2.62 19.26 4.2863.50 2.65 19.71 4.36
63.50 2.62 5.95 4.0663.50 2.35 5.78 4.1563.50 3.08 6.53 4.2863.50 2.58 7.28 4.56
asemielliptical flaws, adc = 0.28 to 0.38; semicircular flaws, a/c = 0.72 to 0.94.bNot valid per ASTM E740-88, Section X3.2.2, general yielding occurred.CNot valid per ASTM E740-88, Section X3.2.2, stable crack growth occurred.
Residual
strength,MPa
Snet,MPa
161.00 197.94 b23.50191.00 223.46 b24.60208.00 243.95 b27.00
199.00 208.92 c13.90
216.00 225.19 Cl4.70257.00 272.77 c 18.80248.00 261.33 c19.60
Table C14. Alcoa Exfoliation Test Data for 2090-T86 Extrusion, Panel 6
Specimen
50.8-mm x 101.6-mm skin panel
aRatings per ASTM G34-90:
N no appreciable attackEA superficial exfoliationEB moderate exfoliation
I Specimen number [ 24 hr 48 hr 72 hr [ 96 hr682873 I N a EA EA [ EB
Table C 15. Alcoa MASTMAASIS Exfoliation Test Data for 2090-T86 Extrusion, Panel 6
Specimen Specimen number 1 week 2 weeks 4 weeks
50.8-mm x 101.6-mm skin panel 682873 N (p)a p p
Extrusion section with two stiffeners 682855-1 N (P) N (P) N (P)
Exposed with stiffeners uprightExtrusion section with two stiffeners 682855-2 N (P) N (P) N (P)
Exposed with stiffeners facing down
aRatings per ASTM G34-90:
N no appreciable attackP pitting
63

Table C16. LaRC Direct-Tension Stress Corrosion Data for 2090-T86 Extrusion, Panel 6
Specimen Exposure stress, MPa Exposure time, days Breaking stress, MPa Standard deviation
16 0 0 579.1917 0 0 592.50 583.39 + 7.8918 0 0 578.49
1 0 40 504.873 0 40 517.43 512.40 + 6.654 0 40 514.95
5 136 40 502.806 136 40 497.56 498.09 + 4.477 136 40 493.90
8 273 40 495.4911 273 40 497.08 495.86 + 1.0812 273 40 495.01
13 409 40 495.4914 409 40 495.83 494.22 + 2.4915 409 40 491.35
Mean breaking stress
Table C17. LaRC Stress Corrosion Data for Modified c-Ring Specimen, 2090-T86 Extrusion, Panel 6
Specimen
5
7
8
9
10
Exposure stress
70% Sy
70% Sy
70% Sy
70% Sy
70% Sy
6 70%
11 70%
12 70%
13 70%
14 70%
SrSr
Sy
aLocation definitions:
NA not applicable
Tensile stress
locations
(a)
NA
NA
NA
NA
Masked area
None
None
None
None
Bolt
Bolt
Bolt
Bolt
Bolt and web
Bolt
Bolt
Bolt
Bolt
Bolt and web
1 tensile stresses at outer web and fillet; maximum at mid web at specimen edge2 tensile stresses at outer fillet; maximum at middle of web-skin fillet
3 tensile stresses at inner web and fillets; maximum at middle of web-skin fillet4 tensile stresses at inner radii; maximum at middle of lower fillet
bpass (P) or fail rating after 75-day exposure.
Pass/fail
(b)
P
P
P
P
P
P
P
P
P
P
P
P
P
P
64


REPORT DOCUMENTATION PAGE Fo_A_OMB No, 07704-0188
Public reporting burden for this collection of information is estimated to average 1 hour per response, including the time for reviewing instruct_ns, searching existing data sources,gathering and midntatnlng the data needed, and completing and reviewing the collection of information. Send comments regarding this burden estimate or any other aspect of thiscollection of Information, including suggestions for reducing this burden, to Washington Headquarters Servw,as, Directorate for Information Operations and Reports, 1215 JeffersonDavis Highway, Suite 1204, Arlington, VA 22202-4302, and to the Office of Management and Budget, Paponvork Reduction Project (0704-0188), Washington, DC 20503.
1. AGENCY USE ONLY (Leave blank) 2. REPORT DATE 3. REPORT TYPE AND DATES COVERED
May 1998 Technical Memorandum4. TITLE AND SUBTITLE 5. FUNDING NUMBERS
Characterization of AI-Cu-Li Alloy 2090 Near Net Shape Extrusion
6. AUTHOR(S)
M. J. Birt, M. S. Domack, R. A. Harley, and W. D. Pollock
7. PERFORMINGORGANIZATIONNAME(S)ANDADDRESS(ES)
NASA Langley Research CenterHampton, VA 23681-2199
9. SPONSORING/MONITORINGAGENCYNAME(S)ANDADDRESS(ES)
National Aeronautics and Space AdministrationWashington, DC 20546-0001
WU 232-01-04-07
8. PERFORMING ORGANIZATION
REPORT NUMBER
L-17611
_10. SPONSORING/MONITORING
AGENCY REPORT NUMBER
NASA/TM-1998-207668
11. SUPPLEMENTARY NOTES
Bin, Harley, and Pollock: Analytical Services & Materials, Inc., 107 Research Drive, Hampton, Virginia.Domack: NASA Langley Research Center, Hampton, Virginia.
1211.DISTRIBUTION/AVAILABILITYSTATEMENT
Unclassified-Unlimited
Subject Category 26 Distribution: StandardAvailability: NASA CASI (301) 621-0390
12b. DISTRIBUTION CODE
13. ABSTRACT (Maximum 200 words)
Aluminum-lithium (A1-Li) alloys near net shape extrusions are being evaluated for potential application in launchvehicle structures. The objective of this study was to determine tensile and fracture properties, corrosion resistanceand weldability of integrally stiffened panels of Al-Cu-Li alloy 2090 in the T8 temper. The microstructure was pre-dominantly unrecrystallized. Texture analyses revealed the presence of fiber components in the stiffeners and acombination of fiber and rolling components in the skin. Variations in grain morphology and texture through theextruded cross section were correlated with the tensile, fracture, and corrosion behavior. Tensile strengths at roomand cryogenic temperatures of the 2090 extrusions were similar to other 2090 product forms and were higher than2219-T87, the primary structural material in the Space Shuttle external tank; however, ductilities were lower. Thefracture resistance of the 2090 extrusion was lower than 2219-T87 plate at room temperature. At cryogenic temper-atures, tensile ductility and fracture behavior of the 2090 extrusion were similar to other 2090 product forms butwere lower than 2219-T87 plate. The exfoliation and stress corrosion resistance of the 2090 extrusion comparedfavorably with the characteristics of other 2090 product forms. The weldability and weldment properties of theextrusions were similar to 2090 and 2219 plates.
14. SUBJECT TERMS
AI-Cu-Li alloy; 2090; Near-net extrusion; Cryogenic properties; Fracture; Tensileproperties; Corrosion
17. SECURITY CLASSIFICATION
OF REPORT
Unclassified
NSN 7540-01-280-S500
18. SECURITY CLASSIFICATION
OF THIS PAGE
Unclassified
15. NUMBER OF PAGES
7516. PRICE CODE
A04
19. SECURITY CLASSIFICATION 20. LIMITATION
OF ABSTRACT OF ABSTRACT
Unclassified
Standard Form 298 (Rev. 2-89)Prescdbed by ANSI Std. Z39-18298-102