characterization of a silicon strip detector and a yag:ce
TRANSCRIPT
Characterization of a silicon strip detector and a YaG:Ce calorimeter for a proton computed
radiography apparatus
David Menichelli, Mara Bruzzi, Marta Bucciolini, Giuliana Candiano, Giuseppe A. P. Cirrone, Lorenzo Capineri, Carlo Civinini, Giacomo Cuttone, Domenico Lo Presti, Livia Marrazzo, Stefania Pallotta, Nunzio Randazzo, Valeria Sipala, Cinzia Talamonti , Samuela Valentini, Stefano Pieri, Valentina Reggioli, Mirko Brianzi, Mauro Tesi Abstract– Today, there is a steadily growing interest in the use of proton beams for tumor therapy, as they permit to tightly shape the dose delivered to the target reducing the exposure of the surrounding healthy tissues. Nonetheless, accuracy in the determination of the dose distribution in proton-therapy is up to now limited by the uncertainty in stopping powers, which are presently calculated from the photon attenuation coefficients measured by X-ray tomography. Proton computed tomography apparatus (pCT) has been proposed to directly measure the stopping power and reduce this uncertainty. Main problem with proton imaging is the blurring effect introduced by multiple Coulomb scattering: single proton tracking is a promising technique to face this difficulty. As a first step towards a pCT system, we designed a proton radiography (pCR) prototype based on a silicon microstrip tracker (to characterize particle trajectories) and a segmented YAG:Ce calorimeter (to measure their residual energy). Aim of the system is to detect protons with a ~1MHz particle rate of and with kinetic energy in the range 250-270 MeV, high enough to pass through human body. Design and development of the pCR prototype, as well as the characterization of its single components, are described in this paper.
I.INTRODUCTION
t present, many projects in the field of hadrons- and light ions-therapy are being initiated worldwide, while the
number of operative clinical hadron-treatment facilities is continuously growing [1],[2]. One of the main advantages in using these particles to treat tumors is the possibility to tightly shape the radiation dose to the target volume, thanks to the peculiarities of the interaction on hadrons with matter. However, the spatial accuracy of proton therapy is still presently limited by the uncertainty in stopping power
Manuscript received November 4, 2008. (Write the date on which you
submitted your paper for review.) This work was supported by INFN (PRIMA experiment) and MIUR (PRIN 2006).
D. Menichelli ([email protected]), M. Bucciolini, M. Bruzzi, L. Capineri, S. Pallotta, C. Talamonti, S. Valentini, S. Pieri, V. Reggioli, M. Tesi, are with the University of Florence.
L. Marrazzo is with Azienda Ospedaliero-Universitaria Careggi, Florence. C. Civinini and M. Brianzi are with the INFN, Florence Division. N.
Randazzo is with the INFN, Catania division. G. Cuttone, G. A. P. Cirrone and G. Candiano are with the INFN-LNS (Catania).
D. Lo Presti and V. Sipala are with the University of Catania.
distribution, which is calculated from the photon attenuation coefficients measured by X-ray tomography [3]. This uncertainty could be reduced by directly measuring stopping powers with a proton beam [4], by means of a proton tomography (pCT) apparatus. The aim of our project, described in more detail in [11], is to design, manufacture and test a proton computed radiography (pCR) prototype for small objects analysis. Multiple images of the same object, taken at different angles, will be used to develop novel reconstruction algorithms [12], able to account for multiple Coulomb scattering and thus not entirely based on Monte Carlo simulations as in present times [13]. The entire project exploitation is necessary to conceive a final configuration for a complete pCT system.
The proton energy loss per unit length of trajectory, dE/dx, dominated by ionization and atomic excitation, is well described by the Bethe-Bloch equation:
))(,()( rr IvFndxdE
e=− , (1)
with ne(r) and I(r) respectively electron density and mean ionization potential of the medium at position r. F is a known function depending on proton velocity v and mean ionization potential I. Since in human tissues the variation of I is not large and the dependence of F on I is relatively weak, I(r) in eq. (1) can be replaced by the mean ionization potential of water (61.77 eV) [5]. Under these assumptions, the goal of pCT is mainly the determination of ne(r) in the medium under study.
pCT has been proposed in the seventies as an alternative to X-ray tomography to obtain high contrast images [6] with reduced delivered dose to the patient [7]. Already at that time, it appeared clear that the main problem with pCT is that protons do not move along straight lines across the medium because of multiple Coulomb scattering. Single proton tracking is a promising way to collect as much as possible information in order to circumvent this difficulty [8],[9]. Note that Coulomb scattering distribution contains itself additional information about material structure which, in principle, could be exploited, as it has been already established for non-medical applications [10].
A

Two different approaches based on single particle tracking have been proposed in recent times. A device, developed at Paul Scherrer Institut (Villigen, CH) included two scintillating fiber hodoscopes to measure entrance and exit coordinates. The residual range was determined with a range telescope consisting of a stack of scintillator tiles [14],[15]. In the other approach, developed at SCIPP (Santa Cruz Institute for Particle Physics, USA) and tested at the Loma Linda University Medical Center (LLMUC, USA) [16],[17], a tracker (equipped with silicon microstrip detectors with 194 µm strip pitch and 400 µm thickness) was used to measure entrance and exit coordinates and angles. This device is capable to track protons up to a particle rate of about 1 kHz, with an energy resolution, measured by a time-over-threshold technique, of 15-25% in the range 5-250 MeV [18]. The initial prototype has been recently upgraded with a calorimeter to provide an independent measure of proton residual energy [19]. The pCR system presented in this study is conceptually similar to the device developed at SCIPP, but with much higher potential performances. The system has been designed to detect protons with initial kinetic energy high enough to transverse a human trunk (in the range 250 to 270MeV) with a particle rate of ~1MHz, in order to collect data within a time of the order of 1s, suitable to clinical demands. Trajectory parameters to be measured are entrance and exit angles, entrance and exit transverse positions and residual energy. These data can be used as input of most-likely path calculations (MLP) to carry out a map of the tissue electron density [20]. The final pCT system should be able to measure electron density with accuracy better than 1% and with spatial resolution better than 1 mm.
II. ARCHITECTURE An overview of the pCR system is described in Fig. 1. It
includes a tracker and a calorimeter. The tracker is composed of 4 xy planes (p1 to p4), aligned within a rack, each plane able to measure x and y coordinates in a different point of the particle trajectory. A possible particle path is indicated as an example. Planes p1 and p2 measure entrance angle and position; a phantom (i.e. a mass of material that absorbs and scatters radiation in approximately the same way as the human tissues) is placed in the gap between planes p2 and p3. Planes p3 and p4 measure exit angle and position. An additional plane (p5) is included in the architecture since it could be useful for tests within a segmented phantom. Fig.1 shows as an example a segmented phantom constituted by 12 planar slabs. In this case p5 is inserted within the stack of slabs in order to check the agreement between actual most likely proton trajectory and theoretical predictions. The distance D between entrance (or exit) planes is about 1cm and could be changed to optimize the measurement resolution. Beyond the
last plane (p4), protons stop inside the calorimeter, which measures their residual energy.
Fig. 1. Description of a pCR system in typical test configuration. The telescope (composed of xy planes p1 to p4), the calorimeter and a segmented phantom are shown. In this example the phantom is composed of 12 planar slabs which, in general, can be un-homogeneous.
The architecture of the pCR readout system is shown in
detail in Fig. 2. Each xy plane is composed of two identical tracker modules, each including a 256-channels silicon microstrip detector, analog front-end ASIC and digital electronics for data acquisition and transmission. One of the two tracker modules within the same xy plane is flipped upside down and rotated by 90° with respect to the other, to measure both the x and y local trajectory coordinates. The distance between the two microstrip detectors in the assembled xy plane is 2mm. Each tracker module communicates with the control terminal (PC) by an Ethernet (IEEE 802.3) connection. In addition, the tracker module receives from the calorimeter the trigger signal corresponding to every proton hit (event) and the tag global event number (GEN) generated by the calorimeter digital board in correspondence to every trigger. This tag is attached to all the data related to said event in order to allow an easy and unambiguous event building.
The calorimeter is made by 4 YAG:Ce scintillating crystals (indicated as Sc in Fig.2). Each crystal is readout by a photodiode (Ph) and a commercial electronics set-up, composed by a preamplifier Pr (Cremat, Watertown, U.S., mod. CR110) and a shaper Sh (Cremat mod. CR200-1µs). The analog outputs (CO0 to CO3) are directly sampled by a commercial (Strategic Test Corporation, Stockholm, mod. UF2-4032) 14 bit, 50MHz acquisition board, in order to measure their maxima, which are proportional to the energy released in the crystals. These signals are used also by the calorimeter digital board to generate the trigger (if enabled by tracker modules) and the GEN. Trigger generation is obtained by comparing the analog sum of CO0 to CO3 with a fixed threshold Vth
', which is remotely chosen. It is communicated from the PC to a tracker module via the Ethernet connection, then transmitted to the calorimeter digital board by the 3-bit bus Vth'_ctrl and finally converted into the analog voltage level V'
th by a digital-to-analog converter (DAC). The trigger is used to start the acquisition board, which acquires the GEN too.

Fig. 2. Architecture of the pCR apparatus, including the tracker and the calorimeter units. Each tracker module includes a microstrip detector. The four scintillating crystals are indicated as "Sc." Each of them is followed by a photodiode (Ph), a preamplifier (Pr) and a shaper (Sh).
III. CALORIMETER The calorimeter is based on YAG:Ce scintillating crystals. This material has been selected because of its short decay constant (75ns) as compared to the expected particle rate. Moreover, due to the wavelength of emitted light (λ=550nm), it can be read-out through a photodiode, without the need of a photomultiplier. According to the simulations carried out with the code SRIM (Stopping and Range of Ions in Matter, [21]), 10cm of YAG:Ce are sufficient to stop a 200MeV proton beam. At this energy the mean proton range is 77.5mm, longitudinal straggling is 3.15mm and lateral straggling 3.48mm.
A single YAG:Ce crystal was tested with protons at INFN-Laboratori Nazionali del Sud (LNS), Catania, and at LLUMC. The photodiode (Hamamatsu mod. S3204-05) was readout by a CREMAT CR-110 pre-amplifier (gain 1.4 V/pC) followed by an Ortec 572 shaper (gain 100, shaping time 10µs). The measured energy distribution resulting from LNS cyclotron tests (energy spread of the beam less than 1%) is
shown in Fig. 3. Response linearity is within 0.85% in the kinetic energy range from 20 to 60MeV. The measured resolution (evaluated as FWHM) is 3.6% with 60MeV protons and about 1% at 200MeV. The low-energy tail (channel<500) is due border effects which, due to beam divergence, are produced in the beam pipe and in the collimator. FWHM resolutions measured with protons of various kinetic energies are reported in Table I.
0 200 400 600 8000.0
0.2
0.4
0.6
0.8
1.0Center = 568,01Width = 20,5Resolution = 3,6%
norm
aliz
ed c
ount
s
channel
Fig. 3. Energy distribution obtained by testing the calorimeter with 60MeV protons at LNS. The pCR calorimeter is made of four 3×3×10cm3 YAG:Ce optically separated crystals, arranged as a 2×2 matrix and enclosed within an aluminum housing. SRIM simulations show that proton crossing from one crystal to another becomes relevant in energy range 100-200 MeV. The dead material for optical separation is a 200 µm thick Al layer, producing a negligible energy loss, of 200 keV or less.
TABLE I CALORIMETER RESOLUTION, MEASURED WITH PROTONS OF VARIOUS KINETIC
ENERGIES.
Beam location INFN-LNS LLMUC Energy (MeV) 34 40 54 60 200 FHWM (%) 9 7 5 4 1
The energy resolution of all crystals and their optical separation have been verified with 60 MeV protons at LNS. The uniformity of each crystal has been evaluated by collimating the beam onto nine different points of the crystal and measuring the most likely energy Ei. The standard deviation of this set of measurements is σ(Ei)=1.3%. The four crystals have same energy resolution, even though the mean sensitivity changes of about 20% from one crystal to the other. These sensitivity variations, which are due to differences in intrinsic crystal light yield, optical coupling and photodiode sensitivity, will be accounted for by single crystal calibration.

IV. TRACKER MODULE
A. Overview
Fig.4. Architecture of a single tracker module, consisting of two printed circuit boards: the tracker front end board and the tracker digital board.
Each xy plane is composed of two identical tracker modules. As shown in the block diagram of Fig. 4, each tracker module includes two electronics boards: a front end board and a tracker digital board. The latter is mounted piggyback to the former, as shown in the photograph of Fig.5. The front end board carries a 256 channels silicon microstrip sensor and the readout ASICs. The equivalent electrical diagram of the ith strip (i=0-255) is shown in the figure, inside the "microstrip sensor" box. Strip junction (Di), coupling capacitance (Ci), bias resistor (Ri) and the connection to the high voltage source (HV) needed to deplete the junction are shown in the scheme. The transient current Ii generated by particle crossing is read out by the corresponding ASIC channel.
Each ASIC consists of 32 independent channels, including a charge sensitive preamplifier, a shaper and a
comparator, suitable to produce a digital output by comparison with a fixed threshold Vth. It is also possible to directly feed the ASIC odd and even inputs by test signals, to calibrate the device or to check its functionality. ASICS are grouped in two sections, A and B, with independent thresholds (Vth_A and Vth_B) and test signals (Test_A and Test_B). A detail of signal routing is shown in Fig.6, in the case of section A. Test signals can be generated by the FPGA (FPGA_test) sitting on the tracker digital board, or by an external source (Test_ext). Similarly, threshold level (Vth_A) can be fixed either by an external reference device (Vth_ext) or by a DAC, controlled by the FPGA through digital control lines (Vth_ctrl). In the front end board tested in this work, the threshold is common to all the chip within the same section (e.g. Vth_A = VthA0 =...=VthA3). In a further version of the board, a fine threshold regulation, chip by chip, will be implemented, thanks to a new set of resistors (R) and potentiometers (P0-3), as discussed in Sec. IV.
Fig. 5. Photograph of the tracker module prior to sensor mounting. The L-shaped tracker digital board is mounted piggy-back to the front end board. The sensor will be allocated in the squared hole in the center of front end board. The lateral size of the front end board is 24cm.
The tracker digital board carries an FPGA with high
input-output capabilities (Xilinx Spartan 3AN XC3S1400AN), a static RAM memory (composed of 4 1Mbit×16 static memories) and a commercial Ethernet unit (Memec V4Fx12 mini-module). The main role of the FPGA is to sample the 256 data lines from ASIC buffers, to implement pre-processing (including zero-suppression) and to store reduced data in the memory bank (about ~1×10⁶ events can be allocated). In addition, the FPGA carries out additional test and control tasks: generates test signals for even and odd ASIC channels; generates DAC controls to set the threshold Vth; enables the calorimeter to start trigger generation (through "Trigger enable" signal) when it is ready to acquire data; receives the trigger and the GEN from the calorimeter. Inside the tracker digital board, the communication between RAM blocks, Ethernet unit and FPGA is established through data, address and control buses. Twelve additional lines are employed for direct communication between the FPGA and the Ethernet unit. The FPGA stores the result of data readout into the memory bank. These data are transferred
independently to the PC by the Ethernet unit at the end of the measurement. In such a way, the event rate is not limited by the speed of data transmission toward the remote PC. Note that about 0.1s are needed to transfer data from the memory bank to the Ethernet module on-board memory (three clock cycles 10ns long are required to read a 16bit word from the bank). Moreover, about 0.5s are necessary to transfer data from 8 tracker modules to the PC at 1Gbit/s rate. To complete data transfer from the tracker to the PC about 0.6s plus network latency will be needed. The actual value has to be measured yet.
The typical power consumption of both the front-end board and the tracker digital board is about 3W.
Fig.6 Details of test and threshold generation and routing. Two ASICS (0 and 3) from group A are shown. Fine threshold regulation by potentiometers is not implemented in the front end board version considered here, in which VthaA0=...=VthA3=Vth_A).
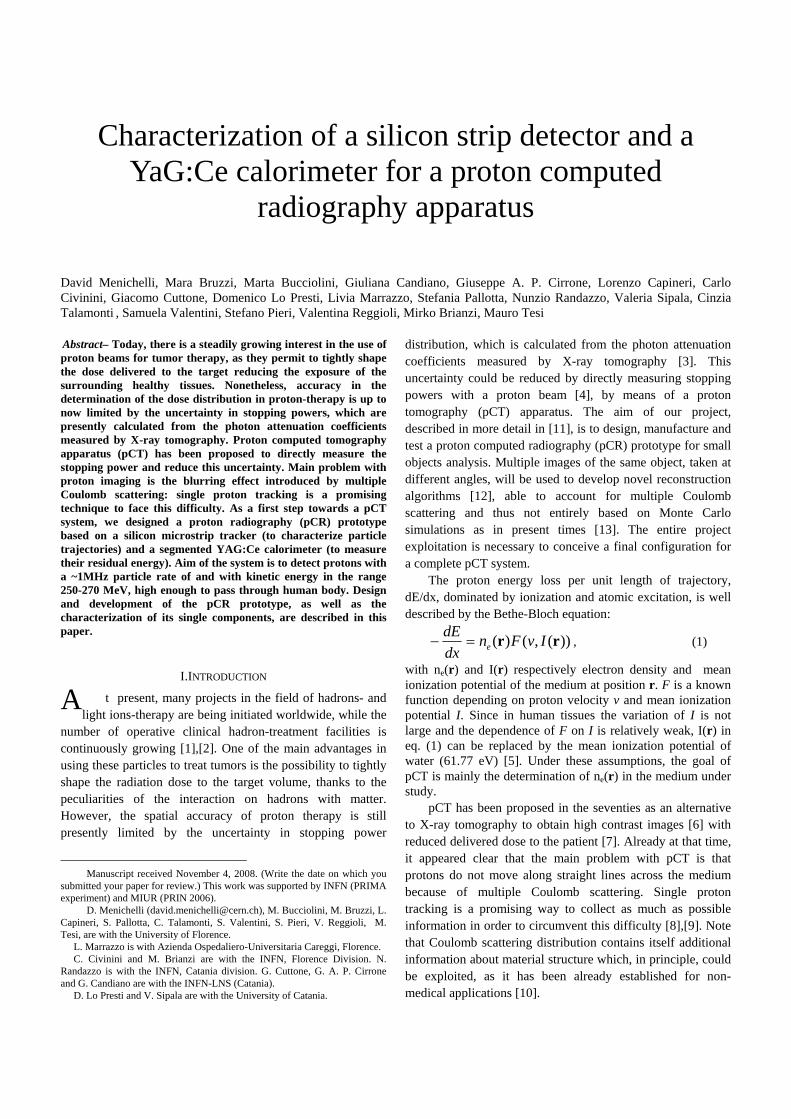
B. Silicon sensor The silicon detector, produced by Hamamatsu Photonics,
is a 256-channels single-sided microstrip sensor obtained by implanting p+ strips in n-type floating zone wafer with <100> crystal orientation. Its active area is 51mm×51mm and the strip pitch is 200µm. When compared to double-sided microstrip devices, single-sided ones have higher reliability, lower cost and a wider availability. The drawback is that two sensors instead of one are needed in each xy plane, so more Si material is placed along the particle track. A 200µm wafer thickness has been chosen as a best tradeoff between good sensitivity, low energy loss and low Coulomb scattering. AC coupled pads (to be connected to front end electronics), DC coupled pads (for testing), bias ring, guard ring and the pad connected to the substrate are evidenced in Fig. 7.
The sensor is designed to be operated in the range from 100 to 200V reverse bias: full depletion voltage is less than 75V and the leakage current at 200V is less than 500nA. Implant strips are AC coupled to the readout metal strips by an
integrated capacitance of 280pF, and biased through a 1.25MΩ polysilicon resistor. The total strip capacitance, as measured by the readout preamplifier, is 1.5pF/cm.
Fig. 7. Detail of the 256-channels microstrip detector .
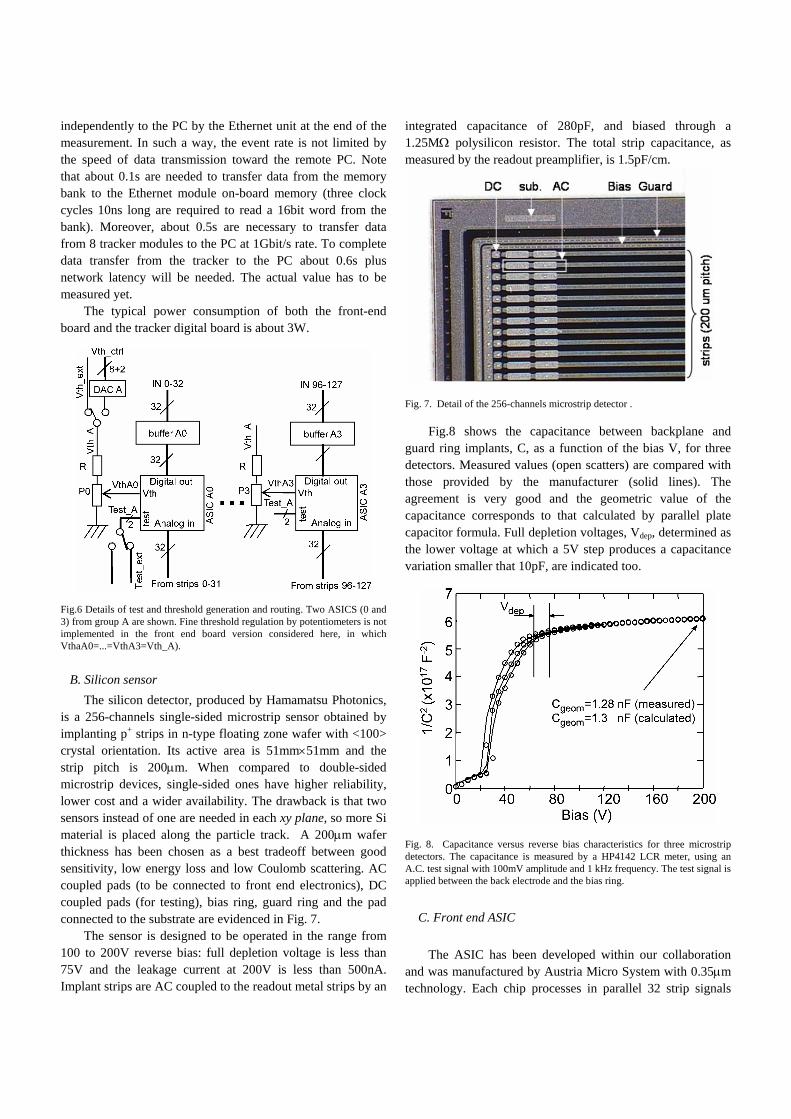
Fig.8 shows the capacitance between backplane and guard ring implants, C, as a function of the bias V, for three detectors. Measured values (open scatters) are compared with those provided by the manufacturer (solid lines). The agreement is very good and the geometric value of the capacitance corresponds to that calculated by parallel plate capacitor formula. Full depletion voltages, Vdep, determined as the lower voltage at which a 5V step produces a capacitance variation smaller that 10pF, are indicated too.
Fig. 8. Capacitance versus reverse bias characteristics for three microstrip detectors. The capacitance is measured by a HP4142 LCR meter, using an A.C. test signal with 100mV amplitude and 1 kHz frequency. The test signal is applied between the back electrode and the bias ring.
C. Front end ASIC The ASIC has been developed within our collaboration
and was manufactured by Austria Micro System with 0.35µm technology. Each chip processes in parallel 32 strip signals

and produces digital outputs. Odd or even channels can be excited by applying a voltage step ∆V to dedicated test terminals. For each channel, this step is filtered by an integrated capacitance Ct~0.5pF which injects a charge pulse Qtst=∆V·Ct inside the charge preamplifier. The signal processing chain includes, in addition to the charge preamplifier, a high pass filter, an integrator (with a 600ns time constant), a comparator (C) and a buffer (B). The comparator produces a digital signal by comparing the shaper analog output to a threshold level Vth, which is common to all the channels. Shaper output quiescent point is 1.65V, and Vth must exceed this value. At a fixed threshold, the duration T of the ASIC output pulse is correlated to the energy released by the proton within the detector. This feature could be used to evaluate the energy loss in silicon from the duration of the output pulse (with a time-over-threshold, TOT, procedure) and thus improve the calorimeter reading resolution. ASIC input dynamic range is about Q~900×103 electrons, corresponding to an energy loss in silicon of about 3MeV. Required power supply is 3.3V and power consumption is less than 300mW. Uniformity of channel response has been measured as the standard deviation of output pulse duration at fixed threshold and Qtst: σ(Ti)~2.5%, i=1...32 being the channel index.
D. Electrical characterization Various tests have been carried out on the front end board
to assess its electrical performance (by injecting a test pulse inside ASIC test inputs) and particle detection capabilities (with a 90Sr β radioactive source and 62MeV protons at LNS).
The charge generated in 200µm silicon by β radiation can be approximated with that which would be released by a minimum ionizing particle (MIP), whose most probable value is Q~1.5×10⁴ electrons. Moreover, according to Monte Carlo simulations, we know that: a) the minimum charge released in 200µm-thick silicon from 250MeV protons (with a 98% confidence) is about 3.0×10⁴ electrons. b) The charge released by protons is monotonically decreasing with particle initial kinetic energy in the 10-250MeV range. Thus, we expect that our system, when exposed to protons from a radiotherapy beam, will always have better detection performances than those we can measure with a β radiation source. Moreover, the efficiency in detecting protons with energy <250MeV cannot be smaller than the efficiency at 250MeV.
To carry out measurements in actual noise conditions, electrical tests have been performed after the wedge bonding of the silicon sensor. The procedure used to determine the best voltage threshold Vth to be applied to an ASIC is illustrated in Fig. 9. Impact of noise is shown in the upper plot. Noise occupancy Ωi of a channel is evaluated as the fraction of time
in which, when no signal is applied to the input, the output is active. In the plot are shown the Ωi measured with various channels of a single chip, as well as the occupancy ΩOR=OR(Ωi) of the output logic OR. Note that there is a strong correlation of the noise in different channels, so that ΩOR is only slightly higher than the occupancy of the most-noisy channel. From noise rejection point of view, a threshold is considered acceptable if ΩOR<0.1%; it follows that, for this particular chip, the noise sets the threshold lower limit to Vth>1.686V.
Fig. 9. Upper plot: noise occupancy as a function of threshold voltage for all the 32 channels of a single ASIC and for their logic OR. The Vth limit at 0.1% occupancy is evidenced. Lower plot: detection efficiency for two injected charge levels: 1.5×10⁴ electrons (about the most probable value released by 1MIP or β) and 3.0×10⁴ electrons (about the minimum charge released by 250MeV protons).
In order to evaluate efficiency, a 50kHz test square wave
has been used to inject a charge pulse Qtst inside the preamplifiers. The efficiency εi of a channel is evaluated as the number of output pulses measured in coincidence with input pulses, divided by the total number of input pulses. Results for a single chip are shown in Fig.9, bottom plot, in the case of two different charge injection levels: Qtst=1.5×10⁴

electrons (roughly corresponding to the most probable charge released by a MIP or β) and Qtst=3.0×10⁴ electrons (which is about the minimum charge generated by a 250MeV proton). From the plot we infer that, to detect β with low noise and high efficiency, a threshold range Vth=1.69-1.70V is suitable; whilst in the case of 250MeV protons the available range for full efficiency is much larger: Vth=1.69-1.77V. For 7 chips out of 8 mounted on the tested front end board prototype, a threshold range from about 20mV to 30mV was found, where both requirements of high efficiency in β detection and low noise were satisfied. The other chip has a slightly higher noise level and could be used for β testing only with a reduced efficiency. Nevertheless, the chip characteristics are good enough to detect 250MeV protons with full efficiency. In a further version of the front end board a fine threshold regulation on chip-by-chip basis through potentiometers is foreseen, as indicated in Fig.6. This will ensure that all the chips on the front end boards upstream the patient will work in optimal conditions even when detecting 250MeV protons. Coarse threshold voltage setting is performed on a board-by-board basis, to adapt the chip response to the different proton energy spectra upstream and downstream the patient, thus increasing the system sensitivity to TOT charge measurement.
The maximum output pulse duration value (Tmax) which allows 1MHz operation depends on event pile-up and thus on the detailed beam time structure. Since Tmax cannot be determined at this stage, in order to make estimates on the input dynamic range, we will consider acceptable the range Tmax=800-1100ns. Fig. 10 summarizes the typical dependence of the input dynamic range on Vth, as measured with the 32 channels of a single ASIC. Triangular scatters indicate the injected charge Q1(T,Vth) which determines a given output pulse duration (T=Tmax=800-1100ns), given as a function of Vth. Open circles represent the smallest released charge Q2(Vth) which can be detected at full efficiency (ε≥99%). Q1 and Q2 values have been measured by injecting charge pulses inside the ASIC test inputs and represent an average on the 32 channels of the chip. To make a comparison, the charge distributions f(Q,K) which are released in by protons of various kinetic energies K, as calculated with a Geant4 Monte Carlo tool [22], are shown in the far right. By comparing Q1, Q2 and f functions it is possible to predict which proton energy range can be measured with high efficiency ((ε≥99%) and high particle rates (T<Tmax). The corresponding regions spanned in the Q(Vth) plane are indicated by open rectangles in Fig. 10. For instance, a threshold Vth=1.69-1.72V is suitable to detect protons with kinetic energy K=30-250MeV and Tmax=800ns. The kinetic energy range K=10-250MeV can be covered with Vth=1.69-1.73V if Tmax=1100ns can be accepted. The range K=10-62MeV can be covered with Vth=1.91-1.95V if Tmax=1000ns; and so on.
Fig. 10. Input dynamic range as a function of the threshold Vth measured for an ASIC connected to the silicon detector. Open-circles indicate the limits for full efficiency operation. Triangles indicate the injected charge level producing a given output pulse duration. Simulated energy release distributions in 200µm of Si for protons of various energies are indicated in the far right. Rectangles indicate regions in which full efficiency and high event rate can be achieved.
Fig. 11. Calibration of the 32 channels of an ASIC. Arrows indicate, as a reference, the most likely charge release corresponding to MIPs, 250MeV protons and 62MeV protons. Data were measured with Vth=1.69V and Vth=1.94V, as indicated.
Fig.11 shows an example of T(Q,Vth) chip calibration. T(Q,Vth) values are measured by injecting a charge Q in the test input of the chip, while a constant Vth (1.69V or 1.94V in this case) is applied. Such curves are used to convert the measured pulse duration T into the released charge Q during particle detection. From the plot it is evident that in the case Vth=1.69V the characteristics are nonlinear, showing a reduced slope at high charge. This feature does not conflict with the main purpose of these chips, which is to reveal particle crossing, but reduces the sensitivity in energy loss

evaluation by TOT. When Vth is increased we observe that: a) the T(Q,Vth) curves are shifted toward higher charge values, thus sensitivity at high charge values is increased while efficiency at low charge is decreased; b) pulse duration T(Q,Vth) decreases. Facts (a) and (b) suggest to optimize the tracker performances by choosing different threshold levels in the various xy planes. For instance, a higher threshold downstream the patient, where the energy of protons is lower, would lead to a better sensitivity in energy loss evaluation by TOT, as well as to shorter output pulses.
E. Tests with particles Electrons emitted by a 0.1mCi 90Sr beta source and
62MeV protons produced at the LNS cyclotron have been measured with our prototype front-end board. In this experiments, all the 32 channels of a single ASIC have been read by means of a logic analyzer (Tektronix TLA5201).
In measurements with β particles, a low noise scintillator, placed downstream the silicon detector, was used to generate the trigger. Each time the mth channel activates, the measured pulse duration t is used to calculate the released charge Q by means of the Tm(Q) calibration curve: Q=[Tm(Q)-1](t). Fig.12 shows the spectrum fi recorded one channel, fi is the number of counts measured in the ith charge bin. The histogram has been fitted to a Landau distribution in the Moyal approximation [23] (gi), to obtain the most likely value of the released charge Q0. The agreement between experimental values and fit, SRrms, is evaluated as:
( )[ ]∑
∑ −=
i
iirms f
gfSR2/12
. (2)
SRrms and Q0 are plotted in the inset of Fig.12. For a large fraction of channels it is possible to obtain a reasonable fit with an estimated most probable charge of about 1.3×10⁴ electrons. Note that this is a relative measure of the released charge, because the calibration curves Tm(Q) are obtained assuming that all the input test capacitances are equal to the nominal value Ctst=0.5pF. Since β particles cause mostly the activation of a single channel, this value should be compared with the total amount of charge released by a MIP in 200µm silicon (1.5·104 electrons). In experiments with 62MeV protons, a YAP:Ce calorimeter, coupled to a photomultiplier, is placed downstream the silicon sensor to provide the trigger signal. An aluminum collimator, 2.0cm thick and with an aperture size of 5mm×50mm, is mounted behind the sensor. This aperture selects protons passing through 25 strips out of the 32 read by the logic analyzer, to prevent the generation of trigger signals due to protons undetected by our readout system, thus allowing an efficiency estimation of the silicon detector. The
mean event particle rate measured by the calorimeter was ~500Hz.
Fig. 12. Example of energy distribution obtained with β radiation from a 0.1 mCi 90Sr source. The inset shows the fit quality (right axis) and the most probable charge (left axis) for different chip channels.
Fig.13. Charge spectrum of 62 MeV protons obtained with 16·103 events and Vth=1.94V. A typical charge spectrum measured in the case of a single channel is shown in Fig.13. The measured histogram is compared to the Landau fit. The most likely charge obtained by the fit for all the channels is shown in the inset. The mean value is Q0=8.7·104 electrons, and the discrepancy with Monte Carlo prediction (1.05·105 electrons) can be ascribed to the tolerance of integrated ASIC input capacitances.
In order to evaluate proton detection efficiency, adjacent channels which activate in coincidence with the same trigger are grouped in a cluster. Efficiency is defined as the number of trigger followed by a cluster, divided by the total number of triggers. Efficiency dependency on the threshold is shown in Fig.14. The maximum measured efficiency is 98%, and such a

value can be achieved in a wide threshold range (1.68<Vth<1.85V). In about 99% of cases there is one cluster in the event. In 98% of clusters only one strip is active. Mean signal duration ranges from 400ns at Vth=1.95V to 700ns at Vth=1.70V. Efficiency grows with detector bias and saturates at about Vbias=40V.
Fig.14, Proton detection efficiency, measured with 62MeV protons, as a function of threshold voltage, using 1.6×10⁴ events and Vbias=90V.
V.CONCLUSIONS
Steps towards the development of a proton computed tomography (pCT) system have been described. The main overall goal of the project is to map tissue electronic density with 1% accuracy and 1mm space resolution. The target of hardware design is to track protons at 1MHz event rate and to measure their residual energy with a FWHM resolution of 1% at 250 MeV. Time for data transmission and processing are planned within requirements for clinical applications.
As a first step, an apparatus for proton radiography (pCR) has been designed. The pCR device includes a tracker, based on single sided silicon microstrip sensors, and a segmented calorimeter based on YAG:Ce crystals to measure proton residual energy. The tracker is capable to characterize the trajectory of each proton before and after crossing the patient (or the phantom) in terms of a) entrance angle and position and b) exit angle and position. Possibly, the energy loss in silicon could be measured by a time-over-threshold procedure. Tracker front-end board has been successfully characterized from the electrical point of view, and tested with β particles from a 90Sr radioactive source and 62MeV protons. Calorimeter crystals have been tested with 62 MeV (at LNS) and 200MeV protons (at LLUMC).
The next steps will be the complete commissioning and beam test of the full telescope, the conceptual design of the pCT system and the development of suitable reconstruction algorithms. These algorithms will be validated using data
taken with the pCR prototype in conjunction with a rotating phantom.
REFERENCES [1] M. Dosanjh, H. F. Hoffmann, G. Magrin, "Status of hadron therapy in Europe and the role of ENLIGHT," Nucl. Instr. and Meth. vol. A 571, pp. 191–194, 2007. [2] Data base of particle therapy co-operative group, at http://ptcog.web.psi.ch/linksC.html. [3] U. Schneider, E. Pedroni and A. Lomax, "The calibration of CT Hounsfield units for radiotherapy treatment planning," Phys. Med. Biol. vol. 41, 111–124, 1996. [4] P. Zygmanski, K. P. Gall, M. S. Z. Rabin and S. J. Rosenthal, " The measurement of proton stopping power using proton-cone-beam computed tomography," Phys. Med. Biol. vol. 45, pp. 511-528, 2000. [5] R. Schulte et al., " Conceptual Design of a Proton Computed Tomography System for Applications in Proton Radiation Therapy," IEEE Trans. Nucl. Sci., vol. 51, no. 3, pp.866-872, 2004 [6] K. M. Hanson, " Proton computed tomography," IEEE Trans. Nucl. Sci., vol. 26, no. 1, p. 1635-1640, 1979. [7] A. M. Koehler and V. W. Steward, "Proton beam radiography in tumor detection," Science, vol. 179, no. 4076, pp. 913-914, 1973. [8] U. Schneider and E. Pedroni, "Multiple Coulomb scattering and spatial resolution in proton radiography," Med. Phys., vol. 21, p. 1657-1663, no. 11, 1994. [9] G. A. P. Cirrone et al., "Monte Carlo Studies of a Proton Computed Tomography System," IEEE Trans. Nucl. Sci., vol. 54, no. 5, p.1487-1491, 2007. [10] N. S. P. King et al., "800-MeV proton radiography facility for dynamic experiments," Nucl. Instr. and Meth. A, vol. 424, no. 1, pp. 84-91, 1999. [11] G.A.P. Cirrone et al., " The Italian project for a proton imaging device," Nucl. Instr. and Meth., vol. A576, pp. 194-197, 2007. [12] "Principles of Computerized Tomographic Imaging," A. C. Kak and Malcolm Slaney, IEEE Press, 1988. [13] T. Li, Z. Liang, J. V. Singanallur, T. J. Satogata, D. C. Williams, and R. W. Schulte, "Reconstruction for proton computed tomography by tracing proton trajectories: A Monte Carlo study," Med. Phys. vol. 33, pp. 699-706, 2006. [14] P. Pemler, J. Besserer, J. de Boer, M. Dellert, C. Gahn, M. Moosburger, U. Schneider, E. Pedroni, H. Stäuble", " A detector system for proton radiography on the gantry of the Paul-Scherrer-Institute," Nucl. Instr. and Meth., vol. A432, p. 483-495, 1999. [15] U. Schneider, J. Besserer, P. Pemler, M. Dellert, M. Moosburger, E. Pedroni, B. Kaser-Hotz, "First proton radiography of an animal patient," Med. Phys. vol. 31, no. 5, p. 1046-1051, 2004. [16] L. Johnson, B. Keeney, G. Ross, H. F. -W. Sadrozinski, A. Seiden, D.C. Williams, L. Zhang, V. Bashkirov, R. W. Schulte, K. Shahnazi, "Initial studies on proton computed tomography using a silicon strip detector telescope," Nucl. Instr. and Meth., vol. A514, p. 215-223, 2003. [17] H. F. -W. Sadrozinski et al., "Toward Proton Computed Tomography," IEEE Trans. Nucl. Sci., vol. 51, no. 1, p. 3-9, 2004. [18] H. F. -W. Sadrozinski et al., "Issues in Proton Computed Tomography," Nucl. Instr. and Meth.,vol. A511, pp.275-281, 2003 [19] M. Bruzzi et al., "Prototype Tracking Studies for Proton CT," IEEE Trans. Nucl. Sci., vol. 54, no. 1, p. 140-145, 2007. [20] D. C. Williams, " The most likely path of an energetic charged particle through a uniform medium," Phys. Med. Biol., vol. 49, no. 13, pp. 2899-2911, 2004. [21] J. F. Zieglernext and J. M. Manoyan, "The stopping of ions in compounds," Nucl. Instr. and Meth. vol. B 35, no. 3-4, pp. 215-228, 1988. [22] S. Agostinelli et al., “GEANT4—A simulation toolkit,” Nucl. Instr. and Meth. vol. A506, no. 3, pp. 250-303, 2003. [23] J.E. Moyal, "Theory of ionization fluctuations," Phil. Mag., vol. 46, p. 263, 1955.