characterization of a laser-nitrided titanium alloy by...
TRANSCRIPT

Ple
ase
note
that
this
is a
n au
thor
-pro
duce
d P
DF
of a
n ar
ticle
acc
epte
d fo
r pub
licat
ion
follo
win
g pe
er re
view
. The
def
initi
ve p
ublis
her-a
uthe
ntic
ated
ver
sion
is a
vaila
ble
on th
e pu
blis
her W
eb s
ite
1
Surface and Interface Analysis NOVEMBER 2005; VOLUME 37 (113) : Pages 1161–1167 http://dx.doi.org/10.1002/sia.2128 © 2005 John Wiley & Sons, Ltd.
Archimer Archive Institutionnelle de l’Ifremer
http://www.ifremer.fr/docelec/
Characterization of a laser-nitrided titanium alloy by electron backscattered diffraction and electron probe microanalysis
D.M. Gordin1, T. Gloriant1,*, M. Bohn2, A. Guillou1, I. Thibon1, D. Ansel1
1INSA de Rennes, Groupe de Recherche en Chimie-Métallurgie (GRCM-EA2620), 20 avenue des Buttes de Coësmes, F-35043 Rennes cedex, France 2IFREMER, Centre de Brest, Z.I. Pointe du Diable, B.P. 70, F-29280 Plouzané, France *: Corresponding author : T. Gloriant, email address : [email protected]
Abstract: After a laser gas nitriding treatment of the Ti-7.5Al (at.%) titanium-based alloy, we used a combination of electron backscattered diffraction (EBSD) in scanning electron microscope and electron probe microanalysis (EPMA) techniques in order to characterize efficiently the different phases in the resolidified layer. Representative measurements of chemical composition and reliable determination of crystal structure were possible for each phase of the complex microstructure. The reaction zone is formed by a mixture of isostructural TiN phases with dendritic and/or “coarse” needles morphology, fixed into a α’-Ti matrix (martensite) with a thin needle aspect. The nitrogen solubility was found to remain very low in the α’-Ti matrix (up to 2-3 at.%), while in the TiN phase, an aluminum solubility as high as 4 at.% was measured reducing drastically the nitrogen content into a Ti79N17Al4 chemical composition. Keywords: laser gas nitriding, titanium nitride coating, electron backscattered diffraction, electron probe microanalysis.

Introduction
Among the metallic biomaterials, titanium and titanium alloys possess several properties that make them the most used for biomedical devices today. Titanium alloys have a good corrosion resistance in human fluid, high strength-to weight ratio, low modulus, light weight, good biocompatibility [1-3]... Unfortunately, despite these numerous advantages, for applications that involve sliding or friction processes, titanium and its alloys do not offer adequate wear resistance [4, 5]. Consequently, different solutions, aimed to improve the tribological properties and at the same time to exploit the others previously presented qualities of these metallic materials, are being developed. One of the better solution is the deposition of a hard thin layer on the surfaces subjected of such phenomena. Titanium nitride coatings are widely used in applications demanding high wear with minimum interference or impact. It is the most common hard coatings used for biomedical devices having an excellent combination of performance properties: high hardness, low wear rates, excellent biocompatibility and attractive appearance [6-8]. It has also been reported that the dissolution of Ti ions from TiN in physiologic fluid is very low [9]. Today, a great variety of techniques for deposition of TiN is used: PVD, CVD, laser deposition, thermal spraying… Laser gas nitriding has an important place among these actual techniques because it possesses certain exclusive advantages: the perfect adhesion between TiN surface layer and bulk material, a very small thermally affected zone, the absence of chemical contamination [10-13]. The major disadvantages of laser gas nitriding are the high costs and the small output of the method (the energy used for treatment correspond to 1-10% from the electrical energy consumed by laser). These limit its appliance only in the field of treatments on small surfaces. In the present work, a laser gas nitriding process performed on a Ti-7.5Al (at.%) alloy under a diluted nitrogen environment was carried out in order to investigate the microstructure and the chemical composition of the coating obtained. Identification of the different phases was undertaken in a rigorous manner by using performing characterization techniques such as Electron Backscatter Diffraction technique (EBSD) and Electron Probe MicroAnalysis (EPMA). An important advantage of the EBSD technique is its ability to provide crystallographic information from highly localized regions. Therefore we expect the EPMA+EBSD combination to be an efficient tool for phase identification of the very fine multiphase microstructure observed in laser gas nitriding coatings.
1. Materials and methods
A continuous CO2 laser (type GT 1200, manufactured by IFA Bucharest, Romania) was used for the laser-melting process of the titanium base alloy. The chemical composition of the bulk material (substrate) was chosen to be Ti-7.5Al (at.%) in order to study the influence of Al on the nitrided coating formation. Samples of this titanium alloy with 20mm x 20mm dimensions were mechanically polished up to 0,1μm roughness and then ultrasonically cleaned (GEOSON LD-050) for 10 min in acetone and ethanol respectively and dried in heated air. The treatment consists of a laser irradiation. The samples were moved with various speeds under the laser beam in a horizontal plane. Under the incidence of the laser beam a superficial layer becomes liquid. So, a melted and a resolidified pool is formed where the nitrogen with a 99.9995% purity is fed at a constant flow of 10 l/min. Ranges of parameters such as laser power, laser beam diameter, scanning speed were optimised in order to produce single track of crack-free nitrided surface. Samples were observed both by light microscopy (LEICA DM/RM) and by scanning electron microscopy (SEM JEOL, JSM 6400). Before observation, cross section surfaces were mirror-polished by standard metallographic techniques (using SiC and diamond containing grids) and then etched using a 5%HF-25%HNO3 aqueous solution. The crystalline structure was identified by X-ray diffraction (XRD) at room temperature using a PHILIPS PW 1830/00 (X-ray generator) diffractometer (CuKα1 radiation, 1.5406Å wave-length). In order to perform crystallographic analysis at the micrometer scale, electron backscatter diffraction technique (EBSD, TSL), coupled with the
2

scanning electron microscope (SEM JEOL, JSM 6400) operating at 20 kV, was used. After the specific spots of interest had been selected, the microscope was switched to the spot mode in order to acquire the EBSD Kikuchi pattern. The identification of crystal planes appearing in the pattern was performed with the help of the TSL software. EBSD pattern from (001) Si single crystal mounted directly on the sample surface was used for the calibration. Chemical quantitative analysis was achieved by EPMA (Castaing Electron Probe MicroAnalysis, wavelength dispersive spectrometry) with a CAMECA SX50 microprobe, which quantified the major elements (Ti, Al, N). The X-ray emission lines used were Ti Kα (PET crystal analyzer), Al Kα (TAP crystal analyzer) and N Kα (PC1 crystal analyzer). The EPMA results were accurate to within 0.5 at.% for Ti and Al and 1 at.% for N.
2. Results
2.1. Microstructure The Ti-7.5Al (at.%) titanium-based alloy was nitrided in an ambient atmosphere under a nitrogen constant flow, therefore in a dilute nitrogen environment. The cross section taken with respect to the laser track reveals the heterogeneity of the melted pool as shown on the different micrographs (obtained by light microscopy and by SEM) in Figure 1. In Fig. 1a, an enlarged section of a complete layer is presented. The laser gas coating thickness is about 500 μm. In Fig. 1b-f, different regions are shown. Three characteristic zones of the microstructure are presented in the laser nitrided layer. From the surface (zone I, corresponding to the SEM micrograph in Fig. 1b), a thin continuous layer is evident and just below, a dendritic region characterized by a nearly perpendicular growth of dendrites on the surface is observed. Deeper in the melted and resolidified pool (zone II, Fig. 1c-e) a mixture of dendrites and “coarse” needles (about 3-5 μm thick) included in a very thin (less than 1 μm thick) needle-like matrix is observed. In this region the dendrites and coarse needles have an orientation in majority imposed by the turbulent flow created by the interaction between the nitrogen flow and the melted pool. These phases formed by solidification are swept away by the convective flow from the edge of melted zone to the interior. On the other hand, in the delimited regions, the very fine needles that form the matrix present a preferred orientation that is shows in Fig. 1c-e. The “coarse” needles distinct themselves from the fine needles of the matrix by the parallel edges and the slight faceting at the end, whereas the edges of the fine needles have sharp tips. Between the resolidified region and the base material a thermally influenced zone is present (zone III). The microstructure of the latter zone (SEM micrograph in Fig. 1f) is constituted of several groups of thin needles which are oriented in different directions. The X-ray diffraction pattern of Ti-7.5Al (at.%) alloy surface after laser gas nitriding is shown in Figure 2. This pattern reveals the presence of TiN, α-Ti and TiO2 phases. The study of this X-ray spectrum indicates that the lattice parameters of these phases are affected due to solubility variations caused by the laser gas nitriding treatment. Solubility changes for every phase do not appear homogeneous, consequently it is not found a general trend. In order to specify the crystallographic nature of each phase observed in the nitriding layer (dendrite, coarse needle, fine needle, thermally influenced zone), electron backscattered diffraction was used as local analysis technique.
2.2 EBSD analysis
Identification of different phases in the mixture was investigated by indexation of the backscatter Kikuchi diffraction patterns related to the different morphologies observed: dendrite, “coarse” needle, fine needle (matrix) and needle phase in heat influenced zone. Indexation of our experimental patterns were matched with theoretical EBSD patterns in the database containing the different possible phases such as, �-Ti, �-Ti, TiN, Ti2N, TiN0.3, TiO2… cited in literature [12-15]. Although the EBSD technique is widely recognized as a powerful method for the identification of phases (at the sub-micrometer
3

scale), one essential condition is that the diffraction patterns obtained have to be clear and indexable. The technique is highly sensitive to preparation sample, surface quality, residual stress, defaults…that are not always possible to optimize, particularly in the present case. The nature of the phase is also an important parameter since ceramic (TiN for example) by comparison with metal (Ti) possesses higher electrical resistivity. This can result in image instabilities, disproportionate brightness, bad contrast… However, a rather good set of indexable EBSD patterns was obtained on the different zones (Figure 1) and examples are presented in Figure 3. The backscatter Kikuchi diffraction pattern shown in Fig. 3a is representative of the crystallography of the dendritic phases observed in zone I. The
crystallographic symmetry presents a fourth fold axis (the [ ] pole) and a third fold axis (the [001 111 ] pole), which is characteristic of a cubic symmetry. This pattern was successfully matched to the theoretical pattern of the TiN face-centered-cubic (fcc) phase (some poles are indicated in white). In zone II, a typical EBSD pattern realized on the “fine” needle-like phase of matrix is presented in Fig. 3b. This pattern indicates a hexagonal close-packed symmetry (hcp) characterized by the presence of a sixth fold axis [ 0001 ] in accordance with the theoretical �-Ti crystallographic elementary cell. The Kikuchi diffraction pattern characteristic of “coarse” needles fixed in the matrix is shows in Fig. 3c. As observed in the case of the dendrite morphology in zone I, the pattern shows a fourth fold axis [ ]
and a third fold axis [
001111 ]. This combination of symmetry elements is characteristic of a cubic cell
and a good fitting is also obtained when we used the TiN compound as indexation pattern. In zone III, fine needle like phases present in heat influenced show EBSD patterns containing a sixth fold axis [ ] (as presented in Fig. 3d), therefore theses needles have a hexagonal close-packed elementary cell, which was well indexed by the �-Ti hcp crystallographic structure. 0001
2.3. Chemical composition by EPMA
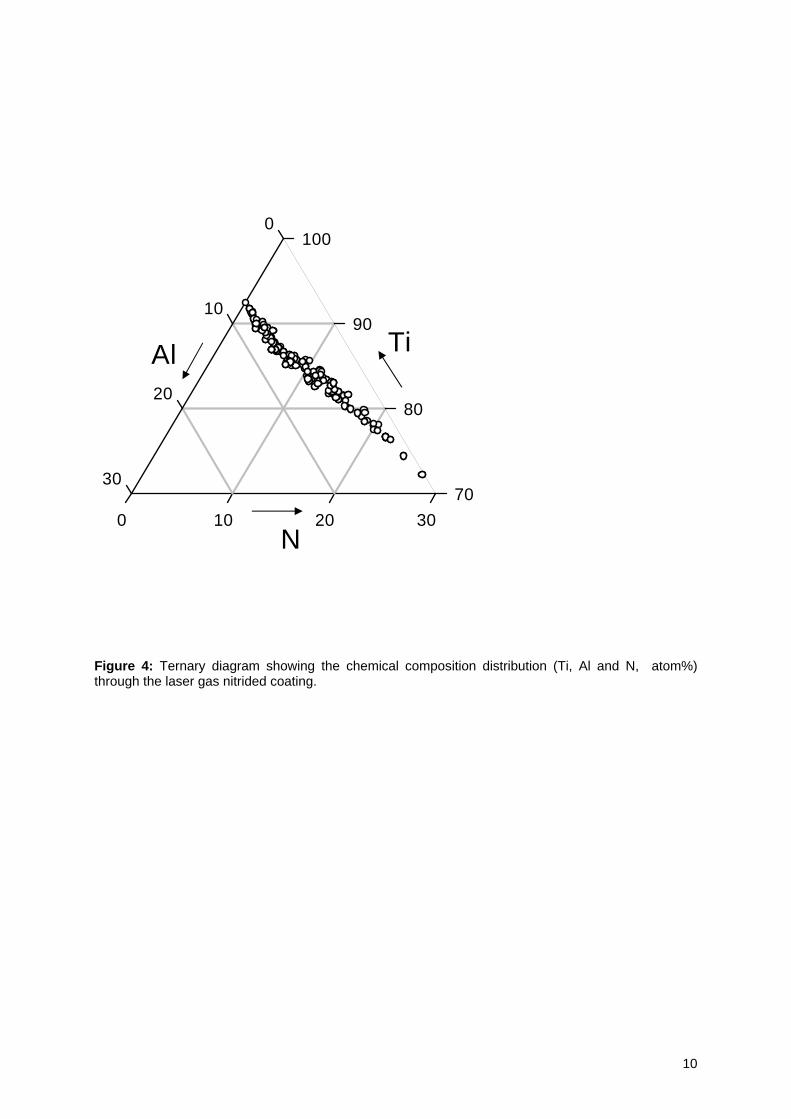
By use of EPMA, we followed the distribution of the metallic and non-metallic elements, i.e. titanium, aluminum and nitrogen and several profiles of analysis (length of about 100 �m) were carried out in different regions of the laser gas nitrided coating. All values measured (about 400) were reported in the ternary diagram (Gibbs representation in the Ti-rich corner) in Figure 4. It can be noticed that oxygen only appears at the surface (inside a very thin layer) and is not present in the nitrided layer. The EPMA system can be used in mapping mode, which allows a representative distribution of the chemical elements. We have selected for analysis two representative regions: a dendritic region at the layer surface (zone I) and a characteristic region showing a mixed microstructure deeper into the layer (zone II). These two regions are still visible in brighter in the image (see Fig. 1a) because of the beam irradiation that has occurred during mapping. The corresponding X-ray maps of the Al and N chemical elements distribution in the investigated zones are presented in Figure 5. Fig. 5a represents the chemical contrast of the aluminum element in zone I, while in Fig. 5b, the nitrogen concentration is shown in the same zone (brighter is the zone, higher is the element concentration). Fig. 5c. and Fig. 5d. represent respectively the Al concentration and the N concentration in zone II. From these two chemical contrast representations, it can be recognized the dendritic morphology in zone I, and the “coarse” needles in zone II, fitting very well with our observation previously done by light and SEM microscopy (Figure 1). In zone II, we have realized an analysis profile in the mixed region (the horizontal line in Fig. 5c and 5d), representative for the microstructure of melted and resolidified pool. The Ti, Al and N elements concentration profiles along this horizontal line are presented in the Figure 6.
4

3. Discussion
The laser gas nitrided coating shows a complex microstructure. Although the structure appears distinctly, its interpretation in terms of phases and their grain morphology is not simple. The difficulty consists in the identification of each phase with different morphology present in the resolidified layer. Although 4 different morphologies are observed (dendrites, “coarse” needles, “fine” needles in matrix, heat affected zone), the X-ray diffraction pattern (Figure 2) indicates the presence of two phases in the nitrided layer: α-Ti and TiN (TiO2 appears as a very thin layer detected on the surface). A variation of lattice parameters is observed (by comparison with the corresponding “pure” phases) and results of a combined effect of the tensile residual stress, owing to the rapid cooling in the laser processing, and the nitrogen and aluminum concentration changes. EBSD investigation confirms that the nitrided coating is only composed of two different crystallographic phases. Patterns realized both from the dendritic region (zone I) and from the “coarse” needles (zone II) have shown a cubic crystallographic symmetry associated with the fcc-TiN phase (Fig. 3a and 3c). The thin needles present into the matrix (zone II) and into the heat affected region (zone III) have a hexagonal close-packed symmetry. Both were well indexed with the α-Ti phase (Fig. 3b and 3d). In zone II, it can be observed that the fine needles showed preferred directions in the matrix (Fig. 3d). This is due to the fact that the hexagonal phase results from the martensitic transformation, which has occurred during high rate solidification of the melted pool. The volume of the sample is very large comparatively with the laser melted layer. For this reason, the cooling rate is very rapid and the martensitic transformation into α’-Ti is favored. The α’-Ti martensitic phase in laser surface-melted microstructure is reported in literature [13]. In literature, many studies concerning the laser nitriding titanium alloys are available [11-15]. Unfortunately, a very limited number of these have tempted to elucidate the influence of the alloying elements on the microstructure and a lack of chemical composition measurements of the nitrided layer still remains. In this study, we present quantitative analysis concerning the concentration of the nitrogen and the alloying element (Al) by electron probe microanalysis (EPMA). A continuous set of chemical compositions from Ti92.5Al7.5 to Ti72N28 is observed in the ternary diagram (Figure 4) but it is necessary to take into consideration the EPMA microprobe resolution (the beam size is about 1 μm) to distinguish the single phase domains. The chemical composition of α’-Ti needles in the heat affected zone (near the substrate) was measured to be Ti92.5Al7.5, which corresponds to the nominal composition of the substrate free of nitrogen. The fine α’-Ti needles presents in the resolidified matrix (zone II) present a similar chemical composition but a small amount of nitrogen is detected in this case. The solubility has been evaluated and a maximum value of about 2-3 at.%N was found as shown on the profile in Figure 6. The chemical distribution maps in Figure 5 show that the α’-Ti matrix is present in the entire layer from the heat affected zone to the surface (lower nitrogen content regions in dark in Fig. 5b and Fig. 5d). In Fig. 5b, the brightest zone, i.e. the richest nitrogen concentration zone, corresponds to the dendritic morphology, which is not surprising since the fcc-TiN compound is detected both by X-ray diffraction and EBSD analysis. It is also interesting to observe that a similar chemical contrast is obtained with the “coarse” needle-like morphology phases in zone II (Fig. 5a and 5c). Thus, it can be conclude that the dendrite and the “coarse” needles are identical phases since very similar EBSD patterns were obtained both well indexed with the TiN theoretical Kikuchi pattern. We suppose that their difference in morphology can be explained by the fact that the dendrite and coarse needles phases have a disposition in the layer imposed by the turbulent flow created by the nitrogen flux introduced in the Ti-7.5Al (at.%) melted surface. The chemical composition of the “coarse” needle-like phase is indicated on the concentration profile in Figure 6 (corresponding to the line in Fig. 5c and 5d). It is shown that the solubility of Al in TiN can be very important. From the profile, a value as high as 4 at.% Al is measured (thickness of “coarse” needles are sufficient to propose a correct evaluation by EPMA), which is unusual since the Al solubility in fcc-TiN is very low (negligible) at the equilibrium state. On the other hand, it can be noticed that when the Al concentration reaches 4at.%, the nitrogen content drops as low as 17-18 at.% (and may be 13 at.% according to the profile concentration in Figure 6). This large drop of nitrogen can be explained by the fact that the nitrogen atomic size is much more lower than the Al one. Consequently, a small increase of Al causes a large decrease of nitrogen in order to maintain the fcc crystallographic structure. Sub-stoechiometric fcc-TiN compound is often mentioned in literature but in this study we have demonstrated that the solubility of Al in TiN is not negligible and a typical range of concentration from Ti72N28 (which correspond to the composition in equilibrium with α-Ti in the binary diagram at high temperature) to Ti79N17Al4 or Ti83N13Al4 (metastable composition obtained by the rapid solification
5

process) can be found in the mixture. “Coarse” needle-like phase was reported to be hexagonal in literature [15]. Our study, by a combined EBSD and EPMA analysis, shows that this phase is rather isostructural with fcc-TiN and the drastic drop in nitrogen concentration, caused by the presence of Al (even in small quantity), can lead to confusion.
Conclusions
In this work, the combination of electron backscattered diffraction (EBSD) and electron probe microanalysis (EPMA) techniques was successfully employed to characterize the complex microstructure of the coating obtained by laser gas nitrided Ti-7.5Al (at.%) alloy. From the results and discussion, the following conclusions were reached: - The microstructure of the coating shows different zones: on the surface, a thin continuous layer of titanium nitride, beneath this thin layer, a TiN dendritic region characterized by a nearly perpendicular growth of dendrites on the surface. Deeper in the melted and resolidified region, a mixture of TiN dendrites and “coarse” needle like phase fixed in a very thin needle like matrix was identified. - Using the Kikuchi backscatter diffraction technique (EBSD) in order to obtain information concerning crystal structures we allowed to make the difference between the “coarse” and “fine” needle-like structures: the “coarse” needles are detected to be isostructural with the fcc-TiN phase, while the “fine” needles phase (matrix) is determined to be the martensite hcp α’-Ti phase. - By electron probe microanalysis (EPMA) technique, the maximum nitrogen solubility in the martensite hcp α’-Ti phase remains low (about 2-3 at.%N, the composition range of this phase in the ternary diagram is situated between Ti92.5Al7.5 and Ti90Al7.5N2.5), while in the fcc-TiN “coarse needle” phase, a solubility in aluminum as high as about 4at.%Al is observed. This solubility causes a drastic drop of nitrogen in this phase and a metastable extended domain of composition from Ti72N28 to Ti79N17Al4 (or Ti83N13Al4) is obtained in the ternary diagram.
Acknowledgements The authors of this paper thank Rennes Métropole and Région Bretagne for financial support.
References
Niinomi M. Sci. Tech. Adv. Mater. 2003; 4: 445. Guillemot F, Prima F, Bareille R, Gordin DM, Gloriant T, Porté-Durrieu MC, Ansel D, Baquey C. Med. Biol. Eng. Comput. 2004; 42: 137. Long M, Rack HJ. Biomaterials 1999; 20: 2115. Conner BP, Hutson AL, Chambon L. Wear 2003; 255: 259. Khan MA, Williams RL, Williams DF. Biomaterials 1999; 20: 765. Hübler R. Surf. Coat. Tech. 1999; 116-119: 1111. Tamura Y, Yokohama A, Watari F, Uo M, Kawasaki T. Mater. Trans. 2002; 43: 3043. Raimondi MT, Pietrabissa R. Biomaterials 2000; 21: 907. Scarano A, Piattelli M, Vrespa G, Caputi S, Piattelli A. J. Oral Implant. 2003; 29: 80. Xue L, Islam M. Adv. Perf. Mater. 1997; 4: 25. Ettaqi S, Hays V, Hantzpergue JJ, Saindrenan G, Remy JC. Surf. Coat. Tech. 1998; 100-101: 428. Kloosterman AB, De Hosson JTM. Scripta Metall. Mater. 1995; 33: 567. Selamat MS, Baker TN, Watson LM. J. Mat. Proc. Tech. 2001; 113: 509. Xue L, Islam M, Koul AK, Bibby M, Wallace W. Adv. Perf. Mater. 1997; 4: 389. Hu C, Xin H, Watson LM, Baker T. Acta Mater. 1997; 45: 4311.
6

Figures
Figure 1: Microstructure of the cross-section laser gas nitrided layer. Fig. 1a: general image (light microscopy); Fig. 1b: zone I- perpendicular dendrites on the surface (SEM image); Fig. 1c: SEM image of zone II-mixture of dendrites, “coarse” needles and fine needles (matrix); Fig. 1d: detail of matrix-fine oriented needles in matrix (light microscopy micrograph); Fig. 1e: details (SEM image) of oriented needles in matrix; Fig. 1f: SEM image of the heat influenced zone at interface layer-base material (zone III).
10 μm
Fig. 1d
zone I
zone II
zone III
200 μm
surface Fig. 1a Fig. 1b
surf
ace
10 μm
Fig. 1c
10 μm
10 μm
Fig. 1e
10 μm
Fig. 1f
7

0
2000
20 40 60 80
Figure 2: X-ray diffraction pattern from the laser gas nitrided surface.
100
2θ
Inte
nsity
(a.u
.)
TiO
2(11
0)
αTi(1
00)
αTi(0
02)
αTi(1
01)
TiN
(200
)
αTi(1
02)
TiO
2(22
0)
αTi(1
03)
αTi(1
12)
αTi(0
04)
αTi(1
04)
αTi(1
10)
8

Figure 3: EBSD analysis in different zones (indexation is indicated in white). Fig. 3a: EBSD pattern from the dendrite (zone I). Fig. 3b and 3c: Kikuchi patterns obtained respectively from the “fine” needle (matrix) and the “coarse” needle in zone II. Fig. 3d: EBSD pattern on the heat influenced region (zone III).
9
N0 10 20 30
Ti
70
80
90
100
Al
0
10
20
30
Figure 4: Ternary diagram showing the chemical composition distribution (Ti, Al and N, atom%) through the laser gas nitrided coating.
10

20 μm
20 μm
20 μm
1.4. Fig. 5a :
1.3. Fig. 5d :1.2. Fig. 5c :
1.1. Fig. 5b :
20 μm Figure 5: Chemical contrast maps obtained by EPMA. Fig. 5a and 5b represent respectively the chemical distribution of Al and N in zone I, while in Fig. 5c and 5d, the X-maps of Al and N elements were obtained in zone II (brighter is the zone, higher is the element concentration).
11

12
3.1.1.
0
5
10
15
20
85 95 105 115 125 135
75
80
85
90
95
85 95 105 115 125 135
0 10 20 30 40 50
Ti
AlN
Che
mic
al c
ompo
sitio
n (a
tom
%)
Distance (μm)
Figure 6: EPMA concentration profile of Ti, Al and N elements (atom%).