characterization and controlling of foam and scum
TRANSCRIPT

Research Collection
Doctoral Thesis
Characterization and controlling of foam and scum in activatedsludge systems
Author(s): Hug, Thomas
Publication Date: 2006
Permanent Link: https://doi.org/10.3929/ethz-a-005180592
Rights / License: In Copyright - Non-Commercial Use Permitted
This page was generated automatically upon download from the ETH Zurich Research Collection. For moreinformation please consult the Terms of use.
ETH Library

DISSETHNO. 16506
CHARACTERIZATION AND CONTROLLING OF FOAM
AND SCUM IN ACTIVATED SLUDGE SYSTEMS
A dissertation submitted to the
SWISS FEDERAL INSTITUTE OF TECHNOLOGY ZURICH
for the degree of
Doctor of Technical Sciences
presented by
THOMAS HUG
Dipl. Ing. ETH
born 13 January 1971
citizen of Mosnang (SG)
accepted on the recommendation of
Prof. Dr. Willi Gujer, examiner
Prof. Dr. Hansruedi Siegrist, co-examiner
Prof. Dr. Jifi Wanner, co-examiner
2006


Summary
Introduction
Activated sludge foaming refers to the formation of stable foam, which is a widespread problem in
biological wastewater treatment plants (WWTPs) all over the world. This foam is highly enriched
with floating biomass and covers activated sludge tanks, secondary clarifiers and sometimes also
occurs in anaerobic digesters. It causes severe operating problems, increases maintenance efforts
and may lead to poor effluent quality. It is widely accepted that the formation and stabilization of
these foams require gas bubbles, surface active compounds and hydrophobic particles. Gas bubbles
in the system originate from aeration and mixing or from gas production in denitrification reactors
and anaerobic digesters. Surfactants enter the plant by the wastewater as detergents from house¬
holds or industry but are also produced by bacteria in the activated sludge. The hydrophobic parti¬cles are assumed to be bacteria with a hydrophobic cell surface and hydrophobic molecules ad¬
sorbed to the floes.
Decades of research could not fully clarify the key processes behind this phenomenon. The com¬
plexity of the topic and the systems, combined with inaccurate measuring methods, imprecise defi¬
nitions of terms and confusion of phenomena led to plenty of partially contradicting descriptionsand hypotheses.
Goal of thesis
The goal of this thesis is to systematically identify and investigate factors that play a crucial role in
activated sludge foaming. This includes studying the growth of suspected foam producing bacteria
as well as elucidating factors that control the foaming potential of activated sludge. The gained in¬
sights shall support the validation or falsification of common hypotheses in order to suggest future
research directions and to point out promising strategies to prevent or control foaming in WWTPs.
m

Characterization and Controllingof Foam and Scum in Activated Sludge Systems
Methodology
The research presented in this thesis is based on the identification of three major sub-processes of
activated sludge foaming: (1) The development of sludge that is able to produce foam, (2) the ac¬
tual foam formation and stabilization, and (3) the foam accumulation and distribution in the plant.
Therefore, two parallel pilot-scale plants were operated. They were fed with the same wastewater
as a full-scale WWTP in which foaming occurs, but operated under strict control of temperature,
dissolved oxygen concentration and sludge retention time. Additionally, several full and pilot-scaleWWTPs were monitored in order to find correlations among the identified sub-processes.
To enable these investigations, suitable methods had to be developed: A novel method was devel¬
oped to quantify the abundance of specific bacteria in activated sludge based on fluorescence in-
situ hybridization (FISH). To determine the foaming potential of activated sludge under reproduci¬ble laboratory conditions, a protocol was developed combining two different test procedures and
including the separation ofthe solid and liquid fraction of the sludge.
Results
A preliminary study revealed distinct seasonal variations of the bacteria "Microthrix parvicella"
(Microthrix) and different types of nocardioform actinomycetes, organisms that are generally as¬
sumed to play a crucial role in the formation and stabilization of stable foams. Microthrix was
dominating in winter and spring, nocardioform actinomycetes in summer and autumn. Surprisingly,there was no unambiguous correlation of the foam coverage of the reactors with the abundance of
any of these organisms.
A mathematical model was developed, describing the observed seasonal variation of Microthrix
abundance. It is based on the hypothesis that low temperature inhibits lipid uptake of non-
specialized heterotrophic bacteria and therefore favors Microthrix which is a specialized lipid con¬
sumer. This model is not proposed to be used for prediction; it is rather a valuable research tool to
identify the relevant mechanisms allowing Microthrix to successfully compete in activated sludge
systems.
In the pilot-scale plants, nocardioform actinomycetes were not able to remain in the system at a
sludge retention time of 10 days and a temperature of 10 or 20°C. Also Microthrix could hardly
grow under these conditions. It was surprising, however, that Microthrix suddenly significantlyincreased during a period of 20°C. This was possibly enabled by incomplete denitrification. Also
unexpected was that Microthrix was not found to be responsible for poor floe structure or foamingin the pilot plants. Both phenomena were rather correlated with the operating conditions.
The foaming potential was demonstrated to be controlled by the solids concentration and properties.It was not correlated with the foam coverage of the reactors, the floe structure and surprisingly not
with the abundance ofthe suspected foam producing bacteria Microthrix. Furthermore, it is particu¬
larly interesting that foam samples and sludge from membrane bioreactors (MBRs) exhibited a
considerably higher foaming potential than mixed liquor from conventional plants.
Considering the above mentioned three major sub-processes of foaming, it is remarkable that no
correlations were found among the abundance of the identified bacteria, the foaming potential and
the foam coverage of the activated sludge tanks.
IV

Summary
Conclusions
Particularly important findings of this thesis are the fact that widespread assumptions about causes
of activated sludge foaming, particularly about the role of Microthrix, were not valid in the investi¬
gated systems, as well as the key role ofthe surface properties of the sludge solids for foaming.
To prevent or control foaming in WWTPs, the results of this thesis strongly support the followingrecommendations :
• Continuously removing the foam selectively eliminated the floes that are able to float.
• Chemical additives to improve sedimentation, particularly poly-electrolytes, are suitable as
emergency means to reduce the foaming potential of the sludge.
• It seems that nutrient removal WWTPs provide ideal conditions for foaming. Therefore, one
should also focus on the implementation of measures to increase the foam tolerance of existingand future plants.
For future research the following conclusions can be drawn:
• A detailed classification system of different types of foam should be developed.
• The dynamics ofthe microbial population and the foaming intensity have to be considered.
• Foaming should be understood as series of sub-processes which are to be distinguished.
• A promising direction towards the understanding of foaming will be to study the reasons for
the increased foaming potential in foam and MBR samples. A starting point could be the hy¬
pothesis of accumulated colloidal substances from microbial activity and biomass decay.
• Last but not least, communication and cooperation among experts from different fields should
be improved. Promising disciplines are such that intend to prevent foam, e.g. biotechnologywhere foaming is a common nuisance, or technologies were stable foams are produced, such as
mineral flotation and food production.
v

Characterization and Controllingof Foam and Scum in Activated Sludge Systems

Zusammenfassung
Einleitung
Die Bildung von stabilem Schaum stellt eine verbreitete Betriebsstörung in Abwasserreinigungsan¬
lagen (ARAs) auf der ganzen Welt dar. Dabei bildet sich ein viskoser, stark mit Biomasse angerei¬cherter Schaum, welcher Belebungsbecken und Nachklärbecken bedeckt und manchmal auf in
Faulbehältern auftritt. Dieser Schaum verursacht erhebliche Betriebsbeeinträchtigungen, führt zu
mehr Unterhaltsarbeiten und kann die Gewässer verunreinigen. Es wird allgemein angenommen,
dass für die Bildung solcher Schäume Gasblasen, oberflächenaktive Stoffe und hydrophobe Parti¬
kel notwendig sind. Gasblasen stammen aus der Belüftung und Schlammumwälzung. Oberflächen¬
aktive Stoffe gelangen in die ARA als Detergenzien aus Haushalten und Industrie, werden aber
auch zu einem grossen Teil von den Mikroorganismen im Belebtschlamm gebildet. HydrophobePartikel sind vermutlich Mikroorganismen mit hydrophoben Zellwänden sowie an die flocken ad¬
sorbierte Stoffe.
Trotz jahrzehntelanger Forschung konnten die entscheidenden Mechanismen der Schaumbildung in
ARAs bis heute nicht eindeutig eruiert werden. Die Komplexität der Prozesse und Systeme sowie
ungenaue Messmethoden und unpräzise Definitionen von Begriffen und Phänomenen führten zu
einer Vielzahl von teilweise widersprüchlichen Beobachtungen und Hypothesen.
Ziel der Dissertation
Das Ziel dieser Dissertation ist eine systematische Identifizierung und Untersuchung von Faktoren,
welche in der Schaumbildung eine wichtige Rolle spielen. Dies beinhaltet das Wachstum von Bak¬
terien, von welchen man vermutet, dass sie die Schaumbildung fördern, ebenso wie die Bestim¬
mung von Faktoren, welche das Schaumbildungsvermögen steuern. Daraus gewonnene Erkenntnis¬
se sollen aufzeigen, welche verbreiteten Annahmen für die untersuchten Systeme gültig sind,
Folgerungen für zukünftige Forschungsanstrengungen erlauben und Ansatzpunkte zur Schaumbe¬
kämpfung bieten.
vu

Characterization and Controllingof Foam and Scum in Activated Sludge Systems
Methodik
Die Forschung im Rahmen dieser Dissertation basiert auf der Unterteilung der Schaumbildung in
drei Teilprozesse: (1) Die Bildung von Belebtschlamm, welcher fähig ist Schaum zu bilden, (2) die
eigentliche Schaumbildung und -Stabilisierung, sowie (3) die Anreicherung und Verteilung des
Schaums in der Anlage.
Dazu wurden zwei Kläranlagen im Pilotmassstab betrieben. Diese wurden mit dem gleichen Ab¬
wasser beschickt wie eine grosstechnische ARA, in welcher Schaum auftritt, aber unter strikter
Kontrolle von Temperatur, Sauerstoffkonzentration und Schlammalter betrieben. Zusätzlich wur¬
den mehrere grosstechnische ARAs und Pilotanlagen untersucht um Korrelationen zwischen den
identifizierten Teilprozessen zu finden.
Um diese Untersuchungen durchzuführen, mussten geeignete Methoden entwickelt werden:
Einerseits wurde eine Methode entwickelt, um Bakterien im Belebtschlamm zu quantifizieren,basierend auf Fluoreszenz in-situ Hybridisierung (FISH). Andererseits wurde ein Verfahren zur
Bestimmung des Schaumbildungsvermögens von Belebtschlammproben unter reproduzierbaren
Laborbedingungen entwickelt. Dieses basiert auf zwei unterschiedlichen Belüftungs-Prinzipiensowie auf der Auftrennung der Schlammproben in Fest- und Flüssigphase.
Resultate
Eine Voruntersuchung zeigte ausgeprägte saisonale Variationen der Bakterien „Microthrix parvi-cella" (Microthrix) und verschiedener Typen von nocardioformen Actinomyceten, Mikroorganis¬
men, welche allgemein für die Schaumbildung verantwortlich gemacht werden. Microthrix herrsch¬
te im Winter und Frühling vor, nocardioforme Actinomyceten im Sommer und Herbst.
Überraschenderweise korrelierte die Schaumbedeckung der Becken nicht mit der Häufigkeit dieser
Organismen.
Ein mathematisches Modell wurde formuliert, welches die saisonalen Variationen von Microthrix
abbildet. Es basiert auf der Annahme, dass bei tiefen Temperaturen die nicht-spezialisierten hete-
rotrophen Bakterien in der Aufnahme von hydrophoben Stoffen behindert sind, und dadurch der
Spezialist Microthrix indirekt gefördert wird. Dieses Modell wurde als Forschungstool entwickelt
um die Mechanismen zu identifizieren, welche Microthrix erlauben sich im Belebtschlamm zu be¬
haupten; es ist daher nicht für Prognosen einzusetzen.
In den Pilotanlagen konnten sich die nocardioforme Actinomyceten nicht halten bei einem
Schlammalter von 10 Tagen und einer Temperatur von 10 oder 20°C. Auch Microthrix war nur
knapp in der Lage unter diesen Bedingungen zu wachsen. Umso erstaunlicher ist die Tatsache, dass
sich Microthrix in einer Phase mit 20°C plötzlich stark vermehrte. Möglicherweise wurde dies er¬
möglicht durch eine unvollständige Denitrifikation. Ebenso unerwartet war, dass Microthrix nicht
für eine Verschlechterung der Flockenstruktur oder für die Schaumbildung in den Pilotanlagen ver¬
antwortlich gemacht werden konnte; vielmehr konnten unterschiedliche Betriebsbedingungen als
Ursachen identifiziert werden.
Das Schaumbildungsvermögen in den untersuchten Pilotanlagen und grosstechnischen ARAs war
deutlich bestimmt durch die Konzentration und die Oberflächeneigenschaften der Feststoff-
Fraktion im Belebtschlamm. Es war nicht korreliert mit der Schaumbedeckung auf den Belebungs¬
becken, der Flockenstruktur und erstaunlicherweise auch nicht mit Microthrix, welches häufig für
die Schaumbildung verantwortlich gemacht wird. Besonders interessant ist die Beobachtung, dass
vni
Zusammenfassung
Schaumproben und Schlamm aus Membran-Bioreaktoren (MBRs) ein deutlich höheres Schaumbil¬
dungspotenzial aufweisen als Schlammproben aus konventionellen Anlagen.
Betrachtet man die drei oben genannten Teilprozesse der Schaumbildung, so ist es bemerkenswert,
dass kein Zusammenhang zwischen dem Auftreten der beobachteten Mikroorganismen, dem
Schaumbildungsvermögen und der Schaumbedeckung der Becken gefunden werden konnte.
Schlussfolgerungen
Als wichtige Erkenntnisse dieser Dissertation können folgende Aussagen getroffen werden:
• Weit verbreitete Annahmen über die Mechanismen der Schaumbildung, insbesondere was die
Rolle von Microthrix betrifft, waren in den untersuchten Systemen nicht gültig.
• Unbekannte Oberflächeneigenschaften der Belebtschlammflocken spielen eine dominante Rol¬
le in der Schaumbildung.
Für die Schaumbekämpfung bekräftigen die Resultate dieser Arbeit die folgenden Empfehlungen:
• Kontinuierliches Abziehen von Schaum entfernt selektiv die flotierberen Flocken.
• Chemische Zusatzstoffe zur Verbesserung der Sedimentation, insbesondere Polyelektrolyte,können das Schaumbildungsvermögen reduzieren und somit für den kurzfristigen Notfallein¬
satz geeignet.
• Da man in näherer Zukunft mit Schaum in ARAs leben muss, sollten vermehrt Massnahmen
vorgesehen werden, um bestehende und zukünftige Anlagen weniger anfällig für die Auswir¬
kungen von Schaum zu machen.
Für die zukünftige Forschung können aus dieser Dissertation folgende Schlüsse gezogen werden:
• Eine detaillierte Klassifikation verschiedener Schaumtypen sollte erarbeitet werden.
• Die ausgeprägte Dynamik der Schaumbildung sowie der Zusammensetzung der mikrobiellen
Population muss unbedingt berücksichtigt werden.
• Die Schaumbildung in ARAs ist eine Serie von Teilprozessen, welche in allen Untersuchungenstrikt unterschieden werden sollten.
• Um das Verständnis der massgeblichen Prozesse der Schaumbildung zu verbessern, dürfte es
vielversprechend sein, die Ursachen des erhöhten Schaumbildungsvermögens von Schaumpro¬ben und MBR-Schlamm zu identifizieren. Die Hypothese, dass in diesen Systemen angerei¬cherte kolloidale mikrobielle Produkte eine Rollenspielen, stellt einen ersten Ansatz dar.
• Nicht zuletzt sollte der Austausch und die Zusammenarbeit mit anderen Forschungsfeldern in¬
tensiviert werden. Besonders interessant sind dabei Disziplinen, die Schaum zu bekämpfen ver¬
suchen, z. B. Biotechnologie, oder Technologien, welche stabilen Schaum erzeugen, z.B. Le¬
bensmittetechnologie oder Flotation in der Bergbauindustrie.
ix

Characterization and Controllingof Foam and Scum in Activated Sludge Systems
Acknowledgements
Many people have contributed to this PhD thesis with their work, advice or encouragement.
First of all, I would like to thank my advisors Willi Gujer and Hansruedi Siegrist who gave me the
opportunity to write this dissertation. They provided me the freedom to satisfy my scientific curios¬
ity and supported my ideas and plans. I am thankful that they were free with their time whenever I
needed support, for their critical remarks and helpful suggestions as well as for their full confidence
in me and my work. I am also grateful to lifi Wanner for reviewing the thesis and acting as my co-
examiner.
Thanks are due to several experts from outside Eawag, particularly to Linda Blackall, Hilde Lem-
mer, Lisa Müller and Michi Wagner, for their valuable inputs and stimulating discussions.
The microbiology department at Eawag allowed me to use their infrastructure to perform the FISH
analyses. I am particularly thankful to Konrad Egli and Christoph Werlen for their support.
I would not have been able to operate the pilot plant and to analyze the large number of sampleswithout students who contributed to this thesis in the frame of their internships or diploma theses. I
am grateful to Matthias Benz, Robert Downie, Elke Hinz, lustyna Okolowicz, Gökhan Türker and
Mandy Ziranke.
A big part of the investigations was performed at two full-scale wastewater treatment plants. I
whish to thank the WWTP-Kloten-Opfikon, its manager Christoph Liebi and all staff members for
allowing me to operate my pilot plant at their ground, to use their lab and workshop and for the
many and diverse support. I am also grateful to the WWTP Thunersee, particularly Adrian
Baumann and Gabi Eugster, for their analyses. I would like to thank all staff members from both
plants for the willingness to support my project and for the many interesting discussions.
My colleagues at the Environmental Engineering and Urban Water Management departments of
Eawag played an important role towards the successful completion of this dissertation. They pro¬
vided me an enjoyable and very stimulating working atmosphere, sharing and criticizing research
ideas, reviewing drafts of papers and having amusing and often fruitful discussions during coffee
and lunch breaks or while drinking an after work beer. My colleagues from the office F41 deserve
special mention: Thank you Stefan Binggeli, Stefano Gianello, Kathrin Hügel, Doris lermann,
Michèle Steiner, and Silvana Veiten for the good time we spent laughing, silently working and se¬
riously discussing.
Last but not least, I would like to thank my wife Sibylle for tolerantly accepting the many long eve¬
nings I spent in the office or the lab.
At the end, I apologize to all those who have made any kind of contribution to this work but whom
I forgot to mention above. Thank you all.
XI

Characterization and Controllingof Foam and Scum in Activated Sludge Systems

Content
Summary iii
Zusammenfassung vii
Acknowledgements xi
Content xiii
Chapter 1
Introduction 1
1 1 Foam and scum m activated sludge systems 1
1 2 Types of foam 3
1 3 Problems caused by foaming 3
1 4 Theory and hypotheses about foam formation and stabilization 4
1 5 Current strategies to control foaming in WWTPs 6
1 6 Previous research 7
1 7 Challenges and causes of confusion 7
18 Goal of this thesis 9
19 Research approach 10
1 10 Outline of the thesis 11
Chapter 2
Rapid Quantification of Bacteria in Activated Sludge usingFluorescence In Situ Hybridization and Epifluorescence Microscopy 13
Chapter 3
Dynamics of Population and Scumming on a
full-scale Wastewater Treatment Plant in Switzerland 31
Chapter 4
Unexpected Growth of "Microthrix parvicella" and
no Correlation with Floe Structure and Foaming in a Pilot-Scale Activated Sludge Plant 39
Chapter 5
Modeling Seasonal Dynamics of uMicrothrix parvicella''' 49
Chapter 6
The Foaming Potential of Activated Sludge 57
Chapter 7
Conclusions 69
7 1 Products of this thesis 69
7 2 Conclusions regarding foam control strategies 70
7 3 Recommendations for further research 71
References 73
Curriculum Vitae 79
xin

Characterization and Controllingof Foam and Scum in Activated Sludge Systems
XIV

Chapter 1
Introduction
1.1 Foam and scum in activated sludge systems
Activated sludge foaming stands for the formation of stable foam in wastewater treatment plants
(WWTPs) covering activated sludge tanks and secondary clarifiers, and sometimes occurring in an¬
aerobic digesters. It causes serious operating problems, increases maintenance and may lead to
poor effluent quality. The phenomenon was first reported 1969 (Anonymous, 1969) and has be¬
come wide-spread all over the world (Pitt and lenkins, 1990; Seviour et al, 1990; Pujol et al, 1991;
Eikelboom et al, 1998; Wanner et al, 1998), particularly in biological nutrient removal plants.Also membrane bio-reactors (MBRs), a novel technology for wastewater treatment, are often af¬
fected.
Before describing the goal and approach of this thesis, it is important to provide an overview over
the nature of foam in WWTPs and about hypotheses of its formation as well as to discuss the spe¬
cific challenges ofthis research field and causes of confusion that exist in literature.
Due to the large number of articles, books and reports from decades of research on activated sludge
foaming, this introductory chapter cannot provide a complete literature review. Good reference
books on sludge separation problems (bulking and foaming) are Wanner (1994) and lenkins et al
(2004) that are written from the engineers' point of view, as well as Seviour and Blackall (1999),
focusing more on the microbiology. Recently, Tandoi et al (2006) published a reference book on
sludge separation problems including experience from many countries. Lemmer et al (2000) wrote
a recommendable review paper about foam producing bacteria, discussing their growth as well as
hypothesized foam forming mechanisms. Martins et al (2004) presents and discusses the knowl¬
edge about filamentous bacteria in general, which includes also suspected foam forming bacteria,
while Rossetti et al (2005) summarizes what is known about the growth of the suspected foam
forming bacterium Microthrix.
1

Characterization and Controllingof Foam and Scum in Activated Sludge Systems
a) foam on aeration basin (bubble size about 5 cm)
b) stable layer of dense foam on anoxic and anaerobic reactors
ÈÉIfel
c) foam on secondary clarifier consisting of floating sludge covered bubbles (d=0.5-2.0mm),the color is light brown, but appears white on the picture due to the flashlight
d)J^osewhheJbamc^si^ng^of bacteria type 1863 e) Microthrix forms a net around a bubble (Gram stain)
Figure 1-1: Appearance of biological foams in activated sludge systems (photos by T. Hug, photo d byC. Liebi, WWTP Kloten-Opfikon)
2

Chapter 1
Introduction
1.2 Types of foam
The biological foams investigated in this thesis are viscous and highly enriched with floated bio-
mass. They exhibit very different appearance as shown in Figure 1-1: In the aeration basin, the
foam usually consists of relatively large bubbles covered with sludge (bubbles size 1-10 cm, Figure
1-la), while in anoxic or anaerobic reactors or on secondary clarifiers stable layers with small bub¬
bles and high solids concentration occur (Figure 1-lb). Foam may be formed by agglomeration of
individual sludge covered bubbles (Figure 1-lc). These foams are often associated with high con¬
centrations of the Gram-positive filamentous bacteria "Microthnx parvicella" (referred to as Mi¬
crothrix in the introduction and conclusions sections of this thesis, chapter 1 and 7) or nocardio¬
form actinomycetes. Sometimes a net of these filamentous bacteria is formed around the bubbles
(Figure 1-le). However, it is not clarified if these particular organisms cause the foam. There exist
also other types of biological foam such as the loose but viscous, surfactant-like foam shown in
Figure 1-ld that contains mainly the Gram-negative filamentous bacterium type 1863 (Eikelboom
and van Buijsen, 1981; Seviour et al, 1997) and occurs in high loaded plants. Furthermore, white
loose foam often arises during plant startup, and in the past intensive non-biological foaming was
caused by non-biodegradable detergents in the wastewater.
Additionally to the confusion of different types of foam, the phenomenon is often confused with
other sludge separation problems, particularly with filamentous bulking, i.e. inhibited sedimenta¬
tion of activated sludge due to excessive growth of filamentous bacteria. Although both phenomena
may occur at the same time and sometimes even the same filamentous bacteria are assumed to be
responsible, they are different phenomena and should be strictly distinguished.
Although there are different appearances of foams, there is no unique classification of these types
and no unambiguous definitions of terms. The term "foam" describes a two-phase system of gas
bubbles in a liquid, "scum" stands for a layer of froth, impurities or other matter on the surface of a
liquid. Although "scum" might be the more correct term, in the literature the phenomenon is mostlycalled "activated sludge foaming". Hence, in this chapter I use the term "foam" for all foam-like
structures in activated sludge systems, including not only white loose surfactant foam, biologicalsurfactant-like foam (Figure 1-ld) and foam with attached biomass on top of aeration basins
(Figure 1-la), but also the stable layer on anaerobic and anoxic reactors (Figure 1-lb) and secon¬
dary clarifiers. The term "foaming" I use for the general phenomenon. Because the branched fila¬
mentous types of nocardioform actinomycetes (by engineers often called "Nocardia" as the most
common species was identified as Nocardia amarae, today re-classified as Gordona amarae) are
often highly enriched in the foam, the phenomenon used to be called "Nocardia foaming" or "no¬
cardioform foaming" (lenkins et al, 2004). Rising sludge on the secondary clarifier is often called
"floating sludge" or "blanket rising" and might be caused by different reasons. It is important to
mention that the terms are not standardized and different people (including researchers from differ¬
ent disciplines and plant operators) might understand different things by the same term.
1.3 Problems caused by foaming
In most affected WWTPs, the occurrence of foam is not only an aesthetical nuisance but causes
serious problems:
Environmental pollution:
• If floating sludge cannot be held back, it considerably increases the effluent solids concentra¬
tion and pollutes the receiving waters.
3
Characterization and Controllingof Foam and Scum in Activated Sludge Systems
Operational problems:
• A considerable fraction of the active biomass can be trapped in thick foam layers and therefore
be excluded from the intended biological processes. This may limit the plant performance and
makes control of solids and sludge retention time (SRT) more difficult.
• Sticky foaming sludge often leads to malfunctioning of electrodes to measure dissolved oxygen
and therefore may seriously affect treatment performance and process stability.
• In winter foam can freeze and possibly damage mechanical equipment.
• Intensive foaming reduces the effectiveness of surface aerators.
• Severe foaming in anaerobic digesters, that often occurs simultaneously to foaming in the acti¬
vated sludge tanks, may significantly reduce the usable reactor volume and therefore lead to se¬
rious sludge disposal problems.
Safety risks:
• Foam may overflow onto walkways, creating slippery areas.
• Aerosols may spread suspected pathogenic bacteria that are accumulated in the foam (Stratton
etal., 1996).
• Severe foaming in anaerobic digesters may block gas pipes.
Nuisance:
• Foaming requires increased cleaning efforts (and therefore increased operating costs).
• In summer, stable foam may putrefy and cause odor problems.
1.4 Theory and hypotheses about foam formation and stabilization
Foam is generally a dispersion of gas bubbles in a liquid (in "solid foams", e.g. Styrofoam or bread,
the liquid has changed into a solid phase after making the dispersion). Foam of air bubbles in water
collapses due to gas diffusion that leads to a growth of large bubbles at the expense of smaller ones
(Ostwald ripening) and by rupturing of the thin water layer (lamellae) around the bubbles due to
drainage by gravity water flow. Surfactants in the liquid are necessary to produce a stable foam;
they reduce the Ostwald effect, lead to a self-stabilizing mechanisms by inducing a liquid flow to¬
wards the lamellae region that is becoming thinner (Marangoni effect), and allow the lamellae to
become thinner before rupturing. Extremely stable foams are stabilized by an insoluble adsorption
layer around the bubbles (e.g. composed of denatured proteins or hydrophobic particles); this pre¬
vents Ostwald ripening, may hinder drainage (due to large particles), and mechanically stabilizes
the bubbles surface (Walstra, 1989).
Stable foams play an important role in different industries, either as nuisance or as intended product.
Many types of foam in biotechnology or food technology are stabilized by proteins and surfactants
(Vardar-Sukan, 1998; Bos and van Vliet, 2001). Closer to foams in activated sludge are those con¬
taining a high solids concentration, although proteins might play an important role, too. In food
technology, foams are often stabilized by a combination of proteins, surfactants and fat globules
(e.g. whipped cream and cake batter Brooker, 1993); ice cream additionally contains ice crystals as
second solid phase (Goff 1997). Another type of solids rich foam is produced in "froth flotation"
in mining industries (Rao, 2004) to separate valuable ore from unwanted rock by adding particularsurfactants to a suspension of grinded mineral in water. Surfactants working as "collector" specifi-
4

Chapter 1
Introduction
cally adsorb to the ore surfaces making them hydrophobic and allowing them to adsorb to the bub¬
bles in the flotation process. Other surfactants ("frother") are added to produce a foam in which the
floated mineral accumulate in order to be removed.
Foam on activated sludge plants consists of high solid concentration. Therefore, based on the above
mentioned theories and technologies, it is widely accepted that the formation of stable foam in acti¬
vated sludge plants requires gas bubbles, surfactants and hydrophobic particles (e.g. lenkins et al,
2004).
Gas bubbles are present in WWTPs as air bubbles in the aerated reactors, as nitrogen gas in the
denitrification reactors and as carbon dioxide and methane in anaerobic digesters.
Surfactants enter WWTPs with the wastewater as detergents from households or industry, but are
also produced by certain bacteria (Desai and Banat, 1997; Lemmer etal, 2000; Pagilla etal, 2002).
It is suggested that increased surfactant loads are able to intensively produce foam that is then sta¬
bilized by hydrophobic floes and cells. This would explain the anecdotal experiences of intensive
foaming starting within a few hours which cannot be explained by a change of the composition of
the microbial population (Wanner, 2000; lenkins etal, 2004; loss, 2004).
Only hydrophobic particles can be floated by air-bubbles (Gochin and Solari, 1983). In foamingactivated sludge systems it has been observed that certain hydrophobic filamentous bacteria, such
as nocardioform actinomycetes or Microthrix are highly enriched in the foam compared to the
mixed liquor. They seem to be selectively floated due to their hydrophobic cell surface. If protrud¬
ing from floes, hydrophobic microorganisms make the floe surface more hydrophobic and probablyincrease their floating ability. Analogously to froth flotation (see above) these organisms might be
the actual "collector" compounds in the system. However, freely dispersed hydrophobic filaments
seem to be more efficient foam producers (lenkins et al, 2004).
The ability to produce surfactants and to increase cell surface hydrophobicity is a strategy of bacte¬
ria to make hydrophobic substrates available and to attach to the air-water interface where the sub¬
strate concentration is considerably higher (Blanchard and Parker, 1977; Dahlbäck et al, 1981;
Kjelleberg and Hermansson, 1984).
The role of the extracellular polymeric substances (EPS) and other large organic molecules origi¬
nating from microbial activity and cell decay is not clarified. These polymers cover the bacteria in
the floes and might therefore define the surface properties of the floes that are critical for foaming.
Critical for severe foaming in a WWTP is the possibility offoam trapping. Trapping and accumula¬
tion in certain parts of the plant lead not only to an increased amount of foam on the reactors but
also provides a partly isolated compartment with increased solids retention time. This enables
slowly growing suspected foam forming bacteria to remain in the plant, collects freely floating sus¬
pended hydrophobic bacteria which otherwise would be washed out of the system and accumulates
colloidal products of microbial activity and cell decay. From the foam layer, a continuous inocula¬
tion of strongly foaming floes into the mixed liquor occurs, increasing the floating ability of the
mixed liquor.
Although the above mentioned hypotheses and experiences suggest that there exists a sound knowl¬
edge on foam formation and stabilization, many important factors influencing activated sludge
foaming are not known or sufficiently studied. Even in the established technology of froth flotation,
mixtures of surfactants often lead to unpredicted effects (Rao, 2004), and controlling of foaming in
biotechnology remains to a great extent an empirical art (Vardar-Sukan, 1998) although these sys¬
tems are better understood than activated sludge in full-scale WWTPs.
5
Characterization and Controllingof Foam and Scum in Activated Sludge Systems
1.5 Current strategies to control foaming in WWTPs
Despite decades of research, no universally reliable strategy to prevent or control foaming in
WWTPs is known. Many approaches have been reported to be successful in some plants but not to
be effectual in others. Since the mechanisms behind foaming are not fully clarified, it is not clear
where to start foam prevention.
Current strategies to prevent or control foaming try (1) to reduce the foaming potential of the
sludge by inhibiting or damaging foam producing bacteria or changing their surface properties, (2)
to control the actual foam formation and stabilization, (3) to limit foam trapping and accumulation,
or (4) to reduce the detrimental consequences on the plant. Some approaches intend to solve the
problem on a long-term basis, others are suitable as emergency measure.
Common control approaches are the following:
• The continuous removal of foam from the surface, after controlled accumulation in one point of
the plant is probably the most successful long-term approach. This does not only keep the prob¬lem small by preventing accumulation, but also selectively removes bacteria that are able to
float.
• A reduction of hydrophobic substances in the wastewater (oil, grease, long chain fatty acids)
which are preferred substrates for nocardioform actinomycetes and Microthrix and increase the
hydrophobicity of certain bacteria can be achieved e.g. by consequent implementation of oil
and grease separation in food processing industries and by banning enzyme addition to grease
separators which increases the load of partially digested fat to the WWTP. Long chain fatty ac¬
ids may also be produced in deposits of sedimented and putrefying sludge in unmixed zones of
the tanks.
• Reducing the sludge retention time (SRT) can wash out slowly growing suspected foam pro¬
ducing bacteria. This is successful to suppress nocardioform actinomycetes or Microthrix, but
nitrifiers will be washed out, too. As the SRT in a stable foam layer is considerably higher than
in the mixed liquor, it has to be removed first to prevent inoculation.
• Reducing the SRT also decreases the solids concentration in the mixed liquor which reduces
the foaming potential.
• Selectors (contact zones) have sometimes been reported to suppress growth of nocardioform
actinomycetes or Microthrix although numerous reports of unsuccessful trials exist, too.
• Treating the return sludge with strong oxidants (e.g. chloride, peroxide) or spraying them on
the foam surface selectively damages filamentous bacteria protruding out of the floes. However,
disadvantageous effects may be turbid effluent, damage of nitrifiers, and production of chlorin¬
ated hydrocarbons.
• Poly-electrolyte alters the floe structure to improve sedimentation but also reduces the foaming
potential of the sludge. Aluminum salts and particularly poly-aluminum often additionally in¬
hibit the growth of suspected foam producing bacteria (Nielsen et al, 2005; Paris et al., 2005).
Because each sludge has different properties, the product composition and dosage has usuallyto be adjusted to the particular sludge.
• Antifoaming agents have not found to be successful as most ofthem were developed for foams
without or with low solids content.
• Water sprays are able to partially collapse certain foams.
6

Chapter 1
Introduction
• Baffles at the effluent of the secondary clarifiers prevent floating sludge from escaping the
plant into the receiving waters.
• In anaerobic digesters, foam formation may be reduced by installing mechanical mixers instead
of the widespread gas mixing. Lowering the liquid level reduces the risk of overflow and
blocking pipes. The foaming potential of the waste sludge can be reduced by thermal treatment
prior to digestion (e.g. Westlund etal, 1998; Barjenbruch and Kopplow, 2003).
1.6 Previous research
Since the first report of the phenomenon (Anonymous, 1969), an enormous number of scientific
articles and reports about the topic have been published, additional to the anecdotal knowledge and
the many unpublished experiences by engineers and plant operators.
Generally, research efforts in connection with activated sludge foaming can be divided into the fol¬
lowing groups:
• Surveys reporting and characterizing the foam phenomena and trying to link the problem with
specific processes and plant designs; often combined with surveys on filamentous bulking (Pitt
and lenkins, 1990; Seviour et al, 1994; Eikelboom et al, 1998; Wanner et al, 1998).
• Identification systems for filamentous bacteria. A widely used classification was developed byEikelboom and van Buijsen (1981). Recently, microbiologists developed valuable tools to iden¬
tify and study bacteria in-situ (summarized by Wilderer etal, 2002).
• Microbiological studies isolating and identifying bacteria from foam and investigating their
growth characteristics, in pure or mixed culture (summarized in Seviour and Blackall, 1999).
• Studies measuring and investigating the actual foaming potential of activated sludge using lab-
scale "foam tests" (summarized in chapter 6 of this thesis, Hug etal, 2006).
• Engineers' and plant operators' efforts to control and prevent excessive foaming problems in
their plants. These include not only scientific studies but also reports of empirical trials or de¬
scriptions of newly developed technical devices. They cover measures such as the use of dif¬
ferent chemical additives, the implementation of selectors to suppress the growth of particular
organisms, or how to remove the foam from the surface.
Interestingly, this large number of publications contains a confusing variety of partially contradict¬
ing findings and hypotheses. Furthermore, many findings were forgotten and investigations were
repeated because of the long period of research but also due to the fact that most research efforts
were not continued due to lack of success and therefore limiting financial resources.
1.7 Challenges and causes of confusion
The following section identifies the challenges of research on activated sludge foaming that leads
to the confusion in the literature.
• Biological foams occurring in different compartments of WWTPs exhibit different appearance
and accordingly may be formed by different mechanisms. However, neither the different phe¬
nomena are clearly classified nor the terms describing different types of foam are defined. This
leads to a confusion of phenomena and terms. Today, different people (including researchers
from different disciplines and plant operators) often understand different things by the same
term.
7
Characterization and Controllingof Foam and Scum in Activated Sludge Systems
• From the beginning of research on activated sludge foaming, it was observed that filamentous
bacteria, often nocardioform actinomycetes or Microthrix were accumulated in the floatingfraction and it was concluded that they must cause the foaming. This hypothesis might be true,
but it has to be noted that only filamentous bacteria could be accurately identified by micro¬
scopic methods in those days; nocardioforms are among the easiest to identify. Because the
mentioned filamentous bacteria often form an actual net around the bubbles (Figure 1-le), it is
widely assumed that this mechanism stabilizes the bubbles in the foam. However, the effec¬
tiveness of froth flotation (Rao, 2004), and the stabilizing effect of oil droplets (Koczo et al,
1991) or milk fat globule in whipped cream (Walstra, 1989; Brooker, 1993) demonstrate that a
filamentous nature of the hydrophobic particles is not necessarily required for stabilization.
Moreover, extracellular polymeric substances (EPS) or generally macromolecules from micro¬
bial activity and cell decay may play an important role in foaming rather then the pure exis¬
tence ofthe mentioned bacteria (Forster, 1996).
• Because activated sludge foaming is often associated with filamentous bacteria, the phenome¬
non is often confused with filamentous bulking, i.e. inhibited sedimentation of activated sludgedue to excessive growth of filamentous bacteria. Although both phenomena may occur at the
same time and sometimes even the same filamentous bacteria are assumed to be responsible,
they are completely different phenomena and should be strictly distinguished.
• The observed foam covering activated sludge tanks and clarifiers in WWTPs is the result of a
series of different processes. The following three major sub-processes were identified in this
thesis (paragraph 1.9 and Figure 1-2): (1) Generation of activated sludge of a certain foaming
potential, (2) the actual foam formation and stabilization and finally (3) the accumulation and
distribution of foam in the plant. Not rigorously distinguishing these sub-processes may be a
major source of confusion in the literature.
• Research of bulking and foaming seems to be considerably more or at least differently chal¬
lenging than the traditional investigation of biological degradation processes: (1) Investigation
of biological degradation processes to remove undesired compounds from the wastewater
(COD degradation, nitrification, nutrient removal) is based on the measurement of those par¬
ticular substances and intermediate products. Often, several different organisms are able to per¬
form these biochemical reactions. Accordingly, mathematical models were developed that are
based on virtual concentrations of groups of organisms, which represent total transformation
activity rather than actual biomass (e.g. ASM models, Henze et al, 2000). (2) In research on
filamentous bulking particular organisms have to be investigated, because the physical occur¬
rence of these filamentous organisms inhibits sludge sedimentation. Moreover, in most cases it
is unknown which substrates these organisms consume under the competition in the activated
sludge. Hence, research on filamentous bacteria needs to identify and quantify the actual bio¬
mass of the specific interesting organisms. (3) Even more challenging is research on foaming.Not only the physical occurrence of foam producing bacteria is critical, but also their surface
properties and surfactant production rate. These properties are furthermore subject to dynamic
changes depending on the environmental conditions (Lemmer et al, 2002; Pagilla et al., 2002).
In contrast to filamentous bulking where it is easily recognizable which organisms inhibit the
sedimentation, it is still not fully clarified which organisms are responsible for foaming. It is
likely that bacteria contributing to foaming by the production of bio-surfactants are different
from those stabilizing the foam due to their hydrophobic cell surface. Moreover, it is not clari¬
fied if the cell surface properties are crucial or if other adsorbed molecules define the relevant
surface characteristics of the floes.
8
Chapter 1
Introduction
• Inaccurate methods are another major factor inhibiting research, increasing the confusion addi¬
tionally to the above mentioned challenges. The uncertainty and limitations were only rarelydiscussed regarding methods to characterize and quantify foam in the plant, to measure the
foaming potential of a particular sludge (Haarhoff and Bezuidenhout, 1999; lenkins et al,
2004), to identify and quantify particular organisms (Daims, 2001 ; Wilderer et al., 2002) and to
characterize the extremely complex surface of activated sludge floes including the analysis of
EPS (Wilén et al, 2003). Due to the inherent uncertainty and variability of these methods, one
has to be careful not to take every statistically significant result as prove for a causal connec¬
tion.
• Another important reason for the observed confusion in literature is the usually undocumented
dynamics of relevant parameters. These are diurnal and seasonal variation of wastewater flow
and composition, environmental and operational conditions, but also changes in the bacterial
population, the sludge surface properties and changes of unknown foaming properties with
time constants between hours and months. Furthermore, each WWTP is unique; even if the
general design is the same, there will be different hydraulic conditions leading to different resi¬
dence time distributions, dead zones with deposits of sedimented and putrefying sludge and the
possibility of foam trapping. To simplify the investigated system many studies were performed
on pure cultures or activated sludge fed with a constant flow of synthetic wastewater. While
this revealed valuable knowledge about bacterial growth or foam formation, it is unclear
whether those mechanisms and organisms are the relevant ones for foaming in full-scale acti¬
vated sludge systems. This is because the wastewater composition and environmental condi¬
tions are not fully known but complex and dynamic, numerous microorganisms are competingand the floe structure is complex and dynamic. Compared to full-scale WWTPs, conditions in
reactors in biotechnology are much better defined. Nevertheless, one successful strategy to
control foaming is not necessarily suitable for a similar process elsewhere and even batch-to-
batch variations occur (Vardar-Sukan, 1998).
1.8 Goal of this thesis
Based on the identified challenges, limitations and confusion (as discussed above, paragraph 1.7),
the goal of this thesis was to systematically identify and investigate factors that play an importantrole in foaming in activated sludge systems. The following questions were addressed:
• Where are gaps in previous research? What are the reasons that the mechanisms behind foam¬
ing are still not fully clarified?
• How can suspected foam producing bacteria be reliably and rapidly quantified?
• How can the foaming potential of particular sludge be quantitatively measured?
• What controls the growth of the suspected foam producing bacteria in a WWTP? What is the
role of the wastewater composition and the operating conditions?
• How is the foaming potential of the activated sludge correlated with the abundance of the sus¬
pected foam producing bacteria Microthrix and nocardioform actinomycetes? Is the foam cov¬
erage on the plant defined by the foaming potential of the sludge?
• What is the role of the solid and liquid fraction on the actual foam formation and stabilization?
• What are promising strategies to control and prevent foaming?
9

Characterization and Controllingof Foam and Scum in Activated Sludge Systems
1.9 Research approach
The approach to tackle these questions consisted of the following parts:
• As discussed in paragraph 1.7, the observed foam on the surface of activated sludge tanks is the
result of a series of sub-processes (Figure 1-2) which were identified to structure the investiga¬tions presented in this thesis: (1) The first step is the generation of mixed liquor of a certain
foaming potential. This includes the production of surface-active compounds and the genera¬
tion of hydrophobic floe surfaces, possibly by bacteria with hydrophobic cell surfaces. This
step is controlled by the wastewater composition, the plant design as well as operational and
environmental conditions. (2) The second step is the actual foam formation and stabilization,
which is influenced by the mixed liquor properties and the gas production and distribution. In
stable foam layers, the population composition and environmental conditions are different from
the mixed liquor. The properties of the foam liquid and solids do not only influence the foam
stability but also affect the foaming potential of the mixed liquor if re-mixed. (3) The last and
possibly most critical sub-process is the distribution of the foam in the plant. The hydraulics,influenced by water flow and aeration pattern, and the possibility of foam trapping eventuallydefine the amount of foam visible on the surface ofthe plant.
• To accurately study these sub-processes, appropriate methods were developed including as¬
sessments ofthe uncertainties oftheir results.
• The studies were based on long-term monitoring of suspected foam producing bacteria, foam¬
ing potential and foam coverage of reactors. Investigations were performed at different pilotand full-scale WWTPs (Table 1-1) with different design, all fed with real wastewater; some of
them were operated in parallel to others allowing a direct comparison.
wssssfy/s- effect
aeration, hydraulics, foam trapping v mass flow, exchange
mixed liquor foam plant
> > >(1) development of (2) foam production (3) distribution of
foaming sludge (2a)foam formation foam in the plant(la) surfactants (2b) foam stabilization
(lb) hydrophobicfloe surface
Figure 1-2: The observed foam in WWTPs is the result of many and diverse interactions which can be struc¬
tured into three major sub-processes: (1) growth and development of foaming sludge, (2) foam formation and
stabilization, (3) distribution of foam in the plant.
Chapter 1
Introduction
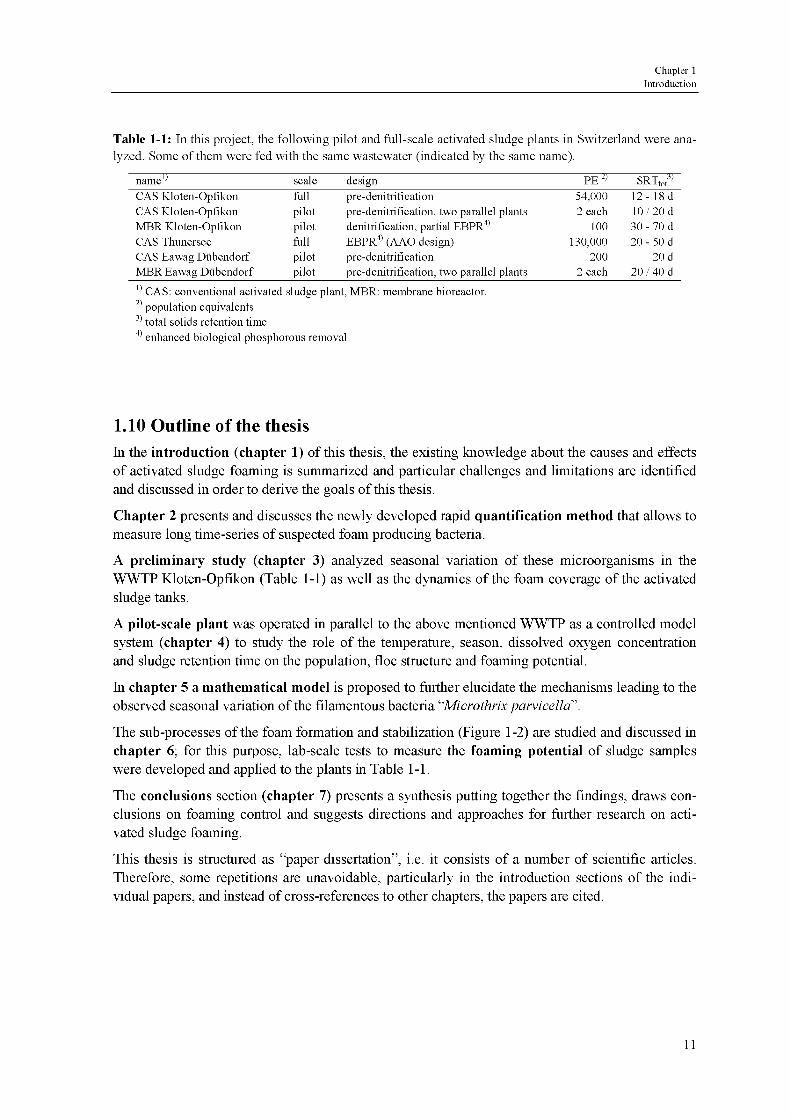
Table 1-1: In this project, the following pilot and full-scale activated sludge plants in Switzerland were ana¬
lyzed Some of them were fed with the same wastewater (indicated by the same name)
name' scale design PE '
SRTtot'
CAS Kloten-Opfikon full pre-denitnfication 54,000 12- 18d
CAS Kloten-Opfikon pilot pre-denitnfication, two parallel plants 2 each 10/20d
MBR Kloten-Opfikon pilot denitrification, partial EBPR4-1 100 30 - 70 d
CAS Thunersee full EBPR4) (AAO design) 130,000 20 - 50 d
CAS Eawag Dubendorf pilot pre-denitnfication 200 20 d
MBR Eawag Dubendorf pilot pre-denitnfication, two parallel plants 2 each 20 / 40 d
'-1 CAS conventional activated sludge plant, MBR membrane bioreactor
' population equivalents3> total solids retention time
' enhanced biological phosphorous removal
1.10 Outline of the thesis
In the introduction (chapter 1) of this thesis, the existing knowledge about the causes and effects
of activated sludge foaming is summarized and particular challenges and limitations are identified
and discussed in order to derive the goals of this thesis.
Chapter 2 presents and discusses the newly developed rapid quantification method that allows to
measure long time-series of suspected foam producing bacteria.
A preliminary study (chapter 3) analyzed seasonal variation of these microorganisms in the
WWTP Kloten-Opfikon (Table 1-1) as well as the dynamics of the foam coverage of the activated
sludge tanks.
A pilot-scale plant was operated in parallel to the above mentioned WWTP as a controlled model
system (chapter 4) to study the role of the temperature, season, dissolved oxygen concentration
and sludge retention time on the population, floe structure and foaming potential.
In chapter 5 a mathematical model is proposed to further elucidate the mechanisms leading to the
observed seasonal variation of the filamentous bacteria "Microthrix parvicella".
The sub-processes of the foam formation and stabilization (Figure 1-2) are studied and discussed in
chapter 6; for this purpose, lab-scale tests to measure the foaming potential of sludge samples
were developed and applied to the plants in Table 1-1.
The conclusions section (chapter 7) presents a synthesis putting together the findings, draws con¬
clusions on foaming control and suggests directions and approaches for further research on acti¬
vated sludge foaming.
This thesis is structured as "paper dissertation", i.e. it consists of a number of scientific articles.
Therefore, some repetitions are unavoidable, particularly in the introduction sections of the indi¬
vidual papers, and instead of cross-references to other chapters, the papers are cited.
11

Characterization and Controlhngof Foam and Scum in Activated Sludge Systems
12
Chapter 2
Rapid Quantification of Bacteria in Activated
Sludge using Fluorescence In Situ Hybridizationand Epifluorescence Microscopy
Thomas Hug, Willi Gujer, Hansruedi Siegrist
Water Research, 39(16), 3837-3848. (2005)
Abstract
A rapid quantification method for bacteria in activated sludge has been developed, based on fluores¬
cence in situ hybridization (FISH) and epifluorescence microscopy. Samples are hybridized on slides
and analyzed by direct microscopic observation. Abundance categories were designed based on digital
images of the target organisms. These rating systems were developed for the filamentous bacteria "Mi¬
crothrix parvicella" and for different morphotypes of nocardioform actinomycetes, but can easily be
adapted to other types of microorganisms. Due to the quantification by direct microscopic observation,
this method is suitable for samples that are difficult to be processed by semi-automated image analysis
techniques, such as samples containing fluorescent debris, cells of different fluorescence intensities and
target organisms that need partial enzymatic digestion prior to FISH. In contrast to commonly used
rating systems consisting of photographs, the newly developed categories allow to quantitatively com¬
pare results of different categories and different organisms. The uncertainties of the results were calcu¬
lated by a non-parametric bootstrap procedure; a thorough uncertainty analysis was performed in¬
cluding sample variability and operator subjectivity.
2.1 Introduction
Activated sludge is a complex and highly variable mixture of different microorganisms. Many re¬
cent research questions require identification and quantification of specific bacteria in the activated
sludge. To investigate e.g. the population dynamics of organisms involved in scumming (foaming)
or bulking, it is necessary to measure time series of their abundance with a high temporal resolution
(de los Reyes III and Raskin, 2002; Hug et al, 2005c). To model population dynamics, quantitativedata and selective identification is needed (Wilderer etal, 2002).
To identify and quantify bacteria in activated sludge, various methods have been developed, all of
them having specific limitations:
13
Characterization and Controlhngof Foam and Scum in Activated Sludge Systems
Filamentous bacteria have traditionally been identified by their morphology (Eikelboom and van
Buijsen, 1981; lenkins et al, 1993; Eikelboom, 2000). Unfortunately, this widely used identifica¬
tion system does not distinguish different organisms with the same morphology and cannot deal
with bacteria exhibiting variable morphology. For quantification, the same publications contain
arbitrary rating systems consisting of microphotographs. This procedure is rapid but limited to fil¬
amentous bacteria occurring outside the floes and having a similar morphology like the ones on the
images. Furthermore, these rating systems do not allow the quantitative comparison between dif¬
ferent categories and morphotypes. More quantitative are methods to measure filament length
(lenkins et al, 1993; de los Reyes III and Raskin, 2002), but they are limited to one morphotype.
Overcoming the limitations of light-microscopy, fluorescent in situ hybridization (FISH) allows the
identification of specific bacteria independent of their morphology and, therefore, has become the
new state of the art in research of bacteria in activated sludge (Wagner et al, 2002; Wilderer et al,
2002). Moreover, cells inside floes are easier to recognize using FISH compared to Gram-staining.
The above mentioned quantification methods for filaments can also be applied for fluorescentlylabeled bacteria, but their limitations are not eliminated. Manual counting of fluorescent cells is
often applied but fails for many organisms in activated sludge because cells in filaments or dense
agglomerates cannot be distinguished.
Very promising is the recently developed quantification method using confocal laser scanning mi¬
croscopy (CLSM) and digital image analysis (Kuehn et al, 1998; Bouchez et al, 2000; Daims,
2001) that works completely independent of the morphology of the target cells. Unfortunately, it is
not accurate for samples with very inhomogeneous fluorescence intensities (Daims, 2001) and for
bacteria that require cell wall permeabilization prior to hybridization which destroys a part of other
bacteria. Another big disadvantage for many research groups and plant operators is the requirementof an expensive CLSM to obtain the requested image quality.
The need to measure long time series of suspected scum forming bacteria in activated sludge led to
the following demands on a new quantification protocol using FISH:
• rapid
• possible with an epifluorescence microscope - no need of an expensive CLSM
• suitable for difficult matrix containing debris and cells of different fluorescence intensity
• suitable for FISH protocols requiring cell wall permeabilization
• allowing quantitative comparison between different concentrations of one organism as well as
between different target organisms
• small uncertainty due to subjectivity of operators
• accurate enough to identify typical seasonal changes in the population composition
This paper presents a newly developed quantification protocol based on drawn abundance catego¬
ries that fulfills the above stated goals. The paper describes the design and application of the rating
systems, presents the results of an uncertainty analysis that included different operators and finallyleads to a general discussion about uncertainties of quantification methods for bacteria in activated
sludge. Guidelines for the application can be found in the appendix.
14
Chapter 2
Rapid Quantification of Bacteria in Activated Sludge using Fluorescence In Situ Hybridization and Epifluorescence Microscopy
2.2 Methods
2.2.1 Samples
For the development of the rating system and for the uncertainty analysis, grab samples from mixed
liquor and scum of different full scale wastewater treatment plants (WWTP) in Switzerland were
taken.
2.2.2 Fluorescence in situ hybridization (FISH)
The following CY3 labeled oligonucleotide probes were used: MPA223 and MPA645 (Erhart et al.,
1997) for "Microthrix parvicella", MYC657 (Davenport et al., 2000) for nocardioform actinomy¬cetes. FITC labeled EUB338mix (Amann et al., 1990; Daims et al., 1999), specific for most bacte¬
ria, was used as positive control. As negative control, hybridization without probe and NonEUB338
(Wallner et al., 1993), complementary to EUB338, was performed. Since the cell walls of "M. par¬
vicella" and nocardioform actinomycetes are difficult to be penetrated by the oligonucleotide
probes, the fixed samples (1 min PFA; de los Reyes et al, 1997) were treated with Lysozyme
(Beimfohr et al., 1993) for 30 min at room temperature, for "M. parvicella" additionally with Mu-
tanolysin (Erhart et al., 1997) for 15 min at room temperature. Hybridization was performed ac¬
cording to Manz et al (1992).
2.2.3 Rating systems
Rating systems were designed for different potentially scum forming bacteria: long filaments of "M.
parvicella" and three different morphotypes of nocardioform actinomycetes (Figure 2-1). These
systems consist of simplified drawings that represent one field of view (1000 fold magnification,
diameter of 200 p.m), containing floes as gray shapes and fluorescent target bacteria as black lines
or dots (Figure 2-2). The background of each drawing contains floes that cover exactly 50 percent
of the area. (As an exception, in category 9 of the long filaments, the floe area is reduced to 25 per¬
cent because "M. parvicella" occurs in such high concentrations mainly outside the floes.)
Each rating system for a specific target organism consists of 10 categories (appendix, Figure 2-4 to
Figure 2-7). The abundance of the target cells exactly doubles from one category to the next; cate¬
gory 0 contains no target cell. To ensure that the abundance categories are quantitatively compara¬
ble, the "pixel concentrations" on the digital drawings (ratio of the number of pixels of target cells
to the sum of target cells and floes) is equal for all morphotypes (from 0.2% for category 1 to
51.2% for category 9). For the same reason, the drawings were designed to scale, using digital im¬
ages of the target organisms (Figure 2-2).
2.2.4 Microscopy and quantification of bacteria
Microscopy was performed on an Olympus BX50 epifluorescence microscope, equipped with fil-
tersets HQ-CY3 and HQ-FITC (Analysetechnik AG, Tübingen, Germany) and an Olympus objec¬tive (UplanFl lOOx, 1.30) under oil immersion.
To prevent systematic errors, the samples were randomly distributed onto different spots ("wells")
of the microscope slides so that the operator did not know what sample was being quantified.
The operator randomly selected several fields of view from each well. For each field, the abun¬
dance of fluorescent organisms (CY3) was visually assigned to a category of the according rating
system (half numbers were allowed to be chosen). The criterion was the ratio of target cells com¬
pared to the floe area (concentration of target organisms), not the absolute number of cells per field.
15

Characterization and Controllingof Foam and Scum in Activated Sludge Systems
Particles or cells with a bright signal that were obviously not target cells and bacteria that were
fluorescent in the negative controls (no probe or NonEUB338) were not taken into account. To re¬
duce errors due to variable sludge content of the analyzed fields, the operator made sure that the
sludge-coverage was at least 30 percent. Furthermore, if the analyzed floe was thicker than the
depth of focus (a few micrometers), an average abundance was estimated by considering layers at
different depths.
To investigate the subjective uncertainty the operator assigned not only one value ("best estimate")
for each field, but determined additionally a minimum and maximum value, representing his or her
subjective uncertainty range of 95 percent probability.
The operator to operator variability was assessed by letting five different operators analyze exactlythe same fields of view. To prevent systematic effects, the different persons did not know the val¬
ues of the others. The sequence of the persons was changed for every field in order to prevent sys¬
tematic effects due to fading of the fluorescence signals caused by bleaching of the sample.
To study the spatial variability within a sludge sample and to asses the repeatability ofthe method,
one operator additionally analyzed all four morphotypes in 100 fields of a new hybridization of the
same samples several months later, using the same equipment.
long branched short single cells
filaments filaments filaments (rods)
width of filament [um] 0.50-0.67 0.50-0.67 0.33-0.50 0.67 (length:1.0-1.2)
width of filament [pixels] 3-4 3-4 2-3 4 (length: 6-7)
Figure 2-1: Dimensions of the target organisms in the rating systems. Length of bar in pictures: 5 (am.
Figure 2-2: The rating systems consist of simplified drawings that represent one field of view with floes and
target organisms, which were designed to scale according to a microphotograph.
16
Chapter 2
Rapid Quantification of Bacteria in Activated Sludge using Fluorescence In Situ Hybridization and Epifluorescence Microscopy
2.2.5 Analysis of quantification results
For the presented uncertainty analysis, the following calculation was done. Once the uncertainties
are known, the simplified procedure as described in the appendix can be applied.
The calculations were performed on R 1.9.1 (an open source statistical software, freely available at
http://www.r-project.org). A program code used for the following calculations is available on re¬
quest.
The target value of the quantification is the mean abundance of an organism in a sludge sample and
its confidence interval. Taking into account that the distribution of the assigned values is unknown,
we applied a non-parametric bootstrap (Efron and Tibshirani, 1993). The principle of the bootstrapis to create many new data sets by sampling (with replacement) from the original data set. This
leads to an empirical distribution of possible mean values and, therefore, allows to estimate a con¬
fidence interval.
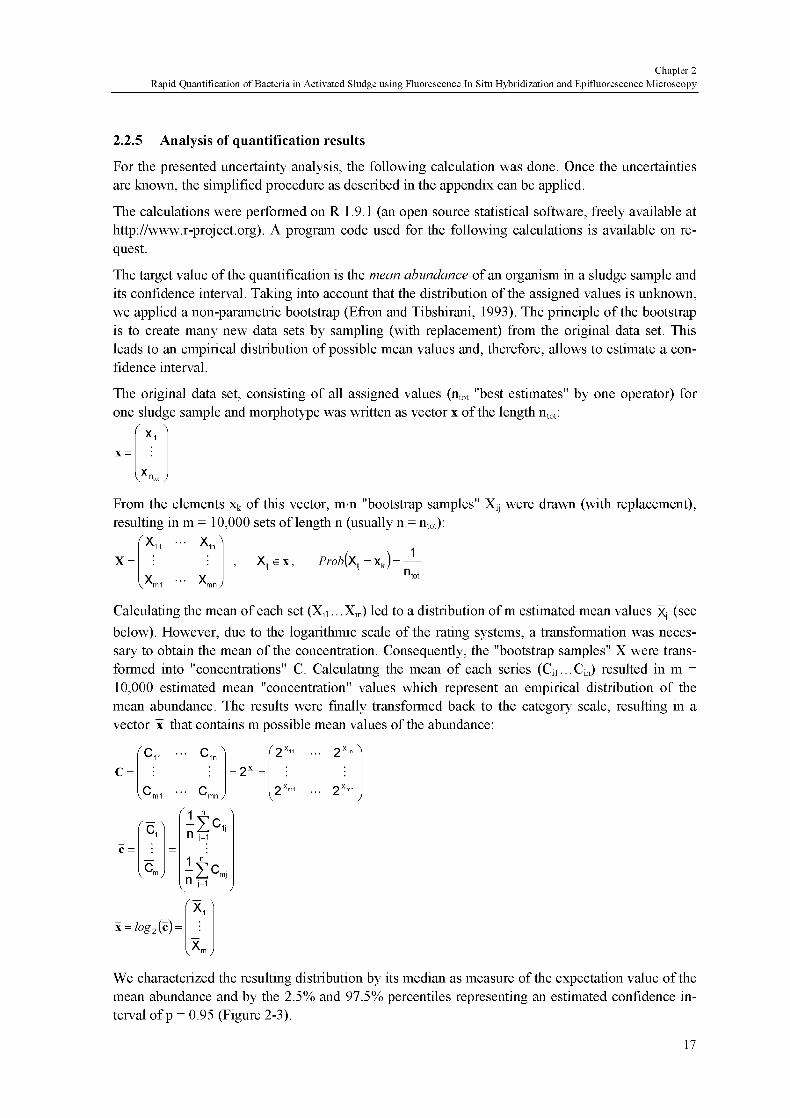
The original data set, consisting of all assigned values (ntot "best estimates" by one operator) for
one sludge sample and morphotype was written as vector x of the length ntot:
VX "tot J
From the elements xk of this vector, mn "bootstrap samples" Xy were drawn (with replacement),
resulting in m = 10,000 sets of length n (usually n = ntot):
X
fx„
vAni
>o
^nn
X e x, Prob\K = Xk j -
Calculating the mean of each set (X^.. .Xm) led to a distribution ofm estimated mean values Xj (see
below). However, due to the logarithmic scale of the rating systems, a transformation was neces¬
sary to obtain the mean of the concentration. Consequently, the "bootstrap samples" X were trans¬
formed into "concentrations" C. Calculating the mean of each series (C^.^Cm) resulted in m =
10,000 estimated mean "concentration" values which represent an empirical distribution of the
mean abundance. The results were finally transformed back to the category scale, resulting in a
vector x that contains m possible mean values of the abundance:
2x,n ^o
V^m1
^
2X"
f\ n A
i=in'
2Xi=i
log2(c) =
OO
X„
We characterized the resulting distribution by its median as measure of the expectation value of the
mean abundance and by the 2.5% and 97.5% percentiles representing an estimated confidence in¬
terval of p = 0.95 (Figure 2-3).
17

Characterization and Controllingof Foam and Scum in Activated Sludge Systems
If the presented categories are used, "pixel concentration" can be calculated as
cpix=0 1%.2*
where Cpix is the "pixel concentration" as percent, corresponding to the category value x.
In order to include the subjective uncertainty range of one operator, the recorded ranges (minimum,
"best estimate", maximum) were visually analyzed and found to be symmetrically distributed.
Therefore, we considered the subjective uncertainty as normally distributed random error with a
standard deviation according to the width of the recorded subjective uncertainty range. Since the
recorded range represented the estimated 95% confidence range of the operators, we used half of
that interval as standard deviation sSUbj. Consequently, this uncertainty range was included into the
calculation of the mean abundance by adding to each "bootstrap sample" X1} a random sample e1}
from a normal distribution with mean = 0 and ssubj as standard deviation (values outside the cate¬
gory range {0... 9} were set to 0 or 9):(X'
X' *\
x'= ; ; x'^x.+s,., s,.~a<o,ssu,)rx' • ••
X'
>
x„ - X,j + e,j, e„~tf(°'ssub,y X'
These new values were object of the above described transformation into a linear "concentration"
scale and calculation of the means:
x' = log2
1
n
ly2x'1'f 1
n
1i=i
1 n
ly2xv
ntt
To assess the operator to operator variability, the described calculation was performed for the val¬
ues assigned by five different operators to the same fields. The five resulting probability distribu¬
tions were combined to one multimodal distribution from which the confidence interval was calcu¬
lated (Figure 2-3c).
Due to the spatial variability of the sludge sample, the confidence interval of the resulting mean
abundance narrows with an increasing number of analyzed fields. To assess this effect, the calcula¬
tions were repeated with different length n (2 < n < ntot) of the bootstrap data sets, sampling alwaysfrom the total number of ntot available values (Figure 2-3).
2.3 Results
The developed method is described in detail above in the methods section of this paper, including
design of the rating systems, microscopic analysis, calculation of results and uncertainty analysis
using a bootstrap procedure. Guidelines for its application can be found in the appendix.
The calculated mean abundance for each sample and operator are shown in Table 2-1.
The subjective uncertainty ranges, estimated by the operators for each field of view, were found to
be symmetrically distributed around the corresponding "best estimate". For all analyzed morpho¬
types, the subjective uncertainty ranges were smaller or equal plus/minus one category unit (p =
0.95).
Due to the spatial variability ,the uncertainty range of the result depends on the number of ana¬
lyzed fields as shown in Figure 2-3.
18

Chapter 2
Rapid Quantification of Bacteria in Activated Sludge using Fluorescence In Situ Hybridization and Epifluorescence Microscopy
The repeatability, measured as two independent quantification series (new hybridization of the
same sludge sample), showed no significant differences for any morphotype (operator El and E2 in
Table 2-1 and Figure 2-3a).
To test the operator to operator variability, five operators analyzed exactly the same fields of view
(Figure 2-3). The calculated mean values were always within a range of two category units (Table
2-1). This range defines the total uncertainty of the result at an indefinite number of fields (Figure
2-3c).
2.4 Discussion
2.4.1 Microscopy
Characteristic of the presented method is that an operator has to visually judge the sample under the
microscope and subjectively assign an abundance category. Even a high quality digital image cap¬
turing the whole spatial resolution provided by the microscope exhibits a far lower brightness reso¬
lution than a human eye can recognize and it does only show one focus plane oftypically about one
micrometer. Furthermore, the human brain is very efficient in recognizing and distinguishing
shapes. Images of activated sludge floes taken on an epifluorescence microscope always contain
bright blurry parts caused by the sum of out of focus signals (Figure 2-1). As image analysis rou¬
tines usually set an intensity threshold to distinguish positive from negative signals, they do not
provide accurate results for such images due to the bright and variable background intensity. Digi¬tal image analysis of activated sludge requires an image quality that is only achievable using a con-
focal laser-scanning microscope (CLSM). Direct visualization by eye on the other hand allows to
easily recognize positively labeled cells inside floes and to consider a large focus range in order to
distinguish non-target fluorescent signals. Moreover, image analysis routines request manual re¬
moval of fluorescent debris and non-target cells from the digital image prior to the actual quantifi¬
cation, while an operator at the microscope can simply neglect such signals without losing time.
These clear advantages of direct microscopic analysis make the presented method suitable to quan¬
tify bacteria in a matrix that contains organisms of very different fluorescence intensity and fluo¬
rescent non-target particles such as full-scale activated sludge or probably also sediments or soil.
Table 2-1: Resulting mean abundance of different operators analyzing the same fields of view Operators A,
C and E analyzed additional fields to those analyzed by all operators Operator E (E2) analyzed also new
hybridizations of the same samples
operator operator operator
target morphotype, sample probe n" A B C D El .' A C El n" E22)
long filaments, sample 1 MPA223+645 14 6 1 44 57 47 5 1 100 54
long filaments, sample 2 MPA223+645 9 8 1 65 66 72 73 19 80 65 73 100 72
branched filaments, sample 3 MYC657 6 52 40 48 33 36 16 59 58 50 100 44
branched filaments, sample 4 MYC657 6 32 29 37 18 30 16 37 33 3 1 100 26
single cells, sample 3 MYC657 6 23 14 10 07 13 16 2 110 12 100 12
single cells, sample 4 MYC657 6 17 14 07 06 10 16 18 08 12 100 09
short filaments, sample 3 MYC657 100 1 8
short filaments, sample 4 MYC657 100 14
n = number of analyzed fields
E2 = operator E analyzing new hybridizations of the same samples
19

Characterization and Controllingof Foam and Scum in Activated Sludge Systems
The time spent for the actual microscopic analysis was less than one minute per field and morpho¬
type (assigning three values per field: "best estimate" and minimum/maximum values indicating a
personal uncertainty range). An operator who is familiar with epifluorescence microscopy of FISH
labeled samples needs about ten minutes to quantify a reasonable number of 10-20 fields. This is
considerably less than about one hour per sample with semiautomatic analysis of digital CLSM
images. For both methods, time for the hybridization has to be added (this depends highly on the
number of samples); data handling and analysis can be conducted almost fully automatically.
(a) differences among operators
9 -i
8
7
6
5
4
3
2
1
0
operator A operator B operator C operator D operator El operator E2
o00
-ac3J3
~i 1 1—I 1 1 1—I 1—i 1—I—r
5 10 15 0 5 10 15 0 5 10 15 0 5
number of fields
1 1 1 1 1 1 1 1 1 T"
10 15 0 5 10 15 0 5 10 15
expectation value and confidence interval (p=0 95), including subjective uncertainty (ssu^ = 0 5)
expectation value and confidence interval (p=0 95), without subjective uncertainty (ssufo, = 0)
(b) one operator (E2) (c) five operators (combined)
-ac3J3
99
8-
! 8,
7-
6-
o00
to
uc
7
6
5
4s^-
5- r* "~ - r- J- - " "
4-
3-
2-
1-
-ac3
3
2
1
f
0 1 1 1 1 1 1 1 1 1 0 1 1
0 10 20 30 40 50 60 70 80 90 100 0 10 20 «
number of fields number of fieIds
Figure 2-3: The uncertainty range of the mean abundance depends on the number of analyzed fields, due to
the spatial variability The solid lines indicate the median and the 95% confidence interval of the mean abun¬
dance including a subjective uncertainty range of ssubj= 05 The dashed lines indicate the range without sub¬
jective uncertainty (ssub, = 0) (a) Differences among operators (E2 stands for operator E analyzing a new hy¬bridization of the same sample) (b) Large number of fields analyzed by one operator (c) The combined
results of the five operators
20
Chapter 2
Rapid Quantification of Bacteria in Activated Sludge using Fluorescence In Situ Hybridization and Epifluorescence Microscopy
2.4.2 Rating Systems
Direct visualization by eye offers some important advantages but makes it more difficult to obtain
quantitatively comparable results, which was a major reason to develop this new method. The
widely used filaments abundance categories (Eikelboom and van Buijsen, 1981; lenkins et al,
1993; Eikelboom, 2000) are based on microphotographs with arbitrary differences of the concen¬
tration from one category to the next and, therefore, do not allow to quantitatively compare the
abundance of different categories or even different morphotypes. To overcome these limitations,
the presented rating system consists of drawings instead of photographs, designed as quantitatively
comparable categories.
The four presented rating systems can be applied not only for the particular bacteria they were de¬
signed for (Figure 2-1), but also for other organisms of similar shapes. To make the results quanti¬
tatively comparable, the resulting "concentration" must be converted according to the dimensions
of the new target organisms. To quantify organisms of a different morphology, new category sys¬
tems can be designed. The dimensions of the new target cells should be stated, allowing to convert
the results for similar morphotypes. For morphologically inhomogeneous groups of bacteria it is
probably necessary to create more than one drawing as typical representation of one category. Not
suitable, however, is this method for organisms growing in dense spherical agglomerates of very
heterogeneous size and inhomogeneous distribution such as nitrifying bacteria (Manser et al,
2005).
2.4.3 Uncertainty analysis
The target value of the quantification is the abundance of a particular organism in the sampled sys¬
tem, e.g. the activated sludge tank. The following factors affecting the accuracy of the result were
studied:
The influence of the spatial variability within the sample is reduced by increasing the number of
analyzed fields (Figure 2-3).
Subjective uncertainty is introduced by the operator's choice of a category value. In fact, the opera¬
tor usually "selects" the value from a certain range that seems reasonable to himself. This subjec¬tive uncertainty widens the confidence interval and, due to the logarithmic scale of the categories,increases the median (Figure 2-3). In this study, sSUbj
= 0.5 was found to be appropriate; its effect on
the final uncertainty was negligible.
Often, different operators are involved in the quantification. If these operators assign systemati¬
cally different values, the observed "effects" in the studied population might depend on the differ¬
ent operators rather than on the changes in the studied system. Therefore, the operator to operator
variability of all involved operators must be determined. According to these differences, the results
can either be corrected or the uncertainty range can be widened (Figure 2-3). If the results must be
comparable to data obtained by other (unknown) operators, the total uncertainty range has to be
enlarged according to the measured differences among an adequate number of operators.
The calculated uncertainty range is proportional to the concentration, due to the log-scale rating
systems. Without considerable differences among operators, a confidence interval (p=0.95) of plusminus one category (i.e. 50% to 200% of the concentration) is achievable with 10-20 fields. This
precision proved to be sufficient to clearly recognize typical seasonal variations in the abundance
of suspected scum forming bacteria in a full-scale WWTP (Hug et al, 2005c).
A preliminary uncertainty analysis should be performed for every new target organism or type of
sample and for all involved operators.
21

Characterization and Controllingof Foam and Scum in Activated Sludge Systems
The overall uncertainty of this or any other quantification method based on FISH and microscopy
additionally includes the following aspects, which were not quantitatively analyzed in the presented
study:
Only a few floes of the activated sludge tank are analyzed. To obtain a representative average, the
fields must be chosen from different floes and repetitions of the (sampling and) quantificationshould be performed. However, selecting these fields cannot be done absolutely randomly. Fur¬
thermore, the variable sludge content of the analyzed fields influences the result. To consider this,
the assigned values could be weighted; but the necessary estimation of the amount of sludge would
introduce further (subjective) uncertainties. The accuracy depends also on the thickness of the ana¬
lyzed floe and the depth of focus: A thick layer of sludge that is in focus allows to recognize a
greater number of target cells and pretends a higher concentration. The small depth of focus of a
lOOx objective reduces this effect and allows to analyze several thin layers within thick floes in
order to estimate an average concentration of the whole floe depth. Further uncertainty origins from
the variable density of activated sludge floes that is not considered in the rating systems where
floes are drawn as homogeneous gray shapes.
The FISH procedure is another source of possible systematic errors. It involves several centrifuga-tion and washing steps, which may lead to a selective loss of bacteria. A non-optimal hybridization
(e.g. due to insufficient permeabilization of Gram-positive cell walls) or bleaching of the fluoro-
chromes under the microscope may lead to low abundance values. High numbers of auto-
fluorescent non-target cells or debris makes it more difficult to recognize the target cells.
Other quantification methods using FISH include manual counting of cells or the analysis of digitalCLSM images (Kuehn et al, 1998; Bouchez et al, 2000; Daims, 2001). Both do not depend on a
logarithmic scale and therefore provide results with a smaller relative uncertainty than the values
found in this study. Moreover, they use an apparently more reliable reference system (usually the
cells hybridized by a universal probe). However, while cell counts are not applicable to filaments in
which the cells often cannot be distinguished, the theoretically quite accurate and objective analysisof CLSM images is seriously limited for the quantification of suspected scum forming Gram-
positive bacteria in full-scale activated sludge. The image analysis procedure usually results in a
ratio of area of target organisms compared to all biomass hybridized with a universal probe. Unfor¬
tunately, this reference system is affected as an unknown fraction of cells is destroyed by the en¬
zymatic pretreatment of the samples that is necessary to permeabilize our target cells. The quantifi¬cation itself is based on the semi-automatic or manual selection of a fluorescence intensitythreshold that distinguishes positive signals from the background. If the sample contains cells of
very different fluorescence intensities as it is the case in full-scale activated sludge, the results be¬
come additionally inaccurate and subjectively biased (Daims, 2001).
The method presented in this paper compares the fluorescent target cells with the total floe area.
This is generally less accurate than using all cells labeled by a universal probe as reference, but it is
hardly influenced by the destruction of non-target cells. As this method is based on direct visual
analysis by an operator, it can easily handle cells of different fluorescence intensities and samples
containing fluorescent non-target cells and debris. Furthermore, it is less time consuming and does
not need an expensive CLSM (as discussed above).
The conventional rapid methods like the widely used classification systems for filamentous bacteria
(Eikelboom and van Buijsen, 1981; lenkins et al, 1993; Eikelboom, 2000) are based on arbitraryscales and do not allow the quantitative comparison between different samples and different organ¬
isms. Furthermore, these rating systems are limited to filaments outside the floes.
22

Chapter 2
Rapid Quantification of Bacteria in Activated Sludge using Fluorescence In Situ Hybridization and Epifluorescence Microscopy
What is the "true concentration" of the quantified microorganisms? Apart from the uncertainty dis¬
cussion, it has to be clarified what kind of "concentration" is requested. Depending on the research
question, total numbers, volume, surface or activity of the target cells is of interest. Possible refer¬
ence systems are all FISH labeled bacteria, all viable bacteria, total active biomass or mixed liquor
suspended solids. This fundamental question has to be discussed fürther in the field of applied mi¬
crobiology and engineering (Wilderer etal, 2002), in order to take full advantage of the promising
possibilities offered by FISH.
2.5 Conclusions
This paper presents and discusses a new rapid quantification method for bacteria in activated
sludge using fluorescence in situ hybridization (FISH) and epifluorescence microscopy. It is based
on rating systems of designed log-scale abundance categories and direct microscopic observation.
In contrast to quantification methods based on semi-automatic analysis of digital images, the pre¬
sented method can easily cope with samples containing fluorescent debris and cells of different
signal intensities as well as with target organisms that need enzyme treatment prior to FISH. This
method is rapid and simple but, nevertheless, provides quantitatively comparable results. These
characteristics make it particularly valuable to measure extended time series of the abundance of
specific bacteria as it is necessary to investigate bulking and scumming in activated sludge systems.
A thorough uncertainty analysis was performed and discussed. The major factor influencing the
uncertainty of the result is the spatial variability within the sample as well as subjective differences
among operators. However, finding the most appropriate quantification method does not only de¬
pend on the requested accuracy but also on the type of "concentration" that is needed to answer a
specific research question.
Guidelines for the application of the method including the rating categories for the four investi¬
gated organisms are available in the appendix of this paper.
2.6 Acknowledgements
We thank Elke Hinz, Reto Manser, Kathrin Muche, lustyna Okolowicz and Mandy Ziranke for
their experimental contributions and Reto Manser, Marc Neuman, Wouter Pronk and Christoph Ort
for their engagement in helpful discussions. This project was performed in the framework of COST
action 624.
23
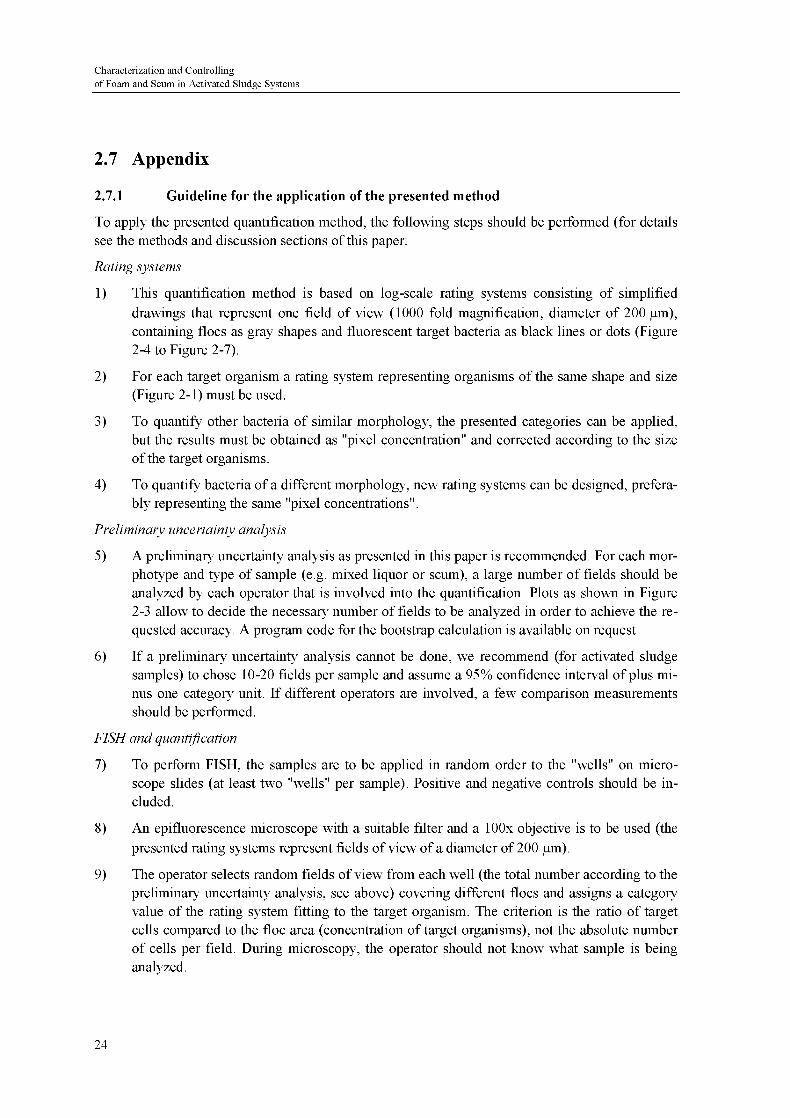
Characterization and Controllingof Foam and Scum in Activated Sludge Systems
2.7 Appendix
2.7.1 Guideline for the application of the presented method
To apply the presented quantification method, the following steps should be performed (for details
see the methods and discussion sections of this paper:
Rating systems
1) This quantification method is based on log-scale rating systems consisting of simplified
drawings that represent one field of view (1000 fold magnification, diameter of 200 pm),
containing floes as gray shapes and fluorescent target bacteria as black lines or dots (Figure2-4 to Figure 2-7).
2) For each target organism a rating system representing organisms of the same shape and size
(Figure 2-1) must be used.
3) To quantify other bacteria of similar morphology, the presented categories can be applied,but the results must be obtained as "pixel concentration" and corrected according to the size
of the target organisms.
4) To quantify bacteria of a different morphology, new rating systems can be designed, prefera¬
bly representing the same "pixel concentrations".
Preliminary uncertainty analysis
5) A preliminary uncertainty analysis as presented in this paper is recommended. For each mor¬
photype and type of sample (e.g. mixed liquor or scum), a large number of fields should be
analyzed by each operator that is involved into the quantification. Plots as shown in Figure2-3 allow to decide the necessary number of fields to be analyzed in order to achieve the re¬
quested accuracy. A program code for the bootstrap calculation is available on request.
6) If a preliminary uncertainty analysis cannot be done, we recommend (for activated sludge
samples) to chose 10-20 fields per sample and assume a 95% confidence interval of plus mi¬
nus one category unit. If different operators are involved, a few comparison measurements
should be performed.
FISH and quantification
7) To perform FISH, the samples are to be applied in random order to the "wells" on micro¬
scope slides (at least two "wells" per sample). Positive and negative controls should be in¬
cluded.
8) An epifluorescence microscope with a suitable filter and a lOOx objective is to be used (the
presented rating systems represent fields of view of a diameter of 200 pm).
9) The operator selects random fields of view from each well (the total number according to the
preliminary uncertainty analysis, see above) covering different floes and assigns a category
value of the rating system fitting to the target organism. The criterion is the ratio of target
cells compared to the floe area (concentration of target organisms), not the absolute number
of cells per field. During microscopy, the operator should not know what sample is being
analyzed.
24

Chapter 2
Rapid Quantification of Bacteria in Activated Sludge using Fluorescence In Situ Hybridization and Epifluorescence Microscopy
10) The mean abundance is calculated via a transformation of the log-scale categories into "con¬
centrations":
1 n
ly2xntT
where X is the resulting mean abundance in category units, n is the number of analyzedfields per sample and X;
= (x1; x2, ... xn) are the assigned category unit values for the n fields.
11) If the presented categories are used, "pixel concentrations" as volume ratio of target organ¬
isms to the total floe can be calculated as
cpix=0 1%.2x
where Cpix is the "pixel concentration" as percent, corresponding to category value X.
Publishing results
To publish results using this method, the following information should be included:
• the used rating system, including the "pixel concentrations" of its categories
• the size of the target organisms
• the number of analyzed fields
• the results as categories or "pixel concentrations"
• the confidence interval of the results and whether it was calculated for each sample, estimated
from prior uncertainty analysis, or assumed
25

Characterization and Controllingof Foam and Scum in Activated Sludge Systems
2.7.2 Rating systems
Figure 2-4: Abundance categories for long filaments ('''Microthrixparvicella") with filament width of 0.50-
0.67 urn. The circles represent fields of view (lOOOx magnification, diameter = 200 urn). The figures below
the category number indicate the "pixel concentrations", i.e. number of black pixels to sum of black and gray
pixels.
26

Chapter 2
Rapid Quantification of Bacteria in Activated Sludge using Fluorescence In Situ Hybridization and Epifluorescence Microscopy
10.2%
30.8%
53.2%
& m
S ^V !7
51.2%
Figure 2-5: Abundance categories for branched filaments (Gordonia amarae like organisms) with filament
width of 0.50-0.67 urn. The circles represent fields of view (lOOOx magnification, diameter = 200 urn). The
figures below the category number indicate the "pixel concentrations", i.e. number of black pixels to sum of
black and gray pixels.
27
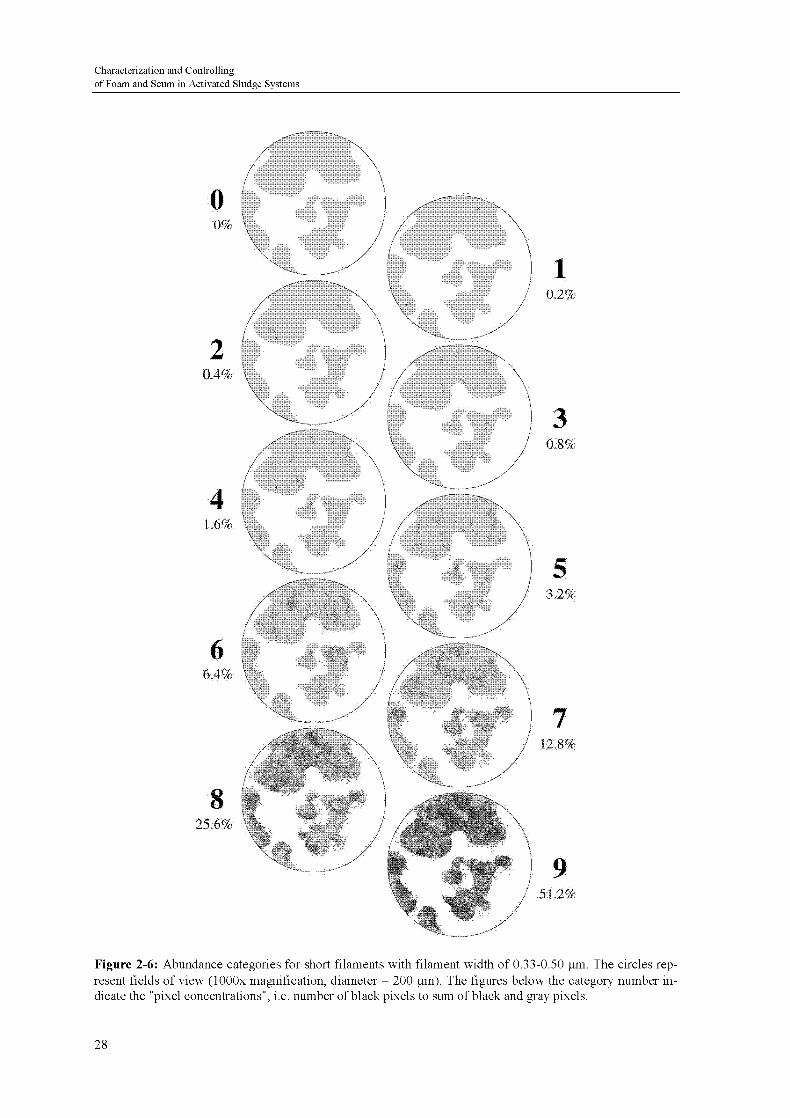
Characterization and Controllingof Foam and Scum in Activated Sludge Systems
12.8%
25.6%
/ 51.2%
Figure 2-6: Abundance categories for short filaments with filament width of 0.33-0.50 urn. The circles rep¬
resent fields of view (lOOOx magnification, diameter = 200 urn). The figures below the category number in¬
dicate the "pixel concentrations", i.e. number of black pixels to sum of black and gray pixels.
28
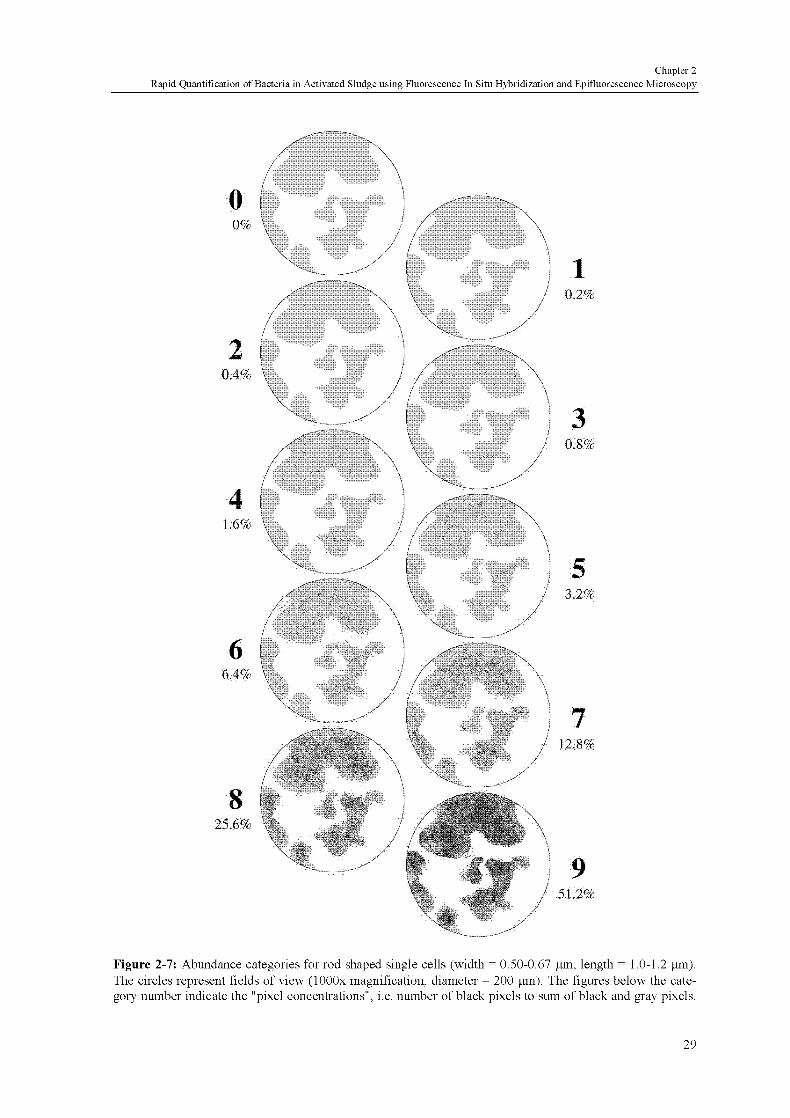
Chapter 2
Rapid Quantification of Bacteria in Activated Sludge using Fluorescence In Situ Hybridization and Epifluorescence Microscopy
10 2%
30 8%
53.2%
12 8%
51.2%
Figure 2-7: Abundance categories for rod shaped single cells (width = 0 50-0 67 urn, length =10-12 urn)The circles represent fields of view (lOOOx magnification, diameter = 200 urn) The figures below the cate¬
gory number indicate the "pixel concentrations", l e number of black pixels to sum of black and gray pixels
29

Characterization and Controllingof Foam and Scum in Activated Sludge Systems
30

Chapter 3
Dynamics of Population and Scumming on a full-scale
Wastewater Treatment Plant in Switzerland
Thomas Hug, Mandy Ziranke, Hansruedi Siegrist
oral presentation at Post-conference Colloquium on Foam and Scum in Biological Wastewater Treatment,
Prague Institute ofChemical Technology, Prague, Czech Republic. (2003)
Acta hydrochimica et hydrobiologica, 33(3), 216-222. (2005)
Abstract
The formation of stable scum (activated sludge foaming) is a serious operational problem in wastewa¬
ter treatment plants (WWTP) all over the world. Although scumming seems to be related to highnumbers of "Microthrixparvicella" and nocardioform actinomycetes, it is still unknown whether these
organisms are necessary and sufficient for the formation of stable scum. To tackle this question, the
abundance of these organisms and the scum coverage of the activated sludge basins were measured on
a WWTP in Switzerland for almost two years. Using fluorescence in-situ hybridization we were able to
recognize "M. parvicella"as well as filamentous and non-filamentous types of nocardioform actinomy¬
cetes. A newly developed rapid quantification method allowed us to measure seasonal variations of the
population. The highly variable scumming followed only partly the abundance of the filamentous types
of nocardioform actinomycetes and was not correlated to "M. parvicella ". Neither these organisms nor
any plant operating condition could fully explain the dynamics of the scumming. The data lead us to
suggest that high numbers of "M. parvicella"or nocardioform actinomycetes are not sufficient to cause
scumming. The measured dynamics of the population and the scum coverage also imply that, to inves¬
tigate scumming at a particular WWTP, time-series of measurements including different seasons and
periods of different scumming intensities are necessary.
3.1 Introduction
The formation of stable scum (activated sludge foaming) is a widespread problem in biologicalwastewater treatment plants (WWTP), where it causes serious operating problems, increases main¬
tenance and may lead to poor quality effluent. It is widely accepted that the formation and stabiliza¬
tion of foam or scum requires gas bubbles, surfactants and hydrophobic particles. Gas bubbles are
present in the system as air bubbles in the aeration tanks or nitrogen gas in the anoxic tank. Surfac¬
tants are present in the wastewater, but are also produced by the microorganisms. The hydrophobic
31
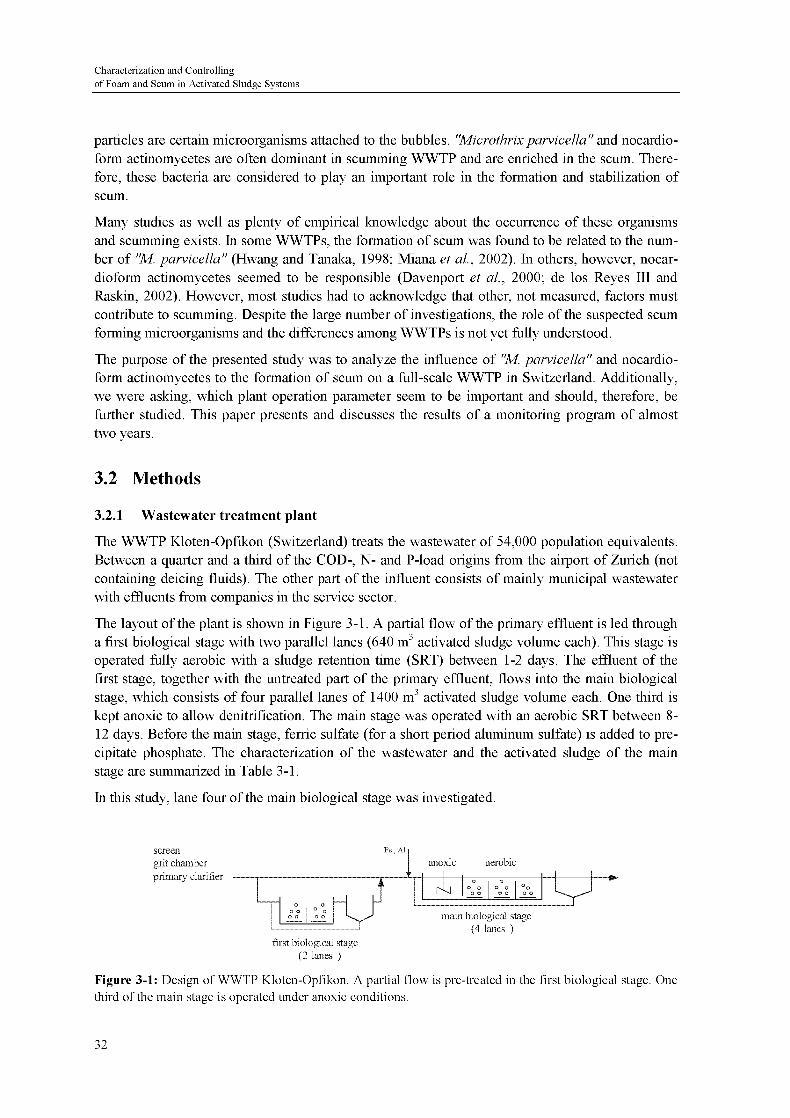
Characterization and Controllingof Foam and Scum in Activated Sludge Systems
particles are certain microorganisms attached to the bubbles. "Microthrixparvicella" and nocardio¬
form actinomycetes are often dominant in scumming WWTP and are enriched in the scum. There¬
fore, these bacteria are considered to play an important role in the formation and stabilization of
scum.
Many studies as well as plenty of empirical knowledge about the occurrence of these organismsand scumming exists. In some WWTPs, the formation of scum was found to be related to the num¬
ber of "M. parvicella" (Hwang and Tanaka, 1998; Miana et al, 2002). In others, however, nocar¬
dioform actinomycetes seemed to be responsible (Davenport et al, 2000; de los Reyes III and
Raskin, 2002). However, most studies had to acknowledge that other, not measured, factors must
contribute to scumming. Despite the large number of investigations, the role of the suspected scum
forming microorganisms and the differences among WWTPs is not yet fully understood.
The purpose of the presented study was to analyze the influence of "M. parvicella" and nocardio¬
form actinomycetes to the formation of scum on a full-scale WWTP in Switzerland. Additionally,
we were asking, which plant operation parameter seem to be important and should, therefore, be
further studied. This paper presents and discusses the results of a monitoring program of almost
two years.
3.2 Methods
3.2.1 Wastewater treatment plant
The WWTP Kloten-Opfikon (Switzerland) treats the wastewater of 54,000 population equivalents.Between a quarter and a third of the COD-, N- and P-load origins from the airport of Zurich (not
containing deicing fluids). The other part of the influent consists of mainly municipal wastewater
with effluents from companies in the service sector.
The layout of the plant is shown in Figure 3-1. A partial flow of the primary effluent is led through
a first biological stage with two parallel lanes (640 m3 activated sludge volume each). This stage is
operated fully aerobic with a sludge retention time (SRT) between 1-2 days. The effluent of the
first stage, together with the untreated part of the primary effluent, flows into the main biological
stage, which consists of four parallel lanes of 1400 m3 activated sludge volume each. One third is
kept anoxic to allow denitrification. The main stage was operated with an aerobic SRT between 8-
12 days. Before the main stage, ferric sulfate (for a short period aluminum sulfate) is added to pre¬
cipitate phosphate. The characterization of the wastewater and the activated sludge of the main
stage are summarized in Table 3-1.
In this study, lane four ofthe main biological stage was investigated.
screen
grit chamber
primary clarifier
aerobic
main biological stage
(4 lanes )
first biological stage
(2 lanes )
Figure 3-1: Design of WWTP Kloten-Opfikon A partial flow is pre-treated in the first biological stage One
third of the mam stage is operated under anoxic conditions
32

Chapter 3
Dynamics of Population and Scumming on a full-scale Wastewater Treatment Plant in Switzerland
Table 3-1: Characterization of the influent (including digester supernatant) and the activated sludge of the
mam stage Median and 10%-, 90%-percentiles of the values between 1 July 2001 and 30 June 2003 (total P
from 1 Jan 2002 to 30 June 2003)
Influent to main stageInflow m3^1 (15000) 17700 (24400)
Temperature °C (13) 17 (21)total COD mgL"1 (87) 177 (243)total BOD mgL"1 (47) 86 (127)totalN mgL"1 (29) 38 (47)
NH4-N mgL"1 (13) 21 (27)totalP mgL"1 (3 0) 39 (4 8)
activated sludge (main stage)aerobic SRT d (8) 11 (12)MLSS gL"1 (3 0) 35 (4 0)SVI mLg"1 (126) 239 (294)
3.2.2 Samples
For FISH analysis, grab samples from the scum layer on the anoxic tank and from the mixed liquor
near the effluent of the aerated compartment were taken. To characterize the load and the plant per¬
formance, the staff of the WWTP collected and analyzed 24-h composite samples from different
parts of the plant as well as grab samples from the activated sludge tanks.
3.2.3 Scum coverage
The amount of scum on the activated sludge tanks was measured by visually judging the percent¬
age of the surface covered by scum. This was separately done for the anoxic and the aerated com¬
partment and at different times of the day.
3.2.4 Fluorescence in-situ hybridization (FISH)
The following CY3 labeled oligonucleotide probes were used: MPA223 and MPA645 (Erhart etal,
1997), MYC657 (Davenport et al, 2000), GOAM192 (de los Reyes et al, 1997). A FITC labeled
mixture of EUB338 (Amann et al, 1990) with EUB338 II and EUB338III (Daims et al, 1999),
specific for the most bacteria, was used as reference. As negative control, hybridization without
probe and NonEUB338 (Wallner et al, 1993), complementary to EUB338, was performed.
Since the cell walls of "M. parvicella" and nocardioform actinomycetes are difficult to be pene¬
trated by the oligonucleotide probes, different fixation and permeabilization protocols were tested:
Fixation with ethanol (Roller et al, 1994) or paraformaldehyde (de los Reyes et al, 1997); addi¬
tional treatment as combinations of heat treatment (90°C, 30 min; lurtshuk et al, 1992) and the
application of lysozyme (Beimfohr et al, 1993) and mutanolysin (Erhart et al, 1997) at different
concentrations and incubation times. The signal intensity and evenness was judged visually (epif¬luorescence microscope) for the target organisms shown in Figure 3-2. The following treatment
was found to be most appropriate and was therefore applied in this study: Activated sludge samples
were fixed in PFA for 1 min according to de los Reyes et al. (1997) and stored in Ethanol/PBS (1:1)
at -20°C. Prior to hybridization, the samples were applied to Teflon coated slides, air-dried and de¬
hydrated in 50, 80 and 96% ethanol for 2 min each. The samples were then covered with lysozyme
(Fluka 62971; 10mg/ml in lOOmM Tris, 50mM EDTA, pH 8.0; Beimfohr et al, 1993) for 30 min
33

Characterization and Controllingof Foam and Scum in Activated Sludge Systems
at room temperature, followed by another ethanol series. For the hybridization of "M. parvicella",the samples were additionally treated with Mutanolysin (Fluka 70017; 5000 U/ml in 0.1 M potas¬
sium phosphate buffer at pH 6.8; Erhart et al, 1997) for 15 min at room temperature, followed by a
last ethanol series. Hybridization was performed on microscope slides according to Manz et al
(1992).
3.2.5 Microscopy and Quantification of bacteria
Microscopy was performed on an Olympus BX50 epifluorescence microscope, equipped with fil-
tersets HQ-CY3 and HQ-FITC (Analysetechnik AG, Tübingen, Germany) and an Olympus Objec¬tive (UplanFl lOOx, 1.30) under oil immersion.
A rapid procedure to quantify the identified microorganisms was developed; details of the method
and a discussion of its advantages and limitations are presented by Hug et al. (2005b). For each
observed morphotype (Figure 3-2), simplified drawings of a microscopic field of view were made,
containing floes as gray shapes and fluorescent bacteria as black lines or dots. For this study a pre¬
liminary rating system was used. It consisted of six categories, where the abundance of target cells
approximately doubles from one to the next; category 0 indicates that no target cell was observed.
Quantification was done by visually assigning a category to the microscopically observed abun¬
dance of fluorescent target organisms. Types of organisms that were fluorescent in the negativecontrols (no probe or NonEUB338) were not taken into account.
Each sample was applied randomly to two spots ("wells") on the microscope slides. This prevented
systematic errors by making sure that the operator did not know what sample was being quantified.From each well, five randomly selected fields of view (lOOx objective) were quantified; ten ana¬
lyzed fields per sample and morphotype proved to be sufficient to recognize the seasonal pattern of
the observed bacteria. All presented data were quantified by the same operator and are therefore not
affected by systematic deviations among different operators.
The mean abundance and its confidence interval of the target organism in one sample were calcu¬
lated by a non-parametric bootstrap procedure. The principle of the bootstrap is to create many new
data sets by sampling (with replacement) from the original data set. We drew 1000 times ten values
from the original ten values and calculated 1000 possible mean values. Due to the logarithmic scale
of the rating system, each value was transformed into a hypothetical "concentration" (c = 2X, where
x is the assigned category value) prior to the calculation of the average; the results were trans¬
formed back to category units. From the resulting distribution of 1000 mean abundance values, the
median and the 2.5% and 97.5% percentiles were calculated, representing the expectation value and
confidence interval (p = 0.95) of the mean abundance.
3.3 Results
We were able to distinguish "M. parvicella" and three different morphotypes of nocardioform ac¬
tinomycetes: the typical branched filaments, short filaments thinner than the branched filaments,
and small rod-shaped cells (Figure 3-2). Using a specific oligonucleotide probe to further distin¬
guish the nocardioform actinomycetes, the branched filaments were identified as Gordona amarae.
The abundance of "M. parvicella" and the filamentous nocardioform actinomycetes in the mixed
liquor exhibited a clear seasonal variation (Figure 3-3a, b, c). "M. parvicella" occurred in highnumbers during winter and spring while nocardioform actinomycetes were more abundant in sum¬
mer and autumn. The data allow the suggestion that the branched filaments were not only highlyabundant in autumn 2002 but also one year before and after. The non-filamentous type of nocardio-
34

Chapter 3
Dynamics of Population and Scumming on a full-scale Wastewater Treatment Plant in Switzerland
form actinomycetes did not show a seasonal variation and was always around category two. Only"M. parvicella" and the branched filaments were enriched in the scum.
The severity of scumming is shown in Figure 3-3e as percentage of the activated sludge basins be¬
ing covered by scum. Several major scumming events occurred: Short peaks occurred in February,lune and luly 2002. In September 2002 a long period of intensive scumming started. At the end of
2002, the scum coverage collapsed and stayed below fifty percent until the end of April 2003 when
it increased again rapidly. Most of the time, however, the amount of scum on the basins seemed to
vary randomly with many days of very low coverage.
The typical range of plant operation and environmental parameters are summarized in Table 3-1.
The ammonia rich digester supernatant was regularly added at night. The wastewater flow led
through the first stage was increased (from 10% to 60% of the total influent) from November 2001
to April 2002 and from lanuary to April 2003. This reduced the COD load to the main stage to
about 50% and lead there to a slightly decreased sludge concentration (MLSS) and airflow of the
aeration. Trying to control bulking, aluminum sulfate was used instead of ferric sulfate to precipi¬tate phosphate, from 2 to 11 December 2002 and 16 and 17 February 2003. Only the temperature
exhibits a distinct seasonal variation. The sludge volume index correlates well with the abundance
of "M. parvicella". The other parameters were either almost constant or highly variable without
showing clear trends.
Figure 3-2: The organisms monitored in this study (epifluorescence micrographs after FISH with CY3-
labeled probes): The image top left shows the long filaments of "M. parvicella". The other images show the
three distinguished morphotypes of nocardioform actinomycetes: top right branched filaments (G. amarae),
bottom left short thin filaments, bottom right small rod-shaped cells.
35
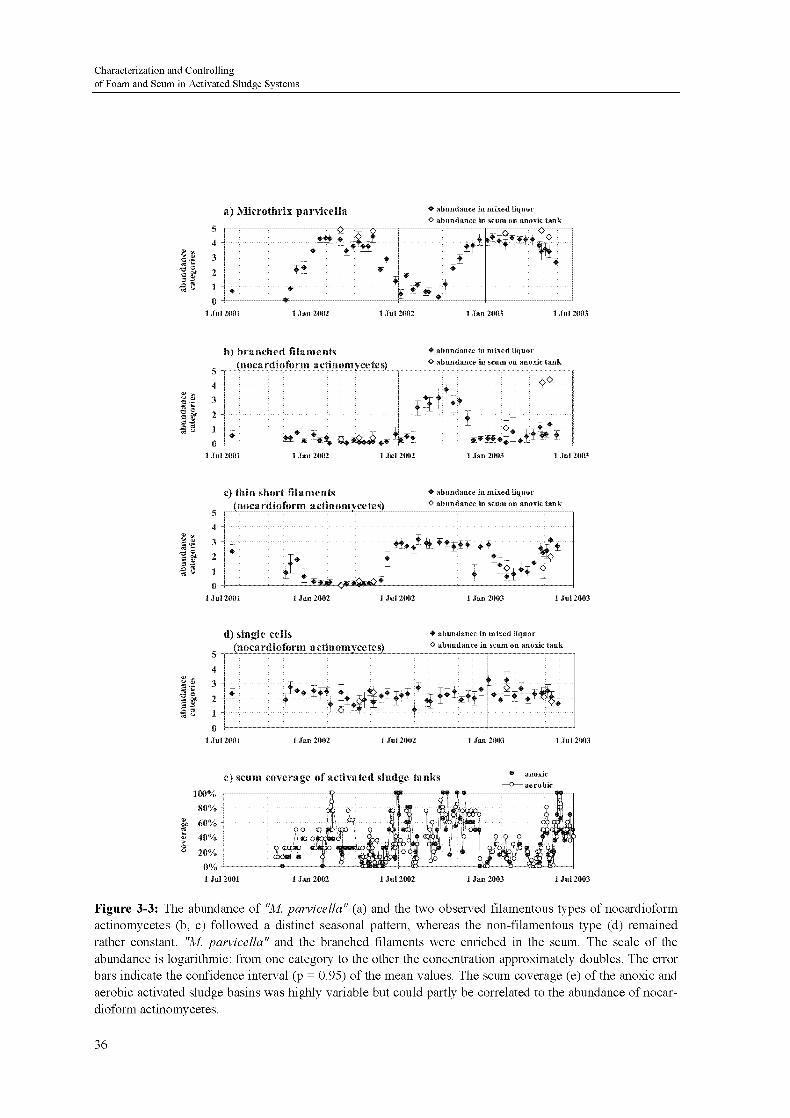
Characterization and Controllingof Foam and Scum in Activated Sludge Systems
a) Microthrii parvicella abundance m mixed hqiioî
O abundance in stüm on anoxic tank
:^F^|
b) branched filaments
(nocardioform actinomycetes)
abundance m mixed liquor
O abundance in scum on anoxic tank
*V~Vml^jM^^^Ji^i^L
&
JEâjfcfcfciki^L
5
4 -
il '
!3 1
c) thin short filaments
(nocardioform actinomycetes)
abundance m mi\ed bqiioi
O abundance in stüm on anoxic tank
-h_*»*#**$ *.
:E*Ä^ofc^ÄiL
d) single cells
(nocardioform actinomycetes)
abundance in mixed kqnor
® abundance m &cum on anoxic 1
e) scum coverage of activated sludge tanks anoxic
aerobic
Figure 3-3: The abundance of "M parvicella" (a) and the two observed filamentous types of nocardioform
actinomycetes (b, c) followed a distinct seasonal pattern, whereas the non-filamentous type (d) remained
rather constant "M parvicella" and the branched filaments were enriched in the scum The scale of the
abundance is logarithmic from one category to the other the concentration approximately doubles The error
bars indicate the confidence interval (p = 0 95) of the mean values The scum coverage (e) of the anoxic and
aerobic activated sludge basins was highly variable but could partly be correlated to the abundance of nocar¬
dioform actinomycetes
36
Chapter 3
Dynamics of Population and Scumming on a full-scale Wastewater Treatment Plant in Switzerland
3.4 Discussion
None of the observed bacteria did fully correlate with the scum coverage of the activated sludgebasins. However, some patterns seen in Figure 3-3 match together. The steep increase of the scum
coverage in early summer 2002 and 2003 can be linked to the growth of the thin short filamentous
nocardioform actinomycetes, while the long scumming event in autumn 2002 could, with a certain
delay, be related to the branched filaments. The increase of the scumming intensity during winter
2001/2002 occurred in parallel to the accumulation of "M. parvicella". Both reached maximum
values in February 2002, but "M. parvicella" remained in high numbers while the scum coverage
decreased again. Apart from that possibility, "M. parvicella" seems not to be related to the varia¬
tions of scumming at the investigated WWTP. This is surprising since it contradicts to the experi¬
ence of many other WWTP.
Our results correspond generally to the findings by Davenport et al. (2000) and de los Reyes III and
Raskin (2002) who linked scumming to the concentration of nocardioform actinomycetes in the
activated sludge. The authors of those studies considered also non-filamentous organisms to be im¬
portant. At the WWTP investigated in our study, non-filamentous nocardioform actinomycetes
were common but their abundance did not follow the variations of the scum coverage and they
were not enriched in the scum. Like the mentioned studies that could not fully explain the observed
scumming, we were not able to explain the dynamics of the scum coverage by the abundance of the
measured organisms. Our data reveal that none of the observed bacteria is solely responsible for
scumming at this particular WWTP.
Nevertheless, at all time at least one of the suspected scum forming organisms occurred in highnumbers. That points to the possibility that there is always a certain scumming or floating potentialin that activated sludge and that other factors control the actual scumming intensity.
This leads to the second goal of this study, which was to identify plant operation parameters that
seem to play a role in the formation of scum. They can either influence the growth of the suspected
scum forming organisms or directly the formation and or stabilization of scum.
The only factor that obviously influences the abundance ofthe monitored organisms is the tempera¬
ture. All observed filamentous bacteria followed this pattern. "M. parvicella" started to accumulate
when the wastewater temperature dropped below about 15°C and began to decrease when the tem¬
perature exceeded the same value. The short thin filamentous nocardioform actinomycetes grew
above about 18°C and the branched filaments preferred more than 20°C.
Trying to control the growth of "M. parvicella" that causes serious bulking at this WWTP, the plant
operators increased the flow through the first stage during winter. This reduced the COD load but
did not influence the abundance of "M. parvicella". For the same reason, aluminum sulfate was
added at the beginning of December 2002 and in February 2003. While "M. parvicella" was not
affected, the two types of filamentous nocardioform actinomycetes were possibly reduced. Whether
the collapse of the scum at the end of 2002 (Figure 3-3e) was caused by the aluminum dosage is
not clear because Christmas holidays started at the same time which could have changed the
wastewater composition.
We expected the airflow to directly influence the foaming or scumming intensity in the aerated
compartments. In fact, the decrease of the scum coverage at the end of 2002 and the increase in
April 2003 correlated with the variations in the airflow. But on the other side, one year before, the
two values changed in opposite directions (data not shown).
37
Characterization and Controllingof Foam and Scum in Activated Sludge Systems
Similar to the suspected scum forming organisms, we could not find an operation parameter that
dominantly controls scumming at this particular WWTP.
3.5 Conclusions
In many scumming WWTPs, "M. parvicella" and or nocardioform actinomycetes are abundant in
the mixed liquor and enriched in the scum. This leads to the common assumption that high num¬
bers ofthese organisms necessarily induce severe scumming.
A newly developed rapid quantification method based on logarithmic classification systems al¬
lowed us to monitor the seasonal variation of "M. parvicella" and different morphotypes of nocar¬
dioform actinomycetes. The presented results of almost two years revealed that the scum coverage
of the activated sludge basins at the investigated WWTP was partly correlated with the abundance
of some types of nocardioform actinomycetes, but not with "M. parvicella". Nevertheless, we could
not explain the whole variability of the scum formation.
This study confirmed that scumming is not solely controlled by the abundance of one of the sus¬
pected organisms or by one dominant plant operation parameter. A still unknown combination of
factors is rather controlling the formation and stabilization of scum.
Moreover, our results indicate that, in order to investigate the causes of scumming at a particular
WWTP, it is not sufficient to characterize the sludge and the operating conditions only during one
single scumming event and to extrapolate the findings to other days and other seasons. In most
cases, a monitoring program including periods with different scumming intensities and includingdifferent seasons will be necessary.
More research is needed to understand the mechanisms of activated sludge scumming. It is particu¬
larly important to search for factors causing a rapid development of scum and, by this, to clarify the
role ofthe suspected scum forming bacteria.
3.6 Acknowledgements
This project was performed in the framework of COST action 624 and was supported by the Swiss
Federal Office for Education and Science (BBW), the Office for Waste, Water, Energy and Air
(AWEL) ofthe Canton ofZurich and the WWTP Kloten-Opfikon.
38
Chapter 4
Unexpected Growth of "Microthrix parvicella" and
no Correlation with Floe Structure and Foaming in
a Pilot-Scale Activated Sludge Plant
Thomas Hug, Willi Gujer, Hansruedi Siegrist
submitted to Acta hydrochimica et hydrobiologica (May 2006)
Abstract
Inhibited sludge settleability (bulking) and the formation of stable foam are still unsolved problems in
many wastewater treatment plants (WWTPs) all over the world. The filamentous bacteria "Microthrix
parvicella" (Microthrix) and nocardioform actinomycetes are often thought to play an important role
in such solids separation problems. The operation of two pilot-scale plants fed with the same wastewa¬
ter as a full-scale WWTP where seasonal variations of these organisms were observed revealed surpris¬
ing findings. While Microthrix was usually hardly growing due to the low sludge retention time of ten
days (33% anoxic) and the temperature of 20°C, it suddenly steeply increased under apparently the
same conditions. Increased nitrite concentration led to the suggestion that incomplete nitrification or
denitrification might be responsible. Contradicting to widespread assumptions, Microthrix and nocar¬
dioform actinomycetes was neither correlating with the poor settleability of the sludge nor with the
observed foam formation.
4.1 Introduction
While state of the art wastewater treatment plants (WWTPs) easily fulfill requirements on COD
and nutrient removal, floe structure issues leading to inhibited sedimentation (bulking) or the for¬
mation of stable foam are still not fully understood. Such solids separation problems are not only a
risk for the receiving waters but also increase operational costs due to enhanced maintenance and
investment costs because larger tanks are constructed to provide safety.
The filaments bacteria "Microthrix parvicella" (in the paper referred as Microthrix) cause severe
bulking in many plants. Microthrix is furthermore, like different types of nocardioform actinomy¬
cetes, suspected to produce foam, due to its hydrophobic cell walls (Seviour and Blackall, 1999;
lenkins et al, 2004). Despite decades of research about Microthrix growth and its role in the for¬
mation of stable foams (Rossetti etal, 2005), there exist still plenty of different hypotheses.
39

Characterization and Controllingof Foam and Scum in Activated Sludge Systems
In the Swiss WWTP Kloten-Opfikon (54,000 p.e., pre-denitrification) distinct seasonal variation of
Microthrix and filamentous types of nocardioform actinomycetes occur (Hug et al, 2005c). During
high abundance of Microthrix in winter and spring severe bulking occurs, while foam coverage of
the activated sludge tanks seems not to be correlated with those bacteria.
These distinct seasonal population shifts and the lack of correlation between foam formation and
the abundance of the above mentioned bacteria led to the following questions:
• Is the seasonal population variation caused by the temperature or by seasonal variations of the
wastewater composition (e.g. due to biological processes in the sewer)?
• Can bulking and foaming be correlated with particular operating conditions (temperature, oxy¬
gen, sludge retention time) and what roles do the filamentous bacteria play?
To tackle these questions a sophisticated experimental design was developed and applied to a pilot-scale activated sludge plant that was fed with the same wastewater as the full-scale plant where
these observations were made.
4.2 Methods
4.2.1 Experimental design
An experimental plan was developed (Table 4-1 and Figure 4-2i) to study the influence of the tem¬
perature (T), the dissolved oxygen concentration (DO), the sludge retention time (SRT) and the
presumable seasonal variation of the wastewater composition. The different conditions include the
condition that was expected to favor Microthrix (low T and low DO) and favoring nocardioform
actinomycetes (high T and high DO), respectively. The latter conditions were used as reference
conditions (see below).
A complete 2n factorial design considers all possible combinations of n factors (T, DO, SRT) at two
levels (high/low). This allows to analyze not only the influence of each factor but also of their in¬
teractions. For time reasons, we decided to perform a complete factorial design to investigate the
influence of T and DO (22), and to add one experimental phase to test a higher SRT. In factorial
designs it is usually assumed that the experiments are replicable. However, this assumption was not
fulfilled as we operated the plants with real wastewater and the effectively measured flow dynam¬ics. Therefore, we operated two parallel plants, one of them always under the same "reference"
conditions (REF), and observed the difference to the plant operated under varying conditions
(VAR). Observing variations in the REF plant allowed furthermore to study seasonal effects, such
as wastewater composition and load, independent of the temperature.
Although both plants were identically constructed, one cannot rule out that slight differences exist
and affect the results. To prevent such misinterpretations, not always the same plant was operated
as REF, and two experimental phases where both plants were operated under the same (REF) con¬
ditions were included into the experimental plan (experimental phases 1 and 5).
To ensure the same initial conditions (sludge composition) in both plants for a particular experi¬mental phase, the following procedure was applied when starting a new experimental phase: The
sludge of the VAR plant was wasted, the REF sludge equally distributed to both plants and the re¬
actors filled up with secondary effluent from the full-scale plant (indicated by solid vertical lines in
Figure 4-2). The plants were then operated under the new operating conditions, but no sludge was
wasted until the expected solids concentration was reached (grey shapes in Figure 4-2).
40
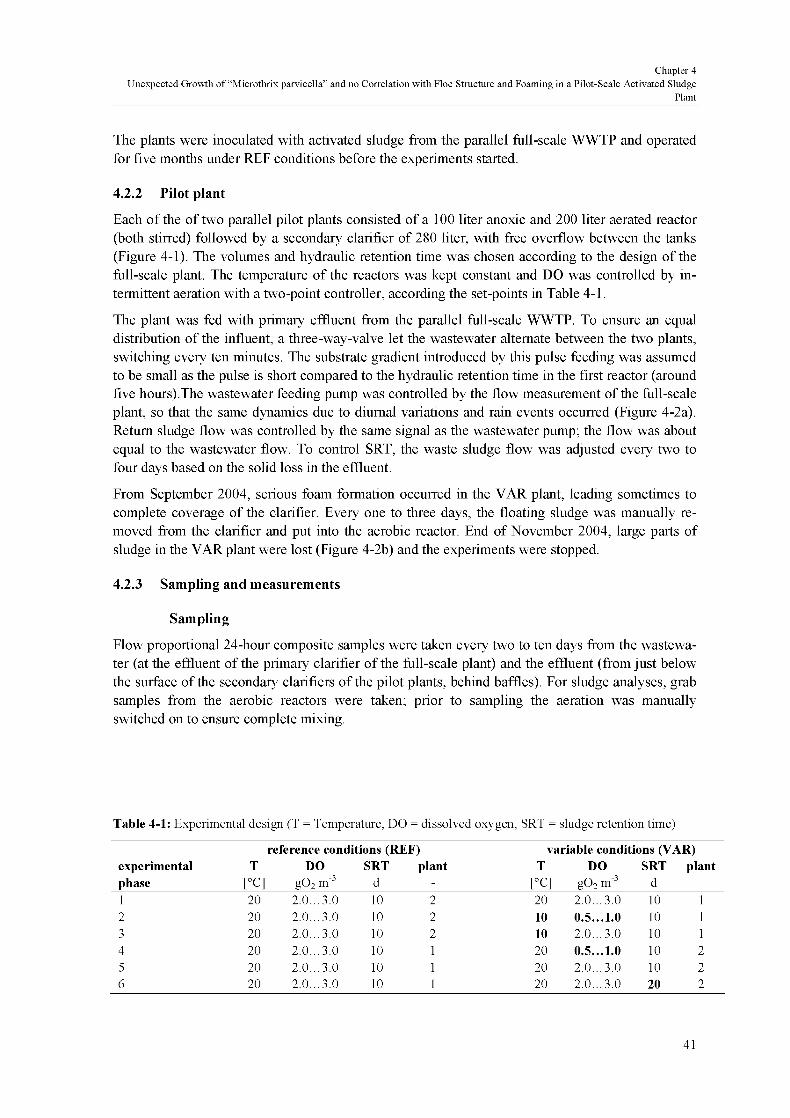
Chapter 4
Unexpected Growth of "Microthrix parvicella" and no Correlation with Floe Structure and Foaming in a Pilot-Scale Activated SludgePlant
The plants were inoculated with activated sludge from the parallel full-scale WWTP and operatedfor five months under REF conditions before the experiments started.
4.2.2 Pilot plant
Each of the of two parallel pilot plants consisted of a 100 liter anoxic and 200 liter aerated reactor
(both stirred) followed by a secondary clarifier of 280 liter, with free overflow between the tanks
(Figure 4-1). The volumes and hydraulic retention time was chosen according to the design of the
full-scale plant. The temperature of the reactors was kept constant and DO was controlled by in¬
termittent aeration with a two-point controller, according the set-points in Table 4-1.
The plant was fed with primary effluent from the parallel full-scale WWTP. To ensure an equaldistribution of the influent, a three-way-valve let the wastewater alternate between the two plants,
switching every ten minutes. The substrate gradient introduced by this pulse feeding was assumed
to be small as the pulse is short compared to the hydraulic retention time in the first reactor (aroundfive hours).The wastewater feeding pump was controlled by the flow measurement of the full-scale
plant, so that the same dynamics due to diurnal variations and rain events occurred (Figure 4-2a).
Return sludge flow was controlled by the same signal as the wastewater pump; the flow was about
equal to the wastewater flow. To control SRT, the waste sludge flow was adjusted every two to
four days based on the solid loss in the effluent.
From September 2004, serious foam formation occurred in the VAR plant, leading sometimes to
complete coverage of the clarifier. Every one to three days, the floating sludge was manually re¬
moved from the clarifier and put into the aerobic reactor. End of November 2004, large parts of
sludge in the VAR plant were lost (Figure 4-2b) and the experiments were stopped.
4.2.3 Sampling and measurements
Sampling
Flow proportional 24-hour composite samples were taken every two to ten days from the wastewa¬
ter (at the effluent of the primary clarifier of the full-scale plant) and the effluent (from just below
the surface of the secondary clarifiers of the pilot plants, behind baffles). For sludge analyses, grab
samples from the aerobic reactors were taken; prior to sampling the aeration was manuallyswitched on to ensure complete mixing.
Table 4-1: Experimental design (T = Temperature, DO = dissolved oxygen, SRT = sludge retention time)
reference conditions (REF) variable conditions (VAR)
experimental T DO SRT plant T DO SRT plant
phase [°C] g02 m"3 d - [°C] g02 m"3 d
1 20 20 3 0 10 2 20 20 3 0 10 1
2 20 20 3 0 10 2 10 0.5...1.0 10 1
3 20 20 3 0 10 2 10 20 3 0 10 1
4 20 20 3 0 10 1 20 0.5...1.0 10 2
5 20 20 3 0 10 1 20 20 3 0 10 2
6 20 20 3 0 10 1 20 2 0 3 0 20 2
41

Characterization and Controllingof Foam and Scum in Activated Sludge Systems
primary effluent
Qtot (Median = 0 99 m3 d"1)
clarifier
V = 280L
aerobic anoxic
V = 200L V=100L
anoxic aerobic
V=100L V = 200L
clanfier
V = 280L
waste sludge"" ^Z ~~\^7 *"
waste sludge
return sludge Qrs = Qo return sludge Qrs = Qo
Figure 4-1: Design of the two parallel pilot plants The reactors are insulated and temperature controlled
(TC) The wastewater flow (primary effluent from the full-scale WWTP) is controlled by the flow measure¬
ment of the parallel full-scale WWTP and equally distributed to both pilot plants
Chemical and physical analyses
Chemical analyses (COD, total P, total N, Ammonium, Nitrite, Nitrate) of wastewater, effluent and
sludge components were made using photometric LANGE cuvette tests (HACH LANGE GmbH,
Düsseldorf, Germany).
Mixed liquor suspended solids (MLSS) were measured by filtration through glass microfibre filters
(Whatman GF/F, 0.7 pm) and drying at 105 °C overnight. For the measurement of volatile sus¬
pended solids (VSS), the filters were ignited at 550°C.
SVI
The diluted sludge volume index (SVI) was performed according to lenkins et al (1993) (dilution
with effluent until the settled volume after 30 min is less but close to 200 mL L"1).
Floe structure and microbial population
The floe structure was characterized by visual observation under a light microscope with phasecontrast. Total filament abundance was determined using the rating system by lenkins et al (1993),
filament identification according to Eikelboom and van Buijsen (1981).
The bacteria abundance was measured by fluorescence in-situ hybridization (FISH), using the
probes MPA223 and MPA645 (Erhart et al, 1997) for Microthrix and MYC657 (Davenport et al,
2000) for nocardioform actinomycetes. The fixation, pretreatment, hybridization and quantification
was done as described by Hug et al (2005b) resulting in "pixel concentration", a measure of the
ratio of target organisms to the apparent total floc-volume.
42
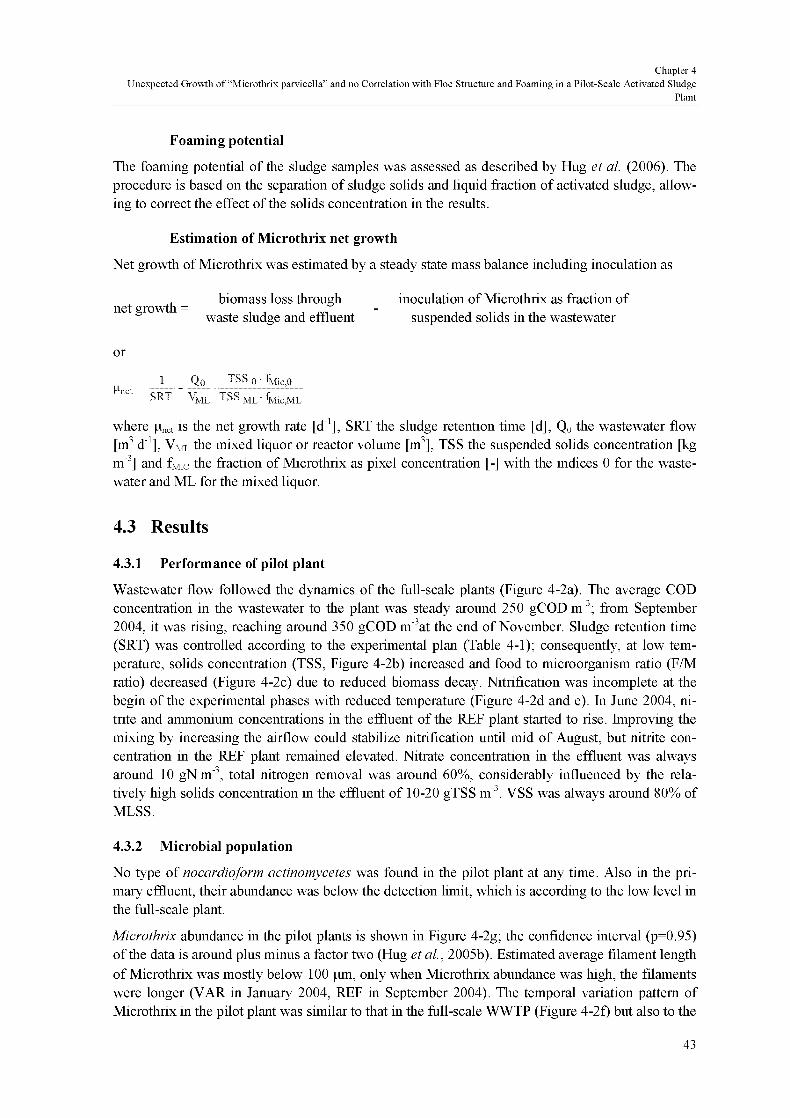
Chapter 4
Unexpected Growth of "Microthrix parvicella" and no Correlation with Floe Structure and Foaming in a Pilot-Scale Activated SludgePlant
Foaming potential
The foaming potential of the sludge samples was assessed as described by Hug et al (2006). The
procedure is based on the separation of sludge solids and liquid fraction of activated sludge, allow¬
ing to correct the effect of the solids concentration in the results.
Estimation of Microthrix net growth
Net growth of Microthrix was estimated by a steady state mass balance including inoculation as
biomass loss through inoculation of Microthrix as fraction ofnet growth = , , ,
„
-
,,,-,-,
waste sludge and effluent suspended solids in the wastewater
or
1 Qo TSS o tjyIlL oMnet —
SRT VML TSSML 4llc,ML
where Pnet is the net growth rate [d1], SRT the sludge retention time [d], Q0 the wastewater flow
[m3 d"1], Vml the mixed liquor or reactor volume [m3], TSS the suspended solids concentration [kg
m"3] and fMic the fraction of Microthrix as pixel concentration [-] with the indices 0 for the waste¬
water and ML for the mixed liquor.
4.3 Results
4.3.1 Performance of pilot plant
Wastewater flow followed the dynamics of the full-scale plants (Figure 4-2a). The average COD
concentration in the wastewater to the plant was steady around 250 gCOD m"3; from September
2004, it was rising, reaching around 350 gCOD m"3at the end of November. Sludge retention time
(SRT) was controlled according to the experimental plan (Table 4-1); consequently, at low tem¬
perature, solids concentration (TSS, Figure 4-2b) increased and food to microorganism ratio (F/M
ratio) decreased (Figure 4-2c) due to reduced biomass decay. Nitrification was incomplete at the
begin of the experimental phases with reduced temperature (Figure 4-2d and e). In lune 2004, ni¬
trite and ammonium concentrations in the effluent of the REF plant started to rise. Improving the
mixing by increasing the airflow could stabilize nitrification until mid of August, but nitrite con¬
centration in the REF plant remained elevated. Nitrate concentration in the effluent was alwaysaround 10 gNm"3, total nitrogen removal was around 60%, considerably influenced by the rela¬
tively high solids concentration in the effluent of 10-20 gTSS m"3. VSS was always around 80% of
MLSS.
4.3.2 Microbial population
No type of nocardioform actinomycetes was found in the pilot plant at any time. Also in the pri¬
mary effluent, their abundance was below the detection limit, which is according to the low level in
the full-scale plant.
Microthrix abundance in the pilot plants is shown in Figure 4-2g; the confidence interval (p=0.95)of the data is around plus minus a factor two (Hug et al, 2005b). Estimated average filament length
of Microthrix was mostly below 100 pm, only when Microthrix abundance was high, the filaments
were longer (VAR in lanuary 2004, REF in September 2004). The temporal variation pattern of
Microthrix in the pilot plant was similar to that in the full-scale WWTP (Figure 4-2f) but also to the
43
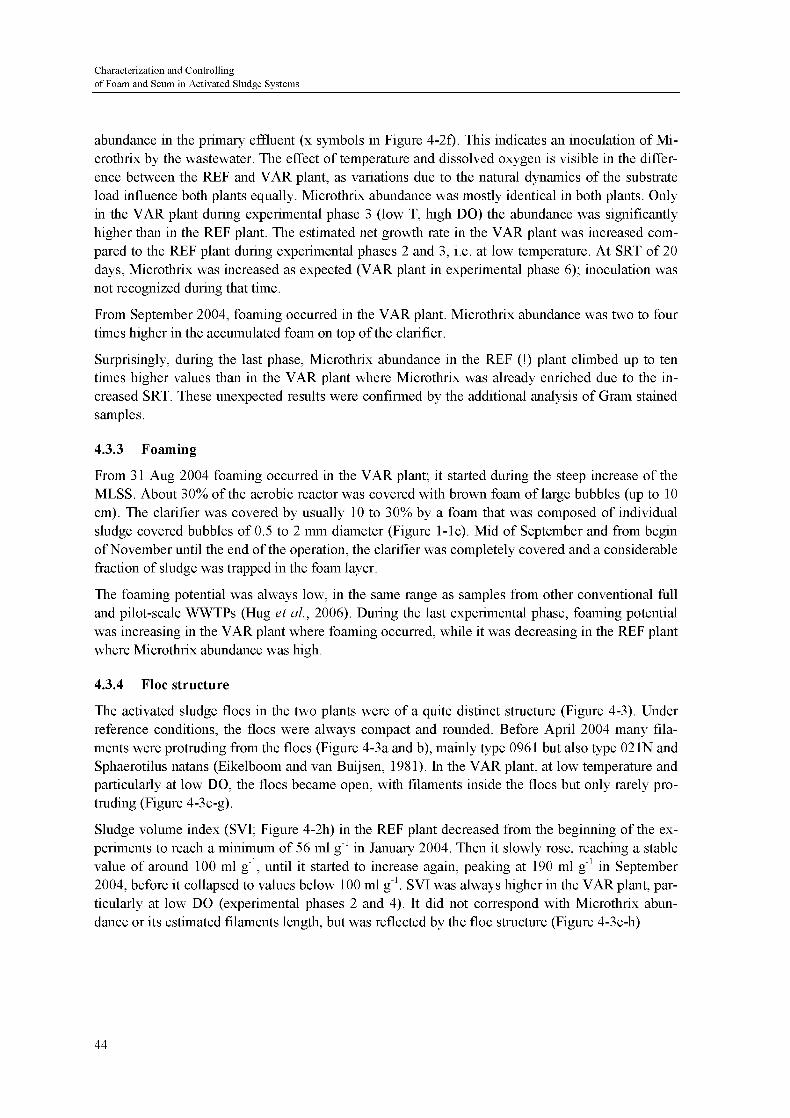
Characterization and Controllingof Foam and Scum in Activated Sludge Systems
abundance in the primary effluent (x symbols in Figure 4-2f). This indicates an inoculation of Mi¬
crothrix by the wastewater. The effect of temperature and dissolved oxygen is visible in the differ¬
ence between the REF and VAR plant, as variations due to the natural dynamics of the substrate
load influence both plants equally. Microthrix abundance was mostly identical in both plants. Onlyin the VAR plant during experimental phase 3 (low T, high DO) the abundance was significantly
higher than in the REF plant. The estimated net growth rate in the VAR plant was increased com¬
pared to the REF plant during experimental phases 2 and 3, i.e. at low temperature. At SRT of 20
days, Microthrix was increased as expected (VAR plant in experimental phase 6); inoculation was
not recognized during that time.
From September 2004, foaming occurred in the VAR plant. Microthrix abundance was two to four
times higher in the accumulated foam on top ofthe clarifier.
Surprisingly, during the last phase, Microthrix abundance in the REF (!) plant climbed up to ten
times higher values than in the VAR plant where Microthrix was already enriched due to the in¬
creased SRT. These unexpected results were confirmed by the additional analysis of Gram stained
samples.
4.3.3 Foaming
From 31 Aug 2004 foaming occurred in the VAR plant; it started during the steep increase of the
MLSS. About 30% of the aerobic reactor was covered with brown foam of large bubbles (up to 10
cm). The clarifier was covered by usually 10 to 30% by a foam that was composed of individual
sludge covered bubbles of 0.5 to 2 mm diameter (Figure 1-lc). Mid of September and from beginofNovember until the end of the operation, the clarifier was completely covered and a considerable
fraction of sludge was trapped in the foam layer.
The foaming potential was always low, in the same range as samples from other conventional full
and pilot-scale WWTPs (Hug et al, 2006). During the last experimental phase, foaming potential
was increasing in the VAR plant where foaming occurred, while it was decreasing in the REF plantwhere Microthrix abundance was high.
4.3.4 Floe structure
The activated sludge floes in the two plants were of a quite distinct structure (Figure 4-3). Under
reference conditions, the floes were always compact and rounded. Before April 2004 many fila¬
ments were protruding from the floes (Figure 4-3a and b), mainly type 0961 but also type 02 IN and
Sphaerotilus natans (Eikelboom and van Buijsen, 1981). In the VAR plant, at low temperature and
particularly at low DO, the floes became open, with filaments inside the floes but only rarely pro¬
truding (Figure 4-3e-g).
Sludge volume index (SVI; Figure 4-2h) in the REF plant decreased from the beginning of the ex¬
periments to reach a minimum of 56 ml g"1 in lanuary 2004. Then it slowly rose, reaching a stable
value of around 100 ml g"1, until it started to increase again, peaking at 190 ml g"1 in September
2004, before it collapsed to values below 100 ml g"1. SVI was always higher in the VAR plant, par¬
ticularly at low DO (experimental phases 2 and 4). It did not correspond with Microthrix abun¬
dance or its estimated filaments length, but was reflected by the floe structure (Figure 4-3e-h)
44

Chapter 4
Unexpected Growth of "Microthrix parvicella'
and no Correlation with Floe Structure and Foaming in a Pilot-Scale Activated SludgePlant
a) Wastewater flow to each plant (daily average)1 5
1 0
0'
00
^f^kÀfkXu^ ^h^^«*dkÜ^^t^
b) MLSS
D RLI
» VAR
toe^iflKSabö g'5aJriDaQOD dooœP
\ D J I
2001 2004
c) FA1 ratio
\ D J i
2003 2004
d) NH4+ in effluent
12
d Rti8
4
0 -ÙCD
• VAR
DC
A,SO\DTFM\MT
2003 2004
B^Jjßi.fi~S^@B—§H£ -ffi-Ô—
e) NO2" in effluent
E
D J 1 M
2003 2004
f) Microthrix abundance in full-scale WWTP and primarj effluent
o100 0
s 10%
^0 1%
* full -.tale WV> TP
X p[imir\ effluent
O
xxx
N D J
2003 2004
g) Microthrix abundance in pilot planto100»,
3 10
x X X X
F M \
x x K* I x
I \ s o
1 0
"0 1%
h)SVI250
- 200» 150
"g 100
50
0
D RFF
• \ \R
aa
B 5BT h fi
O N D J
2003 2004
ana a a
1 M
a RLI
• \\R
°oe 8Û# **<a^*
s « • s &fDD
X*
w*
9 û Sfj
nö a
. • «
Mn ftP
N D ? F
2003 2004
1) operating conditions of experimental phases
SRT[dDO [js,02 m
'
T^mpciature [ C
SRT [d]DO [js,02 m ';
r^mpciature [ C
© j © [ © ] ® [ | ® [ ©lOd
Rtl '0 30
20 t
1 1 1 11 I,,lOd
_a«====——_
ViR 20 30 m flli!lB 20 ,0 BBfcfflfrlIIIIIH20 c
20,11
20 ri"'."'i
.
1
D J 1
2003 2004
Figure 4-2: Operating conditions and chemical and biological analyses of pilot plant operation REF stands
for the plant operated at reference conditions, the VAR plant was operated at varying conditions The grey
shapes indicate the periods without waste sludge removal at the begin of each experimental phase, at the be¬
gin of phase 6 waste sludge withdrawal was switched off longer in the VAR plant (light grey shape) At the
begin of each new experimental phase, the VAR sludge was wasted and the REF sludge equally distributed to
both plants as indicated by vertical solid lines (in July 2004, due to unstable operation, the sludges were
mixed once again when sludge wasting starting)
45
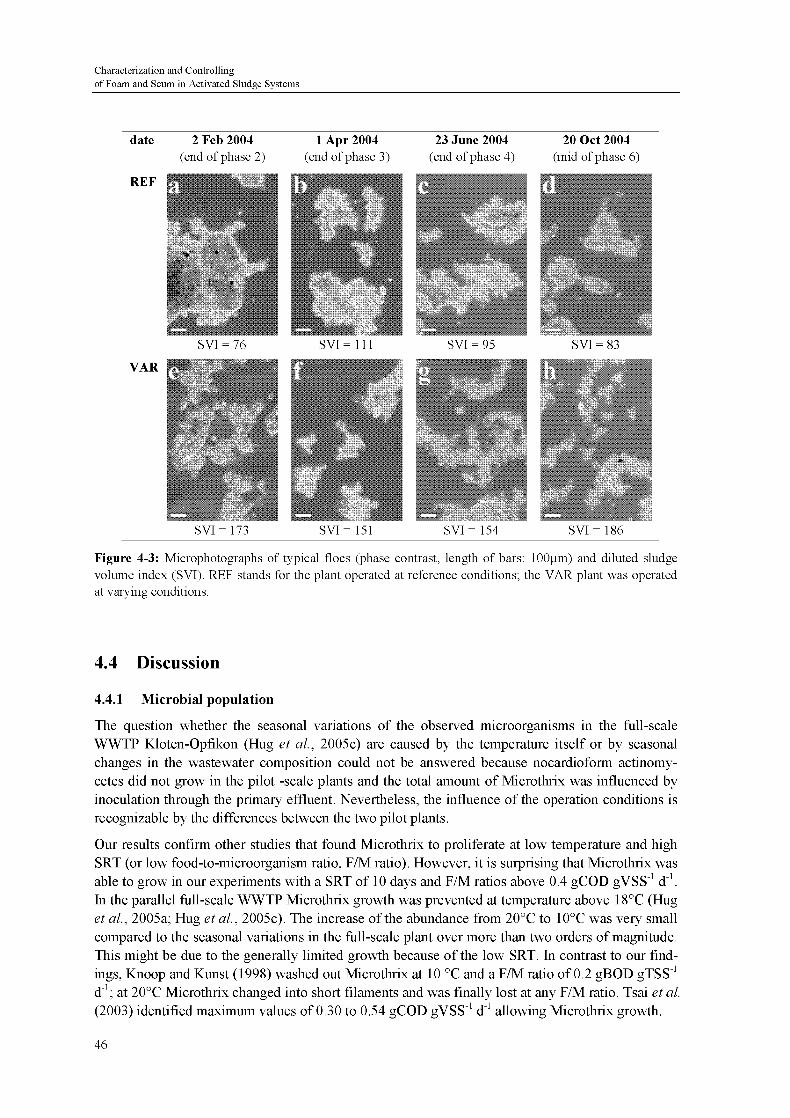
Characterization and Controllingof Foam and Scum in Activated Sludge Systems
date 2 Feb 2004 1 Apr 2004 23 June 2004 20 Oct 2004
(end of phase 2) (end of phase 3) (end of phase 4) (mid of phase 6)
Figure 4-3: Microphotographs of typical floes (phase contrast, length of bars: lOOum) and diluted sludgevolume index (SVI). REF stands for the plant operated at reference conditions; the VAR plant was operatedat varying conditions.
4.4 Discussion
4.4.1 Microbial population
The question whether the seasonal variations of the observed microorganisms in the full-scale
WWTP Kloten-Opfikon (Hug et al, 2005c) are caused by the temperature itself or by seasonal
changes in the wastewater composition could not be answered because nocardioform actinomy¬cetes did not grow in the pilot -scale plants and the total amount of Microthrix was influenced byinoculation through the primary effluent. Nevertheless, the influence of the operation conditions is
recognizable by the differences between the two pilot plants.
Our results confirm other studies that found Microthrix to proliferate at low temperature and highSRT (or low food-to-microorganism ratio, F/M ratio). However, it is surprising that Microthrix was
able to grow in our experiments with a SRT of 10 days and F/M ratios above 0.4 gCOD gVSS"1 d"1.
In the parallel full-scale WWTP Microthrix growth was prevented at temperature above 18°C (Huget al, 2005a; Hug et al, 2005c). The increase of the abundance from 20°C to 10°C was very small
compared to the seasonal variations in the full-scale plant over more than two orders of magnitude.This might be due to the generally limited growth because of the low SRT. In contrast to our find¬
ings, Knoop and Kunst (1998) washed out Microthrix at 10 °C and a F/M ratio of 0.2 gBOD gTSS"1d"1; at 20°C Microthrix changed into short filaments and was finally lost at any F/M ratio. Tsai et al
(2003) identified maximum values of 0.30 to 0.54 gCOD gVSS"1 d"1 allowing Microthrix growth.
46

Chapter 4
Unexpected Growth of "Microthnx parvicella" and no Correlation with Floe Structure and Foaming in a Pilot-Scale Activated SludgePlant
Completely unexpected is the steep increase of Microthrix abundance in the REF plant during the
last experimental phase (Figure 4-2g) when no inoculation occurred. It shows that Microthrix is
somehow able to grow extensively at SRT of 10 days, 20°C and a fairly high sludge load of above
0.5 gCOD gVSS"1 d1 (equivalent to > 0.2 gBOD gTSS"1 d"1). As REF conditions were supposed to
be always the same, unknown factors must have changed. It is striking that the increase started after
about two months of high nitrite concentrations in the effluent (Figure 4-2e). Incomplete nitrifica¬
tion and denitrification are suspected to favor Microthrix growth (Casey et al, 1999; Tsai et al,
2003), as Microthrix needs ammonium as nitrogen source and incomplete denitrification inhibit
heterotrophic bacteria due to intra-cellular accumulation of the denitrification intermediates NO
and N20. Microthrix is not affected because it is not able to reduce nitrite.
It has to be noted that many results from literature can only qualitatively be compared to our find¬
ings due to different wastewater composition and plant design leading to different availability of
specific substrate for Microthrix and to different substrate gradients in the plants. Furthermore, our
quantification method using FISH allows to detect lower concentrations and is able to recognizeMicrothrix inside the floes, compared to quantification by crystal violet staining (Knoop and Kunst,
1998) or SVI (Casey et al, 1999; Tsai et al, 2003). Accordingly, to investigate the validity of the
hypotheses by Casey et al (1999) and Tsai et al (2003) further specific experiments with the same
plant design and bacteria quantification methods should be performed.
4.4.2 Foaming
Foaming occurred only during the experimental phase with considerably increased solids concen¬
tration. This is in accordance with our findings that the foaming potential of activated sludge is in¬
creasing with the solids concentration (Hug etal, 2006). De los Reyes III and Raskin (2002) postu¬
lated a threshold concentration of nocardioform actinomycetes that is needed to induce foaming,
arguing that the absolute hydrophobic surface controls the foaming potential rather than the frac¬
tion of hydrophobic bacteria. However, in our results there were periods without foaming but with
higher absolute Microthrix concentration than during the foaming period, e.g. in the REF plant dur¬
ing the last experimental phase (Figure 4-2g). This finding as well as the measured foaming poten¬
tial indicates that Microthrix abundance is not necessary or not sufficient for foaming, confirmingthe observations in the parallel full-scale WWTP (Hug et al, 2005c). Accordingly, other sludge
properties must be controlling foam formation.
4.4.3 Floe structure
In literature about bulking sludge and filamentous bacteria it is often implicitly assumed that highSVI is equal to a large number of filaments and sometimes even that it is equal to high Microthrix
abundance. However, in our experiments, SVI and floe structure were not correlated with Mi¬
crothrix abundance; it rather seems that floes deteriorate at low temperature and particularly at low
DO (Figure 4-2h and Figure 4-3). The fact that under low DO conditions open floe structure devel¬
oped quickly, leads to the suggestion that the floe is self organizing to optimize diffusion.
In most studies on bulking, SVI is used as quantitative measurement. This is reasonable because it
is a simplified measurement of the problem in the plant, i.e. the sedimentation of the sludge in the
clarifier. However, SVI represents the effect (quality of sedimentation) but does not differentiate
the mechanisms behind; poor sedimentation may be caused by filaments protruding from the floes
but also by open floe structure or by other reasons (Wanner, 1994). Accordingly, our results dem¬
onstrate that further information from microscopic examination including filament identification is
47

Characterization and Controllingof Foam and Scum in Activated Sludge Systems
essential to clarify the reasons of a high SVI. If possible, filament quantification should be based on
fluorescence in-situ hybridization (Wilderer et al., 2002; Hug et al., 2005b).
4.5 Conclusions
To investigate the seasonally alternating occurrence of the filamentous bacteria "Microthrix par¬
vicella" (Microthrix) and nocardioform actinomycetes and to study their role in bulking and foam¬
ing, two parallel pilot-scale activated sludge plants were operated, fed with the same wastewater as
the full-scale plant in which the phenomena were first observed (Hug et al, 2005c).
The results of the pilot-scale studies are in contrast to suggestions by other studies:
• It is generally possible to suppress the suspected foam forming bacteria Microthrix and nocar¬
dioform actinomycetes in completely mixed reactors with a total SRT of 10 days and 33% an¬
oxic volume. But in one experiment Microthrix was able to grow to high concentration under
just these operating conditions even at 20°C, which is in contrast to reports from other authors,
but as discussed above, must be seen in connection with inhibited nitrification or denitrification
• Foaming was not connected to Microthrix abundance. It occurred when the solids concentra¬
tion increased.
• Neither floe structure nor sludge volume index (SVI) was correlated with Microthrix but with
operating conditions: At low temperature and particularly at low dissolved oxygen concentra¬
tion floes of an open structure developed and accordingly SVI increased.
Based on these findings, the following conclusions regarding future research can be drawn:
• Future research efforts on sludge settleability should not only focus on filamentous bacteria but
also on other factors affecting floe structure. SVI is a suitable measure for sludge settleability,but to elucidate the reasons for a high SVI or to quantify filamentous bacteria, microscopic
analyses are essential.
• In systems exposed to the naturally occurring dynamics ofthe wastewater flow and composi¬tion the knowledge of the actual environmental conditions for the bacteria will always be in¬
complete. Moreover, in many plants there is the possibility of incomplete mixing that provides
ecological niches which are not identified by routine analyses. However, we think that investi¬
gations in systems exposed to the natural variability of conditions are necessary to clarifywhich findings from studies in reproducible systems, such as pure culture studies and experi¬ments with continuously fed artificial wastewater, are valid under the competition in real sys¬
tems.
4.6 Acknowledgements
We are grateful to the WWTP Kloten-Opfikon, its manager Christoph Liebi and the staff members,
for financial, technical and analytical support. We would also like to thank Elke Hinz, Justyna Oko¬
lowicz and Mandy Ziranke for their engagement in construction and operation of the pilot plants as
well as for contribution in FISH analysis. This project was performed in the framework of COST
action 624.
48
Chapter 5
Modeling Seasonal Dynamics of "Microthrixparvicella"
Thomas Hug, Willi Gujer, Hansruedi Siegrist
oral presentation at 4 IWA Activated Sludge Population Dynamics
Specialist Conference, Surfers Paradise, QLD, Australia. (2005)
submitted to Water Science and Technology
Abstract
The filamentous bacteria "Microthrix parvicella" can cause serious bulking and scumming in wastewa¬
ter treatment plants (WWTP) all over the world. Decades of research have identified Microthrix as
specialized lipid consumer but could not clarify the processes that allow this organism to successfully
compete in activated sludge systems. In this study we developed a model, based on ASM3, that de¬
scribes the pronounced seasonal variations of Microthrix abundance observed in a full-scale WWTP.
We hypothesize that low temperatures reduce the solubility of lipids and inhibit their uptake by non-
specialized bacteria. The presented model structure and parameters successfully fit the measured data;
however they do not necessarily reflect the only and true selection mechanism for Microthrix. This
model is not yet to be used for prediction; it is rather a valuable research tool to coordinate the discus¬
sion and plan future research activities in order to identify the relevant selection mechanisms favoringMicrothrix in activated sludge systems.
5.1 Introduction
The filamentous bacterium candidates "Microthrix parvicella" (in the paper referred as Microthrix)
is associated with serious operational problems in many wastewater treatment plants (WWTP) all
over the world. Its long filaments cause serious bulking and its hydrophobic cell surface might
cause or support the formation of stable scum.
Microthrix is a slowly growing specialized lipid consumer and is able to store them under aerobic,
anoxic and anaerobic conditions (Slijkhuis, 1983; Andreasen and Nielsen, 2000). Lipids seem to be
preferentially available for Microthrix due to specific sorption onto the hydrophobic cell walls, di¬
gestion by cell surface associated extracellular enzymes and released bio-surfactants. Further hy¬
potheses focus on the need for reduced S and N and on the role of incomplete nitrification and de¬
nitrification (Tsai et al, 2003). The filamentous morphology might be another advantage in the
competition for substrate. Interestingly, Microthrix prefers low temperatures, below about 15°C
49
Characterization and Controllingof Foam and Scum in Activated Sludge Systems
(Eikelboom et al, 1998; Knoop and Kunst, 1998), and often occurs in distinct seasonal variations
(Eikelboom, 1994; Miana etal, 2002; Hug etal, 2005c).
Despite decades of research it is still unknown what mechanisms allow Microthrix to successfully
compete against faster growing bacteria in activated sludge. In order structure the finding and hy¬
potheses, to coordinate the discussion and to identify fürther research needs, we propose the use of
mathematical modeling. Several approaches have been made to model the competition between
floc-forming and filamentous bacteria (reviewed by Martins et al, 2004), but only few attempts
were presented to model Microthrix growth. To our knowledge, no model structure has been pub¬lished to investigate the seasonal variations of Microthrix. We expect that studying dynamic varia¬
tions of its abundance, in contrast to its general (quasi steady state) occurrence or absence, will
provide new insights into the mechanisms allowing Microthrix to successfully compete in activated
sludge systems.
In this study we developed a mathematical model that is able to simulate the seasonal pattern of
Microthrix abundance we observed in a full-scale WWTP (Hug et al, 2005c). To distinguish the
influence of the wastewater composition from the substrate affinity, we implemented the hypothe¬sis that low temperature decreases the solubility of lipids and reduce their availability for most bac¬
teria, while Microthrix as a specialized lipid consumer is less inhibited. The model is not to be used
for prediction; it has rather been developed as research tool to identify key mechanisms leading to
excessive Microthrix growth. This paper describes the model structure which is based on the acti¬
vated sludge model no 3 (ASM3; Gujer et al, 1999), presents first results and suggests further de¬
velopments and applications.
5.2 Methods
5.2.1 Model structure
Allowing the model to be widely used as coordinating research tool, its structure has to be simple,well known and flexible. Therefore, this model is based on ASM3 (Gujer et al, 1999) that reflects
the state of the art ofmodeling activated sludge systems.
ASM3 describes heterotrophic growth (Figure 5-1) as a linear series of processes: hydrolysis of
particulate substrate (Xs) leads to soluble substrate (Ss) that is internally stored by the heterotrophicbiomass (XH) which only grows on the stored products. Cell decay is modeled as endogenous respi¬ration of bacteria XH and stored substrates XST0, where XH is partially converted to inert particulate
COD (Xt). All these processes occur aerobically and anoxically (reduced by a reduction factor t)no,
see Table 5-2); anaerobic processes are not part of ASM3.
Microthrix growth was modeled according to the heterotrophic growth in ASM3 (Figure 5-1 and
Table 5-1). We introduced as new compounds particulate and soluble lipids (XLIP and SLrP), internal
lipid storage XSTOlip and Microthrix biomass XMIC, and as new processes lipid hydrolysis, storage
of lipids by heterotrophic biomass and by Microthrix, Microthrix growth and endogenous respira¬tion of Microthrix and its stored lipids. Microthrix growth on stored lipids was assumed to be obli¬
gate aerobic (Slijkhuis, 1983; Rossetti et al, 2002), all other processes occur also under anoxic
conditions.
Xs, Ss and XLrP but not Slip occur in the wastewater as we assumed all lipids to be particulate, ad¬
sorbed to particles or immediately adsorbing to the activated sludge when entering the plant.
50
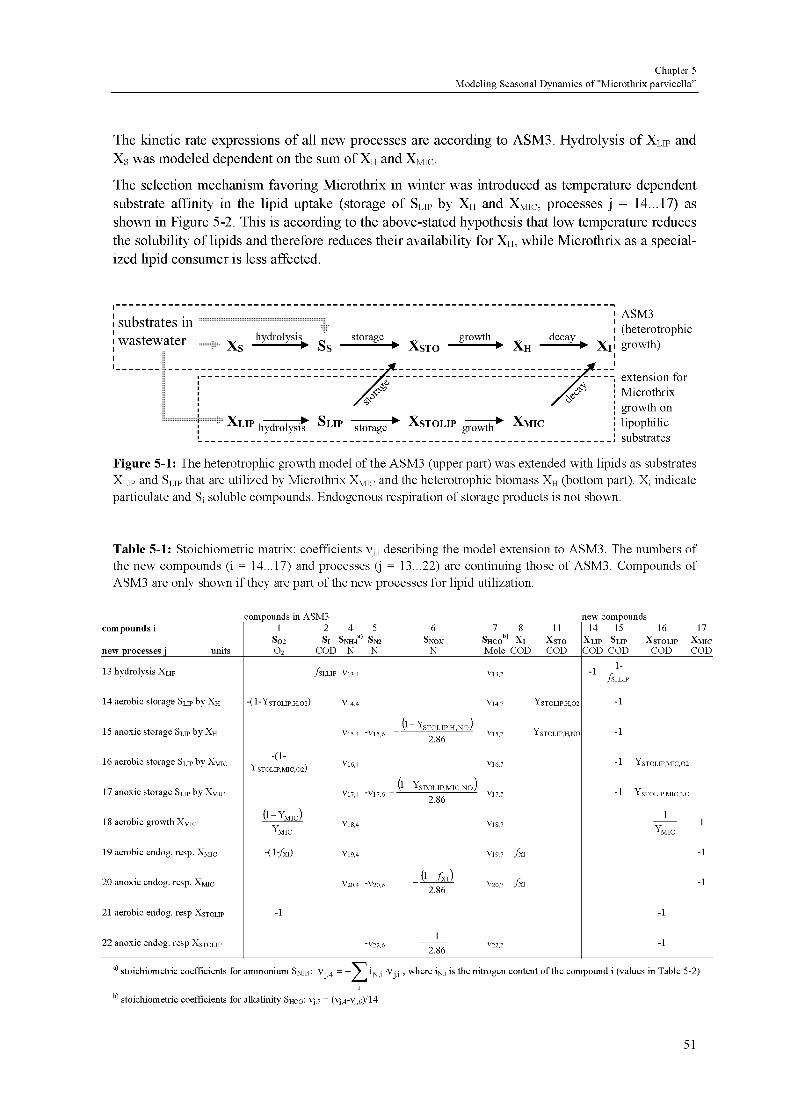
Chapter 5
Modeling Seasonal Dynamics of "Microthrix parvicella"
The kinetic rate expressions of all new processes are according to ASM3. Hydrolysis of XLrP and
Xs was modeled dependent on the sum ofXH and XMic-
The selection mechanism favoring Microthrix in winter was introduced as temperature dependentsubstrate affinity in the lipid uptake (storage of Slip by XH and XMic, processes j = 14... 17) as
shown in Figure 5-2. This is according to the above-stated hypothesis that low temperature reduces
the solubility of lipids and therefore reduces their availability for XH, while Microthrix as a special¬ized lipid consumer is less affected.
substrates in
wastewater hydrolysis^ storage^
growth^
As > »s Asto *" Ahdecay
> Xi
ASM3
(heterotrophic
growth)
extension for
Microthrix
growth on
lipophilicsubstrates
Figure 5-1: The heterotrophic growth model of the ASM3 (upper part) was extended with lipids as substrates
XLIP and SLIP that are utilized by Microthrix XMIC and the heterotrophic biomass XH (bottom part) X! indicate
particulate and S! soluble compounds Endogenous respiration of storage products is not shown
Table 5-1: Stoichiometric matrix coefficients vhl describing the model extension to ASM3 The numbers of
the new compounds (l = 14 17) and processes (j = 13 22) are continuing those of ASM3 Compounds of
ASM3 are only shown if they are part of the new processes for lipid utilization
compounds in ASM3 new compounds
compounds i 1 2 4 5 6 7 8 11 14 15 16 17
So2 Si t; a)ÖNH4 Sn2 Snox ÖHCO Xi XsTO Xlip Slip Xstolip Xmic
new processes j units o2 COD N N N Mole COD COD COD COD COD COD
13 hydrolysis Xlip /si LIP V134 Vl3 7-1
1-
/siLIP
14 aerobic storage Slip by Xh -(l-YsTOLIPH,02) Vl4 4 Vl4 7 YsTOLIP H 02 -1
15 anoxic storage Slip by Xh V154 -Vl5 6
(1 ~~ YsTOLIP H NO J
2 86Vl5 7 YsTOLIP UNO -1
16 aerobic storage Slip by Xmic-(l-
YsTOLIP MIC 02)Vl6 4 Vl6 7
-1 YsTOLIPMIC02
17 anoxic storage Slip by Xmic Vl7 4 -Vl76(1- YsTOLIP MIC NO/
2 86Vl7 7 -1 YsTOLIPMICNO
18 aerobic growth Xmic(1-Ymic)Ymic
Vl8 4 Vl8 7
1
Ymic
19 aerobic endog resp Xmic -(1-Zxi) Vl9 4 V197 /xi -1
20 anoxic endog resp Xmic V20 4 -V2O6(l-/xi)2 86
V20 7 /xi -1
21 aerobic endog resp Xstolip -1 -1
22 anoxic endog resp Xstolip -V226
1
2 86V22 7 -1
' stoichiometric coefficients for ammonium Snh4 V, 4—
— > iNl v„, where ini is the nitrogen content of the compound 1 (values in Table 5-2)
' stoichiometric coefficients for alkalinity Shco v, 7= (v, 4-v, öV 14
51

Characterization and Controllingof Foam and Scum in Activated Sludge Systems
PSTOLIPH
-STOLIPMIC-K,
^STOLIPMIC I U1-MIC
^02 MIC+ ^02 V^-SLIP MIC + *LIP/
with Kslipi(T) = Kslipi(20°C) ^(©tkslipi (T-20°C))
10
a^ 08o ^
& on
&+&06l
§^.0411«021
00
20°C 10°C
*<
s
-.X
y
/
/
1
f X
0 10 20
Slip
30 10 20
Slip
30
Figure 5-2: Seasonal variation of the lipid affinity is expressed by temperature dependent saturation coeffi¬
cients KSLIP)1 (processes j=14 17, the expressions for the anoxic storage are corresponding to the shown
equations) The parameters m Table 5-2 lead to a highly reduced substrate affinity of the heterotrophic bio¬
mass compared to Microthrix m winter but no difference m summer
5.2.2 Model parameters
The stoichiometric and kinetic parameters for the ASM3 part of the model were taken from the
calibration for Swiss municipal wastewater (ASM3swiss) by Koch et al (2000). The parameters of
the presented model extension for Microthrix growth are shown in Table 5-2. Parameters that could
not be assumed from literature about Microthrix growth were set according to the corresponding
parameters in ASM3swiss.
The newly introduced compounds XLIP, SLrP and XSTOllp were modeled as oleic acid (Ci8H3402, mo¬
lecular weight: 282 g mol"1, COD content: 816 gCOD mol"1), since this was mainly used for growth
experiments with Microthrix.
The maximum growth rate of Microthrix |uMIC and its temperature coefficient 0T were obtained
from data published by Rossetti et al (2002). The yield coefficient for Microthrix growth on stored
lipids (Ymic) was derived from chemostat experiments by Slijkhuis (1983) who found a maximum
yield of 1.41 g biomass g"1 oleic acid. Transferred to the presented model structure, those experi¬ments represent the combination of storage and growth (j = 16 and 18). Extrapolating from the pub¬lished data a lipid content of 30% (as dry mass) or 55% (as COD) and assuming an aerobic yieldfor storage YSTOlip,mic,o2 = 0.85 XSTOlip Slip"1 (as COD), we calculated the yield of Microthrix
growth to Ymic,o2 = 0.80 XMic Xstolip"1 in COD units. This value is identical to YH,o2 in
ASM3swiss. The anoxic yield YSTOlip,mic,no was set corresponding to the ratio of anoxic to aerobic
storage yield of the heterotrophic biomass (Table 5-2).
During manual calibration (see below), the parameters defining the lipid affinity of the bacteria
(Kslip,h , KSLrp,Mic and the corresponding temperature coefficients 0T) were set to the values in
Table 5-2.
5.2.3 Wastewater composition
The wastewater composition used in the presented simulation (Table 5-3) is typical for the investi¬
gated WWTP. The COD fractions were chosen according to ASM3swiss (Koch et al, 2000). In the
studied wastewater we found 12-14 g m"3 lipids, corresponding to 13-27% of the total COD (pen-tane extraction, gravimetric analysis; three 24h composite samples in March 2004). Thus, we set
the lipids XLrp to 20% of the total influent COD. The new compound XLrp is a fraction of Xs in
ASM3; consequently, in the new model Xs is reduced accordingly to keep the total COD in the
52

Chapter 5
Modeling Seasonal Dynamics of "Microthrix parvicella"
wastewater unchanged As total COD concentration in the wastewater measured data were used
(24h composite samples) The chemical phosphorous precipitation in the activated sludge tank was
modeled by introducing precipitation products (as mixture of FeP04 and Fe(OH)3) as separate inert
compound in the wastewater (XPrecip)
Table 5-2: Model parameters for stoichiometry and kinetics of the model extension to ASM3 for Microthrix
growth All parameters of the ASM3 part and most of the extension were set according to the calibration of
ASM3 (Koch et al, 2000) performed for Swiss municipal wastewater (ASM3swiss)
description symbolvalue
20oC» ©/'
stoichiometric parameters
production of Si in hydrolysis
aerobic yield of storage of Slip by Xh
anoxic yield of storage of Slip by Xh
aerobic yield of storage of Slip by Xmic
anoxic yield of storage of Slip by Xmic
aerobic yield of Microthrix growth on Xstolip
production of Xi in endogenous biomass respiration
nitrogen content of Xs
nitrogen content of Xlip, Slip and Xstolip
TSS to COD ratio of XUP and Xstolip
TSS to COD ratio of Xi
TSS to COD ratio of Xs
TSS to COD ratio of Xh, Xa, XMic
kinetic parameters
Hydrolysis rate constant of Xlip
Hydrolysis saturation constant of Xlip
reduction factor for anoxic storage and growth
aerobic lipid storage rate constant Xh (Slip^Xsto)
aerobic lipid storage rate constant Xmic (Slip_>Xstolip)
substrate saturation constant for storage Slip _> Xsto
substrate saturation constant for storage Slip _> Xstolip
oxygen saturation/inhibition constant for Microthrix
nitrate saturation constant for Microthrix
maximum growth rate Microthrix
stored lipids saturation constant for growth of Xmic
ammonium saturation constant for growth of Xmic
alkalinity saturation constant for growth of XmicIi
aerobic endogenous respiration rate of Microthrix Xmic
anoxic endogenous respiration rate of Microthrix Xmic
aerobic respiration rate of stored lipids Xstolip
anoxic respiration rate of stored lipids Xstolip
/si gSi g Xlip 0 00
YsTOLIP H 02 gXsTO g Slip 0 80
YsTOLIPHNO gXsTO g Slip 0 70
YsTOLIP MIC 02 gXsTOLip g Slip 0 85
YsTOLIP MIC NO gXsTOLip g Slip 0 74
Ymic gXMic g Xstolip 0 80
/xi MIC gXi g Xmic 0 20
iNXS gNg'COD 0 05b)
in lip gNg'COD 0 00
its xlip gTSg'COD 0 346
its xi gTSg'COD 0 75
iTSXS gTSg'COD 0 98b)
its xbm gTSg'COD 0 90
kHLIP d1 9 00
Kxlip gXLIP g (Xh+Xmic) 100
T)N0- 0 50
ksTOLIP H gSLip g 'XH d'
12 00
ksTOLIP MIC gSLip g Xmic d 12 00
KsLIP H gCOD m3
10 00
KsLIP MIC gCOD m3
10 00
Ko2 MIC^ 3
g02m 0 016
Knomic gNm3 0 04
1-lMICd1 0 42
KsTOLIP gXsTO m3
0 10
Knhmic gNm3 001
Khco MIC mole m 0 10
bMIC02 d1 0 042
bMICNO d1 0 021
bsTOLIP 02 d1 0 042
bsTOLIPNO d1 0 021
0 04
0 07
0 07
-0 4
00
0 105
0 07
0 07
0 07
0 07
ASM3swiss /si = 0
ASM3swiss Ysto 02= 0 8
ASM3swiss Ysto 02= 0 7
see text, ASM3swiss YSTo 02= 0 8
see text, ASM3swiss Ysto 02= 0 7
derived from Slykhuis (1983)
ASM3swiss /xi = 0 20
ASM3swiss iNxs= 0 03
as oleic acid
as oleic acid
equal to ASM3swiss
ASM3swiss iTsxs= 0 75
equal to ASM3swiss
ASM3swiss kH = 9 0 (g>r=0 04)
ASM3swiss Kx = 1 0
equal to ASM3swiss
ASM3swiss ksTo = 12 (6T = 0 07)
ASM3swiss ksTo = 12 (6T = 0 07)
calibration, ASM3swiss Ks = 10 (0 00)
calibration, Rossetti et al (2002) Ks = 4
Slykhuis (1983)
Kno MIC= Kno H K02 MIc/Ko2 H
derived from Rossetti et al (2002)
ASM3swiss Ksto = 0 10
ASM3swiss Knh=0 01
ASM3swiss Khco = 0 10
1>MIC 02= hü 02 LLmic /llh
bMICNO = biLNO llmic/llh
bsTOLIP 02= bsTO 02 f^MIC /^H
bsTOLIPNO = bsTONO f^MIC/^H
vexponential temperature dependence value(T) = value(20°C) exp(0T (T-20°C))
b)corresponding to the ratio XLip/Xs in the wastewater = 0 57 (Xlip = 20% of total COD, Table 5-3)
c)Xbm = Xh + XMc (as COD)
53

Characterization and Controllingof Foam and Scum in Activated Sludge Systems
Table 5-3: Composition of the modeled wastewater (a) COD fractionation, (b) concentrations
a) fractioiis of total COD
ASM3swiss this model
b) concentrations
total COD data, average== 160 gCODn
Si 6% 6% -^-Precip 10 gTS m"3
Ss 10% 10% NH4+ 22 gNm"3Xi 20% 20% N03" + N02 5 gNm"3Xs 55%
^- 35% N2 0 gNm"3
XsTO 0% \
9%
l 0%
\ 9%
Alkalinity 7 mole rrT
XH
xA 0% V 0%
Xlip 20%
Xstolip - 0%
Xmic - 0%
5.2.4 Plant layout
The model was applied to the WWTP Kloten-Opfikon in Switzerland, treating the wastewater of
54,000 population equivalents. The plant was modeled as one anoxic tank of 1867 m3 followed bythree aerobic tanks of 1244 m3 each. The sludge blanket in the secondary clarifier was considered
as anoxic compartment of 560 m3. The plant was operated at a total sludge residence time of about
15 days; for the simulation, measured data were used. Dissolved oxygen concentration in the aero¬
bic compartments was kept constant at 3 g02 m"3. The wastewater flow was set constant at 18,000
m3 d"1. The measured temperature (moving average over three days) at the influent to the biological
stage was used for the simulation (Figure 5-3a).
5.2.5 Quantification of Microthrix
The abundance of Microthrix was measured by in-situ fluorescence hybridization (FISH), using the
probes MPA223 and MPA645 (Erhart et al, 1997). The quantification was done as described by
Hug et al (2005b) resulting in "pixel concentration", a measure of the ratio of Microthrix bio-
volume to the apparent total floc-volume. The values are quantitatively comparable among them¬
selves although the absolute numbers do not represent a real concentration.
As target model results to be compared with the measured Microthrix abundance, the ratio of Mi¬
crothrix solids to total suspended solids (XTSMIC XTS_1) was calculated according to equations 1 and
2, where iTS>1 are the conversion factors from COD to total suspended solids as gTS gCOD"1 and Xjthe concentrations ofthe particulate COD compounds as gCOD m"3 (Table 5-2).
Xjs.mic = Its.xlip'Xstolip + Its.bm'Xmic (1)
Xjs = Its.xs'Xs + Its.xsto'Xsto + 1ts,xlip'(Xlip+Xstolip) + 1ts,bm"(Xh+Xa+Xmic) + 1ts,xtXi + Xprecip (2)
5.2.6 Calibration
The goal of the manual calibration was to simulate a population variation of the same shape and
relative amplitude as measured (the absolute numbers of the two quantification scales are not di¬
rectly comparable). In a first step, TSS was adjusted by choosing a reasonable phosphorous precipi¬tation (XPrecip). In order to test the hypothesis, we kept the lipid fraction in the wastewater constant
and calibrated the model by changing KSLIPMIC(20°C) and ©t.slip.h- hi order to changed the relative
difference between the lipid affinity of Microthrix and the other heterotrophic organisms, we set
©t.slip.mic = 0 and KSLIp,H(20°C) = KS3(20°C) (Table 5-2).
54
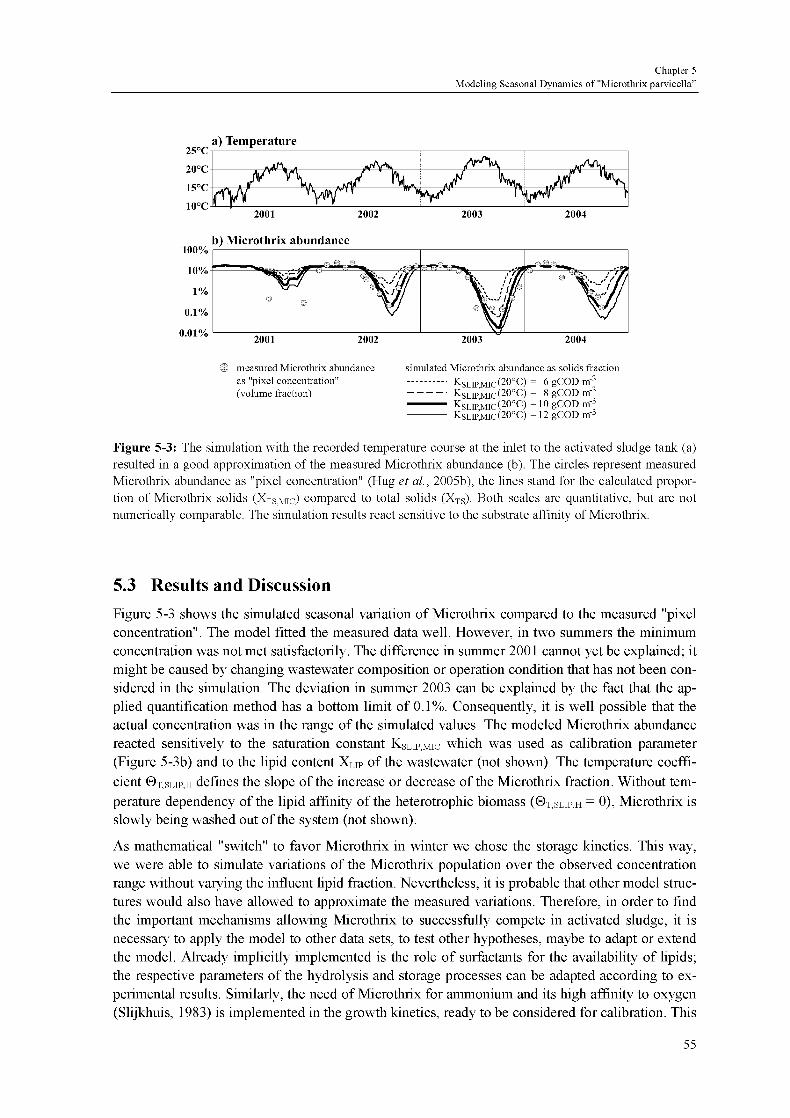
Chapter 5
Modeling Seasonal Dynamics of "Microthrix parvicella"
25°Ca) Temperature
100%
10%
1%
0.1%
0.01%
2001 2002
b) Microthrix abundance
2003 2004
ill 1 111 II11^ , ,-53
^^ÈT-i^V ^&\ î'iïf ^k.- i' i/l,\c III
o W/O
ooVo el
"HP"'//
Vkj/I
2001 2002 2003 2004
O measured Microthrix abundance
as "pixel concentration"
(volume fraction)
simulated Microthrix abundance as solids fraction
KSLn,MIC(20°C) = 6gCODm-3KSLn,MIC(20°C) = 8gCODm-3KSLn,MIC(20°C) = 10 gCOD m-3
Kslip,mic(20oC) = 12 gCOD m3
Figure 5-3: The simulation with the recorded temperature course at the inlet to the activated sludge tank (a)
resulted in a good approximation of the measured Microthrix abundance (b) The circles represent measured
Microthrix abundance as "pixel concentration" (Hug et al, 2005b), the lines stand for the calculated propor¬
tion of Microthrix solids (XTSMIC) compared to total solids (XTS) Both scales are quantitative, but are not
numerically comparable The simulation results react sensitive to the substrate affinity of Microthrix
5.3 Results and Discussion
Figure 5-3 shows the simulated seasonal variation of Microthrix compared to the measured "pixelconcentration". The model fitted the measured data well. However, in two summers the minimum
concentration was not met satisfactorily. The difference in summer 2001 cannot yet be explained; it
might be caused by changing wastewater composition or operation condition that has not been con¬
sidered in the simulation. The deviation in summer 2003 can be explained by the fact that the ap¬
plied quantification method has a bottom limit of 0.1%. Consequently, it is well possible that the
actual concentration was in the range of the simulated values. The modeled Microthrix abundance
reacted sensitively to the saturation constant KSLrpMic which was used as calibration parameter
(Figure 5-3b) and to the lipid content XLTP of the wastewater (not shown). The temperature coeffi¬
cient ©t.slip.h defines the slope of the increase or decrease of the Microthrix fraction. Without tem¬
perature dependency of the lipid affinity of the heterotrophic biomass (©t.slip.h = 0), Microthrix is
slowly being washed out ofthe system (not shown).
As mathematical "switch" to favor Microthrix in winter we chose the storage kinetics. This way,
we were able to simulate variations of the Microthrix population over the observed concentration
range without varying the influent lipid fraction. Nevertheless, it is probable that other model struc¬
tures would also have allowed to approximate the measured variations. Therefore, in order to find
the important mechanisms allowing Microthrix to successfully compete in activated sludge, it is
necessary to apply the model to other data sets, to test other hypotheses, maybe to adapt or extend
the model. Already implicitly implemented is the role of surfactants for the availability of lipids;the respective parameters of the hydrolysis and storage processes can be adapted according to ex¬
perimental results. Similarly, the need of Microthrix for ammonium and its high affinity to oxygen
(Slijkhuis, 1983) is implemented in the growth kinetics, ready to be considered for calibration. This
55

Characterization and Controllingof Foam and Scum in Activated Sludge Systems
allows to study the role of seasonally incomplete nitrification. The suggested inhibition of Mi¬
crothrix by high long chain fatty acid (LCFA) concentrations (Slijkhuis, 1983) can easily be intro¬
duced by an additional Monod term. More complex becomes a model including incomplete denitri¬
fication that might also play a role for seasonal variations of Microthrix (Tsai et al, 2003). To
study the often observed dominance of Microthrix in bio-P plants, anaerobic conditions could be
modeled with a similar extension to the bio-P module to ASM3 (Rieger et al, 2001). It could also
be interesting to introduce nocardioform actinomycetes as other specialized lipid consumer. As the
model result is highly sensitive to inoculation of Microthrix into the system, the introduction of a
scum layer might be another promising way to go.
The fact that a quite extreme temperature dependency of the lipid affinity of the heterotrophic bio¬
mass was needed to calibrate the model leads to the suggestion that not mainly the solubility of the
lipids is responsible for the variation, as assumed in our primary hypothesis, but rather a population
change within the heterotrophic biomass towards bacteria that are less able to utilize lipids. This
point should be addressed in future research.
The lipid fraction in the wastewater is relevant for the amount of Microthrix in the system. This
concentration can not easily be measured as it is not representing one particular substance. Choos¬
ing XLIP is part of the calibration procedure for a particular wastewater. Nevertheless, to estimate
the concentration XLIP, a standardized and simple method for measuring lipids should be found.
Suitable techniques could be the extraction with a hydrocarbon or measuring the ratio of particulateCOD to total suspended solids.
5.4 Conclusions
Despite decades of research, it is still unclear how Microthrix successfully competes in activated
sludge systems. Investigating the observed seasonal variations of its abundance will provide new
insights and is therefore a promising way to identify the relevant mechanisms.
In the presented study, we developed a model extension to ASM3 which is able to simulate the
measured seasonal variations of Microthrix abundance over more than two orders of magnitude.The selection mechanisms favoring Microthrix in winter was modeled only by a reduced affinity of
the heterotrophic biomass to lipids, while the wastewater composition was kept constant.
Of course, this model is not yet to be used for prediction; it has rather been developed as a tool to
structure the findings and hypotheses in the literature, to coordinate the discussion and to plan fur¬
ther research activities. As innovation often happens trough regular alternation between experi¬
menting and modeling, we recommend to apply (and adapt) this model to further data sets in order
to identify key processes that cause excessive Microthrix growth.
5.5 Acknowledgements
We thank Leiv Rieger for his engagement in helpful discussions. This project was performed in the
framework of COST action 624.
56

Chapter 6
The Foaming Potential ofActivated Sludge
Thomas Hug, Robert Downie, Elke Hinz, Justyna Okolowicz,
Mandy Ziranke, Willi Gujer, Hansruedi Siegrist
submitted to Water Research (May 2006)
Abstract
Activated sludge foaming is a serious operational problem in wastewater treatment plants (WWTP) all
over the world. To investigate the actual foam formation independently from the hydraulic and opera¬
tional conditions in a particular WWTP, we developed a robust foam test procedure. It is based on two
different principles of gas bubble production and on the separation of the solid and liquid fraction of
the sample. The different measuring scales of these tests were well correlated. Applying the procedureto samples from several pilot and full scale WWTPs in Switzerland revealed a general increase of the
foaming potential with the solids concentration. Interestingly, mixed liquor from conventional acti¬
vated sludge was hardly foaming, while resuspended foam samples from conventional plants and sam¬
ples from membrane bioreactors (MBR) exhibited a high foaming potential. Furthermore, the critical
role of the solids, in contrast to the sludge liquid, could be demonstrated. In contrast to our expecta¬
tions, the foaming potential was not correlated with the abundance of the filamentous bacteria "Mi¬
crothrix parvicella", with the sludge volume index or with the foam coverage of the activated sludgetanks. The uncertainty and suitability of the tests and the consequences of our findings for foam con¬
trol are discussed.
6.1 Introduction
The formation of a stable foam layer on activated sludge basins, secondary clarifiers or anaerobic
digesters has become a widespread nuisance in wastewater treatment plants (WWTPs) all over the
world. It causes serious operating problems, increases maintenance and may lead to poor effluent
quality. Although this phenomenon has been known for decades and is gaining further importancein nutrient removal plants, the actual mechanisms producing and stabilizing the foam are not yet
fully clarified. There are still no reliable control strategies.
It is generally assumed that the formation and stabilization of foam requires gas bubbles, surfac¬
tants and hydrophobic particles. Gas bubbles are present in the system as air bubbles in the aeration
tanks or as nitrogen gas in the anoxic tank. Surfactants are present in wastewater, but are also pro¬
duced by the microorganisms. The hydrophobic particles are usually thought to be microorganisms
57

Characterization and Controllingof Foam and Scum in Activated Sludge Systems
with hydrophobic cell surfaces. The filamentous bacteria "Microthrix parvicella" (in the paper re-
fened to as Microthrix) and different types of nocardioform actinomycetes are often suspected to
play an important role in foaming. However, the problem is highly dynamic and seems to be plant
specific. This led to many confusing and partially contradicting findings in the literature and plentyof different anecdotal knowledge.
The observable foam coverage on activated sludge tanks is not solely a result of the sludge proper¬
ties but highly influenced by the plant layout and operation (e.g. trapping of the foam in certain
parts of the plant). Therefore, different types of "foam tests" have been developed in the past to
measure the foaming potential of a particular sludge sample under reproducible laboratory condi¬
tions. The test procedures basically differ in the type of gas production and measurement scales.
Most procedures are based on one of the following references: Aerating the sample with fine bub¬
ble diffusers, Pretorius and Laubscher (1987) separated all floatable solids, Goddard and Forster
(1987) measured the decay of the foam after stopping aeration, Khan and Forster (1990) measured
the development and decay of the foam, and Blackall et al. (1991) developed an arbitrary rating
system based on foam height, appearance and stability. Ho and Jenkins (1991) used Alka-Seltzer
effervescent tablets to produce fine gas bubbles and measured the maximum foam height of surfac¬
tant solutions; this procedure was later applied to activated sludge samples by Oerther et al (2001).
Results obtained with such tests are usually varying in a wide range. It is often unclear, whether the
variation is caused by the test procedure or by unknown sludge characteristics. Therefore, we de¬
veloped a robust test procedure that is based on two different test principles derived from Blackall
et al. (1991) and Ho and Jenkins (1991). This should simulate the different types of foaming in an¬
oxic and aerated reactors and allow to assess the comparability of different measuring scales repre¬
senting the foaming potential. We applied the new method to numerous samples from different
conventional WWTPs and membrane bioreactors (MBR), with particular focus on clarifying the
role ofthe solid and liquid fraction of the activated sludge for foaming.
6.2 Methods
6.2.1 Samples
Grab samples from mixed liquor (near the end of the aeration basins) and from compact foam lay¬
ers on the anoxic tank were taken from several conventional activated sludge plants (CAS) and two
membrane bioreactors (MBR) as shown in Table 6-1. All plants were fed with municipal or partlyindustrial wastewater in the naturally occuning dynamics. In all of them, periods with and without
foam coverage of the reactors occuned.
Table 6-1: Wastewater treatment plants from where samples were analyzed
name1' design scale PE2' SRTtot3)CASAI pre-denitnfication full 54,000 12- 18d
CASA2 pre-denitnfication, two parallel lanes pilot 2 each 10/20d
MBR A denitrification, partial EBPR4) pilot 100 30-70d
CASB EBPR4) (AAO design) full 130,000 20 - 50 d
CASC pre-denitnfication pilot 200 20 d
MBRC pre-denitrification, two parallel plants pilot 2 each 20 / 40 d
1} CAS conventional activated sludge plant, MBR membrane bioreactor
The plants with the same letter were operated with the same wastewater
2' population equivalents' solids retention time
4' enhanced biological phosphorous removal
58

Chapter 6
The Foaming Potential of Activated Sludge
6.2.2 Sample preparation
From the original sample, total suspended solids (TSS) were determined according to the Standard
Methods (Clesceri et al, 1998). The samples were then centrifuged (5 min at 4300 rpm) and the
supernatant filtered through a coarse pore paper filter (coffee filter). The solids were resuspendedin 250 ml aliquots with sludge liquid or tap water, at defined solids concentrations (Table 6-2). Ad¬
ditionally, pure sludge liquid and tap water were prepared to test. The prepared samples were
brought to about 20°C; the exact temperature was recorded immediately before the test.
Because the foam samples were very concentrated in TSS, they were diluted prior to the above de¬
scribed preparation. The liquid for dilution was recovered from the same sample by manually de¬
stroying the foam structure and subsequent centrifugation.
Table 6-2: The sample preparation resulted in eight test samples for each original sample Depending on the
TSS of the original sample, other appropriate test TSS concentrations were chosen
liquid type sludge liquid tap water
TSS 0 0
0 5 • TSSSample 0 5 • TSSSample1 0 • TSSSampie 1 0 • TSSSampie2 0 • TSSSample 2 0 • TSSSample
6.2.3 Foam tests
The tests were performed in a 1000 ml graduated cylinder made of Plexiglas, with 60 mm inner
diameter. The bottom consisted of a perforated rubber membrane as it is used as fine-bubble dif¬
fuser in full-scale WWTPs with 12 slits cm"2 (ELASTOX-T, Gesellschaft für Verfahren der Ab¬
wassertechnik mbH & Co. KG, 42489 Wülfrath, Germany).
For the aeration test, 250 ml prepared sample was aerated for three minutes with 4 1 min"1, the
foam volume measured and the foam appearance rated according to the rating scale in Table 6-3a.
This arbitrary scale was adapted from Blackall etal. (1991); it consists of three parts: the formation
of large brown bubbles at the liquid surface developing into films that cover the cylinder cross-
section and rise upwards (categories 0-4), the accumulation of small bubbles below the surface
(categories 5 and higher) and the formation of loose surfactant-like foam structures (white or brown,
category X). The stability was assessed 30 s after cessation of the aeration; the stability scale is
based on the foam thickness (Table 6-3b).
For the subsequent Alka-Seltzer test, the sample was stirred to destroy the foam that was formed
during the aeration test, and two Alka-Seltzer effervescent tablets (Bayer Switzerland AG, Zurich;
each containing 1650 mg bicarbonate, 324 mg acetylsalicylic acid, 1000 mg citric acid) were si¬
multaneously thrown into the cylinder. The maximum foam volume and the time when it was
reached were recorded. In pure liquid the foam immediately collapses after complete dissolution of
the tablets. In samples containing solids, the foam only partially collapses and usually all sludge
was floating and stayed stable over more than 30 min. Therefore, the stability after the Alka-Seltzer
test was not assessed.
This resulted in five values for each sample: foam volume, arbitrary rating and stability for the
aeration test and maximum foam volume and time for the Alka-Seltzer test. The foam volume is
expressed as relative volume of the foam compared to the original sample volume (equation 1); i.e.
no foam results in Vrei = 0.
* rel * foam,measured ' -^->vJ nil y I)
59

Characterization and Controllingof Foam and Scum in Activated Sludge Systems
Table 6-3: Rating scales for aeration test (derived from Blackall et al, 1991), half categories were allowed.
a) rating
0 small instable bubbles, like pure water
1 on top of thin foam layer, large instable bubbles (diameter up to 30mm)
2 Some bubbles cover whole surface, rising films are formed rarely (one often attempts)
3 like 2. films formed regularly (one of three attempts)
4 like 2. films formed every few seconds (each attempt successful)
5 large stable bubbles cover surface; small bubbles accumulate below, foam volume <20 ml
6 like 5, foam volume 20 - 40 ml
7 like 5. foam volume 50 - 70 ml
X loose surfactant foam of large bubbles (d=30.. .60mm, white or brown)
KAoooSE
t t
b) stability
0 foam collapses, no bubbles remain
1 foam collapses, few small bubbles remain along cylinder wall
2 foam collapses, many small bubbles remain along cylinder wall
3 stable foam, thickness in centre <20 ml
4 like 3. thickness in centre 20 - 40 ml
5 like 3, thickness in centre 50 - 70 ml
6.2.4 Transformation of results: TSS and temperature
As the foaming potential increases with the TSS, time-series of samples can only be analyzed if
they represent the same TSS. Therefore, we estimated the values at TSS=4 g l"1 and 8 g l"1 by inter¬
polation with linear or power regression lines through all measured points of the respective sample.
The maximum foam height in the Alka-Seltzer test is proportional to the gas production rate which
is increased at high temperature, due to faster dissolution and reduced C02 solubility. To conect
this effect, the relative foam volume at 20°C was estimated with the following procedure: Three
samples with high and three samples with low foaming potential were tested at temperatures be¬
tween 5 and 40 °C (Figure 6-1). The foaming potential (Vrei) was found to be linearly dependentfrom the temperature, but with different slopes for both groups of samples. The two lines meet at
T0 = -20.87 °C and Vrei,o = -0.025 ml. The estimated relative volume at 20 °C (Vrei,2o) is the value at
T=20 °C on a straight line trough the point (T0, Vrei,o) and the measured point (Tmeas, Vrei,meas)-
?5
>^J ;,.<>
tlJ
1 5tlJ
N
To 1.0m
0.5
<f
0.0
O data points used for regression
• example for temperature correction
'rel,0
Temperature [°C]
Figure 6-1: Temperature dependency of the Alka-Seltzer test: Testing samples of high and low foaming po¬
tential at different temperatures revealed a linear dependency of the results from the temperature, allowing to
estimate the values at 20 °C.
60
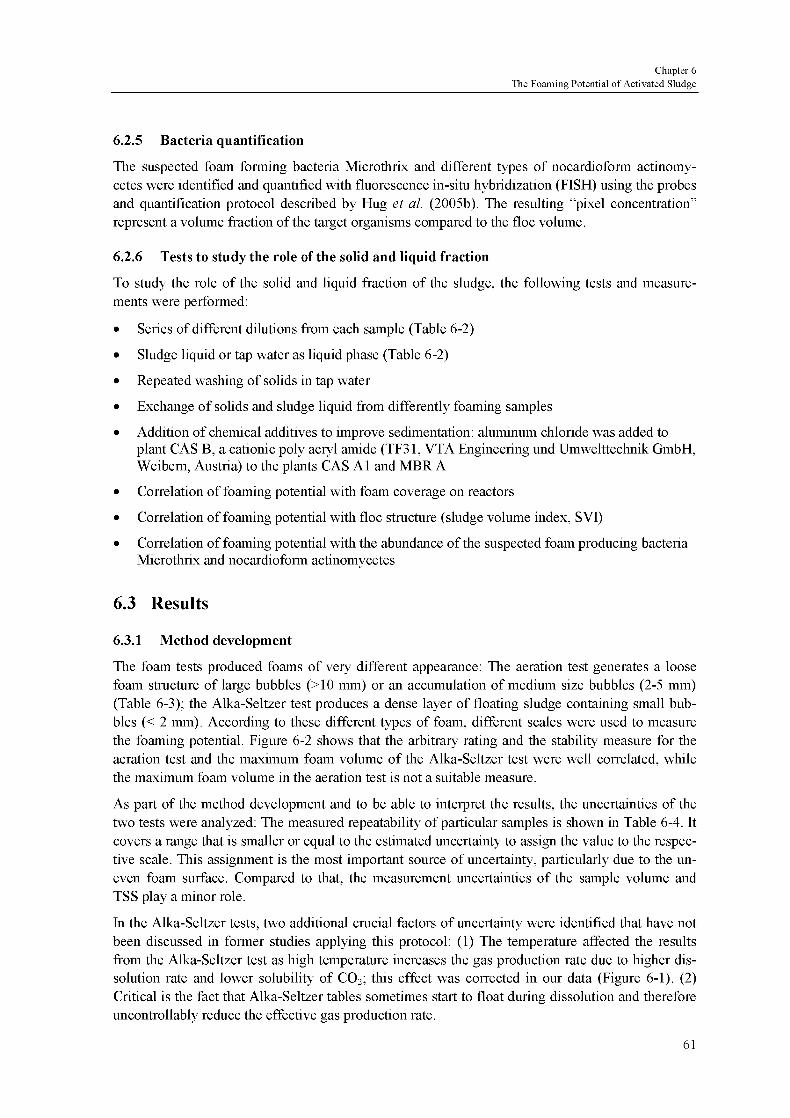
Chapter 6
The Foaming Potential of Activated Sludge
6.2.5 Bacteria quantification
The suspected foam forming bacteria Microthrix and different types of nocardioform actinomy¬cetes were identified and quantified with fluorescence in-situ hybridization (FISH) using the probesand quantification protocol described by Hug et al (2005b). The resulting "pixel concentration"
represent a volume fraction of the target organisms compared to the floe volume.
6.2.6 Tests to study the role of the solid and liquid fraction
To study the role of the solid and liquid fraction of the sludge, the following tests and measure¬
ments were performed:
• Series of different dilutions from each sample (Table 6-2)
• Sludge liquid or tap water as liquid phase (Table 6-2)
• Repeated washing of solids in tap water
• Exchange of solids and sludge liquid from differently foaming samples
• Addition of chemical additives to improve sedimentation: aluminum chloride was added to
plant CAS B, a cationic poly acryl amide (TF31, VTA Engineering und Umwelttechnik GmbH,
Weibern, Austria) to the plants CAS Al and MBR A
• Conelation of foaming potential with foam coverage on reactors
• Correlation of foaming potential with floe structure (sludge volume index, SVI)
• Correlation of foaming potential with the abundance of the suspected foam producing bacteria
Microthrix and nocardioform actinomycetes
6.3 Results
6.3.1 Method development
The foam tests produced foams of very different appearance: The aeration test generates a loose
foam structure of large bubbles (>10 mm) or an accumulation of medium size bubbles (2-5 mm)
(Table 6-3); the Alka-Seltzer test produces a dense layer of floating sludge containing small bub¬
bles (< 2 mm). According to these different types of foam, different scales were used to measure
the foaming potential. Figure 6-2 shows that the arbitrary rating and the stability measure for the
aeration test and the maximum foam volume of the Alka-Seltzer test were well correlated, while
the maximum foam volume in the aeration test is not a suitable measure.
As part of the method development and to be able to interpret the results, the uncertainties of the
two tests were analyzed: The measured repeatability of particular samples is shown in Table 6-4. It
covers a range that is smaller or equal to the estimated uncertainty to assign the value to the respec¬
tive scale. This assignment is the most important source of uncertainty, particularly due to the un¬
even foam surface. Compared to that, the measurement uncertainties of the sample volume and
TSS play a minor role.
In the Alka-Seltzer tests, two additional crucial factors of uncertainty were identified that have not
been discussed in former studies applying this protocol: (1) The temperature affected the results
from the Alka-Seltzer test as high temperature increases the gas production rate due to higher dis¬
solution rate and lower solubility of C02; this effect was conected in our data (Figure 6-1). (2)
Critical is the fact that Alka-Seltzer tables sometimes start to float during dissolution and therefore
uncontrollably reduce the effective gas production rate.
61
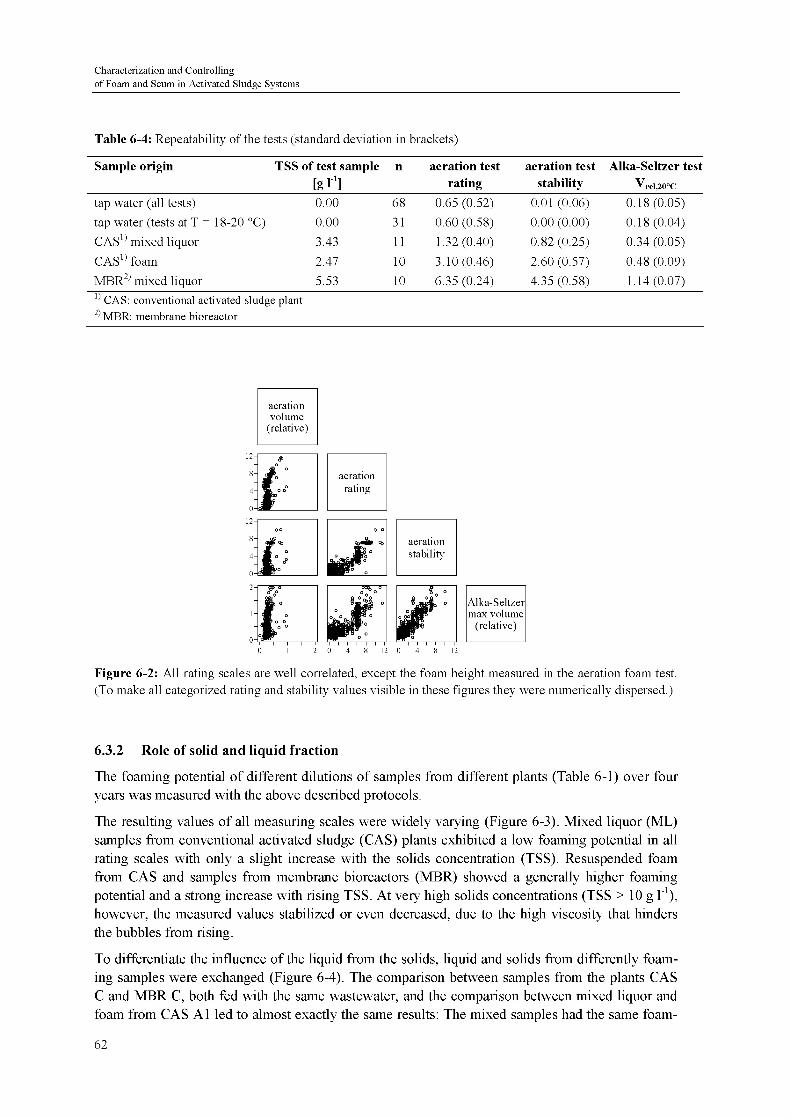
Characterization and Controllingof Foam and Scum in Activated Sludge Systems
Table 6-4: Repeatability of the tests (standard deviation in brackets)
Sample origin TSS of test sample n aeration test aeration test Alka-Seltzer test
[g r1] rating stability Vrel,20°C
tap water (all tests) 0 00 68 0 65 (0 52) 0 01 (0 06) 0 18(0 05)
tap water (tests at T = 18-20 °C) 0 00 31 0 60 (0 58) 0 00 (0 00) 0 18(0 04)
CAS1) mixed liquor 3 43 11 1 32 (0 40) 0 82 (0 25) 0 34 (0 05)
CAS1) foam 2 47 10 3 10(0 46) 2 60 (0 57) 0 48 (0 09)
MBR2) mixed liquor 5 53 10 6 35 (0 24) 4 35 (0 58) 1 14(0 07)' CAS conventional activated sludge plant
2' MBR membrane bioreactor
aeration
volume
(relative)
aeration
rating
o o
M§r°
aeration
stability
Alka-Seltzer
max volume
(relative)
Figure 6-2: All rating scales are well correlated, except the foam height measured in the aeration foam test
(To make all categorized rating and stability values visible in these figures they were numerically dispersed )
6.3.2 Role of solid and liquid fraction
The foaming potential of different dilutions of samples from different plants (Table 6-1) over four
years was measured with the above described protocols.
The resulting values of all measuring scales were widely varying (Figure 6-3). Mixed liquor (ML)
samples from conventional activated sludge (CAS) plants exhibited a low foaming potential in all
rating scales with only a slight increase with the solids concentration (TSS). Resuspended foam
from CAS and samples from membrane bioreactors (MBR) showed a generally higher foaming
potential and a strong increase with rising TSS. At very high solids concentrations (TSS > 10 g l"1),however, the measured values stabilized or even decreased, due to the high viscosity that hinders
the bubbles from rising.
To differentiate the influence of the liquid from the solids, liquid and solids from differently foam¬
ing samples were exchanged (Figure 6-4). The comparison between samples from the plants CAS
C and MBR C, both fed with the same wastewater, and the comparison between mixed liquor and
foam from CAS Al led to almost exactly the same results: The mixed samples had the same foam-
62
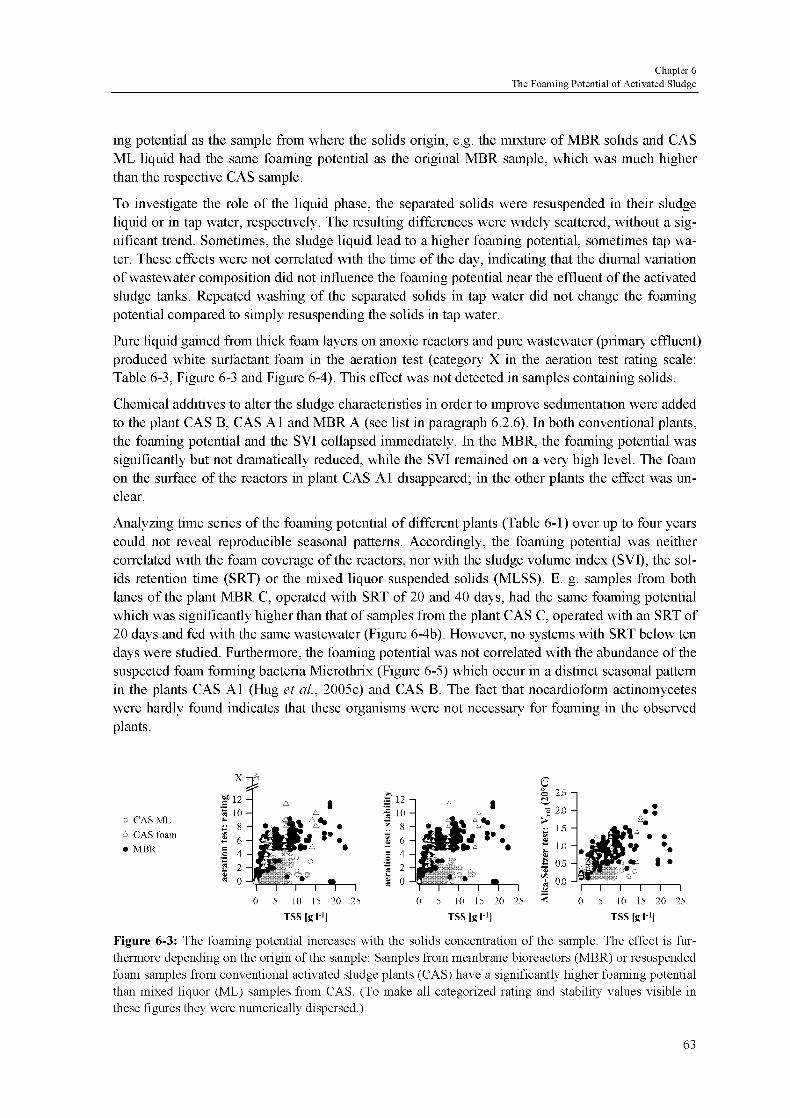
Chapter 6
The Foaming Potential of Activated Sludge
ing potential as the sample from where the solids origin, e.g. the mixture of MBR solids and CAS
ML liquid had the same foaming potential as the original MBR sample, which was much higherthan the respective CAS sample.
To investigate the role of the liquid phase, the separated solids were resuspended in their sludge
liquid or in tap water, respectively. The resulting differences were widely scattered, without a sig¬nificant trend. Sometimes, the sludge liquid lead to a higher foaming potential, sometimes tap wa¬
ter. These effects were not correlated with the time of the day, indicating that the diurnal variation
of wastewater composition did not influence the foaming potential near the effluent of the activated
sludge tanks. Repeated washing of the separated solids in tap water did not change the foaming
potential compared to simply resuspending the solids in tap water.
Pure liquid gained from thick foam layers on anoxic reactors and pure wastewater (primary effluent)
produced white surfactant foam in the aeration test (category X in the aeration test rating scale:
Table 6-3, Figure 6-3 and Figure 6-4). This effect was not detected in samples containing solids.
Chemical additives to alter the sludge characteristics in order to improve sedimentation were added
to the plant CAS B, CAS Al and MBR A (see list in paragraph 6.2.6). In both conventional plants,the foaming potential and the SVI collapsed immediately. In the MBR, the foaming potential was
significantly but not dramatically reduced, while the SVI remained on a very high level. The foam
on the surface of the reactors in plant CAS Al disappeared; in the other plants the effect was un¬
clear.
Analyzing time series of the foaming potential of different plants (Table 6-1) over up to four years
could not reveal reproducible seasonal patterns. Accordingly, the foaming potential was neither
correlated with the foam coverage of the reactors, nor with the sludge volume index (SVI), the sol¬
ids retention time (SRT) or the mixed liquor suspended solids (MLSS). E. g. samples from both
lanes of the plant MBR C, operated with SRT of 20 and 40 days, had the same foaming potentialwhich was significantly higher than that of samples from the plant CAS C, operated with an SRT of
20 days and fed with the same wastewater (Figure 6-4b). However, no systems with SRT below ten
days were studied. Furthermore, the foaming potential was not conelated with the abundance of the
suspected foam forming bacteria Microthrix (Figure 6-5) which occur in a distinct seasonal pattern
in the plants CAS Al (Hug et al, 2005c) and CAS B. The fact that nocardioform actinomycetes
were hardly found indicates that these organisms were not necessary for foaming in the observed
plants.
CAS ML
A CAS foam
• MBR
1 I I I
10 15 20 25
TSS [g H]
12 -i
10 -
8 -
6 -
4 -
2 -,
0 A
4 «'.
~ii i
15 20 25
TSS [g H]
h 25 •
^ 2.0 •
£ 15-S«
CL)
r iß-CL)
S 05.CL)
1o.o.—\ 1 1 1
10 15 20 25
TSS [g H]
Figure 6-3: The foaming potential increases with the solids concentration of the sample. The effect is fur¬
thermore depending on the origin of the sample: Samples from membrane bioreactors (MBR) or resuspendedfoam samples from conventional activated sludge plants (CAS) have a significantly higher foaming potentialthan mixed liquor (ML) samples from CAS. (To make all categorized rating and stability values visible in
these figures they were numerically dispersed.)
63

Characterization and Controllingof Foam and Scum in Activated Sludge Systems
a) foam - Mixed liqor
(CAS)
ou J; £• "ö3solids liquid
•Sio- 10 —i 20 -, o CAS ML CAS ML
2 8-3
8 -
15 -
• CAS foam CAS foam
t« 6 - 4Â r! 6 -
« D CAS ML CAS foam
s 4 -
••
» 4 - AN
10 -
ÂA CAS foam CAS ML
Ö 0 J
e
v.
2 -
0 -
"03CO
i
05 -
00 -
A A
I I I I
A CAS ML
CAS foamtap water
tap water
« i i i i till
0 5 10 15 « 0 5 10 15 < 0 5 10 15
TSS [g H] TSS [g H] TSS [g H]
b) MBR - CAS
(Mixed liquor)
01 £ % solids liquid•Sio -,
310
"1 > 20 -,
o CAS ML CAS ML2 8 - 8 - j^ 15 - • MBR ML MBRML
Ï 6-
s4-
S 2-
fe 0 -i
e
6 -
4 -
2 -
Ait
in
10 -
05 -
00 -
D
AA
CAS ML
MBR ML
CAS ML
MBR ML
MBRML
CAS ML
tap water
tap water
§ 1 1 1 1
0 5 10 15
v. till
0 5 10 15
M i i i i
0 5 10 15
TSS [g H] TSS [g H] TSS [g H]
Figure 6-4: Exchanging the solids and liquid from differently foaming samples reveal that the solids deter¬
mine the foaming potential, (a) Foam and mixed liquor (ML) from the same conventional (CAS) plant CAS
Al. (b) ML from plant CAS C and the membrane bioreactor MBR C (both fed with the same wastewater).
a) foaming potential at TSS = 4 g 1-1 b) foaming potential at TSS = 8 g H
20-
15-
10-
05-
00-
CASML
A CAS foam
• MBR
••V
20-
15-
10-
05-
00-
!t:a
0 1% 1% 10% 100%
Microthrix abundance
(pixel concentration)
0 1% 1% 10% 100%
Microthrix abundance
(pixel concentration)
Figure 6-5: The abundance of Microthrix parvicella did not define the foaming potential in the observed
plants; other factors must lead to the increased foaming potential of MBR and foam samples. The data repre¬
sent the interpolated foaming potential at TSS = 4 and 8 g l"1.
6.4 Discussion
6.4.1 Test development and uncertainty analysis
In this study, we further developed and applied two foam test protocols with different types of gas
production in order to simulate the rather coarse bubbles in the aeration basins and the small bub¬
bles in the anoxic tank that lead to completely different foam structures in full-scale plants. The
correlation of the two test protocols is good (Figure 6-2), despite the different gas sources and the
different types of measurement scales.
64
Chapter 6
The Foaming Potential of Activated Sludge
As in most other protocols in the literature, the uncertainty of our proposed procedure is dependent
on the subjective assignment of the observation to the respective scales and by the pronouncedvariation of the results due to unknown sludge properties. Nevertheless, a careful consideration of
the influence factors, particularly the role of the solids concentration and for the Alka-Seltzer test
the temperature allows to obtain reproducible results and to draw meaningful conclusions.
6.4.2 Suitability of foam tests
The potential of foam tests lies in the possibility to study the foam formation under comparable
laboratory conditions, not influenced by the hydraulic conditions in a particular WWTP.
Can such tests represent adequately enough foam formation in full-scale plants? The water column
through which a bubble rises is about fifty times smaller than in an activated sludge tank; therefore,
the tests cannot be very sensitive (Jenkins et al, 1993). Furthermore, due to wall effects and differ¬
ent hydraulic conditions in the test equipment and the plant, the detailed characteristics of the par¬
ticular foam are most likely different. Nevertheless, it can be assumed that the general principles of
foam formation and stabilization are the same and can be investigated with such tests.
There are few publications that found a correlation between variation of the foaming potential and
the foam coverage in a particular plant (Pretorius and Laubscher, 1987; Paris et al, 2005; Tor-
regrossa et al, 2005). Oerther et al. (2001) found an increased foaming potential during a seasonal
foaming period in a full-scale WWTP, and de los Reyes III and Raskin (2002) identified a thresh¬
old foaming potential that was necessary to start foaming in the full-scale plant. However, similarlyto our results, other studies did not find an unambiguous correlation between foaming potential and
foam occurrence in the plant (Blackall et al, 1991; Hladikova et al., 2002; Torregrossa et al., 2005).
Obviously, the actual foam distribution in a particular full-scale WWTP is strongly influenced bythe plant design. Therefore, it is not meaningful to apply such tests to identify foaming problems in
a plant (as it was suggested in early literature, Pretorius and Laubscher, 1987). However, as some
plants have problems with even a low foaming potential but others can deal with strongly foaming
sludge, a standardized test protocol can be a valuable benchmark tool in order to design foam toler¬
ant plants. This is particularly important because there is still no reliable strategy to prevent acti¬
vated sludge foaming and it is becoming accepted that we have to live with foam.
6.4.3 Role of solid and liquid fraction
The goal of the application of this newly developed protocol was to investigate the role of the solid
and the liquid fraction for the formation and stabilization of foam.
Our results demonstrate the important role of the solids for foaming. The foaming potential of dif¬
ferent dilutions of a particular sample is increasing with its solids concentration (Figure 6-3 and
Figure 6-4). The pronounced differences between mixed liquor from conventional activated sludge
plants (CAS ML) and CAS foam or samples from membrane bioreactors (MBR) indicate that not
only the solids concentration, but also the solids properties control the foaming potential. This con¬
firms the results from other studies that the foaming potential is increasing with the solids concen¬
tration but pronounced differences exists among different types of samples (Goddard and Forster,
1987; Khan and Forster, 1990; Blackall etal, 1991; Oerther et al, 2001).
What could cause the high foaming potential we found in MBR and foam samples? Neither the
high SRT, nor the different floe structure in MBRs were found to have an influence. We hypothe¬size that large organic molecules, originating from microbial activity and cell decay, increase the
foaming potential. In MBRs these molecules can be enriched because they are hold back by the
membrane. Such colloidal compounds are known to be hold back by membranes that are typically
65
Characterization and Controllingof Foam and Scum in Activated Sludge Systems
used in MBRs (Lee et al, 2005; Rosenberger et al, 2006). In stable foam layers they can accumu¬
late due to the lack of mixing and the high solids concentration.
The liquid phase did not control the foaming potential. Only pure liquid recovered from thick foam
layers produced surfactant-like foams, suggesting the local accumulation of surface active sub¬
stances. Several suspected foam producing bacteria are able to produce bio-surfactants (Desai and
Banat, 1997; Lemmer et al, 2000; Pagilla et al, 2002). Supernatant from pure cultures oîGordona
amarae have found to produce instable foam that was stabilized by the addition of the respectivecells (Blackall and Marshall, 1989; Iwahori etal, 2001; de los Reyes III and Raskin, 2002). How¬
ever, as pure cultures grow under different conditions than in the competitive environment of acti¬
vated sludge, it is unclear whether the same organisms and compounds play a crucial role in full-
scale activated sludge foaming.
In contrast to widespread assumptions, our results indicate that neither Microthrix nor nocardio¬
form actinomycetes are necessary for foaming. This confirms the findings of our previous studywhere neither Microthrix nor nocardioform actinomycetes correlated with the foam coverage of the
full-scale WWTP CAS Al (Hug et al, 2005c). Moreover, we could not confirm the common as¬
sumption that high SRT intensifies foaming by increasing the cell surface hydrophobicity and al¬
lowing the growth of slowly growing suspected foam forming bacteria. While the TSS in the test
sample had a strong influence on the measured foaming potential, the MLSS i.e. TSS of the origi¬nal sample did not. Furthermore, the foaming potential was considerably reduced by the addition of
chemical additives that were added to improve the sludge settleability. As we found that the SVI
did not correlate with the foaming potential, this reduction indicates that floe surface characteristics
which are altered by those chemicals are important rather than the floe structure.
The surface of sludge floes is extremely complex; there is no unambiguous borderline between the
foam relevant surface and the liquid. Therefore, further research is needed to investigate the foam¬
ing potential of activated sludge but including hypotheses from pure culture studies and from other
fields such as biotechnology where foaming is a common nuisance (Vardar-Sukan, 1998), miningindustries where "froth flotation" of ore particles is achieved by controlled addition of specific sur¬
factants (Rao, 2004) or food technology where foams are stabilized by surfactants, fat globules and
proteins (Brooker, 1993; Bos and van Vliet, 2001). For such studies foam tests will be a critical
measurement method.
6.5 Conclusions
In order to identify mechanisms behind activated sludge foaming, the foaming potential of sludge
samples have to be measured independently from the hydraulic conditions in the wastewater treat¬
ment plant. Therefore, we developed a robust foam test protocol, combining two test approachesand based on the separation of solid and liquid fraction. The test was applied to study the role of the
solid and liquid phase.
Our results allow the following conclusions:
• We recommend to apply both test approaches (aeration test and Alka-Seltzer test) simultane¬
ously. This leads to more confident findings, as it allows to check whether different scales indi¬
cate the same outcomes.
• To produce meaningful results, it is crucial to consider the strong influence of the solids con¬
centration and, for the Alka-Seltzer test, of the temperature.
66

Chapter 6
The Foaming Potential of Activated Sludge
• The foaming potential is controlled by the concentration and surface properties ofthe solids, i.e.
the activated sludge floes.
• Foam samples and sludge from membrane bioreactors (MBRs) exhibit a significantly higher
foaming potential than mixed liquor from conventional plants.
• The suspected foam producing bacteria "Microthrix parvicella" and nocardioform actinomy¬cetes did not play an important role in the formation of stable foams.
• The sludge retention time (SRT) did not influence the foaming potential (in plants with SRT >
10 days).
• The fact that the foam coverage ofthe activated sludge tanks was not correlated with the meas¬
ured foaming potential demonstrates the crucial role ofthe hydraulics in the plant. This empha¬sizes the importance of such foam tests which allow to study the actual foam formation inde¬
pendent from the conditions in the plant.
• For future research, it will be important to cooperate with other disciplines dealing with stable
foams, either as nuisance or as intended product.
To control activated sludge foaming, the following conclusions can be drawn from our results:
• Activated sludge plants designed to operate with smaller solids concentration could reduce the
problem.
• Floating sludge has a higher foaming potential than mixed liquor. Accordingly, it should be
removed selectively (e.g. by continuously removing foam from the surface) to prevent inocula¬
tion back into the mixed liquor.
• Chemical additives to improve the sludge settleability are useful as emergency measure to con¬
trol severe foaming. Because the exact mechanisms behind foaming are not yet clarified, the
product and dosage has to be evaluated with the manufacturer.
• A standardized foam test is valuable to identify foam tolerant WWTP designs.
6.6 Acknowledgements
We would like to thank the staff members of the WWTP Thunersee for their experimental contri¬
bution and the WWTP Kloten-Opfikon for their financial and analytical support. We are also grate¬
ful to the operators of the analyzed MBRs, Adriano Joss, Patrice Goosse and Reto Manser for their
engagement in helpful discussions. This project was performed in the framework of COST action
624.
67

Characterization and Controllingof Foam and Scum in Activated Sludge Systems
68

Chapter 7
Conclusions
7.1 Products of this thesis
The goal of this thesis was to systematically investigate factors controlling the formation of stable
foam in biological wastewater treatment plants (WWTPs). Particularly important findings are the
demonstrated importance of dynamics of the microbial population and the foaming intensity as
well as the fact that widespread assumptions about causes of foaming were not found to be univer¬
sally valid, particularly about the role of "Microthrix parvicella" (Microthrix). Considering the
conclusions from this thesis might help to reduce confusion in future research and suggest new re¬
search directions, and therefore provide new insights in order to further elucidate the critical
mechanisms in activated sludge foaming.
Based on the questions that were formulated in the introduction to this thesis, paragraph 1.8, the
following conclusions can be drawn:
• Despite decades of research, the mechanisms leading to stable foams in activated sludge sys¬
tems are still not fully clarified. As discussed in the Introduction (chapter 1), this is due to the
multifaceted topic and the complex system with its inherent dynamics, combined with inaccu¬
rate measuring methods and confusion of terms and phenomena. In order to structure the re¬
search on this often confused topic, three major sub-processes of foaming were identified
(Figure 1-2 in the introduction section of this thesis): (1) Production of activated sludge of a
certain foaming potential. This includes surface active compounds and hydrophobic surfaces,
often assumed to be bacteria with hydrophobic cell surface, e.g. Microthrix or nocardioform
actinomycetes. (2) The formation and stabilization of foam and (3) the distribution of foam in
the wastewater treatment plant.
• A novel method was developed to quantify bacteria in activated sludge (chapter 2). Comparedto the traditional morphological identification of filamentous bacteria in activated sludge
(Eikelboom and van Buijsen, 1981), this method is based on fluorescence in-situ hybridization
(FISH) which allows unambiguous identification, independent of the morphology, and enables
69
Characterization and Controllingof Foam and Scum in Activated Sludge Systems
to recognize organisms inside dense floes. In contrast to semi-automated image analysis proce¬
dures, the new method is rapid enough to be used to measure long time-series of bacteria abun¬
dance, and it is suitable for samples containing fluorescent debris and cells of different signalintensities and for difficultly accessible target organisms like Microthrix and nocardioform ac¬
tinomycetes.
• A protocol was developed, to measure the foaming potential of activated sludge under repro¬
ducible laboratory conditions, independent from the plant design (chapter 6). It is derived from
two methods from literature, based on different principles and includes the separation of the
solid and liquid fraction of the sample. These tests are valuable to semi-quantitatively identify
major influence factors on the foam formation and stabilization.
• Combining the observations of the sub-processes (Figure 1-2 in the introduction of this thesis),
it is surprising that no general correlation was found between the abundance of bacteria that are
generally assumed to produce foam, the foaming potential and the foam coverage of the acti¬
vated sludge tanks (chapters 3, 4 and 6). Although these findings might be influenced by the
performance of the foam-tests and the fact that nocardioform actinomycetes were mostly ab¬
sent, they indicate that Microthrix does not necessarily play a critical role in foaming and that
unknown fürther factors are important. The findings of this thesis clearly demonstrate the im¬
portance to take into account the seasonal dynamics and to separately study the sub-processes.
• Distinct seasonal variation of the suspected foam producing bacteria Microthrix and nocardio¬
form actinomycetes were found (chapter 3). Experiments in a pilot-scale plant revealed that
operating conditions are defining floe structure and growth of Microthrix, rather than the
wastewater composition (chapter 4). A mathematical model was developed in chapter 5 as re¬
search tool to further elucidate the mechanisms leading to the observed seasonal variations of
Microthrix.
• The application of the foam tests to samples from all investigated plants (Table 1-1) revealed
the dominant role of the concentration and surface properties of the sludge solids. Furthermore,
the foaming potential of membrane bioreactor (MBR) sludge and resuspended foam samples
was found to be considerably higher than of mixed liquor from conventional plants. This might
by caused by an accumulation of macro molecules originating from microbial activity and cell
decay (chapter 6). Tackling the reasons for these findings will be a promising way towards un¬
derstanding the fundamental mechanisms involved in activated sludge foaming.
7.2 Conclusions regarding foam control strategies
The results and conclusions from the analysis of the sub-processes lead to the following recom¬
mendations for effective foam control:
• Based on the findings of this thesis it can be concluded that probably the most successful
method to control foaming is to continuously collect and remove floating sludge. This does not
only keep the problem small but selectively eliminates floating organism and prevents re-
inoculation from the foam layer. Consequently the floating ability of certain bacteria becomes a
disadvantage (lower effective SRT) while it is a selective advantage when a stable foam layerexists (higher effective SRT). It should be noted that large amounts of removed foam should
not be added to an anaerobic digester at the same time as it may cause foaming there.
70
Chapter 7
Conclusions
• To reduce the foaming potential of the removed waste sludge prior to its transfer to an anaero¬
bic digester, only thermal treatment has found to be successful (Westlund et al, 1998; Barjen-bruch and Kopplow, 2003).
• The foaming potential of activated sludge can be considerably reduced by the addition of poly-
electrolyte as it is often used to improve sedimentation. Although such chemical additives are
expensive, they are valuable as an emergency measure when excessive bulking or foaming oc¬
curs. Because each sludge has different properties, the product composition and dosage has of¬
ten to be adjusted to the particular sludge.
• The role of the suspected foam producing bacteria Microthrix and nocardioform actinomycetesis not fully clarified; in the investigated plants they did not play a critical role (chapters 3 and
6). Furthermore, there is still no reliable measure known to prevent their growth without put¬
ting a risk on nitrification. Accordingly, to prevent or control foaming it is not recommendable
to concentrate only on those bacteria - unless they cause severe bulking at the same time. Nev¬
ertheless, valuable information for research can be provided if these organisms are identified
and quantified throughout the year, during changes of the operation or while trying to suppress
their growth.
• Last but not least, we probably have to learn to live with foam, particularly in modern nutrient
removing WWTPs and in the emerging MBR technology. Consequently, the focus should be
turned to implement measures to increase the foam tolerance of existing and future WWTPs,
e.g. high freeboard of the reactors, construction allowing easy access for cleaning, free over¬
flow between reactors, excess sludge withdrawal from the surface, planned option for the in¬
stallation of water sprays and to dose chemical additives.
7.3 Recommendations for further research
The following suggestions for future research emerge from the findings of this thesis:
• A detailed classification system of different types of foam should be developed in order to re¬
duce confusion and to coordinate research. Similarly, the classification of filamentous bacteria
by Eikelboom (1975) and the distinction of different sludge separation phenomena by Wanner
(1994) introduced a common language that improved the communication and allowed more ef¬
ficient cooperative research. A classification of foam types could be based on the types distin¬
guished by Jenkins et al. (2004) but should be more detailed, including the foam appearance,
distribution in the plant, origin, composition and size of gas bubbles, water content, redox con¬
dition, floe structure, dominant organisms, biological activity, sludge surface properties, sur¬
face tension, foaming potential and characterization of EPS.
• The sub-processes of foaming in WWTPs (Figure 1-2 in the Introduction of this thesis) have to
be clearly distinguished in the classification of foam types, monitoring programs and specificresearch efforts.
• Measuring protocols should not only be further improved but sound uncertainty analysesshould also be provided, also for current procedures. This allows to estimate their accuracy,
will prevent inappropriate use, and may even lead to new findings, e.g. by investigation of out¬
lying data.
• It is crucial to consider the inherent dynamics of the investigated systems. Accordingly, singlemeasurements are often not valuable because they may characterize non-representative condi¬
tions (chapter 3). To search for bacterial populations that play an important role in the forma-
71

Characterization and Controllingof Foam and Scum in Activated Sludge Systems
tion and stabilization of foam, it is crucial to analyze time-series including different seasons
and periods with different foaming intensities. Focusing on seasonal variations will not onlyreduce uncertainty but will certainly provide new insights.
• Mathematical models, as unambiguous formulation of hypotheses, will support communication
and help to coordinate future efforts to identify the important mechanisms allowing suspectedfoam producing bacteria to successfully compete in activated sludge. A suitable model is pre¬
sented in chapter 5.
• Findings from simplified systems (e.g. pure cultures or lab-scale experiments with artificial
wastewater) provide important knowledge about bacterial growth and foaming ability. How¬
ever, more research is required to check how far those findings are valid for the complex and
dynamic system of activated sludge in full-scale WWTPs.
• A promising way to improve the understanding of mechanisms leading to stable foams is to
focus on the causes of the increased foaming potential in MBR sludge and resuspended foam
(chapter 6). A starting point could be to test the hypothesis that macro molecules from micro¬
bial activity and cell decay accumulate in these systems.
• As the system (activated sludge) and the processes behind the formation of stable foam are ex¬
tremely complex, communication and cooperation among different disciplines have to be im¬
proved. This has a long tradition between engineers and plant operators and is currently beingintensified between engineers and microbiologists. However, a substantial step further will be
made if theories and know-how from different fields that are either suffering from foaming or
intending to produce stable foams are combined. Promising disciplines to cooperate with are
biotechnology where foaming is a common nuisance (Vardar-Sukan, 1998), mining industries
where "froth flotation" of ore particles is achieved by controlled addition of specific surfactants
(Rao, 2004) or food processing industries where stable foams are achieved in multiphase sys¬
tems containing proteins and fat particles (e.g. Brooker, 1993; Goff, 1997; Bos and van Vliet,
2001).
72
References
Amann R I, Binder B J,Olson R J
,Chisholm S W
,Devereux R
,and Stahl D A (1990) Combination of
16S rRNA-targeted oligonucleotide probes with flow cytometry for analyzing mixed microbial popu¬
lations Applied and Environmental Microbiology, 56(6), 1919-1925
Andreasen K H and Nielsen P H (2000) Growth of Microthnx parvicella in nutrient removal activated
sludge plants studies of m situ physiology Water Research, 34(5), 1559-1569
Anonymous (1969) Milwaukee mystery Unusual operating problem develops Water and Sewage Works,
116,213
Barjenbruch M and Kopplow O (2003) Enzymatic, mechanical and thermal pre-treatment of surplus sludgeAdvances in Environmental Research, 7(3), 715-720
Beimfohr C,Krause A
,Amann R
, Ludwig W ,and Schleifer K -H (1993) In situ identification of Lacto-
cocci, Enterococci and Streptococci Systematic and Applied Microbiology, 16(3), 450-456
Blackall L L,Harbers A, Greenfield P F
,and Hayward AC (1991) Activated sludge foams - effects of
environmental variables on organism growth and foam formation Environmental Technology, 12(3),241-248
Blackall L L and Marshall K C (1989) The mechanism of stabilization of actmomycete foams and the pre¬
vention of foaming under laboratory conditions Journal of Industrial Microbiology, 4(3), 181-188
Blanchard D C and Parker B C (1977) The freshwater to air transfer of microorganisms and organic matter
In "Aquatic Microbial Communities" Cairns J J, ed, pp 625-658 Garland Publishing, Inc,New
York
Bos M A and van Vliet T (2001) Interfacial rheological properties of adsorbed protein layers and surfactants
a review Advances in Colloid and Interface Science, 91(3), 437-471
Bouchez T,Patureau D
,Dabert P
,Juretschko S
,Doré J
, Delgenes P,Moletta R
,and Wagner M (2000)
Ecological study of a bioaugmentation failure Environmental Microbiology, 2(2), 179-190
Brooker B E (1993) The stabilization of air in foods containing fat - a review Food Structure, 12(1), 115-
122
73
Characterization and Controllingof Foam and Scum in Activated Sludge Systems
Casey T G,Wentzel M C and Ekama G A (1999) Filamentous organism bulking in nutrient removal acti¬
vated sludge systems Paper 11 A biochemical/microbiological model for proliferation of anoxic-
aerobic (AA) filamentous organisms Water SA, 25(4), 443-451
Clescen L S, Greenberg A E
,Eaton A D
,and Franson M A H (eds ) (1998) Standard methods for the ex¬
amination of water and wastewater 20 edn, American Public Health Association, American Water
Works Association, Water Environment Federation, Washington DC, USA
Dahlback B,Hermannsson M
, Kjelleberg S,and Norkrans B (1981) The hydrophobicity of bacteria - an
important factor in their initial adhesion at the air-water interface Archives of Microbiology, 128(3),267-270
Daims H (2001) Cultivation-independent, semiautomatic determination of absolute bacterial cell numbers in
environmental samples by fluorescent in situ hybridization Applied and Environmental Microbiology,
67(12), 5810-5818
Daims H, Bruehl A, Amann R, Schleifer K-H, and Wagner M (1999) The domain-specific probeEUB338 is insufficient for the detection of all Bacteria Development and evaluation of a more com¬
prehensive probe set Systematic and Applied Microbiology, 22(3), 434-444
Davenport R ,J
,Curtis T P
,Goodfellow M
, Stainsby F M,and Bingley M (2000) Quantitative use of fluo¬
rescent in situ hybridization to examine relationships between mycohc acid-contammg actinomycetesand foaming in activated sludge plants Applied and Environmental Microbiology, 66(3), 1158-1166
de los Reyes F L,Ritter W and Raskin L (1997) Group-specific small-subunit rRNA hybndization probes
to characterize filamentous foaming in activated sludge systems Applied and Environmental Micro¬
biology, 63(3), 1107-1117
de los Reyes III F L and Raskin L (2002) Role of filamentous microorganisms in activated sludge foaming
Relationship of mycolata levels to foaming initiation and stability Water Research, 36(2), 445-459
DesaiJD and Banat I M (1997) Microbial production of surfactants and their commercial potential Micro¬
biology and Molecular Biology Reviews, 61(1), 47-64
Efron B and Tibshiram R J (1993) An introduction to the bootstrap, Chapman & Hall, New York
Eikelboom D H (1975) Filamentous organisms observed in activated sludge Water Research, 9(4), 365-388
Eikelboom D H (1994) The Microthnx parvicella puzzle Water Science & Technology, 29(7), 271-279
Eikelboom D H (2000) Process control of activated sludge plants by microscopic investigation 1 edn,IWA
Publishing, London
Eikelboom D H,Andreadakis A and Andreasen K (1998) Survey of filamentous populations in nutrient
removal plants in four European countries Water Science & Technology, 37(4-5), 281-289
Eikelboom D H and van Buijsen H J J (1981) Microscopic sludge investigation manual 2 edn,Research
Institute for Environmental Hygiene TNO, Water and Soil Division, TU Delft, Delft NL
Erhart R,Bradford D
,Seviour R J
,Amann R
,and Blackall L L (1997) Development and use of fluores¬
cent in situ hybridization probes for the detection and identification of "Microthnx parvicella" in acti¬
vated sludge Systematic and Applied Microbiology, 20(2), 310-318
Forster C F (1996) Aspects of the behaviour of filamentous microbes in activated sludge Journal of the
Chartered Institution of Water and Environmental Management, 10(4), 290-294
Gochin R J and Solan J (1983) The role of hydrophobicity m dissolved air flotation Water Research, 17(6),651-657
Goddard A J and Forster C F (1987) Stable foams in activated sludge plants Enzyme and Microbial Tech¬
nology, 9, 164-168
GoffH D (1997) Colloidal aspects of ice cream - a review International Diary Jounal, 7(6-7), 363-373
Gujer W ,Henze M
,Mino T
,and Van Loosdrecht M C M (1999) Activated sludge model no 3 Water Sci¬
ence & Technology, 39(1), 183-193 (Enata in Wat Sei Tech 39(12), page I )
74
References
Haarhoff J and Bezuidenhout E (1999) Full-scale ecaluation of activated sludge thickening by dissolved air
flotation Water SA, 25(2), 153-166
Henze M, Gujer W ,
Mino T,and Van Loosdrecht M C M (eds ) (2000) Activated Sludge Models ASM1,
ASM2, ASM2D and ASM3, IWA, London
Hladikova K,Ruzickova I, Klucova P
,and Wanner J (2002) An investigation onto studying of the acti¬
vated sludge foaming potential by using physicochemical parameters Water Science & Technology,
46(1-2), 525-528
Ho C -F and Jenkins D (1991) The effect of surfactants on Nocardia foaming in activated sludge Water
Science & Technology, 23(4-6), 879-887
Hug T,Dowme R
,Hinz E
,Okolowicz J
,Ziranke M
, Gujer W ,and Siegnst H (2006) The foaming poten¬
tial of activated sludge submitted to Water Research Chapter 6 ofthis thesis.
Hug T, Gujer W and Siegnst H (2005a) Modeling seasonal dynamics of "Microthnx parvicella" 4th IWA
Activated Sludge Population Dynamics Specialist Conference, Proc 201-208, Surfers Paradise QLD,Australia. Chapter 5 ofthis thesis.
Hug T, Gujer W and Siegnst H (2005b) Rapid quantification of bacteria in activated sludge using fluores¬
cence in situ hybridization and epifluorescence microscopy Water Research, 39(16), 3837-3848
Chapter 2 ofthis thesis.
Hug T,Ziranke M and Siegnst H (2005c) Dynamics of population and scumming on a full-scale wastewa¬
ter treatment plant in Switzerland Acta hydrochimica et hydrobiologica, 33(3), 216-222 Chapter 3 ofthis thesis.
Hwang Y and Tanaka T (1998) Control of Microthnx parvicella foaming in activated sludge Water Re¬
search, 32(5), 1678-1686
Iwahon K,Tokutomi T
, Miyata N ,and Fujita M (2001) Formation of stable foam by the cells and culture
supernatant of Gordonia (Nocardia) amarae Journal of Bioscience and Bioengineering, 92(1), 77-79
Jenkins D,Richard M G and Daigger G T (1993) Manual on the causes and control of activated sludge
bulking and foaming 2nd edn,Lewis Publisher, Inc
,Chelsea MI, USA
Jenkins D,Richard M G and Daigger G T (2004) Manual on the causes and control of activated sludge
bulking, foaming, and other solids separation problems 3rd edn,IWA Publishing, London UK
Joss A (2004) personal communication Eawag, Dubendorf, Switzerland
Jurtshuk R J,Blick M
,Bresser J
,Fox G E
,and Jurtshuk Jr P (1992) Rapid in situ hybridization technique
using 16S rRNA segments for detecting and differentiating the closely related Gram-positive organ¬
isms Bacillus polymyxa and Bacillus macerans Applied and Environmental Microbiology, 58(8),2571-2578
Khan A R and Forster C F (1990) An investigation into the stability of foams related to the activated sludge
process Enzyme and Microbial Technology, 12(10), 788-793
Kjelleberg S and Hermansson M (1984) Starvation-induced effects on bacterial surface characteristics Ap¬
plied and Environmental Microbiology, 48(3), 497-503
Knoop S and Kunst S (1998) Influence of temperature and sludge loading on activated sludge settling, espe¬
cially on Microthnx parvicella Water Science & Technology, 37(4-5), 27-35
Koch G,Kuhm M
, Gujer W ,and Siegnst H (2000) Calibration and validation of activated sludge model
no 3 for Swiss municipal wastewater Water Research, 34(14), 3580-3590
Koczo K,Lobo L A and Wasan D T (1991) Effect of oil on foam stability aqueous foams stabilized by
emulsions Journal of Colloid and Interphase Science, 150(2), 492-506
Kuehn M,Hausner M
, Bungartz H -J, Wagner M ,
Wilderer P A,and Wuertz S (1998) Automated confo-
cal laser scanning microscopy and semiautomated image processing for analysis of biofilms Appliedand Environmental Microbiology, 64(11), 4115-4127
75

Characterization and Controllingof Foam and Scum in Activated Sludge Systems
Lee N, Amy G and Lozier J (2005) Understanding natural organic matter fouling in low-pressure mem¬
brane filtration Desalination, 178(1-3), 85-93
Lemmer H, Lmd G, Muller E,and Schade M (2000) Scum in activated sludge plants Impact of non-
filamentous and filamentous bacteria Acta hydrochimica et hydrobiologica, 28(1), 34-40
Lemmer H,Muller E and Schade M (2002) Scum in nutrient removal plants the role of carbon sources in
"Microthnx parvicella" growth Acta hydrochimica et hydrobiologica, 30(4), 207-211
Manser R, Muche K, Gujer W ,
and Siegnst H (2005) A rapid method to quantify nitrifiers in activated
sludge Water Research, 39(8), 1585-1593
Manz W,Amann R
, Ludwig W , Wagner M ,and Schleifer K -H (1992) Phylogenetic ohgodeoxynucleo-
tide probes for the major subclasses of Proteobactena Problems and solutions Systematic and Ap¬
plied Microbiology, 15(4), 593-600
Martins AMP, Pagilla K R, Heijnen J J
,and Van Loosdrecht M C M (2004) Filamentous bulking sludge -
a critical review Water Research, 38(4), 793-817
Miana P,Grando L
,Caravello G
,and Fabns M (2002) Microthnx parvicella foaming at the Fusina WWTP
Water Science & Technology, 46(1-2), 499-502
Nielsen P H, Kragelund C
,Nielsen J L
,Tiro S
,Lebek M
,Rosenwinkel K -H
,and Gessesse A (2005)
Control of Microthnx parvicella in activated sludge plants by dosing polyalumimum salts Possible
mechanisms Acta hydrochimica et hydrobiologica, 33(3), 255-264
Oerther D B,de los Reyes III F L
,de los Reyes M F
,and Raskin L (2001) Quantifying filamentous micro¬
organisms in activated sludge before, during and after an incident of foaming by oligonucleotide probe
hybridization and antibody stammg Water Research, 35(14), 3325-3336
Pagilla K R,Sood A and Kim H (2002) Gordona (nocardia) amarae foaming due to biosurfactant produc¬
tion Water Science & Technology, 46(1-2), 519-524
Pans S,Lmd G, Lemmer H
,and Wilderer P A (2005) Dosing aluminum chloride to control Microthnx
parvicella Acta hydrochimica et hydrobiologica, 33(3), 247-254
Pitt P A and Jenkins D (1990) Causes and control of Nocardia in activated sludge Research Journal of the
Water Pollution Control Federation, 62(2), 143-150
Pretorius W A and Laubscher C J P (1987) Control of biological scum in activated sludge plants by means
of selective flotation Water Science & Technology, 19(5-6), 1003-1011
Pujol R ,Duchene P
,Schetnte S
,and Canler J P (1991) Biological foams in activated-slduge plants - char¬
acterization and situation Water Research, 25(11), 1399-1404
Rao R S (2004) Surface chemistry of froth flotation, Kluwer Academic / Plenum Publishers, Montreal, Can¬
ada
Rieger L,Koch G
,Kuhm M
, Gujer W ,and Siegnst H (2001) The EAWAG bio-p module for activated
sludge model No 3 Water Research, 35(16), 3887-3903
Roller C, Wagner M ,
Amann R, Ludwig W ,
and Schleifer K -H (1994) In situ probing of Gram-positivebacteria with high DNA G+C content using 23S rRNA-targeted oligonucleotides Microbiology-SGM,140, 2849-2858
Rosenberger S,Laabs C
, Lesjean B ,Gnirss R, Amy G
,Jekel M, and Schrotter J -C (2006) Impact of
colloidal and soluble organic material on membrane performance in membrane bioreactors for mu¬
nicipal wastewater treatment Water Research, 40(4), 710-720
Rossetti S,Tomei M C
,Levantesi C
,Ramadon R, and Tandoi V (2002) "Microthnx parvicella" a new
approach for kinetic and physiological characterization Water Science & Technology, 46(1-2), 65-72
Rossetti S,Tomei M C
,Nielsen P H
,and Tandoi V (2005) "Microthnx parvicella", a filamentous bacte¬
rium causing bulking and foaming in activated sludge systems a review of current knowledge FEMS
Microbiology Reviews, 29(1), 49-64
76

References
Seviour E M,Blackall L L
,Chnstensson C
, Hugenholtz P, Cunningham M A
,Bradford D
,Stratton H M
,
and Seviour R J (1997) The filamentous morphotype Eikelboom Type 1863 is not a single genetic en¬
tity Journal of Applied Microbiology, 82(4), 411-421
Seviour E M,Williams C
,De Grey B ,
Soddel J A,Seviour R J
,and Lindrea K C (1994) Studies on fila¬
mentous bacteria from Australian activated sludge plants Water Research, 28(11), 2335-2342
Seviour E M,Williams C J
,Seviour R J
,and Lmdrea K C (1990) A survey of filamentous bacterial popu¬
lations fromfoammg activated sludge plants in Eastern States of Australia Water Research, 24(4),493-498
Seviour R J and Blackall L L (eds ) (1999) The microbiology of activated sludge, Kluwer Academic Pub¬
lishers, Dordrecht NL
Shjkhuis H (1983) The physiology of the filamentous bacterium Microthnx parvicella PhD thesis, Univer¬
sity of Wageningen Wageningen NL
Stratton H M,Seviour R J
,Soddel J A
,Blackall L L
,and Muir D (1996) The opportunistic pathogen No¬
cardia farcmica is a foam-producing bacterium in activated sludge plants Letters in Applied Microbi¬
ology, 22(5), 342-346
Tandoi V,Jenkins D and Wanner J (2006) Activated sludge separation problems 1 edn
,IWA Publishing,
London
Torregrossa M ,Viviani G and Vinci V (2005) Foaming estimation tests in activated sludge systems Acta
hydrochimica et hydrobiologica, 33(3), 240-246
Tsai M -W,Wentzel M C and Ekama G A (2003) The effect of residual ammonia concentration under
aerobic conditions on the growth of Microthnx parvicella in biological nutrient removal plants Water
Research, 37(12), 3009-3015
Vardar-Sukan F (1998) Foaming consequences, prevention and destruction Biotechnology Advances,
16(5/6), 913-948
Wagner M , Loy A , Nogueira R ,Purkhold U
,Lee N
,and Daims H (2002) Microbial community composi¬
tion and function in wastewaer treatment plants Antonie van Leeuwenhoek, 81(1-4), 665-680
Wallner G, Amann R and Beisker W (1993) Optimizing fluorescent in situ hybridization with rRNA-
targeted oligonucleotide probes for flow cytometric identification of microorganisms Cytometry,
14(2), 136-143
Walstra P (1989) Principles of foam formation and stability In "Foams physics, chemistry and structure"
Wilson A J,ed
, pp 1-15 Springer-Verlag Berlin Heidelberg
Wanner J (1994) Activated sudge bulking and foaming control, Technomic Publishing Company, Inc,
Lanchester, Pennsylvania USA
Wanner J (2000) personal communication Prague Institute of Chemical Technology, Prague, Czech Repub¬lic
Wanner J,Ruzickovâ I, Jetmarovâ P
,Krhutkovâ O
,and Paramakovâ J (1998) A national survey of acti¬
vated sludge separation problems in the Czech Republic filaments, floe characteristics and activated
sludge metabolic properties Water Science & Technology, 37(4-5), 271-279
Westlund A D, Hagland E and Rothman M (1998) Operational aspects on foaming in digesters caused by
microthnx parvicella Water Science & Technology, 38(8-9), 29-34
Wilderer P A, Bungartz H -J
,Lemmer H
, Wagner M ,Keller J
,and Wuerz S (2002) Modern scientific
methods and their potential in wastewater science and technology Water Research, 36(2), 370-393
Wilén B -M,Jin B and Lant P A (2003) The influence of key chemical constituents in activated sludge on
surface and flocculation properties Water Research, 37(9), 2127-2139
77

Characterization and Controllingof Foam and Scum in Activated Sludge Systems
78
Curriculum Vitae
Thomas Hug
2000 - 2006 Ph.D. student at Eawag, Dübendorf and ETH Zurich
1999 - 2000 Civil service and research assistant at Eawag, Dübendorf
(Department of Environmental Engineering)
1997 - 1999 Full-time teaching assistant at ETH Zurich
(Chair of Urban Water Management)
1994 - 1995 Internship at SULZER Chemtech, Winterthur
1991 - 1997 Diploma course Environmental Engineering at ETH Zurich
1984-1990 High school in Winterthur
1978 - 1984 Primary school in Winterthur
13 Jan 1971 Born in Winterthur
79