characterization and classification of cold wave ... · daily minimum temperature data for 26 years...
TRANSCRIPT

Characterization and Classification of Cold Wave Conditions in Rocky Terrains of Jaisalmer District in Thar Desert
B.K. Kandpal* and R.S. MertiaCentral Arid Zone Research Institute, Regional Research Station, Jaisalmer 345 001, IndiaReceived: October 2007
Abstract: The study was conducted to find out the occurrence of low temperature phenomenon in rocky terrain of Jaisalmer predominated by typical run off farming system called Khadin. Daily minimum temperature data for 26 years (1981-2006) were used to estimate mean minimum weekly temperature (Tmin) and absolute mean minimum weekly temperature (TLeast) from standard meteorological weeks 45 to 10. Based on Tmin and TLeast values the weeks were grouped into average/maximum chilling (<7°C), average/maximum near frost (<2°C) and average/maximum frost (<0°C) seasons, respectively, with five frequency distribution (very rare: Pi<5, rare: 5≤Pi≤10, infrequent: 10≤Pi≤20, frequent: 20≤Pi≤50 and very frequent: Pi≥50). The trend as well as correlation studies revealed that the winter climate at Jaisalmer is not entirely frostless. However, the reduction and subsequent rise in temperature generally is in accordance with movement of sun in southern hemisphere. Thus, cold wave/frost hazards can be predicted from simple quadratic regression model with significantly high precision. The chilling season is a regular phenomenon while near frost and frost events are very rare to infrequent throughout the study period except during weeks 52 to 3 when near-frost/frost events are frequently experienced due to the impact of western disturbances. Use of passive rather than active measures of protection will be economical in rainfed subsistence Khadin farming for such short and not so frequent near-frost/frost periods.
Key words: Frost, near-frost, chilling, cold waves, frequency distribution, minimum temperature.
Thar Desert is characterised with low and erratic rainfall, extremes of temperatures and high wind velocity. Jaisalmer District is situated in the heart of Thar. More than one-third area of the district has rocky gravelly undulating terrain with very high run off potential. The runoff during the short monsoon period is traditionally harvested in lower reaches in suitable areas (Khadins) for rabi cultivation of wheat, barley, mustard and gram under in situ moisture conservation (CAZRI, 1992). However, many times rabi crops and other vegetation suffers significantly due to western moving climatic disturbances (Samara et al, 2003; Pratap Narain et al., 2006).
Western disturbances approach the Indian sub continent from the west central Asian region (Afghanistan and Pakistan) during the winter season. They manifest weak troughs of low pressure (with cyclonic circulation) extending from the ground to the lower layers of the atmosphere up to 4-6 km above the earth’s surface. The passage of these disturbances initially causes warm weather followed by rain or snow for a couple of days, and then normally followed by clear skies and chilly winds (cold waves) or thick fog, and frost on calmer nights. The sequence of weather may last
for 5 to 7 days at a time with consequent impact on agricultural productivity. The impact becomes manifold when such western disturbances occur in a sequence (Samara et al., 2003). The effect of these short-term weather variations (cold waves/frost) on crop is determined by the duration and intensity of low temperature and factors such as type of plant, variety, stage of development, amount of leaf cover and wind speed (Tyson et al., 2002). In a rainfed production system up to 90% of the variability in the yield can be attributed to weather differences (Hoogenboon, 2000). Thus, predicting cold wave conditions well in advance and devising strategies to moderate/mitigate the adverse impact of such severe cold/frost on rainfed agriculture and livestock is an important concern in this region. A land use planning through matching crop growth and weather forms a basis for successful agriculture in a given region (Samara et al., 2003).
The traditional method of frost/cold waves prediction is to develop statistical or analytical methods to forecast the minimum temperature and predict cold waves/frost (FAO, 2005). Figuerola and Mazzeol (1997) developed an analytical model for prediction of nocturnal and dawn surface temperatures in order to predict frost. Sutherland (1980) simulated air and soil temperatures by means
Annals of Arid Zone 50(2): 151-158, 2011
*Email: [email protected]

152 KANDPAL & MERTIA
of numerical solutions. Dimiri et al. (2002) developed a statistical model for predicting the maximum and minimum temperatures at Manali, India, while Riable et al. (1999) developed a statistical model for short-term weather forecasting. There have been many empirical and theoretical formulae developed for predicting minimum temperatures, as reviewed by Bagdonas et al. (1978). Most of these models require weather data at periodic interval and thus could not be used as a basis for areas with B or C class manual observatories. Thus, keeping above facts, an attempt has been made to study low temperature phenomenon in Jaisalmer District of Thar Desert and develop methodology to predict cold wave/frost hazards to help farmers of the region.
Materials and MethodsA B-class meteorological observatory of
Regional Research Station, Jaisalmer, is located at 26°56’23” N latitude and 71°1’41” E longitude at an elevation of 240 meters above m.s.l. at the denuded top of the rocky terrain. The rocky undulating terrain with high runoff capabilities for rabi crops is situated in almost 50-65 km radius surrounding the observatory. Meteorological data are recorded twice daily at the observatory. Daily minimum temperature data of last 26 years (1981 to 2006) were used for the present study. For every individual year the data were grouped on standard meteorological week basis for mean minimum weekly temperature (Tmin) and least minimum weakly temperature (TLeast). Simple weekly average of daily minimum temperature (°C) was calculated for estimating Tmin, while absolute lowest minimum temperature (°C) of the week was used as TLeast. Finally weeks falling in rabi season (November to March) were taken for detailed study on cold wave conditions in the region.
Samara et al. (2003) used separate limits for defining coldness for different regions based on departures of temperatures over the normal. However, to maintain the quantitative uniformity absolute temperatures have been used to define limits. Chill is defined as the temperature below 7°C (Okie et al., 1998). It is the temperature, which might slow down growth and development of most of the tropical/sub-tropical plants. Frost occurs when air temperature drops below 0°C and these temperatures may severely damage tropical and sub-tropical plants (FAO, 2005). In addition, the canopy temperatures at the surface can be slightly below air temperature. This would mean that predicting air temperatures slightly above
zero could also be appropriate in predicting frost damages (Sys et al., 1991). In the present study the limit was thus, arbitrarily taken as 2°C.
Based on the average of the lowest temperature Sys et al. (1991) has grouped frost free seasons into three categories, namely- average frost free season, available frost free season and minimum frost free season. In present study the criteria has been slightly modified and six cold wave seasons have been categorised to undertake detailed study. The modified groups are: (1) average chilling season, the period during which Tmin<7°C; (2) average near frost season, the period during which Tmin <2°C; (3) average frost season, the period during which Tmin<0°C; (4) maximum chilling season- the period during which TLeast<7°C; (5) maximum near frost season, the period during which TLeast<2°C; and (6) maximum frost season, the period during which TLeast<0°C.
Prediction of cold wave events and their intensity for agricultural planning needs detailed weekly frequency analysis of the data. The analysis consisted of selecting and subsequently fitting a distribution function to the observed data of 26 years. Weekly Tmin and TLeast were fitted with a probability function.
Let N be the total number of temperature records. The weekly temperature data initially listed according to the year of observation. Subsequently the data are rearranged in descending order and each value is assigned a rank number (m). The lowest rank number is 1. The cumulative probability (Pi) of the temperature with the ranking number m is calculated as Pi= 100 x m/(N+1). The resultant probability is then grouped into 5 frequency distributions as, (i) very rare (less than one year in 20 years or never known to occur, Pi<5); (ii) rare (between one to two years in 20 years, 5≤Pi≤10); (iii) infrequent (between two to four years in 20 years, 10≤Pi≤20); (iv) frequent (between four to ten years in 20 years, 20≤Pi≤50) and; very frequent (more than 10 years in 20 years, Pi≤50). A normal distribution is fitted to the data according to the method of Haan (1979). Quadratic regression model was developed for the prediction of weekly Tmin and TLeast values. Correlation studies between Tmin and TLeast were also conducted with standard procedure.
Results and Discussion
Classification of winter type at JaisalmerClassification of winter type in a region is
based on the temperature characteristics of the

153CHARACTERIZATION AND CLASSIFICATION OF COLD WAVE CONDITIONS
Meteorological Week Minimum Temperature (°C)
No. Code* Rank Period Mean Temp. Std. Dev. Least Temp.45 N1 1 Nov 5-11 14.8 3.0 8.546 N2 2 Nov 12-18 13.5 2.9 6.047 N3 3 Nov 19-25 11.5 3.0 5.048 N4 4 Nov 26- Dec 02 9.5 3.2 1.549 D1 5 Dec 03-09 9.2 3.5 0.550 D2 6 Dec 10-16 8.3 3.3 -0.751 D3 7 Dec 17-23 7.2 3.3 0.052 D4 8 Dec 24-31 6.6 3.6 -3.001 J1 9 Jan 1-7 5.9 3.0 -1.502 J2 10 Jan 8-14 5.9 3.5 -2.703 J3 11 Jan 15-21 6.5 3.6 -3.504 J4 12 Jan 22-28 7.6 4.0 -1.805 F1 13 Jan 29-Feb 04 7.2 3.4 -3.006 F2 14 Feb 05-11 8.7 4.2 -1.707 F3 15 Feb 12-18 10.4 3.9 -2.008 F4 16 Feb 19-25 11.5 4.1 -1.509 M1 17 Feb 26-March 04 12.7 3.4 5.010 M2 18 March 05-11 14.4 2.9 7.5
*N= November, D= December, J= January, F= February, M= March
Table 1. Mean minimum weekly temperature (°C) with standard deviation and extreme minimum temperature recorded at meteorological observatory Jaisalmer during 1981 to 2006
Fig. 1. Average pattern in minimum temperature recorded at Jaisalmer during 1981-2006; (A) Average trend in Tmin values, (B) Probability of non-exceedance of various critical Tmin
values, (C) Average trend in TLeast values, and (D) Probability of non-exceedance of various critical TLeast values.
154 KANDPAL & MERTIA
coldest month (average of the lowest temperature, average daily minimum temperature and average daily maximum temperature). The coldest month in Jaisalmer is January with average monthly temperature of 15.3°C (Table 1). The average daily minimum temperature of 6.7°C is less than 18°C (to classify the climate as equatorial); the average of the lowest of the coldest month (4.1°C) is more than -2.5°C, but less than 7°C; the average daily maximum of the coldest month is 24.0°C; as a consequence, winter type of Jaisalmer is Citrus zone which indicates the winter climate of Jaisalmer is not entirely frostless and winter crops with low cold requirement can only be grown successfully during winter.
Trend analysis on minimum temperature
The Tmin, its range, extreme values (minimum and maximum) with absolute standard deviation for standard week 45 (Nov 5-11) to week 10 (March
5-11) are presented in Table 1. Tmin gradually decreases with the advancement of winter season up to first week of January (5.9°C) then start increasing with almost uniform standard deviation from the absolute minimum temperature (Fig. 1; R2
= 0.98). However, the range of absolute temperature gradually widens with the advancement of winter and reaches maximum value in the second week of February (Week 7). Subsequently, the range started narrowing. The TLeast also followed the trend of Tmin with a lesser magnitude (R2 = 0.833). The TLeast varied between 8.5°C during week 45 (Nov 5-11) to -3.5°C during week 3 (Jan 15-21).
The Tmin value below 7°C was observed during standard week 52 to 3 (December 24 to January 21) while TLeast <7°C was recorded between standard week 46 to 10 (November 12 to March 11). As a consequence average chilling hazards may appear (probability of incidence = 55%) between December 24 to January 21 with a maximum
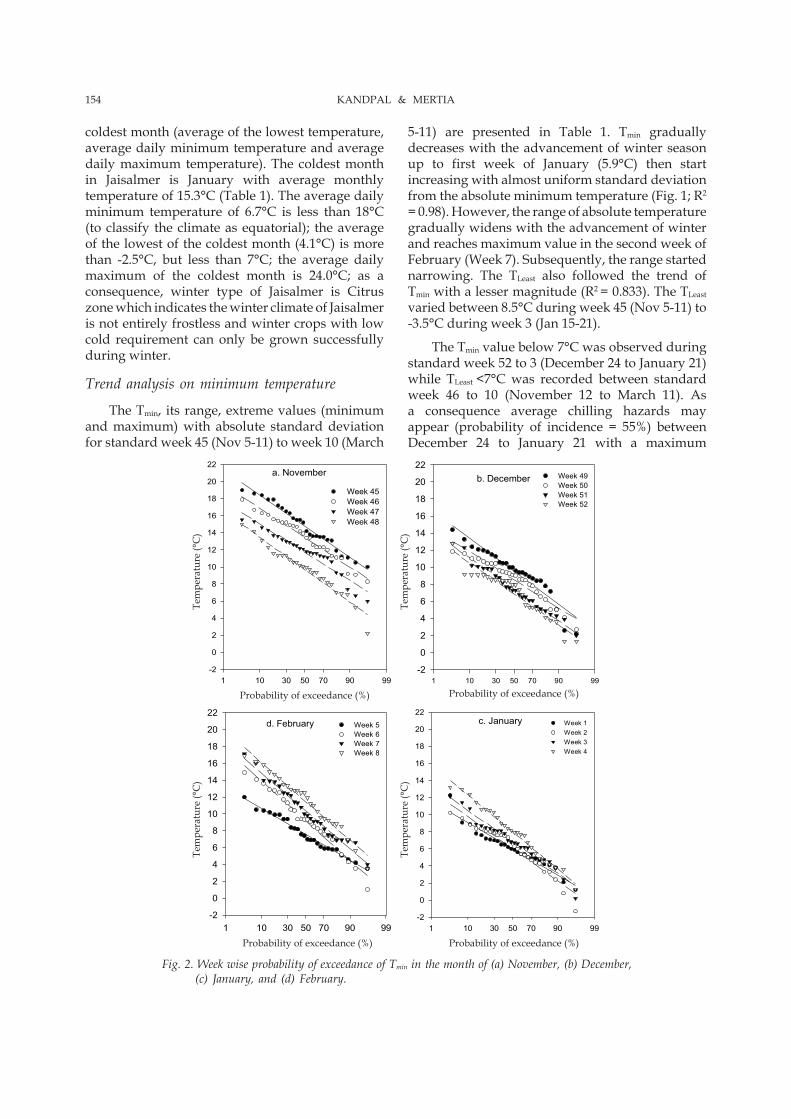
Fig. 2. Week wise probability of exceedance of Tmin in the month of (a) November, (b) December, (c) January, and (d) February.

155CHARACTERIZATION AND CLASSIFICATION OF COLD WAVE CONDITIONS
possible extended period of November 12 to March 11 (maximum chilling season) with a probability of 58%. A narrow range of probability between average and slight cold wave season shows the possibilities of sudden drop in temperature below 7°C due to some local climatic factors, which may not be the consequence of western disturbances.
Further, as expressed in Fig. 3a, Tmin never reach below 2°C, as a consequence of which Jaisalmer does not register regular moderate or severe cold wave season. On an average, the possibility of Tmin going below 2°C is once in 20 years only from December 17 to February 11 (Fig. 1b). However, under western disturbances, the TLeast may go below 2°C during December 1 to February 28 with a probability of about 14% and some times even go below 0°C during December 10 to February 11 (Probability 7%). As a consequence, it is possible for delineating the boundaries of maximum cold wave and maximum frost seasons, respectively.
The quadratic models were fitted to the Tmin and TLeast data over the study period. Following relationship was found:
Tmin= 0.1138 X2 – 2.1826 X + 17.086; R2= 0.9797
TLeast= 0.13 X2 – 2.57 X + 10.29; R2= 0.833
where, X is the meteorological week rank 1 to 18 from meteorological standard week 45 to 10 (Table 1).
The Tmin and TLeast follows almost consistent trend during the study period. The significantly high R2 values in both the equations to predict Tmin
and TLeast, respectively for rocky undulating terrain in Thar Desert reveal negligible influence of other factors viz. western disturbances as hypothesised by Samara et al. (2003) for north-western part of India.
Frequency analysis
Daily minimum temperature of 26 years from 1981 to 2006 has been analyzed and frequency
Fig. 3. Week wise probability of exceedance of TLeast in the month of (a) November, (b) December, (c) January, and (d) February.

156 KANDPAL & MERTIA
distribution of weekly Tmin and TLeast has been plotted in Fig. 2 and Fig. 3, respectively. The study reveals almost negligible chances of Tmin going below 7°C during week 45 to 46 at Jaisalmer. The occurrence of average chilling was found rarely in week 47 (Nov 19-25); infrequently in week 48-49 (Nov 26-Dec 9); frequently in week 50-52 (Dec 10-31) and very frequently in week 1-3 (Jan 1-21), respectively. Further advancement in growing period reduces the probability of average chilling to frequently in week 4-6 (Jan 22-Feb 11); infrequently in week 7-8 (Feb 12-25) and rarely in week 9 onward, respectively. The chances of average chilling continuing for two consecutive weeks was found frequent (29.5≤Pi≤37.6) in week 52-3 (Dec 26-Jan 21); infrequent (10.7≤Pi≤19.2) in week 51-52 and 4-6; and very rare beyond this period. However, continuation of chilling for 3 or more continuous weeks was infrequent to very rare in any part of the winter season at Jaisalmer.
The frequency analysis of weekly TLeast values revealed the possibility of minimum temperature going below 7°C in maximum possible weeks is rare (Pi≤7.4) in standard meteorological week 46 (Nov 12-18); infrequent in week 47 and 9; frequent in weeks 48, 49, 7 and 8; and very frequent (56≤Pi≤94.2) in week 50-6 (Dec 10-Feb 11). Further,
very frequently TLeast<7°C was experienced for two or more consecutive weeks during Dec. 17-Feb. 11 (week 51 to 6). From these plateau weeks chances gradually decrease to frequent, infrequent and rare towards both tail ends.
The chances of mean minimum temperature (Tmin) dropping below 2°C is infrequent (Pi=10.2) in week 2 (Jan 8-14) and rare to very rare in rest of the winter season. It can thus be concluded that average near-frost season is infrequent to rare at Jaisalmer. However, absolute near-frost situation may frequently (22.2≤Pi≤23.9) occur in week 52, 2 and 3. Beyond these weeks chances of absolute near-frost gradually decrease from infrequent to rare towards both tail ends. Addition to it, the probability of Tmin or TLeast dropping below 2°C in consecutive 2 or more weeks was found rare to very rare.
In general, winter season in Jaisalmer remained frost free except for rare chances (Pi=6.0) of frost (Tmin<0) in week 2 (Jan 8-14). However, frosty days may occur infrequently (10.0≤Pi≤12.0) in week 1-3 (Jan 1-21); and rarely (5.7≤Pi≤9.3) on rest of the weeks from 50 to 8 (Dec 10-Feb 25). Similar to near frost conditions chances of average or maximum frost season extending to 2 or more consecutive weeks was found very rare.
Met. week Tmin vs. TLeast Tmin vs. Tmin TLeast vs. pre-Tmin TLeast vs. pre-TLeast
45 0.946** - - -46 0.847** 0.645** 0.406* 0.508**47 0.933** 0.605** 0.633** 0.654**48 0.872** 0.814** 0.627** 0.627**49 0.882** 0.564** 0.484** 0.561**50 0.880** 0.490* 0.335 0.447*51 0.924** 0.602** 0.382 0.434*52 0.827** 0.595** 0.517** 0.521**01 0.877** 0.332 0.334 0.39002 0.904** 0.645** 0.681** 0.732**03 0.718** 0.375 0.498** 0.510*04 0.905** 0.515** 0.584** 0.574**05 0.698** 0.711** 0.649** 0.685**06 0.882** 0.779** 0.558** 0.705**07 0.888** 0.342 0.453** 0.563**08 0.921** 0.581** 0.590** 0.582**09 0.685** 0.283 0.169 0.29410 0.836** 0.323 0.165 0.522**
* Correlation in significant at the 0.05 level (2-tailed)** Correlation is significant at the 0.01 level (2-tailed)Note: Pre-Tmin and pre-TLeast are the Tmin and T Least for the preceding weeks, respectively.
Table 2. Correlation study between mean minimum weekly temperature (Tmin) and absolute least minimum weekly temperature (TLeast) during 1981 to 2006 at Jaisalmer
157CHARACTERIZATION AND CLASSIFICATION OF COLD WAVE CONDITIONS
Tmin vs. TLeast
The correlation studies between Tmin and TLeast are presented in Table 2. TLeast was strongly correlated with Tmin as well as TLeast of preceding week (pre-TLeast) throughout the study period. It suggests gradual, but predictable change in minimum temperature due to movement of sun in southern hemisphere. The relationship of Tmin and TLeast with the Tmin of preceding week (pre-Tmin) was also found significant throughout the study period except in standard week 50, 51, 1, 3, 7, 9 and 10 when either of TLeast or Tmin have poor correlation with pre-Tmin. It may be due to affect of some outer factors like cold waves during week 50 to 3 and occasional high wind speed from week 7 onwards. The correlation study further confirms very short period when cold waves from western Asia could affect the vegetation in rocky terrain of Jaisalmer.
Cold wave management strategiesThe cold wave management techniques are
often separated into passive and active methods (FAO, 2005). Passive methods are those that act in preventive terms, normally for a long period of time and whose action becomes particularly beneficial when freezing conditions occur. Passive methods relate to biological and ecological techniques including practices carried out before a frost night to reduce damage. Active methods are temporary and they are mostly energy or labor intensive, or both. They require efforts on the day preceding or during the night of the frost/cold wave event. Active protection includes heaters, sprinklers and wind machines, which are used during the frost night to replace natural energy losses.
The chilling conditions restrict the growth and development of tropical plants, but it is near-frost or frost which severely damages the crops depending upon the growth stage. The trend and frequency analysis of minimum temperature data reveals although chilling season occurs very frequently during January 1-21 with maximum feasibility of occurrence in any week between December 10 to February 21, but near-frost or frost conditions may infrequently occur any time between December 26 to January 21. So investing on active protection measures will be uneconomical for such short and infrequent events. However, passive protection measures could satisfactorily be used to manage cold wave effects in rocky terrain of Thar Desert. These measures include, site selection, managing cold air
drainage, selection of cold/frost resistant plants/crops/varieties, canopy trees/shelterbelts, plant nutrition management, proper pruning, chemicals to delay blooming, plant covers, avoiding soil cultivation, mix cropping, removing cover crops, soil covers, painting trunks, trunk wraps, bacterial control and seed treatment with chemicals (FAO, 2005; Samara, 2003).
ReferencesBagdonas, A., Georg, J.C. and Gerber, J.F. 1978.
Techniques of frost prediction and methods of frost and cold protection. World Meteorological Organization Technical Note No. 157. WMO 487:160.
CAZRI 1992. Integrated Natural and Human Resource Appraisal of Jaisalmer District. CAZRI Publication No. 39. Central Arid Zone Research Institute, Jodhpur. 165p.
Dimiri, A.P., Monanty, U.C., Madan, O.P. and Ravi, N. 2002. Statistical model-based forecast of minimum and maximum temperatures at Manali. Current Science 82(8): 997-1003.
FAO 2005. Frost Protection: Fundamentals, Practices and Economics. Environment and Natural Resources Series No. 10. FAO Rome.
Figuerola, P.I. and Nazzeo, N.A. 1997. An analytical model for the prediction of nocturnal and dawn surface temperatures under calm, clear sky conditions. Agriculture and Forest Meteorology 19(3): 247-255.
Haan, C.T. 1979 Risk analysis in environmental modification. In Modification of the Aerial Environment of Crops (Eds. B.J. Barfield and J.F. Gerber), pp. 30-51. American Society of Agricultural Engineering (ASAE), Monograph No. 2. St. Joseph, Michigan.
Hoogenboon, G. 2000. Contribution of agro-meteorology to the simulation of crop production and its applications. Agricultural and Forest Meteorology 103(1-2): 137-157.
Okie, W.R., Reighard, G.L., Newall Jr. W.C., Graham, C.J., Werner, D.J., Powell, A.A., Krewer, G. and Beckman T.G. 1998. Spring freeze damage to the 1996 peach and nectarine crop in the southern United States. Horticulture Technology 8(3): 381-385.
Pratap Narain, Kar, Amal, Rao, A.S., Mertia, R.S., Kandpal, B.K., Goyal, R.K. and Moharana, P.C. 2006. Report on the Impact of Cold Wave Conditions in Rajasthan during December 2005 to January 2006. Central Arid Zone Research Institute, Jodhpur. 11p.
Raible, C.C., Bischof, G., Fraedrich, K. and Kirk, E. 1999. Statistical single-station short term forecasting of temperature and probability of precipitation: Area interpolation and NWP Combination. Weather and Forecasting 14(2): 203-214.
Samara, J.S., Singh, Gurbachan and Ramakrishna, Y.S. 2003. Cold Wave of 2002-03: Impact on Agriculture. Natural Resource Management Division, Indian Council of Agricultural Research, New Delhi. 49 p.
158 KANDPAL & MERTIA
Sutherland, R.A. 1980. A short-range objective nocturnal temperature forecasting mode. Journal of Applied Meteorology 19(3): 247-255.
Sys, C., Van Ranst, E. and Debaveye, J. 1991. Land Evaluation Part- II: Methods in Land Evaluation.
International Training Centre for Post Graduate Soil Scientist, University of Ghent, Belgium. 247 p.
Tyson, A.W., Sneed, R.E., Mainland, C.M., Perry, K.B., Polling, E.B., Sanders D.C. and Unrath, R. 2002. Frost/Freeze Protection by Sprinkler Irrigation, www. smallfruits.org/Weather/frost_freeze.htm