characterization and analyses of valves, feed … · characterization and analyses of valves, ......
TRANSCRIPT

1
Characterization and Analyses of Valves, Feed Lines and Tanks Used in Propellant Delivery Systems at
NASA SSC
Harry Ryan and David CooteNASA, Stennis Space Center, MS
andVineet Ahuja and Ashvin Hosangadi
CRAFT Tech, Pipersville, PA
54th JANNAF Propulsion MeetingDenver, CO
May 15, 2007
https://ntrs.nasa.gov/search.jsp?R=20060050063 2018-08-20T11:01:52+00:00Z

2
SSC Regional Map

3
Complete Suite of Test Capability and Expertise
E-1 StandHigh Press., Full Scale
Engine Components
E-2High Press.Mid-Scale& Subscale
A-1 … Full Scale Engine Devt. & Cert … A-2
E-3High Press.Small-ScaleSubscale B-1/B-2 … Full Scale Engine/Stage Devt. & Cert
Components …Engines … Stages

4
SSC Support Facilities
Cryogenic Propellant Storage FacilitySix (6) 100,000 Gallon LOX BargesThree (3) 240,000 Gallon LH Barges
High Pressure Industrial Water (HPIW)330,000 gpm Delivery System
High Pressure Gas Facility (HPGF)(GN, GHe, GH, Air: ~ 3000 to 4000 psi)
Additional Support • Laboratories
Gas and Material AnalysisMeasurement Standards and CalibrationEnvironmental
• Shops• Utilities
Provides forLong DurationCapability

5
NASA SSC Design & Analysis Division
• Modeling and Analysis development and integration into RPT
• Fluid Mechanics/Thermal Analysis of Propellant Systems
• Liquid• Gas
• CFD• Structures/Loads Analysis• Thermal/Heat Transfer Analysis
Electrical Systems & Software
• Data Acquisition• Instrumentation & Signal Conditioning• Controls & Simulation • DACS Lab Management• Data Systems Management• Ancillary Systems/Electrical Power
Mechanical and ComponentSystems
• Cryogenic Propellant Systems • Storable Propellant Systems & HPIW• Hydraulics/pneumatics Systems• Press Gas/Purge Systems (TBA)• Components• Materials• Ancillary Systems
• TMS, Measurement Uncertainty• Standards & Specifications
Systems Analysis & Modeling
Design and Analysis Division
• Configuration Management• Records Retention DB Management
Organization Goal:• Develop and maintain propulsion test systems and facilities engineering
competencies• Unique and focused technical knowledge across respective engineering disciplines applied to
rocket propulsion testing. e.g.,• Materials selection and associated database management• Piping, electrical and data acquisition systems design for cryogenic, high flow, high pressure propellant supply
regimes• Associated analytic modeling and systems analysis disciplines and techniques• Corresponding fluids structural, thermal and electrical engineering disciplines

6
• SSC Has Developed & Implemented Effective Analytic Modeling & Simulation Tools To Support Propulsion Testing– Rocket Propulsion Test Analysis (RPTA) Model (FORTRAN) Used to Simulate
Propulsion Test Facility Systems (e.g., LOX Run System) Heritage of Model Dates to Pressurization and Propellant Systems Design Tasks for Space Shuttle and X-33Model Adapted, Validated and Currently Used at SSC to Simulate Facility Pressurization and Propellant Systems
– Fluid Flow Analysis (Flowmaster)– Finite Element Analysis (ANSYS)– Computational Fluid Dynamics (CRUNCH CFD Code) Used for Select
Propulsion Test Situations • Have Experienced Analysis Team that Routinely Solves Pressurization
and Propellant System Problems• Integrated Facility Simulation and Analysis Has Led to Substantial Project
Cost and Schedule Savings
Integrated Facility Simulation and Analysis

7
Integrated Performance Modeling Capabilities Substantially Improves
Understanding & Knowledge of Test Systems Performance that has Translated to Efficient Test Facility
Design, Activation & Test Operations
GH2 Activation TestJune 29, 2004
• Analytic Tools Available for Propulsion Test Facility Modeling & Analysis• Comprehensive Propellant System Thermodynamic Modeling & Test Simulation
625 ft3 15,000 psig
UHP GH2 Bottles
MV10A89
GH
FCV10A27
GH
FCV10A26
GH
To HPFlare
MV10F22
GH
Mixer
ToCell 3
MV10F21
LH
MV10F20
LH
GF10A4255
LH
VPV10F23
LH
MV10A4269
LH
LPTP
FMVTo HPFlare
TC100GH
PE10A1402
LH
625 ft3 15,000 psig
625 ft3 15,000 psig
PE436GH
200 204 208 212 216 220
7000
6000
5000
4000
3000
2000
1000
0
TIME SECONDS
UHP Bottle Pressure
Predicted vs
Actual
Interface Pressure
Mixer Pressure
20 mph Wind
Distance from Discharge (ft)
Advanced Capabilities in
CFD Modeling & Analysis
Integrated Facility Simulation and Analysis

8
1.0 1.5 2.0 2.5 3.0
100
80
60
40
20
0
TIME SECONDS Seconds from 155
WinPlot v4.3 b01
11:59:21AM 09/19/2003
Test:Engine:Shutdown:
LDAS2_TPS_E1_M_2476F.winSerial #10.000
JaredTest_37DynVal.WPLunknown200.000
JaredTest_37DynVal.WPL VPOc PCV Position FeedbackLDAS2_TPS_E1_M_2476F.win PZT10F031 HP LOX Tank
LDAS2_TPS_E1_M_2476F.win PZY10F03 HP LOX Tank 6
• Temporal Transient Thermodynamic Modeling of Integrated Propellant Systems• Thermodynamic Control Volume Solver Model Accurately Models High-Pressure
Cryogenic Fluids and High-Pressure Gaseous Systems. Model Features Include:– High-Fidelity Pressure Control Valve (PCV) & Closed Loop Control System Model
• RPTA Model Validated Through Test Data Comparisons– IPD Fuel Turbopump, RS-84 Sub-Scale Pre-Burner, RS-83 Pre-Burner Cold Flows,
SSME Flowliner Activation & IPD Engine System
Valve Command
Valve Position• Red = Model• Green = Test
Data
A Significant Feature of the RPTA Model is the Coupling of Control Logic (Electro-Mechanical Process) with Thermodynamic Processes
Pressure Control Valve (PCV) Model Developed & Validated
Rocket Propulsion Test Analysis (RPTA) Model

9
RPTA Model Application ExampleLOX/Methane Testing at E-3 (Nov. 2006)
Facility Activated and Test Performed• Liquid Methane (LM) & Liquid Oxygen
(LOX) Propellants Used• Facility Model Results and Facility Test
Activation Results Agree Well• Test Capability: ~25 seconds
Tank Press.
Orifice Press.
I/F Press.
Facility LM System ReconstructionActual vs. Model
LM System Schematic

10
Comprehensive & Rapid Piping System Design & Analysis Capability
• Commercial Tools Employed to Augment Analysis
• Example: FlowMaster Piping System Analyzer
– Allows for Steady-State or Transient Analysis, Compressible or Non-Compressible Flow
– Includes Heat Transfer, Flow Balancing, Priming & Sizing Analysis
Water Hammer Effect Due to Rapid Closure of Main Fuel Valve
Propellant Flow to Test Article Due to Rapid Opening of Main Fuel Valve
Valve closing time (ms)
11
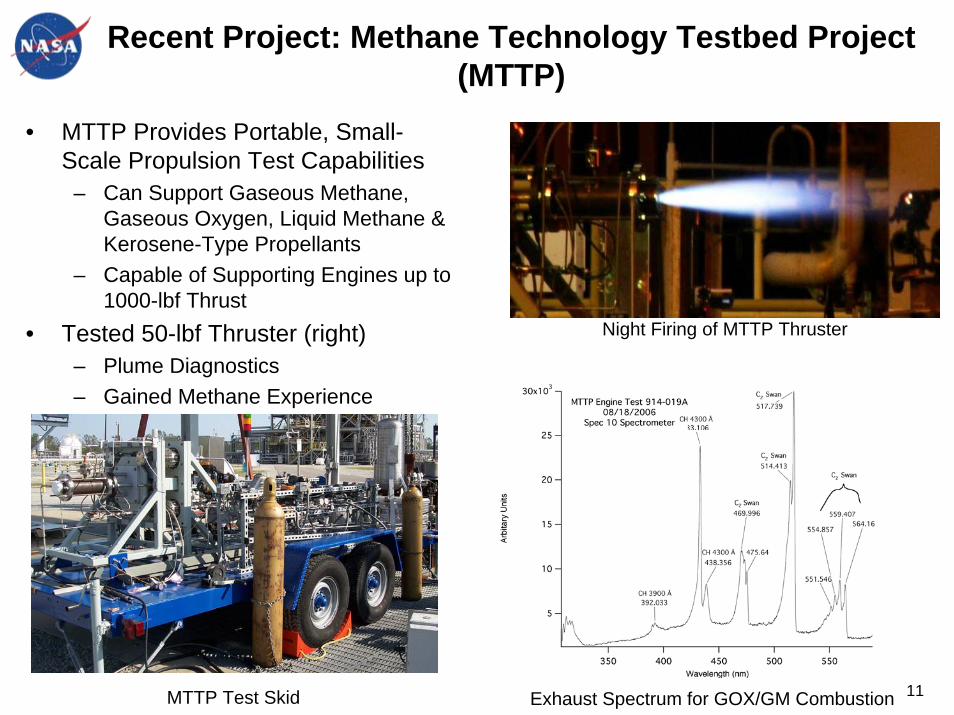
Recent Project: Methane Technology Testbed Project (MTTP)
• MTTP Provides Portable, Small-Scale Propulsion Test Capabilities
– Can Support Gaseous Methane, Gaseous Oxygen, Liquid Methane & Kerosene-Type Propellants
– Capable of Supporting Engines up to 1000-lbf Thrust
• Tested 50-lbf Thruster (right)– Plume Diagnostics– Gained Methane Experience
MTTP Test Skid
Night Firing of MTTP Thruster
Exhaust Spectrum for GOX/GM Combustion

12
Recent Project: 14’’ Valve TestDescription of Test Objectives
Test Details• Conducted Valve Chill Down Test at
the E-2 Test Stand• Used Liquid Nitrogen (LN) to Chill
Down the Valve• Instrumented Valve with Multiple
Thermocouples on the Valve Body and Stem
• During Chill Down Operations, the Valve was Cycled Multiple Times to Test Proper Valve Operation at Low Temperatures
14’’ Valve During Chill Down
Test Objectives• Collect Data Needed to Support a Decision to Install a 14” Valve (26,000 lb)
on the E-1 Test Stand as the High Pressure (8,500 psi service) LOX Tank Isolation Valve
• Determine the Behavior of the Valve in Simulated Operating Conditions • Determine the 14’’ Valve Bonnet and Body Steady State Temperatures

13
14’’ Valve Test Results
Analytical Accomplishments• Identified Issue with Asymmetric Bonnet
Wear at Cryogenic Temperatures• Verified Analytical Predictions for the
Heat Load of the Valve– Determined the Valve Heat Load– Determined the Valve Chill Down
Time Constant – Test Results Will Be Used to Guide
Bonnet Re-Design
Thermal Image of Valve After Test
Picture of Frost Line After 23 Hours of Chilling
Test Results• Test Lasted About 24 Hours• About 6500 gal of LN Was Used for the
Valve to Reach a Steady State Condition
• Boil Off Results Were Used to Calculate the Steady State Heat Load of the Valve
Valve Mount

14
14” Valve ANSYS Workbench Thermal Simulation
Measured Steady-StateFrost Line
Measured Valve Heat Load: 9308 BTU/Hr
Predicted Steady-State Frost Line
Predicted Valve Heat Load: 9315 BTU/Hr
3-D ANSYS FiniteElement Model:275,000 Nodes185,000 Elements
Pro-E Solid Model
Boiling LN2 Convective Film Coefficient
2.00E-05
5.20E-04
1.02E-03
1.52E-03
2.02E-03
2.52E-03
3.02E-03
3.52E-03
0 50 100 150 200 250 300 350 400
| Bulk Temp - Surf Temp | (F)
Film
Coe
ffic
ient
(BTU
/sec
-in^2
-F)
Convective Film Coefficient for Natural Convection of Air over Horizontal Cylinder
0.0E+00
5.0E-07
1.0E-06
1.5E-06
2.0E-06
2.5E-06
3.0E-06
3.5E-06
-400 -350 -300 -250 -200 -150 -100 -50 0 50 100
Average Film Temperature (F)
Film
Coe
ffici
ent (
BTU
/sec
-in
^2-F
)
NIST / MIL-HDBK Temperature Dependent Material Properties
Empirically Based Temperature Dependent Boundary Condition Parameters
Geometry Description
Analysis Model
Loads & Boundary Conditions
Validated Results
Von-Mises Stress Total Deformation
Deformation @ 89X
Radiation
Boiling Convection
Natural Convection

15
Computational Fluid Dynamics (CFD) Analysis
• Analyses of Valve Performance – Valves Can Vary from High Pressure Gaseous Valves to Valves
Operating with Cryogenic Liquids• Analyses of Valve Chatter
– Unsteady Simulations of Pressure Regulator Valve• Analyses of Valve Scheduling
– Framework Developed for Moving Valve Calculations– Prediction of Valve Response to Plug operation– Valve Motion Specified as Plug velocity or Plug Displacement Curve
• Propellant Tank Mixing Behavior– Model Mixing Between Pressurization Gas and Liquid in a Run Tank
• Plume Dynamics– Model Interaction of Plumes with Facility Systems
Employ CFD Methodologies to Elucidate Select Propulsion Test Situations

16
Valve Chatter in Pressure Regulator Valve
Stream Traces
Pressure Traces on Various Probe Points on the Poppet Indicating a
Global instability
4043 Hz
FFT of Pressure Traces Indicating a 4 KHz Chatter
Frequency
Axial Instability Responsible for Chatter Was Identified
• Simulation Identified a 4 KHz Frequency; During Testing a 6 KHz Frequency Was Observed
• Simulation Did Not Account for Fluid-Structure Interaction or Spring Loading of PoppetInlet P = 4400 psi
800 psi

17
Overview of Framework for Valve Scheduling
• Automated Grid Motion with CRUNCH for Multi-Element Unstructured Grids
• A Library of Discrete Grids is Maintained That Define the Path of the Motion– This Permits Grid Topology to Change and Adapt to Requirements
of Flow Physics Along Path of Motion– For Example, a Valve Which is 5% Open Has Different Mesh
Requirements and Topology from a Valve That is 80% Open– Distortion of Grids is Minimized During Grid Motion– The Number of Grids Required in the Library is Kept to a Minimum
• Grid Motion Between the Library Grids is Carried Out with a Generalized Mesh Motion Solver Utilizing the Equations of Elasticity – Grid Motion is Carried Out Between Successive Library Grids– Solution is Interpolated onto New Library Grid When One is
Encountered – Entire Procedure Works in Parallel Processor Environment and is
Transparent to the User• Procedure Maintains Solution Accuracy and is Very Robust

18
Variable Topology Issues With Grid Motion
Cryogenic Valve at 8% Open Cryogenic Valve at 70% Open
• Different Topologies at Different Plug Settings
• 8% Case Seat Region Has All Hexahedral Cells to Resolve Large Gradients in Pressure & Velocity
• 70% Case Seat Region Has Prismatic, Tetrahedral Elements
• LOX Valve – Cv is Compared with Experimental Data and FDNS Code at Different Discrete Settings
• CRUNCH CFD is in Excellent Agreement with Data – Plot is in log scale for Cv
• At Small Openings Density is Strongly Influenced by Pressure. These Real Fluid Effects Captured in CRUNCH Simulation – FDNS Diverges at Openings Smaller than 20%
Flow

19
New Procedure for Moving Valve Simulation
Step 1Library Grid at 50% Open Position
Automated Mesh Motion Using Stress Based Solver Moves Grid from 50% Open to 60% Open
Library Grid at 60% Open Position
Distorted Mesh at 60% Open Position
Solution
Transfer
Step 2
For Generalized CFD Analyses of Moving Valve Problems, Such as Valve Scheduling, Valve Stall & Valve Instabilities, a Library Grid Approach is Taken in Conjunction with Grid Movement. This Permits Use of Variable Grid Topology & Permits Accurate Representation of Valve Flow Fields in the Seat Region Especially at Small Valve Openings Where Seat Dynamics Dominate. The Procedure is Illustrated Below:
20
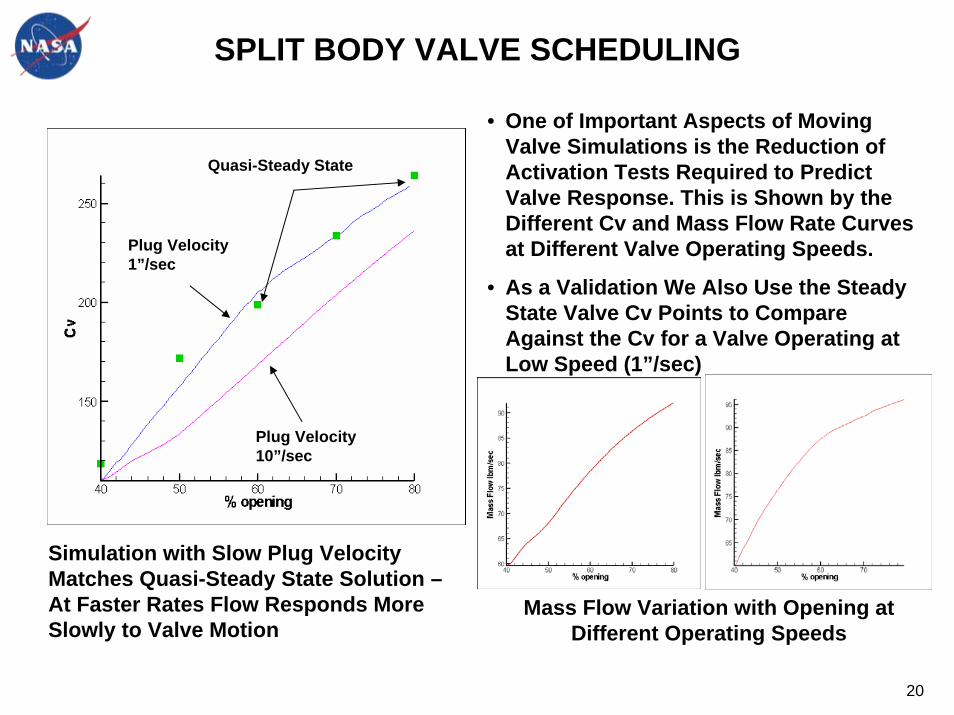
SPLIT BODY VALVE SCHEDULING
Quasi-Steady State
Plug Velocity 10”/sec
Plug Velocity 1”/sec
Simulation with Slow Plug Velocity Matches Quasi-Steady State Solution –At Faster Rates Flow Responds More Slowly to Valve Motion
Mass Flow Variation with Opening at Different Operating Speeds
• One of Important Aspects of Moving Valve Simulations is the Reduction of Activation Tests Required to Predict Valve Response. This is Shown by the Different Cv and Mass Flow Rate Curves at Different Valve Operating Speeds.
• As a Validation We Also Use the Steady State Valve Cv Points to Compare Against the Cv for a Valve Operating at Low Speed (1”/sec)

21
4-INCH Y-PATTERN VALVE ANALYSES
Multi-Element GridConfiguration
• Flow Solution for Valve Operating in “Flow Over Plug” Mode
Swirl in Discharge Duct and in Seat Region
Separation behind Plug
Results
To Resolve Boundary Layers
Helps in Automated Grid Generation for Library Grids
Efficiently Grid Cylindrical
Pipes

22
4-INCH Y-PATTERN VALVE SCHEDULING
Displacement Curve for Plug Motion Variation of Cv with Valve Motion
T = 0.02 secs T = 0.73 secs T = 1.15 secs
Moving Valve Simulation
Data
Velocity Distribution (m/s) in Moving Valve. As Valve Closes a Large Recirculation Develops Behind Plug Affecting Pressure & Consequently Cv.
Flow
Moving Valve Simulation in Good Agreement with Test Data
Rapid Deceleration
Rapid Acceleration
23
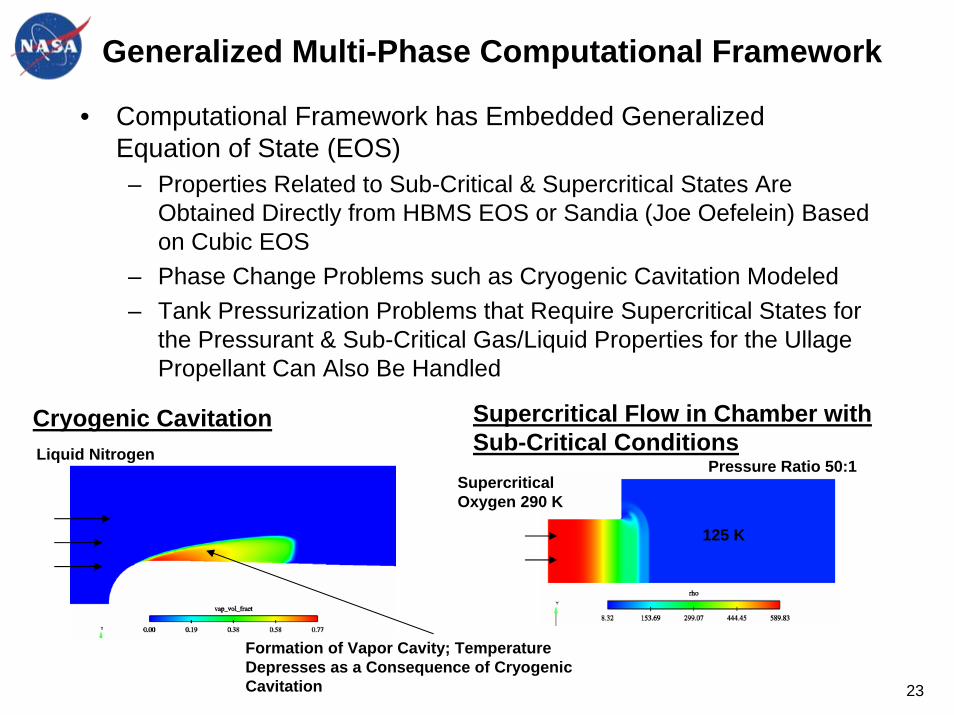
Generalized Multi-Phase Computational Framework
• Computational Framework has Embedded Generalized Equation of State (EOS)– Properties Related to Sub-Critical & Supercritical States Are
Obtained Directly from HBMS EOS or Sandia (Joe Oefelein) Based on Cubic EOS
– Phase Change Problems such as Cryogenic Cavitation Modeled– Tank Pressurization Problems that Require Supercritical States for
the Pressurant & Sub-Critical Gas/Liquid Properties for the Ullage Propellant Can Also Be Handled
Cryogenic Cavitation Supercritical Flow in Chamber with Sub-Critical Conditions
Supercritical Oxygen 290 K
Pressure Ratio 50:1
125 K
Formation of Vapor Cavity; Temperature Depresses as a Consequence of Cryogenic Cavitation
Liquid Nitrogen
24
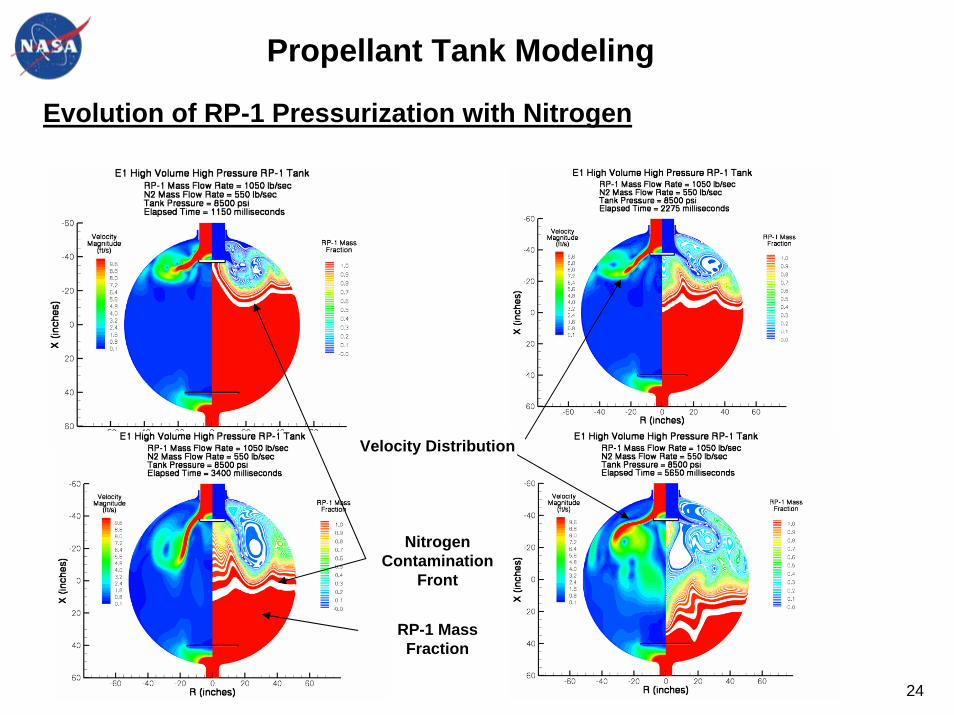
Evolution of RP-1 Pressurization with Nitrogen
Nitrogen Contamination
Front
RP-1 Mass Fraction
Velocity Distribution
Propellant Tank Modeling

25
Summary
• SSC has Developed a Suite of Effective Analytic Modeling and Analysis Tools Providing High Fidelity Assessment of Test Stand Performance
– Rocket Propulsion Test Analysis (RPTA) Model, a 1-D Propellant System Analyzer
– CFD Successfully Applied to Select Propulsion Test Situations Including Valves, Feed Line and Propellant Tank Scenarios
– Finite Element Analysis (ANSYS)
• Analytic Tools Exercised Regularly on a Variety of Propulsion Test Projects by Experienced Analysts
– Active Test Facilities (1.0 to 1.5 Mlbf Thrust, 8500 psi LOX/LH/RP-1 Supply)
– Active Test Projects (e.g., J-2X PPA, J-2X at PBS, TGV)
For Additional Information/Discussion Please Contact :For Additional Information/Discussion Please Contact :David Coote 228-688-1056, Email: [email protected] Klein 228-688-7554, Email: [email protected] Harry Ryan 228-688-2757, Email: [email protected]