characteristics of seismic data used to study thereservoir
TRANSCRIPT
ISSN: 2319-8753
International Journal of Innovative Research in Science,
Engineering and Technology
(An ISO 3297: 2007 Certified Organization)
Vol. 3, Issue 11, November 2014
DOI: 10.15680/IJIRSET.2014.0311043
Copyright to IJIRSET www.ijirset.com 17382
Characteristics of Seismic Data Used To Study the
Reservoir of South Torgay Oil and Gas Basin
Istekova S.A1, Umirova G.K
1
Kazakh National Technical University, Named After K. I. Satpayev- Almaty, Kazakhstan
ABSTRACT: The proposed technology of quantitative interpretation using seismic attributes analysis techniques
based on 3D seismic materials enabled to carry out structural building and prediction of geological parameters,
productive layers in clastic sediments of the South Torgay oil basin.
KEY WORDS: Quantitative interpretation, 3D seismic, geological parameters, reservoir, sediments, exploration,
hydrocarbons.
I.INTRODUCTION
Modern seismic exploration in the modification of 3D on hydrocarbon deposits can solve quit small geological
problems. Today in Kazakhstan fields, seismic survey results are used not only for conventional structural imaging, but
also for forecasting of geological parameters of the studied formation. This forecast is based on the determination of
quantitative relationships between geological parameters determined based on GIS in located well and parameters
(attributes) of the seismic signal, calculated near these located well.
The purpose of the application of quantitative interpretation of seismic data is the forecast of reservoir
properties and fluid saturation at certain distances from the wells drilled. This should be evaluated by the accuracy of
the forecast and the risks associated with the uncertainty of geophysical methods and geological conditions. For this
statistical analysis of the elastic properties of rocks exposed in the wells, the used results for the probability prediction,
classification of lithology and fluid depend on the results of simultaneous inversion [1].
II. PREVIOUS WORK AND METHODOLOGY OF INTERPRETATIONS
The method of quantitative interpretation depends on the quality of input data: completeness and quality of
borehole curves; the reliability of their petrophysical interpretation; optimum parameters of the field records seismic
data; the quality of their digital processing and on the elastic properties of the rocks themselves (mainly physical
dismemberment of different lithotypes). This also applies to rocks occurring at great depths, and rocks differing in
porosity and fluid saturation. Quantitative deep involvement trends in the interpretation of seismic data greatly
increases their predictive value and reduces the uncertainty of the results. The study of the elastic properties of rocks
statistical methods enables the possibility of prediction parameters are not established deep drilling, as well as the
expected variability of physical parameters [2].
In the article, proposed method of quantitative interpretation showed the possibility of using seismic data for
quantitative prediction of the geological section in the oil and gas fields of Kazakhstan. High-quality 3D seismic data,
the application of modern processing algorithms that allow to obtain seismic data, both by the full amount, and partial
or angular amount in a complex with the results of data interpretation, allow the use of seismic data as a basis for
structural imaging, tracing faults, reservoir description and forecasting of reservoir properties in the inter-well space.
Information obtained from the seismic trace, called seismic attributes are some of the main methods of seismic
facies analysis and forecasting changes lithology productive part of gas-oil section by seismic data. Seismic attributes
using information related to the amplitude, shape and location of the seismic signal more susceptible to changes in the
parameters of reflections than the traditional methods of seismic imaging data. [3].

ISSN: 2319-8753
International Journal of Innovative Research in Science,
Engineering and Technology
(An ISO 3297: 2007 Certified Organization)
Vol. 3, Issue 11, November 2014
DOI: 10.15680/IJIRSET.2014.0311043
Copyright to IJIRSET www.ijirset.com 17383
Seismic attribute analysis typically begins with an analysis of the rock properties. Typically, study of the
properties of rocks begins with an analysis of their properties on GIS. Through the analysis of the properties of rocks
and direct modeling can identify the basic seismic attributes and determine their ability to distinguish important
reservoir and lithology characteristics. [4].
There is a general classification of attributes: 1-D attributes - computed one seismic trace, 2-D and 3-D
attributes - computed using the information of adjacent traces.
Attributes include:
Time attributes - are connected with a vertical signal on seismic section;
complex attributes tracks - the seismic information is considered as an analytical track, which consists of the
real and imaginary parts;
- Amplitude, phase, and frequency attributes;
- attributes in the window - attributes that summarize the information within a specified window of the vertical
seismic data;
- attributes - Fourier attributes in the frequency domain obtained by applying the Fourier transform (the
spectral decomposition);
a lot of the trace attributes - attributes computed using more than one of the original seismic trace, which provide
quantitative information about the lateral variation seismic data (coherence, angle, azimuth, curvature) [5].
In general attributes by time characterize the structure; amplitude attributes characterize the stratigraphy or the
presence of hydrocarbons and attributes by frequency - stratigraphy or collector. Multicomponent seismic attributes can
detect faults and fracture and determine their orientation. Attributes of from the damping can help detect gas deposits.
In the presence of a sufficient number of wells basic attributes collector can be used on a producing field to optimize
drilling.
Thus, the seismic attributes provide physical information in solving the following specific geological
problems:
- change in lithology, the presence of gas (bright spots) - Envelope;
- lateral continuity of reflectors, bedding configuration -Phase;
- Layer capacity, the presence of hydrocarbons, fractured zones - Frequency;
- breach, cracks, lateral extent reflecting seismic
- horizons, mapping fluvial deposits - Coherence, Volumetric curvature;
- Layer capacity - Spectral Decomposition
The technology of using seismic attributes sufficiently well established for seismic 3D, which have a uniform
quality and high density of observation points, which gives great possibilities to explore the promising sites previously
inaccessible to conventional methods of interpretation of seismic data [3].
Analysis of seismic data considered by the example of the contract territory, located in the eastern part of the
basin Aryskum South of Torgay oil basin, within the eastern wing of known graben syncline complicated with fault.
The territory is composed of Proterozoic and Paleozoic sediments, forming a foundation deflection overlapping Meso-
Cenozoic platform cover. Oil and gas regions associated with the Middle Jurassic, Upper Jurassic, and Lower
Neocomian, Upper Neocomian deposits. Collectors in all productive horizons are silty-sand formations formed in the
various facies environments. In 1984, the north-east of the study area was discovered a large oil and gas field Kumkol.
Then, in the category of fields, crossed prepared seismic structure Aksai Maibulak, KyzylkiyaAkshabulakAschisay,
Arys, Nuraly. The basic prospects are scheduled during the Jurassic-Cretaceous sediments at depths of 700-1500 meters
[6].
ISSN: 2319-8753
International Journal of Innovative Research in Science,
Engineering and Technology
(An ISO 3297: 2007 Certified Organization)
Vol. 3, Issue 11, November 2014
DOI: 10.15680/IJIRSET.2014.0311043
Copyright to IJIRSET www.ijirset.com 17384
At the site were carried out seismic survey 2D, 3D, processing, interpretation and re-interpretation of
geological and geophysical data 2D past years. Geophysical studies were conducted to detailed study and identification
of geological structures by reference reflecting horizons in the Jurassic-Cretaceous complex, as well as the Paleozoic
sediments (6 reference horizons) [7].
Work on the interpretation included: structural interpretation; petrophysical analysis of well logging;
calculation of seismic inversion, seismic facies and sedimentological studies; assessment of petroleum potential. Work
on the structural interpretation of the data analysis began with the work previous years and the cube temporary
migration. Seismic horizons were sorted by network 25x25 m, the cube PSTM and all the reprocessed profiles 2D.
Disagreement and faults were figured on the same profiles. All seismic profiles were analyzed for completeness of
seismic interpretation.
Technology calculation of seismic attributes carried out by the most common methods of analysis attributes:
calculation and analysis of attribute cubes and form horizontal, vertical spatial cuts. Site designed by cubes of the
following attributes: phase, chaos, isolation main square amplitude (RMS), the coherence of the impedance, and others.
Interpretation of geological and geophysical data was carried out in the interpretative system Geographic Discovery
(Landmark) on the workstation Dell Precision T3400, and the calculation was carried out using the impedance
interpretation system (Integral Plus) Company Paradigm Geophysical. 3D modeling was performed using the program
"Petrel".
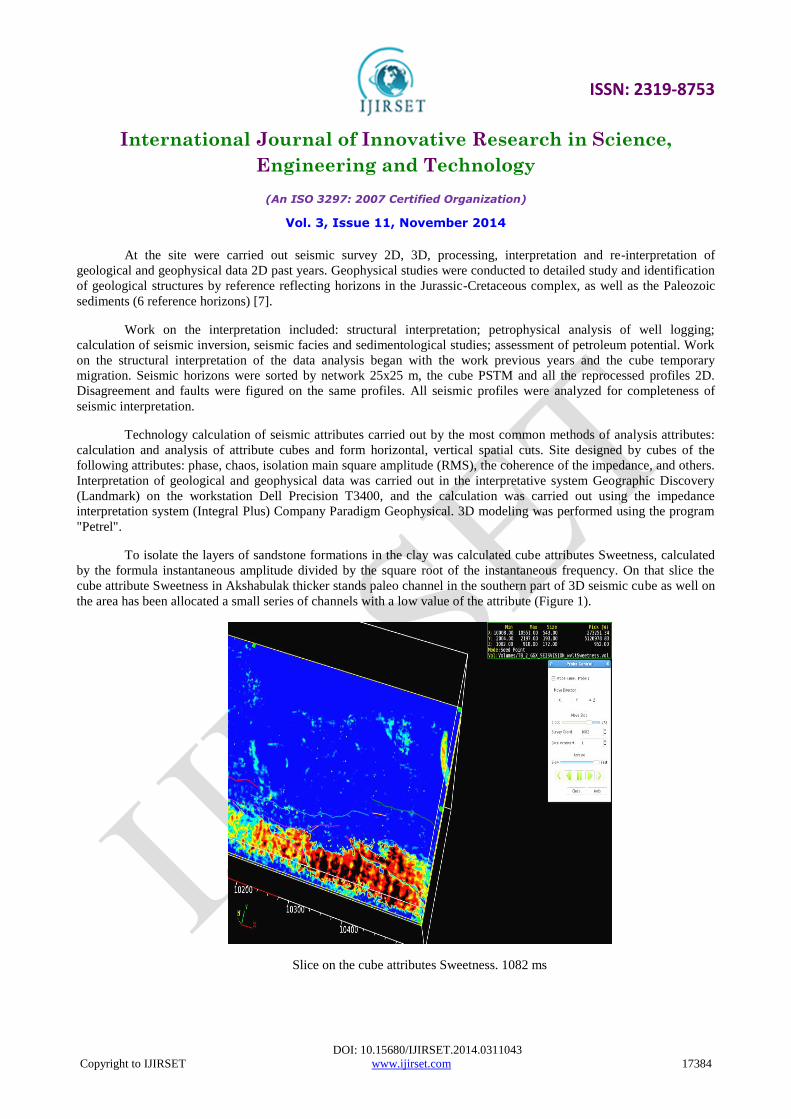
To isolate the layers of sandstone formations in the clay was calculated cube attributes Sweetness, calculated
by the formula instantaneous amplitude divided by the square root of the instantaneous frequency. On that slice the
cube attribute Sweetness in Akshabulak thicker stands paleo channel in the southern part of 3D seismic cube as well on
the area has been allocated a small series of channels with a low value of the attribute (Figure 1).
Slice on the cube attributes Sweetness. 1082 ms

ISSN: 2319-8753
International Journal of Innovative Research in Science,
Engineering and Technology
(An ISO 3297: 2007 Certified Organization)
Vol. 3, Issue 11, November 2014
DOI: 10.15680/IJIRSET.2014.0311043
Copyright to IJIRSET www.ijirset.com 17385
Slice across the horizon J3km (offset 88 ms), Sweetness.
Figure.1- Cube attributes Sweetness. Akshabulak Formation
At the top of the Kumkol suites on the map values Sweetness, in the central and south-western parts of the
observed anomalous zones, most likely associated with meandering paleorivers (Figure 2).
Figure 2 - Slice across the horizon J3km (offset -6 ms), Sweetness. Kumkol Formation
Coherency cube was obtained in the interpretive system OpendTect and was used for the isolation and tracing
of faults, including low-amplitude. Tectonic faults are well defined morphologically as linear elongated shape, subject
to certain laws related to tectonic movements. Analysis of coherence cube when tracking on different time levels to
coordinate T0 allows us to observe the variability of these linear forms and to evaluate the nature and degree of
inclination of fault systems, as well as to determine their genetic nature. Horizontal slices coherence faults highlighted
ISSN: 2319-8753
International Journal of Innovative Research in Science,
Engineering and Technology
(An ISO 3297: 2007 Certified Organization)
Vol. 3, Issue 11, November 2014
DOI: 10.15680/IJIRSET.2014.0311043
Copyright to IJIRSET www.ijirset.com 17386
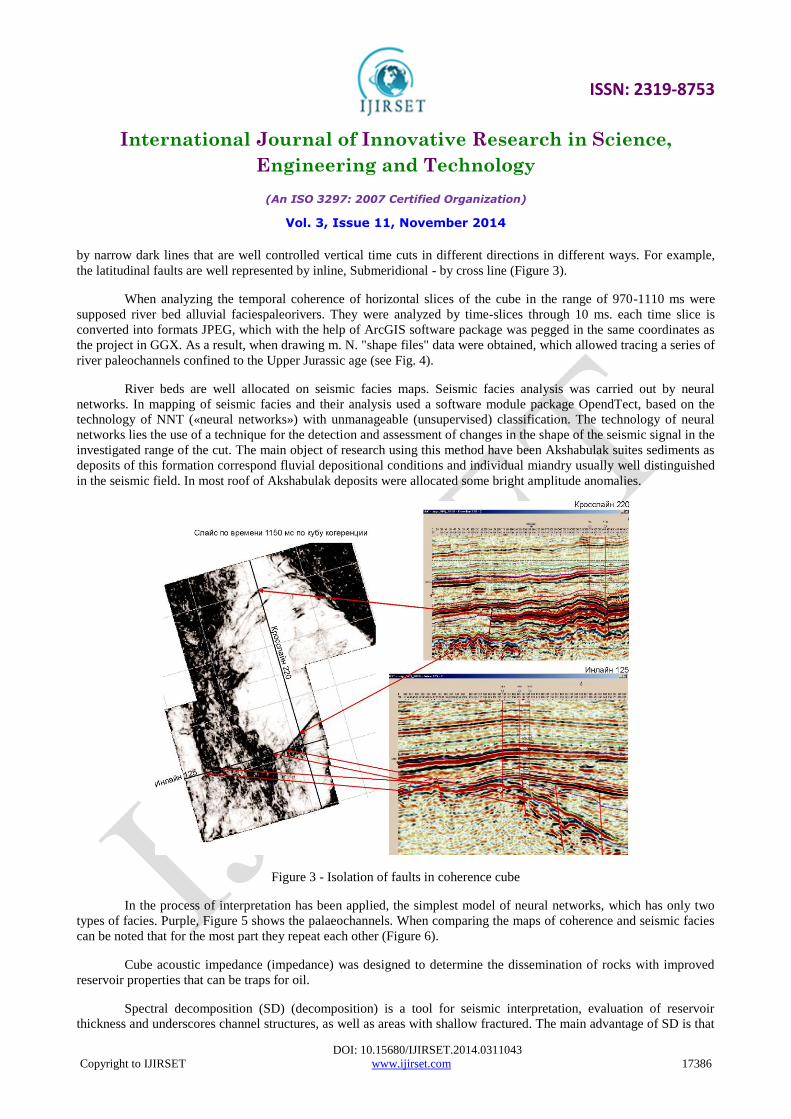
by narrow dark lines that are well controlled vertical time cuts in different directions in different ways. For example,
the latitudinal faults are well represented by inline, Submeridional - by cross line (Figure 3).
When analyzing the temporal coherence of horizontal slices of the cube in the range of 970-1110 ms were
supposed river bed alluvial faciespaleorivers. They were analyzed by time-slices through 10 ms. each time slice is
converted into formats JPEG, which with the help of ArcGIS software package was pegged in the same coordinates as
the project in GGX. As a result, when drawing m. N. "shape files" data were obtained, which allowed tracing a series of
river paleochannels confined to the Upper Jurassic age (see Fig. 4).
River beds are well allocated on seismic facies maps. Seismic facies analysis was carried out by neural
networks. In mapping of seismic facies and their analysis used a software module package OpendTect, based on the
technology of NNT («neural networks») with unmanageable (unsupervised) classification. The technology of neural
networks lies the use of a technique for the detection and assessment of changes in the shape of the seismic signal in the
investigated range of the cut. The main object of research using this method have been Akshabulak suites sediments as
deposits of this formation correspond fluvial depositional conditions and individual miandry usually well distinguished
in the seismic field. In most roof of Akshabulak deposits were allocated some bright amplitude anomalies.
Figure 3 - Isolation of faults in coherence cube
In the process of interpretation has been applied, the simplest model of neural networks, which has only two
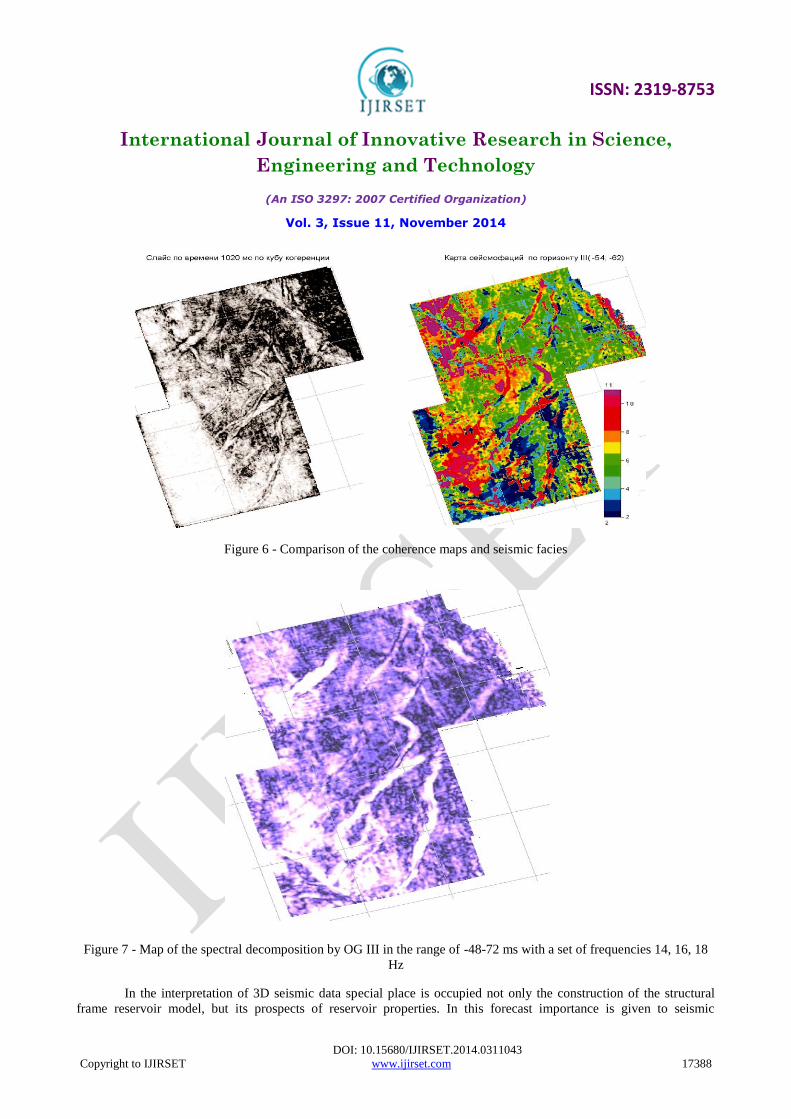
types of facies. Purple, Figure 5 shows the palaeochannels. When comparing the maps of coherence and seismic facies
can be noted that for the most part they repeat each other (Figure 6).
Cube acoustic impedance (impedance) was designed to determine the dissemination of rocks with improved
reservoir properties that can be traps for oil.
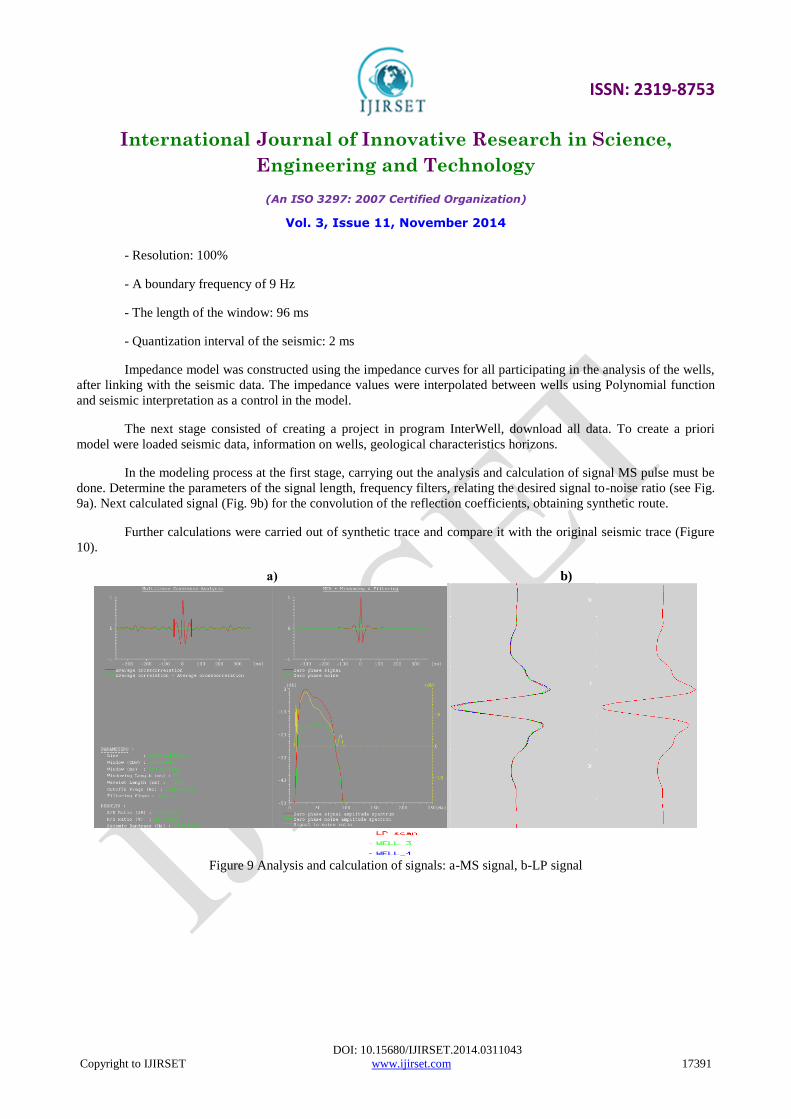
Spectral decomposition (SD) (decomposition) is a tool for seismic interpretation, evaluation of reservoir
thickness and underscores channel structures, as well as areas with shallow fractured. The main advantage of SD is that
ISSN: 2319-8753
International Journal of Innovative Research in Science,
Engineering and Technology
(An ISO 3297: 2007 Certified Organization)
Vol. 3, Issue 11, November 2014
DOI: 10.15680/IJIRSET.2014.0311043
Copyright to IJIRSET www.ijirset.com 17387
it allows you to identify the seismic wave field dependence of the peak frequency of the signal from the temporary
capacity of a thin layer and control the behavior of thin reservoirs, as well as sand lenses and channels. Thus, the
spectral decomposition helps to explore objects, direct correlation in which the seismic wave field is inconvenient or
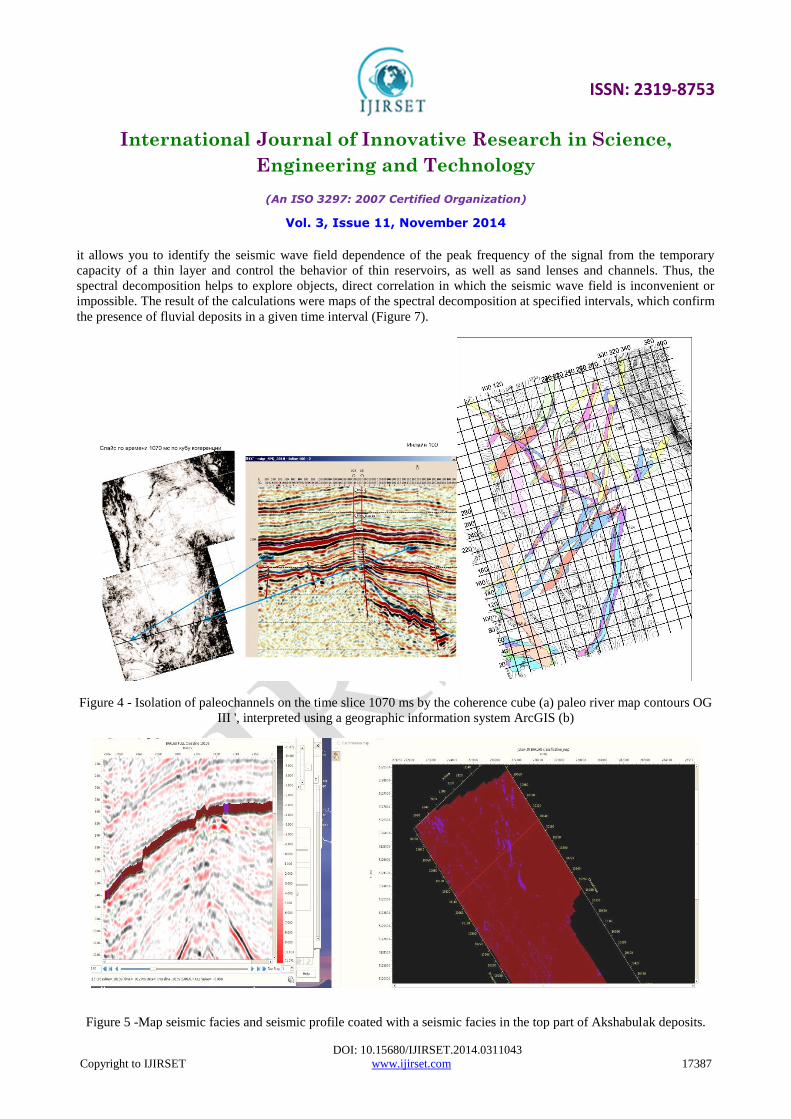
impossible. The result of the calculations were maps of the spectral decomposition at specified intervals, which confirm
the presence of fluvial deposits in a given time interval (Figure 7).
Figure 4 - Isolation of paleochannels on the time slice 1070 ms by the coherence cube (a) paleo river map contours OG
III ', interpreted using a geographic information system ArcGIS (b)
Figure 5 -Map seismic facies and seismic profile coated with a seismic facies in the top part of Akshabulak deposits.
ISSN: 2319-8753
International Journal of Innovative Research in Science,
Engineering and Technology
(An ISO 3297: 2007 Certified Organization)
Vol. 3, Issue 11, November 2014
DOI: 10.15680/IJIRSET.2014.0311043
Copyright to IJIRSET www.ijirset.com 17388
Figure 6 - Comparison of the coherence maps and seismic facies
Figure 7 - Map of the spectral decomposition by OG III in the range of -48-72 ms with a set of frequencies 14, 16, 18
Hz
In the interpretation of 3D seismic data special place is occupied not only the construction of the structural
frame reservoir model, but its prospects of reservoir properties. In this forecast importance is given to seismic

ISSN: 2319-8753
International Journal of Innovative Research in Science,
Engineering and Technology
(An ISO 3297: 2007 Certified Organization)
Vol. 3, Issue 11, November 2014
DOI: 10.15680/IJIRSET.2014.0311043
Copyright to IJIRSET www.ijirset.com 17389
inversion. The choice of a particular method of inversion due to the complexity of geological conditions and variety
require problem solving.
Seismic inversion - is a process in which based on the received seismic sections and the a priori information
about the velocity model is calculated acoustical impedance.
Theoretical bases of the inversion based on the representation of seismic data in the form of a convolution of
the impulse response of the medium with a certain constant and short seismic signal (pulse). In this case, the inversion
can be regarded as the inverse problem which consists in finding the reflection coefficient on the basis of the known
waveform and the seismic record, followed by the calculation of the impedance [8].
Under seismic, inversion typically use algorithms by which traditional seismic time section is transformed into
the incision so-called acoustic impedance ρV - product of the density ρ on the speed V. Under more detailed
constructions, and an expanded list of possible target parameters inversion, in which the acoustic impedance can be
added shear impedance, density, velocity of longitudinal and transverse waves, the Lame parameters. The basis for the
calculation of seismic inversion in the study area, seismic data was 3D - temporary migration and GIS data.
In our example, used data on 2 wells, in which were data of acoustic and density logs. Cube calculation of
acoustic impedance was made to increase the resolution of seismic data.
Initial impulse was isolated from the seismic cube by carrying out cross-correlation procedure, after which the
magnitude of the shift was determined for log data that provides the best match log and seismic data. For recalculation
of temporary seismic data cube in a cube impedances used materials acoustic and density logs from logging data. At the
last stage of the work on the conversion of wave fields in seismic sections of acoustic impedance, all traces of
temporary seismic cube have been translated into trace acoustic impedance values. The resulting acoustic impedance
cube reflects the change in density and speed properties of rocks that form the incision vertically and laterally. Figure 8
shows an example of the impedance corresponding to the productive reservoir age K1nc1ar, are in the range 5300-5740
and correspond brown mosaic, and the oil reservoir age J3km3 located on the border of crimson and brown and falls in
the interval 5760-6200.
Selecting modeling defined, on the one side, typically analyzed the geological situation and the prospect from
the point of view of the possible presence of hydrocarbon deposits, on the other hand, sufficient study as the geometry
of the individual layers and the distribution of the elastic properties and density. Problems arising in the implementation
of this simple computational scheme have been linked to the fact that the seismic record is limited in frequency, both
below and above [9, 10, 11].
Therefore, the lower frequencies (less than 10Hz), the impulse response of the medium and high frequencies
(over 80 Hz) cannot be identified. For solving of arising problems using different techniques, implemented in a variety
of software packages. In our case to perform work under the inversion technique used and the package of BeicipFranlab
- InterWell and Easy Trace.

ISSN: 2319-8753
International Journal of Innovative Research in Science,
Engineering and Technology
(An ISO 3297: 2007 Certified Organization)
Vol. 3, Issue 11, November 2014
DOI: 10.15680/IJIRSET.2014.0311043
Copyright to IJIRSET www.ijirset.com 17390
Figure 8 Impedance section along inline 100
Computational process that implements the seismic inversion, consisted of 3 steps consists in the following:
1- Construction of 3-x-dimensional empirical velocity model using data from acoustic logging and density of
wells, and getting out of this model, the low-frequency component of the impedance (0-10Gts).
2- Conversion seismic record in order to obtain the reflection coefficients Rj, using known seismic wavelet Wi.
This gives the midrange component of impedance (10-60Gts).
3- A combination of the low-frequency component obtained from the model, and midrange component of the
received seismic data to obtain the final impedance section.
III.RESULTS AND DISCUSSION
The results of the acoustic and density logs were used to calculate the three-dimensional model of
environment, the essence of which consists in a linear interpolation of the impedance obtained in the wells, first along
the lines of tracing all the seismic horizons, and then tracking along the lines between the seismic traces.
In the beginning there were converted GIS data using the program Easy Trace. Conversion included:
- Calculation of the synthetic trace based on acoustic logging;
- Getting the curve of the velocity of acoustic logging;
- Calculation of the impedance;
- Creation of curve of stratigraphic jingles;
- Transfer impedance curves and markers in the time scale.
Calculation of seismic inversion was performed using the following parameters: -Time interval: 750 - 1850
ms;
- Algorithm: LP
ISSN: 2319-8753
International Journal of Innovative Research in Science,
Engineering and Technology
(An ISO 3297: 2007 Certified Organization)
Vol. 3, Issue 11, November 2014
DOI: 10.15680/IJIRSET.2014.0311043
Copyright to IJIRSET www.ijirset.com 17391
- Resolution: 100%
- A boundary frequency of 9 Hz
- The length of the window: 96 ms
- Quantization interval of the seismic: 2 ms
Impedance model was constructed using the impedance curves for all participating in the analysis of the wells,
after linking with the seismic data. The impedance values were interpolated between wells using Polynomial function
and seismic interpretation as a control in the model.
The next stage consisted of creating a project in program InterWell, download all data. To create a priori
model were loaded seismic data, information on wells, geological characteristics horizons.
In the modeling process at the first stage, carrying out the analysis and calculation of signal MS pulse must be
done. Determine the parameters of the signal length, frequency filters, relating the desired signal to-noise ratio (see Fig.
9a). Next calculated signal (Fig. 9b) for the convolution of the reflection coefficients, obtaining synthetic route.
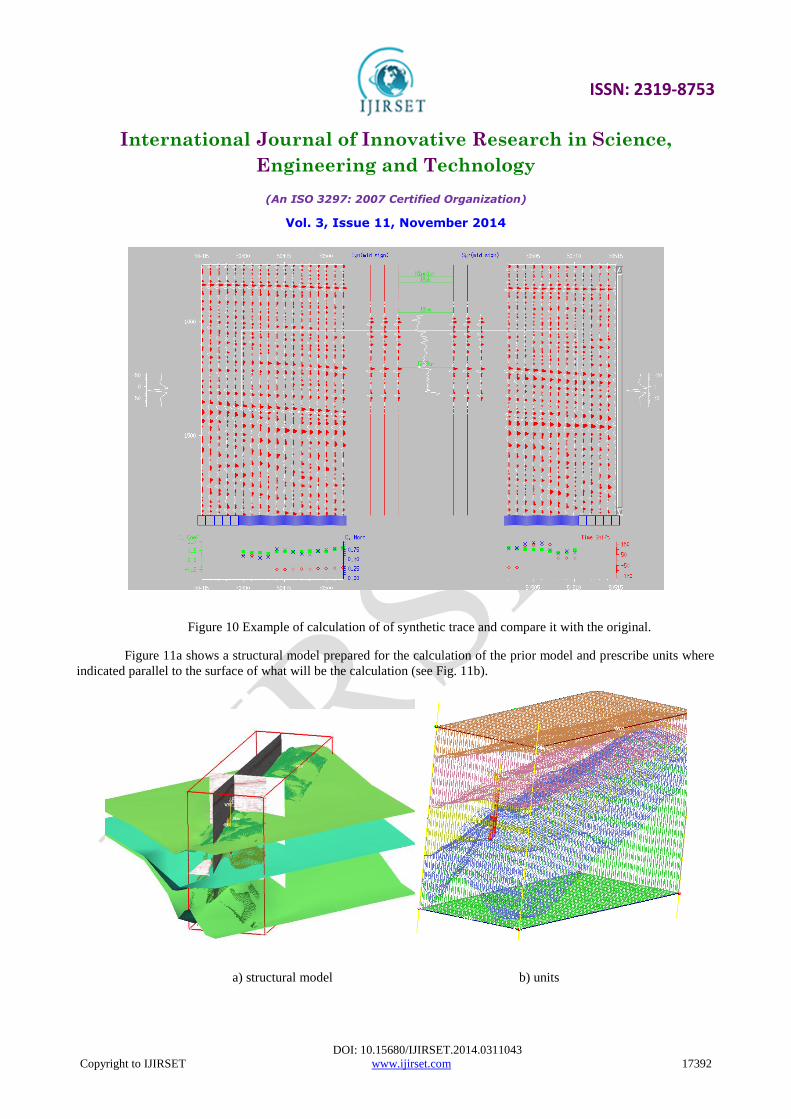
Further calculations were carried out of synthetic trace and compare it with the original seismic trace (Figure
10).
а) b)
Figure 9 Analysis and calculation of signals: a-MS signal, b-LP signal
ISSN: 2319-8753
International Journal of Innovative Research in Science,
Engineering and Technology
(An ISO 3297: 2007 Certified Organization)
Vol. 3, Issue 11, November 2014
DOI: 10.15680/IJIRSET.2014.0311043
Copyright to IJIRSET www.ijirset.com 17392
Figure 10 Example of calculation of of synthetic trace and compare it with the original.
Figure 11a shows a structural model prepared for the calculation of the prior model and prescribe units where
indicated parallel to the surface of what will be the calculation (see Fig. 11b).
a) structural model b) units
ISSN: 2319-8753
International Journal of Innovative Research in Science,
Engineering and Technology
(An ISO 3297: 2007 Certified Organization)
Vol. 3, Issue 11, November 2014
DOI: 10.15680/IJIRSET.2014.0311043
Copyright to IJIRSET www.ijirset.com 17393
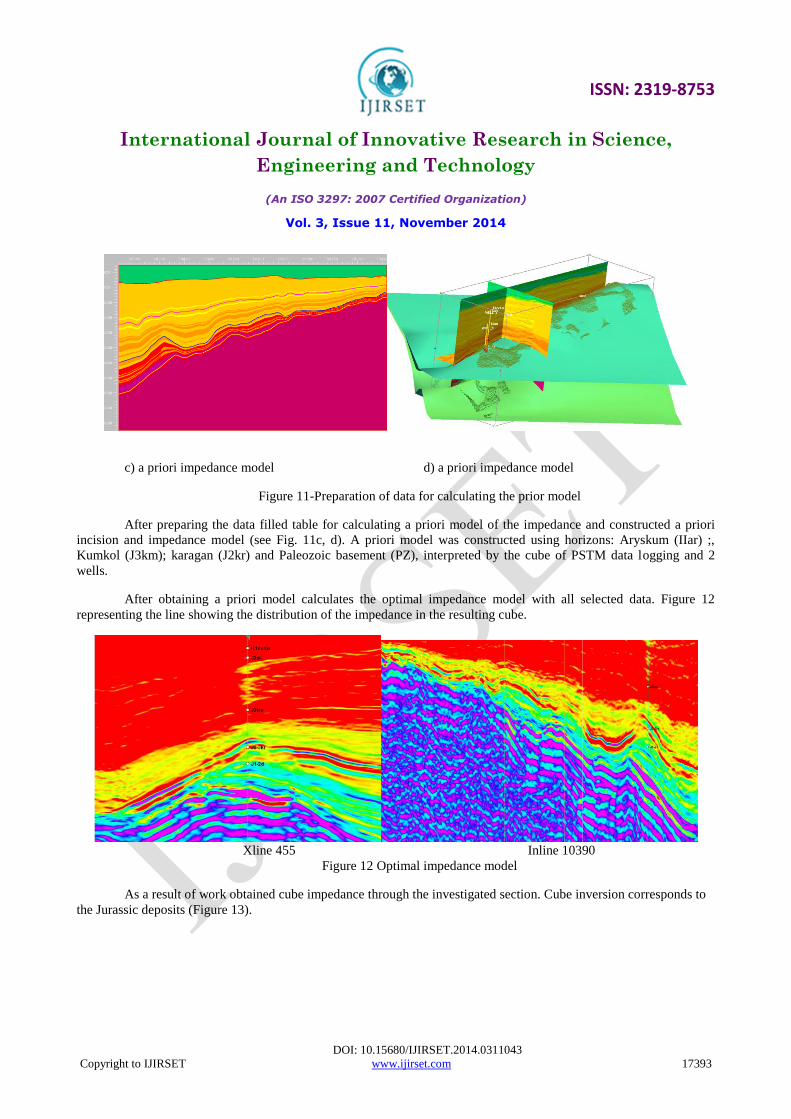
c) a priori impedance model d) a priori impedance model
Figure 11-Preparation of data for calculating the prior model
After preparing the data filled table for calculating a priori model of the impedance and constructed a priori
incision and impedance model (see Fig. 11c, d). A priori model was constructed using horizons: Aryskum (IIar) ;,
Kumkol (J3km); karagan (J2kr) and Paleozoic basement (PZ), interpreted by the cube of PSTM data logging and 2
wells.
After obtaining a priori model calculates the optimal impedance model with all selected data. Figure 12
representing the line showing the distribution of the impedance in the resulting cube.
Xline 455 Inline 10390
Figure 12 Optimal impedance model
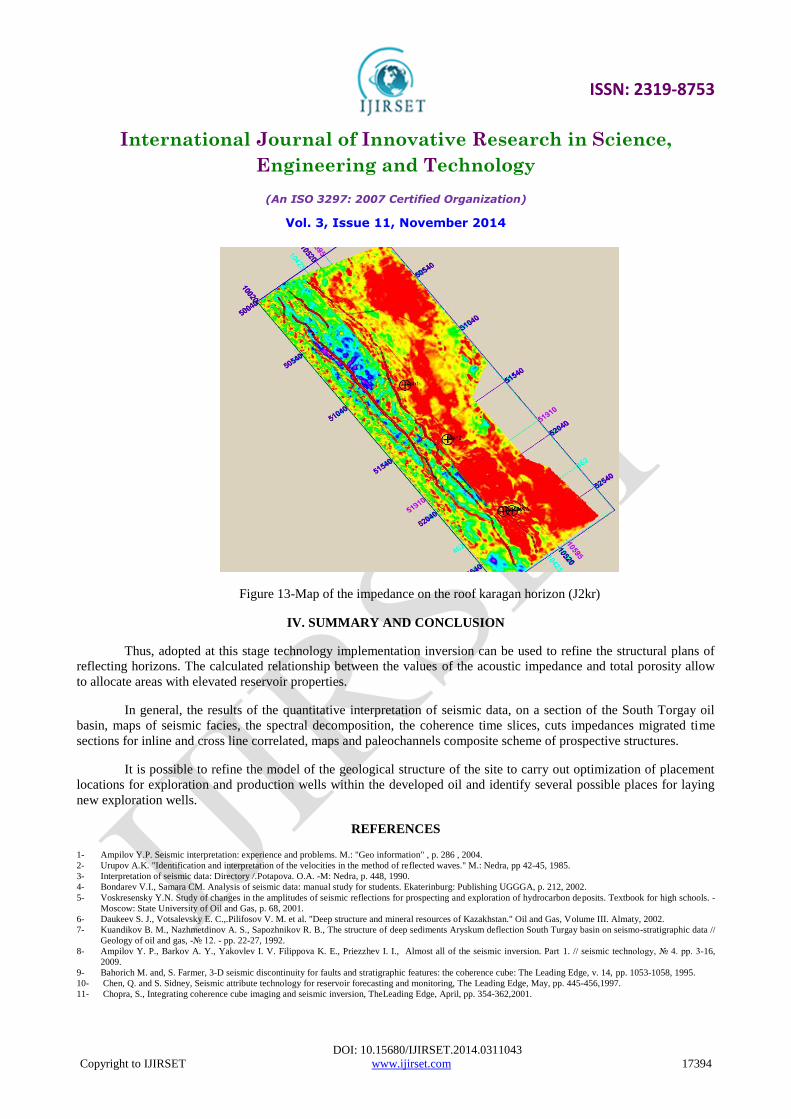
As a result of work obtained cube impedance through the investigated section. Cube inversion corresponds to
the Jurassic deposits (Figure 13).
ISSN: 2319-8753
International Journal of Innovative Research in Science,
Engineering and Technology
(An ISO 3297: 2007 Certified Organization)
Vol. 3, Issue 11, November 2014
DOI: 10.15680/IJIRSET.2014.0311043
Copyright to IJIRSET www.ijirset.com 17394
Figure 13-Map of the impedance on the roof karagan horizon (J2kr)
IV. SUMMARY AND CONCLUSION
Thus, adopted at this stage technology implementation inversion can be used to refine the structural plans of
reflecting horizons. The calculated relationship between the values of the acoustic impedance and total porosity allow
to allocate areas with elevated reservoir properties.
In general, the results of the quantitative interpretation of seismic data, on a section of the South Torgay oil
basin, maps of seismic facies, the spectral decomposition, the coherence time slices, cuts impedances migrated time
sections for inline and cross line correlated, maps and paleochannels composite scheme of prospective structures.
It is possible to refine the model of the geological structure of the site to carry out optimization of placement
locations for exploration and production wells within the developed oil and identify several possible places for laying
new exploration wells.
REFERENCES
1- Ampilov Y.P. Seismic interpretation: experience and problems. M.: "Geo information" , p. 286 , 2004.
2- Urupov A.K. "Identification and interpretation of the velocities in the method of reflected waves." M.: Nedra, pp 42-45, 1985.
3- Interpretation of seismic data: Directory /.Potapova. O.A. -M: Nedra, p. 448, 1990.
4- Bondarev V.I., Samara CM. Analysis of seismic data: manual study for students. Ekaterinburg: Publishing UGGGA, p. 212, 2002.
5- Voskresensky Y.N. Study of changes in the amplitudes of seismic reflections for prospecting and exploration of hydrocarbon deposits. Textbook for high schools. -
Moscow: State University of Oil and Gas, p. 68, 2001.
6- Daukeev S. J., Votsalevsky E. C.,.Pilifosov V. M. et al. "Deep structure and mineral resources of Kazakhstan." Oil and Gas, Volume III. Almaty, 2002.
7- Kuandikov B. M., Nazhmetdinov A. S., Sapozhnikov R. B., The structure of deep sediments Aryskum deflection South Turgay basin on seismo-stratigraphic data //
Geology of oil and gas, -№ 12. - pp. 22-27, 1992.
8- Ampilov Y. P., Barkov A. Y., Yakovlev I. V. Filippova K. E., Priezzhev I. I., Almost all of the seismic inversion. Part 1. // seismic technology, № 4. pp. 3-16,
2009.
9- Bahorich M. and, S. Farmer, 3-D seismic discontinuity for faults and stratigraphic features: the coherence cube: The Leading Edge, v. 14, pp. 1053-1058, 1995.
10- Chen, Q. and S. Sidney, Seismic attribute technology for reservoir forecasting and monitoring, The Leading Edge, May, pp. 445-456,1997.
11- Chopra, S., Integrating coherence cube imaging and seismic inversion, TheLeading Edge, April, pp. 354-362,2001.