characteristics of residency community reporting … · characteristics of residency census 2000,...
TRANSCRIPT

Characteristics of ResidencyCensus 2000, Summary File 3
Characteristics of Residency
Community Reporting Areas
Page 1Community Reporting Area Level
January 2005Department of Planning and Development with Assistance from Puget Sound Regional Council

Characteristics of ResidencyCensus 2000, Summary File 3
CRA: Alki/Admiral
764 144 31 113 174 62 112 446 351 95
PCT20. PLACE OF BIRTH BY YEAR OF ENTRY BY CITIZENSHIP STATUS FOR FOREIGN-BORN POPULATIONUniverse: Foreign-born population
Entry 1990 to March 2000: Entry 1980 to 1989: Entry before 1980:
Naturalized citizen
Not a citizenTotalTotal
Region Naturalized citizen
Not a citizenTotal
Naturalized citizen
Not a citizenTotal
Europe 299 45 0 45 69 12 57 185 153 32Asia 211 47 18 29 51 41 10 113 102 11Africa 89 23 13 10 22 9 13 44 15 29Oceania 31 0 0 0 7 0 7 24 16 8Americas: 134 Latin America: 79 Caribbean 0 0 0 0 0 0 0 0 0 0 Central America: 39 Mexico 39 0 0 0 25 0 25 14 14 0 Other Central America 0 0 0 0 0 0 0 0 0 0 South America 40 29 0 29 0 0 0 11 11 0 Northern America 55 0 0 0 0 0 0 55 40 15Born at sea 0 0 0 0 0 0 0 0 0 0
Total 764
1995 to March 2000 661990 to 1994 781985 to 1989 1161980 to 1984 581975 to 1979 281970 to 1974 481965 to 1969 110Before 1965 260
P22. YEAR OF ENTRY FOR THE
Universe: Foreign-born populationFOREIGN-BORN POPULATION
100%
8.6%10.2%15.2%7.6%3.7%6.3%
14.4%34.0%
Total 9,865Living in an MSA/PMSA in 2000: 9,865 Same house in 1995: 4,881 Central city of this MSA/PMSA 4,881 Remainder of this MSA/PMSA 0 Different house in 1995: 4,984 In United States in 1995: 4,881 Same MSA/PMSA in 1995: 2,970 Moved within same central city 2,273 Moved between central cities 85 Moved from central city to remainder of MSA 0 Moved from remainder of MSA to central city 612 Moved within remainder of MSA/PMSA 0 Different MSA/PMSA in 1995: 1,661 Central city in different MSA/PMSA 1,033 Remainder of different MSA/PMSA 628 Not in an MSA/PMSA in 1995 250
In Puerto Rico in 1995 0 Elsewhere in 1995 103
Not living in an MSA/PMSA in 2000 0
100%100.0%49.5%49.5%0.0%
50.5%49.5%30.1%23.0%0.9%0.0%6.2%0.0%
16.8%10.5%6.4%2.5%
0.0%1.0%
0.0%
PCT22. RESIDENCE IN 1995--MSA/PMSA LEVELUniverse: Population 5 years and over
Total: 10,242
Native: 9,478 Born in state of residence 4,305 Born in other state in the U.S.: 4,998 Northeast 818 Midwest 1,619 South 679 West 1,882 Born outside the United States: 175 Puerto Rico 15 U.S. Island Areas 8 Born abroad of American parent(s) 152Foreign born: 764 Naturalized citizen 444 Not a citizen 320
100%
92.5%42.0%48.8%8.0%
15.8%6.6%
18.4%1.7%0.1%0.1%1.5%7.5%4.3%3.1%
P21. PLACE OF BIRTH BY CITIZENSHIP STATUSUniverse: Total population
Total: 9,865Same house in 1995 4,881Different house in 1995: 4,984 In United States in 1995: 4,881 Same city or town: 2,273 Same county 2,273 Different county (same state) 0 Not same city or town: 2,608 Same county 609 Different county: 1,999 Same state 552 Different state: 1,447 Northeast 184 Midwest 363 South 222 West 678 In Puerto Rico in 1995 0 Elsewhere in 1995 103
PCT21. RESIDENCE IN 1995
Universe: Population 5 years and over--STATE, COUNTY, PLACE LEVEL
100%49.5%50.5%49.5%23.0%23.0%0.0%
26.4%6.2%
20.3%5.6%
14.7%1.9%3.7%2.3%6.9%0.0%1.0%
Total
Page 2Community Reporting Area LevelAlki/Admiral
January 2005
Department of Planning and Development with Assistance from Puget Sound Regional Council 1.4

Characteristics of ResidencyCensus 2000, Summary File 3
CRA: Arbor Heights
447 90 11 79 146 98 48 211 152 59
PCT20. PLACE OF BIRTH BY YEAR OF ENTRY BY CITIZENSHIP STATUS FOR FOREIGN-BORN POPULATIONUniverse: Foreign-born population
Entry 1990 to March 2000: Entry 1980 to 1989: Entry before 1980:
Naturalized citizen
Not a citizenTotalTotal
Region Naturalized citizen
Not a citizenTotal
Naturalized citizen
Not a citizenTotal
Europe 133 17 4 13 29 13 16 87 65 22Asia 155 30 0 30 67 67 0 58 41 17Africa 0 0 0 0 0 0 0 0 0 0Oceania 9 4 0 4 0 0 0 5 5 0Americas: 150 Latin America: 64 Caribbean 0 0 0 0 0 0 0 0 0 0 Central America: 55 Mexico 39 18 0 18 8 8 0 13 4 9 Other Central America 16 0 0 0 16 8 8 0 0 0 South America 9 7 7 0 2 2 0 0 0 0 Northern America 86 14 0 14 24 0 24 48 37 11Born at sea 0 0 0 0 0 0 0 0 0 0
Total 447
1995 to March 2000 641990 to 1994 261985 to 1989 931980 to 1984 531975 to 1979 421970 to 1974 71965 to 1969 29Before 1965 133
P22. YEAR OF ENTRY FOR THE
Universe: Foreign-born populationFOREIGN-BORN POPULATION
100%
14.3%5.8%
20.8%11.9%9.4%1.6%6.5%
29.8%
Total 5,813Living in an MSA/PMSA in 2000: 5,813 Same house in 1995: 3,699 Central city of this MSA/PMSA 3,699 Remainder of this MSA/PMSA 0 Different house in 1995: 2,114 In United States in 1995: 2,035 Same MSA/PMSA in 1995: 1,706 Moved within same central city 1,382 Moved between central cities 38 Moved from central city to remainder of MSA 0 Moved from remainder of MSA to central city 286 Moved within remainder of MSA/PMSA 0 Different MSA/PMSA in 1995: 278 Central city in different MSA/PMSA 202 Remainder of different MSA/PMSA 76 Not in an MSA/PMSA in 1995 51
In Puerto Rico in 1995 0 Elsewhere in 1995 79
Not living in an MSA/PMSA in 2000 0
100%100.0%63.6%63.6%0.0%
36.4%35.0%29.3%23.8%0.7%0.0%4.9%0.0%4.8%3.5%1.3%0.9%
0.0%1.4%
0.0%
PCT22. RESIDENCE IN 1995--MSA/PMSA LEVELUniverse: Population 5 years and over
Total: 6,146
Native: 5,699 Born in state of residence 3,297 Born in other state in the U.S.: 2,268 Northeast 292 Midwest 856 South 246 West 874 Born outside the United States: 134 Puerto Rico 0 U.S. Island Areas 6 Born abroad of American parent(s) 128Foreign born: 447 Naturalized citizen 261 Not a citizen 186
100%
92.7%53.6%36.9%4.8%
13.9%4.0%
14.2%2.2%0.0%0.1%2.1%7.3%4.2%3.0%
P21. PLACE OF BIRTH BY CITIZENSHIP STATUSUniverse: Total population
Total: 5,813Same house in 1995 3,699Different house in 1995: 2,114 In United States in 1995: 2,035 Same city or town: 1,382 Same county 1,382 Different county (same state) 0 Not same city or town: 653 Same county 260 Different county: 393 Same state 134 Different state: 259 Northeast 18 Midwest 82 South 19 West 140 In Puerto Rico in 1995 0 Elsewhere in 1995 79
PCT21. RESIDENCE IN 1995
Universe: Population 5 years and over--STATE, COUNTY, PLACE LEVEL
100%63.6%36.4%35.0%23.8%23.8%0.0%
11.2%4.5%6.8%2.3%4.5%0.3%1.4%0.3%2.4%0.0%1.4%
Total
Page 3Community Reporting Area LevelArbor Heights
January 2005
Department of Planning and Development with Assistance from Puget Sound Regional Council 1.1

Characteristics of ResidencyCensus 2000, Summary File 3
CRA: Ballard
569 212 51 161 145 104 41 212 159 53
PCT20. PLACE OF BIRTH BY YEAR OF ENTRY BY CITIZENSHIP STATUS FOR FOREIGN-BORN POPULATIONUniverse: Foreign-born population
Entry 1990 to March 2000: Entry 1980 to 1989: Entry before 1980:
Naturalized citizen
Not a citizenTotalTotal
Region Naturalized citizen
Not a citizenTotal
Naturalized citizen
Not a citizenTotal
Europe 127 32 0 32 13 6 7 82 65 17Asia 153 32 0 32 61 54 7 60 60 0Africa 111 73 11 62 38 38 0 0 0 0Oceania 0 0 0 0 0 0 0 0 0 0Americas: 178 Latin America: 124 Caribbean 0 0 0 0 0 0 0 0 0 0 Central America: 100 Mexico 100 52 40 12 27 0 27 21 7 14 Other Central America 0 0 0 0 0 0 0 0 0 0 South America 24 11 0 11 6 6 0 7 7 0 Northern America 54 12 0 12 0 0 0 42 20 22Born at sea 0 0 0 0 0 0 0 0 0 0
Total 569
1995 to March 2000 1381990 to 1994 741985 to 1989 751980 to 1984 701975 to 1979 311970 to 1974 341965 to 1969 30Before 1965 117
P22. YEAR OF ENTRY FOR THE
Universe: Foreign-born populationFOREIGN-BORN POPULATION
100%
24.3%13.0%13.2%12.3%5.4%6.0%5.3%
20.6%
Total 4,797Living in an MSA/PMSA in 2000: 4,797 Same house in 1995: 1,554 Central city of this MSA/PMSA 1,554 Remainder of this MSA/PMSA 0 Different house in 1995: 3,243 In United States in 1995: 3,132 Same MSA/PMSA in 1995: 2,075 Moved within same central city 1,704 Moved between central cities 70 Moved from central city to remainder of MSA 0 Moved from remainder of MSA to central city 301 Moved within remainder of MSA/PMSA 0 Different MSA/PMSA in 1995: 856 Central city in different MSA/PMSA 567 Remainder of different MSA/PMSA 289 Not in an MSA/PMSA in 1995 201
In Puerto Rico in 1995 0 Elsewhere in 1995 111
Not living in an MSA/PMSA in 2000 0
100%100.0%32.4%32.4%0.0%
67.6%65.3%43.3%35.5%1.5%0.0%6.3%0.0%
17.8%11.8%6.0%4.2%
0.0%2.3%
0.0%
PCT22. RESIDENCE IN 1995--MSA/PMSA LEVELUniverse: Population 5 years and over
Total: 4,916
Native: 4,347 Born in state of residence 1,979 Born in other state in the U.S.: 2,294 Northeast 320 Midwest 679 South 441 West 854 Born outside the United States: 74 Puerto Rico 0 U.S. Island Areas 0 Born abroad of American parent(s) 74Foreign born: 569 Naturalized citizen 314 Not a citizen 255
100%
88.4%40.3%46.7%6.5%
13.8%9.0%
17.4%1.5%0.0%0.0%1.5%
11.6%6.4%5.2%
P21. PLACE OF BIRTH BY CITIZENSHIP STATUSUniverse: Total population
Total: 4,797Same house in 1995 1,554Different house in 1995: 3,243 In United States in 1995: 3,132 Same city or town: 1,704 Same county 1,704 Different county (same state) 0 Not same city or town: 1,428 Same county 255 Different county: 1,173 Same state 454 Different state: 719 Northeast 59 Midwest 163 South 247 West 250 In Puerto Rico in 1995 0 Elsewhere in 1995 111
PCT21. RESIDENCE IN 1995
Universe: Population 5 years and over--STATE, COUNTY, PLACE LEVEL
100%32.4%67.6%65.3%35.5%35.5%0.0%
29.8%5.3%
24.5%9.5%
15.0%1.2%3.4%5.1%5.2%0.0%2.3%
Total
Page 4Community Reporting Area LevelBallard
January 2005
Department of Planning and Development with Assistance from Puget Sound Regional Council 10.4

Characteristics of ResidencyCensus 2000, Summary File 3
CRA: Beacon Hill
3,907 1,775 614 1,161 1,271 827 444 861 731 130
PCT20. PLACE OF BIRTH BY YEAR OF ENTRY BY CITIZENSHIP STATUS FOR FOREIGN-BORN POPULATIONUniverse: Foreign-born population
Entry 1990 to March 2000: Entry 1980 to 1989: Entry before 1980:
Naturalized citizen
Not a citizenTotalTotal
Region Naturalized citizen
Not a citizenTotal
Naturalized citizen
Not a citizenTotal
Europe 65 6 0 6 21 12 9 38 17 21Asia 3,593 1,589 575 1,014 1,189 789 400 815 706 109Africa 33 24 16 8 9 0 9 0 0 0Oceania 36 10 0 10 26 26 0 0 0 0Americas: 180 Latin America: 172 Caribbean 45 45 0 45 0 0 0 0 0 0 Central America: 120 Mexico 114 88 16 72 26 0 26 0 0 0 Other Central America 6 6 0 6 0 0 0 0 0 0 South America 7 7 7 0 0 0 0 0 0 0 Northern America 8 0 0 0 0 0 0 8 8 0Born at sea 0 0 0 0 0 0 0 0 0 0
Total 3,907
1995 to March 2000 8021990 to 1994 9731985 to 1989 7371980 to 1984 5341975 to 1979 4851970 to 1974 961965 to 1969 89Before 1965 191
P22. YEAR OF ENTRY FOR THE
Universe: Foreign-born populationFOREIGN-BORN POPULATION
100%
20.5%24.9%18.9%13.7%12.4%2.5%2.3%4.9%
Total 8,462Living in an MSA/PMSA in 2000: 8,462 Same house in 1995: 5,353 Central city of this MSA/PMSA 5,353 Remainder of this MSA/PMSA 0 Different house in 1995: 3,109 In United States in 1995: 2,700 Same MSA/PMSA in 1995: 2,366 Moved within same central city 1,924 Moved between central cities 40 Moved from central city to remainder of MSA 0 Moved from remainder of MSA to central city 402 Moved within remainder of MSA/PMSA 0 Different MSA/PMSA in 1995: 272 Central city in different MSA/PMSA 216 Remainder of different MSA/PMSA 56 Not in an MSA/PMSA in 1995 62
In Puerto Rico in 1995 0 Elsewhere in 1995 409
Not living in an MSA/PMSA in 2000 0
100%100.0%63.3%63.3%0.0%
36.7%31.9%28.0%22.7%0.5%0.0%4.8%0.0%3.2%2.6%0.7%0.7%
0.0%4.8%
0.0%
PCT22. RESIDENCE IN 1995--MSA/PMSA LEVELUniverse: Population 5 years and over
Total: 9,002
Native: 5,095 Born in state of residence 3,186 Born in other state in the U.S.: 1,752 Northeast 145 Midwest 304 South 586 West 717 Born outside the United States: 157 Puerto Rico 0 U.S. Island Areas 16 Born abroad of American parent(s) 141Foreign born: 3,907 Naturalized citizen 2,172 Not a citizen 1,735
100%
56.6%35.4%19.5%1.6%3.4%6.5%8.0%1.7%0.0%0.2%1.6%
43.4%24.1%19.3%
P21. PLACE OF BIRTH BY CITIZENSHIP STATUSUniverse: Total population
Total: 8,462Same house in 1995 5,353Different house in 1995: 3,109 In United States in 1995: 2,700 Same city or town: 1,924 Same county 1,924 Different county (same state) 0 Not same city or town: 776 Same county 397 Different county: 379 Same state 173 Different state: 206 Northeast 28 Midwest 10 South 35 West 133 In Puerto Rico in 1995 0 Elsewhere in 1995 409
PCT21. RESIDENCE IN 1995
Universe: Population 5 years and over--STATE, COUNTY, PLACE LEVEL
100%63.3%36.7%31.9%22.7%22.7%0.0%9.2%4.7%4.5%2.0%2.4%0.3%0.1%0.4%1.6%0.0%4.8%
Total
Page 5Community Reporting Area LevelBeacon Hill
January 2005
Department of Planning and Development with Assistance from Puget Sound Regional Council 3.5

Characteristics of ResidencyCensus 2000, Summary File 3
CRA: Belltown
869 395 59 336 149 52 97 325 289 36
PCT20. PLACE OF BIRTH BY YEAR OF ENTRY BY CITIZENSHIP STATUS FOR FOREIGN-BORN POPULATIONUniverse: Foreign-born population
Entry 1990 to March 2000: Entry 1980 to 1989: Entry before 1980:
Naturalized citizen
Not a citizenTotalTotal
Region Naturalized citizen
Not a citizenTotal
Naturalized citizen
Not a citizenTotal
Europe 188 112 9 103 0 0 0 76 49 27Asia 416 213 50 163 53 41 12 150 150 0Africa 68 22 0 22 40 11 29 6 6 0Oceania 24 9 0 9 7 0 7 8 8 0Americas: 173 Latin America: 123 Caribbean 14 0 0 0 0 0 0 14 14 0 Central America: 77 Mexico 77 6 0 6 49 0 49 22 22 0 Other Central America 0 0 0 0 0 0 0 0 0 0 South America 32 10 0 10 0 0 0 22 22 0 Northern America 50 23 0 23 0 0 0 27 18 9Born at sea 0 0 0 0 0 0 0 0 0 0
Total 869
1995 to March 2000 2471990 to 1994 1481985 to 1989 1231980 to 1984 261975 to 1979 931970 to 1974 1061965 to 1969 35Before 1965 91
P22. YEAR OF ENTRY FOR THE
Universe: Foreign-born populationFOREIGN-BORN POPULATION
100%
28.4%17.0%14.2%3.0%
10.7%12.2%4.0%
10.5%
Total 6,025Living in an MSA/PMSA in 2000: 6,025 Same house in 1995: 1,318 Central city of this MSA/PMSA 1,318 Remainder of this MSA/PMSA 0 Different house in 1995: 4,707 In United States in 1995: 4,332 Same MSA/PMSA in 1995: 2,286 Moved within same central city 1,666 Moved between central cities 156 Moved from central city to remainder of MSA 0 Moved from remainder of MSA to central city 464 Moved within remainder of MSA/PMSA 0 Different MSA/PMSA in 1995: 1,843 Central city in different MSA/PMSA 1,351 Remainder of different MSA/PMSA 492 Not in an MSA/PMSA in 1995 203
In Puerto Rico in 1995 0 Elsewhere in 1995 375
Not living in an MSA/PMSA in 2000 0
100%100.0%21.9%21.9%0.0%
78.1%71.9%37.9%27.7%2.6%0.0%7.7%0.0%
30.6%22.4%8.2%3.4%
0.0%6.2%
0.0%
PCT22. RESIDENCE IN 1995--MSA/PMSA LEVELUniverse: Population 5 years and over
Total: 6,188
Native: 5,319 Born in state of residence 1,538 Born in other state in the U.S.: 3,641 Northeast 725 Midwest 975 South 825 West 1,116 Born outside the United States: 140 Puerto Rico 0 U.S. Island Areas 48 Born abroad of American parent(s) 92Foreign born: 869 Naturalized citizen 400 Not a citizen 469
100%
86.0%24.9%58.8%11.7%15.8%13.3%18.0%2.3%0.0%0.8%1.5%
14.0%6.5%7.6%
P21. PLACE OF BIRTH BY CITIZENSHIP STATUSUniverse: Total population
Total: 6,025Same house in 1995 1,318Different house in 1995: 4,707 In United States in 1995: 4,332 Same city or town: 1,666 Same county 1,666 Different county (same state) 0 Not same city or town: 2,666 Same county 465 Different county: 2,201 Same state 584 Different state: 1,617 Northeast 297 Midwest 352 South 232 West 736 In Puerto Rico in 1995 0 Elsewhere in 1995 375
PCT21. RESIDENCE IN 1995
Universe: Population 5 years and over--STATE, COUNTY, PLACE LEVEL
100%21.9%78.1%71.9%27.7%27.7%0.0%
44.2%7.7%
36.5%9.7%
26.8%4.9%5.8%3.9%
12.2%0.0%6.2%
Total
Page 6Community Reporting Area LevelBelltown
January 2005
Department of Planning and Development with Assistance from Puget Sound Regional Council 13.1

Characteristics of ResidencyCensus 2000, Summary File 3
CRA: Broadview/Bitter Lake
2,169 956 260 696 542 389 153 671 578 93
PCT20. PLACE OF BIRTH BY YEAR OF ENTRY BY CITIZENSHIP STATUS FOR FOREIGN-BORN POPULATIONUniverse: Foreign-born population
Entry 1990 to March 2000: Entry 1980 to 1989: Entry before 1980:
Naturalized citizen
Not a citizenTotalTotal
Region Naturalized citizen
Not a citizenTotal
Naturalized citizen
Not a citizenTotal
Europe 413 96 0 96 76 39 37 241 220 21Asia 999 453 136 317 282 229 53 264 232 32Africa 349 247 85 162 84 84 0 18 18 0Oceania 20 20 9 11 0 0 0 0 0 0Americas: 388 Latin America: 251 Caribbean 0 0 0 0 0 0 0 0 0 0 Central America: 195 Mexico 126 78 0 78 30 18 12 18 18 0 Other Central America 69 18 0 18 51 0 51 0 0 0 South America 56 10 10 0 19 19 0 27 15 12 Northern America 137 34 20 14 0 0 0 103 75 28Born at sea 0 0 0 0 0 0 0 0 0 0
Total 2,169
1995 to March 2000 5741990 to 1994 3821985 to 1989 1771980 to 1984 3651975 to 1979 1721970 to 1974 801965 to 1969 102Before 1965 317
P22. YEAR OF ENTRY FOR THE
Universe: Foreign-born populationFOREIGN-BORN POPULATION
100%
26.5%17.6%8.2%
16.8%7.9%3.7%4.7%
14.6%
Total 12,130Living in an MSA/PMSA in 2000: 12,130 Same house in 1995: 5,982 Central city of this MSA/PMSA 5,982 Remainder of this MSA/PMSA 0 Different house in 1995: 6,148 In United States in 1995: 5,588 Same MSA/PMSA in 1995: 4,149 Moved within same central city 3,189 Moved between central cities 200 Moved from central city to remainder of MSA 0 Moved from remainder of MSA to central city 760 Moved within remainder of MSA/PMSA 0 Different MSA/PMSA in 1995: 1,190 Central city in different MSA/PMSA 719 Remainder of different MSA/PMSA 471 Not in an MSA/PMSA in 1995 249
In Puerto Rico in 1995 18 Elsewhere in 1995 542
Not living in an MSA/PMSA in 2000 0
100%100.0%49.3%49.3%0.0%
50.7%46.1%34.2%26.3%1.6%0.0%6.3%0.0%9.8%5.9%3.9%2.1%
0.1%4.5%
0.0%
PCT22. RESIDENCE IN 1995--MSA/PMSA LEVELUniverse: Population 5 years and over
Total: 12,612
Native: 10,443 Born in state of residence 5,626 Born in other state in the U.S.: 4,642 Northeast 665 Midwest 1,538 South 592 West 1,847 Born outside the United States: 175 Puerto Rico 18 U.S. Island Areas 0 Born abroad of American parent(s) 157Foreign born: 2,169 Naturalized citizen 1,227 Not a citizen 942
100%
82.8%44.6%36.8%5.3%
12.2%4.7%
14.6%1.4%0.1%0.0%1.2%
17.2%9.7%7.5%
P21. PLACE OF BIRTH BY CITIZENSHIP STATUSUniverse: Total population
Total: 12,130Same house in 1995 5,982Different house in 1995: 6,148 In United States in 1995: 5,588 Same city or town: 3,189 Same county 3,189 Different county (same state) 0 Not same city or town: 2,399 Same county 556 Different county: 1,843 Same state 882 Different state: 961 Northeast 142 Midwest 107 South 182 West 530 In Puerto Rico in 1995 18 Elsewhere in 1995 542
PCT21. RESIDENCE IN 1995
Universe: Population 5 years and over--STATE, COUNTY, PLACE LEVEL
100%49.3%50.7%46.1%26.3%26.3%0.0%
19.8%4.6%
15.2%7.3%7.9%1.2%0.9%1.5%4.4%0.1%4.5%
Total
Page 7Community Reporting Area LevelBroadview/Bitter Lake
January 2005
Department of Planning and Development with Assistance from Puget Sound Regional Council 9.1

Characteristics of ResidencyCensus 2000, Summary File 3
CRA: Capitol Hill
2,485 1,277 103 1,174 541 283 258 667 502 165
PCT20. PLACE OF BIRTH BY YEAR OF ENTRY BY CITIZENSHIP STATUS FOR FOREIGN-BORN POPULATIONUniverse: Foreign-born population
Entry 1990 to March 2000: Entry 1980 to 1989: Entry before 1980:
Naturalized citizen
Not a citizenTotalTotal
Region Naturalized citizen
Not a citizenTotal
Naturalized citizen
Not a citizenTotal
Europe 706 313 34 279 127 67 60 266 204 62Asia 993 576 19 557 245 152 93 172 120 52Africa 232 165 8 157 52 35 17 15 15 0Oceania 10 0 0 0 10 0 10 0 0 0Americas: 544 Latin America: 312 Caribbean 52 17 0 17 0 0 0 35 35 0 Central America: 176 Mexico 110 43 0 43 15 0 15 52 40 12 Other Central America 66 11 11 0 41 14 27 14 8 6 South America 84 41 22 19 36 0 36 7 7 0 Northern America 232 111 9 102 15 15 0 106 73 33Born at sea 0 0 0 0 0 0 0 0 0 0
Total 2,485
1995 to March 2000 9311990 to 1994 3461985 to 1989 3201980 to 1984 2211975 to 1979 1711970 to 1974 1461965 to 1969 111Before 1965 239
P22. YEAR OF ENTRY FOR THE
Universe: Foreign-born populationFOREIGN-BORN POPULATION
100%
37.5%13.9%12.9%8.9%6.9%5.9%4.5%9.6%
Total 18,184Living in an MSA/PMSA in 2000: 18,184 Same house in 1995: 4,094 Central city of this MSA/PMSA 4,094 Remainder of this MSA/PMSA 0 Different house in 1995: 14,090 In United States in 1995: 12,948 Same MSA/PMSA in 1995: 6,685 Moved within same central city 5,621 Moved between central cities 184 Moved from central city to remainder of MSA 0 Moved from remainder of MSA to central city 880 Moved within remainder of MSA/PMSA 0 Different MSA/PMSA in 1995: 5,447 Central city in different MSA/PMSA 4,073 Remainder of different MSA/PMSA 1,374 Not in an MSA/PMSA in 1995 816
In Puerto Rico in 1995 0 Elsewhere in 1995 1,142
Not living in an MSA/PMSA in 2000 0
100%100.0%22.5%22.5%0.0%
77.5%71.2%36.8%30.9%1.0%0.0%4.8%0.0%
30.0%22.4%7.6%4.5%
0.0%6.3%
0.0%
PCT22. RESIDENCE IN 1995--MSA/PMSA LEVELUniverse: Population 5 years and over
Total: 18,439
Native: 15,954 Born in state of residence 4,503 Born in other state in the U.S.: 11,006 Northeast 1,977 Midwest 2,854 South 1,982 West 4,193 Born outside the United States: 445 Puerto Rico 77 U.S. Island Areas 24 Born abroad of American parent(s) 344Foreign born: 2,485 Naturalized citizen 888 Not a citizen 1,597
100%
86.5%24.4%59.7%10.7%15.5%10.7%22.7%2.4%0.4%0.1%1.9%
13.5%4.8%8.7%
P21. PLACE OF BIRTH BY CITIZENSHIP STATUSUniverse: Total population
Total: 18,184Same house in 1995 4,094Different house in 1995: 14,090 In United States in 1995: 12,948 Same city or town: 5,621 Same county 5,621 Different county (same state) 0 Not same city or town: 7,327 Same county 791 Different county: 6,536 Same state 1,408 Different state: 5,128 Northeast 987 Midwest 1,051 South 961 West 2,129 In Puerto Rico in 1995 0 Elsewhere in 1995 1,142
PCT21. RESIDENCE IN 1995
Universe: Population 5 years and over--STATE, COUNTY, PLACE LEVEL
100%22.5%77.5%71.2%30.9%30.9%0.0%
40.3%4.3%
35.9%7.7%
28.2%5.4%5.8%5.3%
11.7%0.0%6.3%
Total
Page 8Community Reporting Area LevelCapitol Hill
January 2005
Department of Planning and Development with Assistance from Puget Sound Regional Council 6.2
Characteristics of ResidencyCensus 2000, Summary File 3
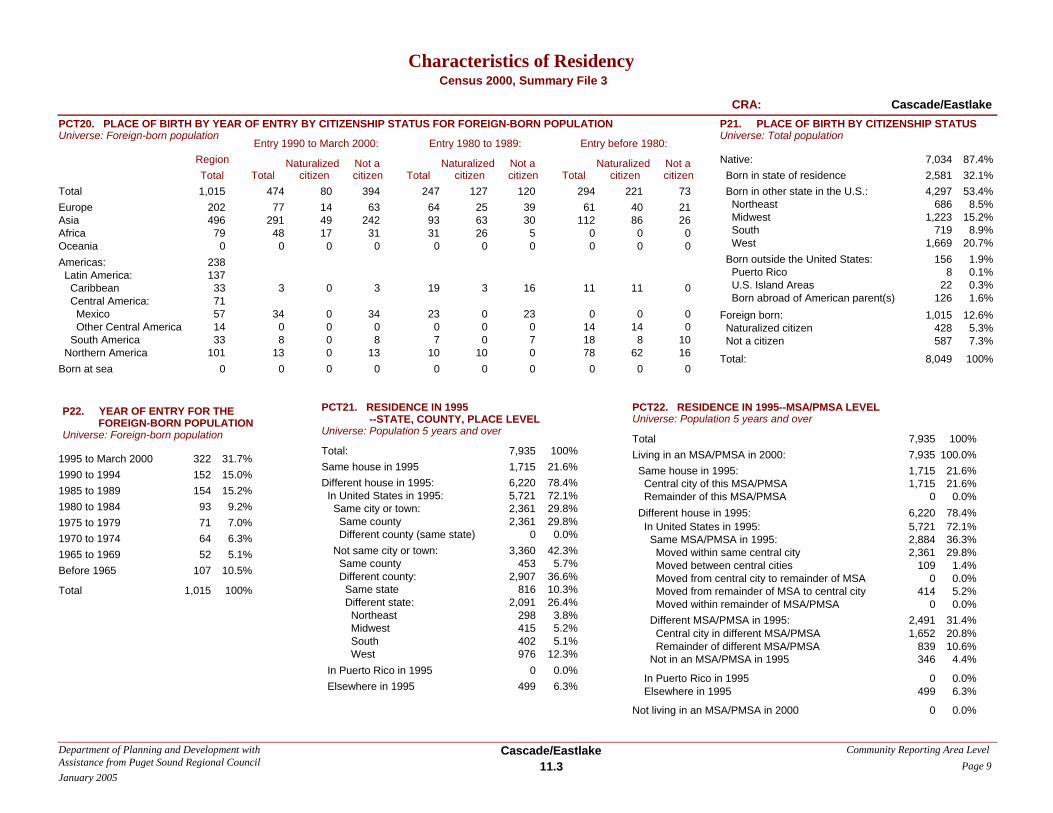
CRA: Cascade/Eastlake
1,015 474 80 394 247 127 120 294 221 73
PCT20. PLACE OF BIRTH BY YEAR OF ENTRY BY CITIZENSHIP STATUS FOR FOREIGN-BORN POPULATIONUniverse: Foreign-born population
Entry 1990 to March 2000: Entry 1980 to 1989: Entry before 1980:
Naturalized citizen
Not a citizenTotalTotal
Region Naturalized citizen
Not a citizenTotal
Naturalized citizen
Not a citizenTotal
Europe 202 77 14 63 64 25 39 61 40 21Asia 496 291 49 242 93 63 30 112 86 26Africa 79 48 17 31 31 26 5 0 0 0Oceania 0 0 0 0 0 0 0 0 0 0Americas: 238 Latin America: 137 Caribbean 33 3 0 3 19 3 16 11 11 0 Central America: 71 Mexico 57 34 0 34 23 0 23 0 0 0 Other Central America 14 0 0 0 0 0 0 14 14 0 South America 33 8 0 8 7 0 7 18 8 10 Northern America 101 13 0 13 10 10 0 78 62 16Born at sea 0 0 0 0 0 0 0 0 0 0
Total 1,015
1995 to March 2000 3221990 to 1994 1521985 to 1989 1541980 to 1984 931975 to 1979 711970 to 1974 641965 to 1969 52Before 1965 107
P22. YEAR OF ENTRY FOR THE
Universe: Foreign-born populationFOREIGN-BORN POPULATION
100%
31.7%15.0%15.2%9.2%7.0%6.3%5.1%
10.5%
Total 7,935Living in an MSA/PMSA in 2000: 7,935 Same house in 1995: 1,715 Central city of this MSA/PMSA 1,715 Remainder of this MSA/PMSA 0 Different house in 1995: 6,220 In United States in 1995: 5,721 Same MSA/PMSA in 1995: 2,884 Moved within same central city 2,361 Moved between central cities 109 Moved from central city to remainder of MSA 0 Moved from remainder of MSA to central city 414 Moved within remainder of MSA/PMSA 0 Different MSA/PMSA in 1995: 2,491 Central city in different MSA/PMSA 1,652 Remainder of different MSA/PMSA 839 Not in an MSA/PMSA in 1995 346
In Puerto Rico in 1995 0 Elsewhere in 1995 499
Not living in an MSA/PMSA in 2000 0
100%100.0%21.6%21.6%0.0%
78.4%72.1%36.3%29.8%1.4%0.0%5.2%0.0%
31.4%20.8%10.6%4.4%
0.0%6.3%
0.0%
PCT22. RESIDENCE IN 1995--MSA/PMSA LEVELUniverse: Population 5 years and over
Total: 8,049
Native: 7,034 Born in state of residence 2,581 Born in other state in the U.S.: 4,297 Northeast 686 Midwest 1,223 South 719 West 1,669 Born outside the United States: 156 Puerto Rico 8 U.S. Island Areas 22 Born abroad of American parent(s) 126Foreign born: 1,015 Naturalized citizen 428 Not a citizen 587
100%
87.4%32.1%53.4%8.5%
15.2%8.9%
20.7%1.9%0.1%0.3%1.6%
12.6%5.3%7.3%
P21. PLACE OF BIRTH BY CITIZENSHIP STATUSUniverse: Total population
Total: 7,935Same house in 1995 1,715Different house in 1995: 6,220 In United States in 1995: 5,721 Same city or town: 2,361 Same county 2,361 Different county (same state) 0 Not same city or town: 3,360 Same county 453 Different county: 2,907 Same state 816 Different state: 2,091 Northeast 298 Midwest 415 South 402 West 976 In Puerto Rico in 1995 0 Elsewhere in 1995 499
PCT21. RESIDENCE IN 1995
Universe: Population 5 years and over--STATE, COUNTY, PLACE LEVEL
100%21.6%78.4%72.1%29.8%29.8%0.0%
42.3%5.7%
36.6%10.3%26.4%3.8%5.2%5.1%
12.3%0.0%6.3%
Total
Page 9Community Reporting Area LevelCascade/Eastlake
January 2005
Department of Planning and Development with Assistance from Puget Sound Regional Council 11.3
Characteristics of ResidencyCensus 2000, Summary File 3
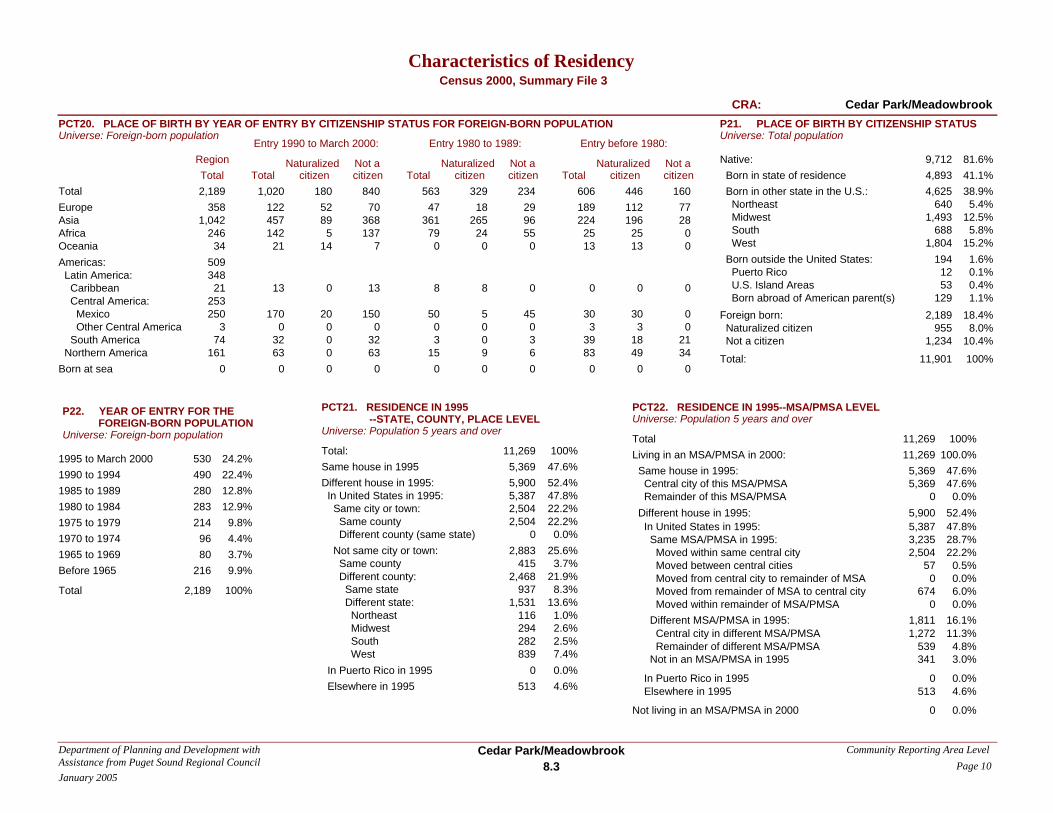
CRA: Cedar Park/Meadowbrook
2,189 1,020 180 840 563 329 234 606 446 160
PCT20. PLACE OF BIRTH BY YEAR OF ENTRY BY CITIZENSHIP STATUS FOR FOREIGN-BORN POPULATIONUniverse: Foreign-born population
Entry 1990 to March 2000: Entry 1980 to 1989: Entry before 1980:
Naturalized citizen
Not a citizenTotalTotal
Region Naturalized citizen
Not a citizenTotal
Naturalized citizen
Not a citizenTotal
Europe 358 122 52 70 47 18 29 189 112 77Asia 1,042 457 89 368 361 265 96 224 196 28Africa 246 142 5 137 79 24 55 25 25 0Oceania 34 21 14 7 0 0 0 13 13 0Americas: 509 Latin America: 348 Caribbean 21 13 0 13 8 8 0 0 0 0 Central America: 253 Mexico 250 170 20 150 50 5 45 30 30 0 Other Central America 3 0 0 0 0 0 0 3 3 0 South America 74 32 0 32 3 0 3 39 18 21 Northern America 161 63 0 63 15 9 6 83 49 34Born at sea 0 0 0 0 0 0 0 0 0 0
Total 2,189
1995 to March 2000 5301990 to 1994 4901985 to 1989 2801980 to 1984 2831975 to 1979 2141970 to 1974 961965 to 1969 80Before 1965 216
P22. YEAR OF ENTRY FOR THE
Universe: Foreign-born populationFOREIGN-BORN POPULATION
100%
24.2%22.4%12.8%12.9%9.8%4.4%3.7%9.9%
Total 11,269Living in an MSA/PMSA in 2000: 11,269 Same house in 1995: 5,369 Central city of this MSA/PMSA 5,369 Remainder of this MSA/PMSA 0 Different house in 1995: 5,900 In United States in 1995: 5,387 Same MSA/PMSA in 1995: 3,235 Moved within same central city 2,504 Moved between central cities 57 Moved from central city to remainder of MSA 0 Moved from remainder of MSA to central city 674 Moved within remainder of MSA/PMSA 0 Different MSA/PMSA in 1995: 1,811 Central city in different MSA/PMSA 1,272 Remainder of different MSA/PMSA 539 Not in an MSA/PMSA in 1995 341
In Puerto Rico in 1995 0 Elsewhere in 1995 513
Not living in an MSA/PMSA in 2000 0
100%100.0%47.6%47.6%0.0%
52.4%47.8%28.7%22.2%0.5%0.0%6.0%0.0%
16.1%11.3%4.8%3.0%
0.0%4.6%
0.0%
PCT22. RESIDENCE IN 1995--MSA/PMSA LEVELUniverse: Population 5 years and over
Total: 11,901
Native: 9,712 Born in state of residence 4,893 Born in other state in the U.S.: 4,625 Northeast 640 Midwest 1,493 South 688 West 1,804 Born outside the United States: 194 Puerto Rico 12 U.S. Island Areas 53 Born abroad of American parent(s) 129Foreign born: 2,189 Naturalized citizen 955 Not a citizen 1,234
100%
81.6%41.1%38.9%5.4%
12.5%5.8%
15.2%1.6%0.1%0.4%1.1%
18.4%8.0%
10.4%
P21. PLACE OF BIRTH BY CITIZENSHIP STATUSUniverse: Total population
Total: 11,269Same house in 1995 5,369Different house in 1995: 5,900 In United States in 1995: 5,387 Same city or town: 2,504 Same county 2,504 Different county (same state) 0 Not same city or town: 2,883 Same county 415 Different county: 2,468 Same state 937 Different state: 1,531 Northeast 116 Midwest 294 South 282 West 839 In Puerto Rico in 1995 0 Elsewhere in 1995 513
PCT21. RESIDENCE IN 1995
Universe: Population 5 years and over--STATE, COUNTY, PLACE LEVEL
100%47.6%52.4%47.8%22.2%22.2%0.0%
25.6%3.7%
21.9%8.3%
13.6%1.0%2.6%2.5%7.4%0.0%4.6%
Total
Page 10Community Reporting Area LevelCedar Park/Meadowbrook
January 2005
Department of Planning and Development with Assistance from Puget Sound Regional Council 8.3

Characteristics of ResidencyCensus 2000, Summary File 3
CRA: Central Area/Squire Park
1,962 1,073 172 901 500 223 277 389 307 82
PCT20. PLACE OF BIRTH BY YEAR OF ENTRY BY CITIZENSHIP STATUS FOR FOREIGN-BORN POPULATIONUniverse: Foreign-born population
Entry 1990 to March 2000: Entry 1980 to 1989: Entry before 1980:
Naturalized citizen
Not a citizenTotalTotal
Region Naturalized citizen
Not a citizenTotal
Naturalized citizen
Not a citizenTotal
Europe 298 147 37 110 44 16 28 107 68 39Asia 511 179 93 86 150 97 53 182 168 14Africa 303 222 14 208 65 44 21 16 0 16Oceania 4 0 0 0 4 4 0 0 0 0Americas: 846 Latin America: 787 Caribbean 0 0 0 0 0 0 0 0 0 0 Central America: 761 Mexico 522 361 28 333 153 52 101 8 8 0 Other Central America 239 156 0 156 74 0 74 9 9 0 South America 26 0 0 0 4 4 0 22 22 0 Northern America 59 8 0 8 6 6 0 45 32 13Born at sea 0 0 0 0 0 0 0 0 0 0
Total 1,962
1995 to March 2000 6201990 to 1994 4531985 to 1989 3421980 to 1984 1581975 to 1979 1161970 to 1974 991965 to 1969 41Before 1965 133
P22. YEAR OF ENTRY FOR THE
Universe: Foreign-born populationFOREIGN-BORN POPULATION
100%
31.6%23.1%17.4%8.1%5.9%5.0%2.1%6.8%
Total 14,844Living in an MSA/PMSA in 2000: 14,844 Same house in 1995: 6,131 Central city of this MSA/PMSA 6,131 Remainder of this MSA/PMSA 0 Different house in 1995: 8,713 In United States in 1995: 8,049 Same MSA/PMSA in 1995: 5,232 Moved within same central city 4,427 Moved between central cities 178 Moved from central city to remainder of MSA 0 Moved from remainder of MSA to central city 627 Moved within remainder of MSA/PMSA 0 Different MSA/PMSA in 1995: 2,468 Central city in different MSA/PMSA 1,888 Remainder of different MSA/PMSA 580 Not in an MSA/PMSA in 1995 349
In Puerto Rico in 1995 0 Elsewhere in 1995 664
Not living in an MSA/PMSA in 2000 0
100%100.0%41.3%41.3%0.0%
58.7%54.2%35.2%29.8%1.2%0.0%4.2%0.0%
16.6%12.7%3.9%2.4%
0.0%4.5%
0.0%
PCT22. RESIDENCE IN 1995--MSA/PMSA LEVELUniverse: Population 5 years and over
Total: 15,518
Native: 13,556 Born in state of residence 5,520 Born in other state in the U.S.: 7,796 Northeast 1,044 Midwest 1,651 South 2,769 West 2,332 Born outside the United States: 240 Puerto Rico 5 U.S. Island Areas 15 Born abroad of American parent(s) 220Foreign born: 1,962 Naturalized citizen 702 Not a citizen 1,260
100%
87.4%35.6%50.2%6.7%
10.6%17.8%15.0%1.5%0.0%0.1%1.4%
12.6%4.5%8.1%
P21. PLACE OF BIRTH BY CITIZENSHIP STATUSUniverse: Total population
Total: 14,844Same house in 1995 6,131Different house in 1995: 8,713 In United States in 1995: 8,049 Same city or town: 4,427 Same county 4,427 Different county (same state) 0 Not same city or town: 3,622 Same county 687 Different county: 2,935 Same state 713 Different state: 2,222 Northeast 313 Midwest 507 South 445 West 957 In Puerto Rico in 1995 0 Elsewhere in 1995 664
PCT21. RESIDENCE IN 1995
Universe: Population 5 years and over--STATE, COUNTY, PLACE LEVEL
100%41.3%58.7%54.2%29.8%29.8%0.0%
24.4%4.6%
19.8%4.8%
15.0%2.1%3.4%3.0%6.4%0.0%4.5%
Total
Page 11Community Reporting Area LevelCentral Area/Squire Park
January 2005
Department of Planning and Development with Assistance from Puget Sound Regional Council 5.3

Characteristics of ResidencyCensus 2000, Summary File 3
CRA: Columbia City
5,769 3,172 807 2,365 1,777 1,086 691 820 695 125
PCT20. PLACE OF BIRTH BY YEAR OF ENTRY BY CITIZENSHIP STATUS FOR FOREIGN-BORN POPULATIONUniverse: Foreign-born population
Entry 1990 to March 2000: Entry 1980 to 1989: Entry before 1980:
Naturalized citizen
Not a citizenTotalTotal
Region Naturalized citizen
Not a citizenTotal
Naturalized citizen
Not a citizenTotal
Europe 163 66 0 66 9 9 0 88 65 23Asia 4,014 1,968 643 1,325 1,403 953 450 643 576 67Africa 790 700 89 611 84 54 30 6 6 0Oceania 204 43 36 7 127 31 96 34 21 13Americas: 598 Latin America: 533 Caribbean 37 10 0 10 0 0 0 27 12 15 Central America: 458 Mexico 318 275 8 267 36 0 36 7 0 7 Other Central America 140 67 6 61 73 30 43 0 0 0 South America 38 29 18 11 9 9 0 0 0 0 Northern America 65 14 7 7 36 0 36 15 15 0Born at sea 0 0 0 0 0 0 0 0 0 0
Total 5,769
1995 to March 2000 1,5061990 to 1994 1,6661985 to 1989 9731980 to 1984 8041975 to 1979 3271970 to 1974 1741965 to 1969 117Before 1965 202
P22. YEAR OF ENTRY FOR THE
Universe: Foreign-born populationFOREIGN-BORN POPULATION
100%
26.1%28.9%16.9%13.9%5.7%3.0%2.0%3.5%
Total 15,672Living in an MSA/PMSA in 2000: 15,672 Same house in 1995: 8,248 Central city of this MSA/PMSA 8,248 Remainder of this MSA/PMSA 0 Different house in 1995: 7,424 In United States in 1995: 6,128 Same MSA/PMSA in 1995: 4,951 Moved within same central city 4,340 Moved between central cities 41 Moved from central city to remainder of MSA 0 Moved from remainder of MSA to central city 570 Moved within remainder of MSA/PMSA 0 Different MSA/PMSA in 1995: 1,015 Central city in different MSA/PMSA 648 Remainder of different MSA/PMSA 367 Not in an MSA/PMSA in 1995 162
In Puerto Rico in 1995 0 Elsewhere in 1995 1,296
Not living in an MSA/PMSA in 2000 0
100%100.0%52.6%52.6%0.0%
47.4%39.1%31.6%27.7%0.3%0.0%3.6%0.0%6.5%4.1%2.3%1.0%
0.0%8.3%
0.0%
PCT22. RESIDENCE IN 1995--MSA/PMSA LEVELUniverse: Population 5 years and over
Total: 16,681
Native: 10,912 Born in state of residence 5,770 Born in other state in the U.S.: 4,980 Northeast 739 Midwest 1,268 South 1,765 West 1,208 Born outside the United States: 162 Puerto Rico 4 U.S. Island Areas 12 Born abroad of American parent(s) 146Foreign born: 5,769 Naturalized citizen 2,588 Not a citizen 3,181
100%
65.4%34.6%29.9%4.4%7.6%
10.6%7.2%1.0%0.0%0.1%0.9%
34.6%15.5%19.1%
P21. PLACE OF BIRTH BY CITIZENSHIP STATUSUniverse: Total population
Total: 15,672Same house in 1995 8,248Different house in 1995: 7,424 In United States in 1995: 6,128 Same city or town: 4,340 Same county 4,340 Different county (same state) 0 Not same city or town: 1,788 Same county 582 Different county: 1,206 Same state 257 Different state: 949 Northeast 110 Midwest 263 South 177 West 399 In Puerto Rico in 1995 0 Elsewhere in 1995 1,296
PCT21. RESIDENCE IN 1995
Universe: Population 5 years and over--STATE, COUNTY, PLACE LEVEL
100%52.6%47.4%39.1%27.7%27.7%0.0%
11.4%3.7%7.7%1.6%6.1%0.7%1.7%1.1%2.5%0.0%8.3%
Total
Page 12Community Reporting Area LevelColumbia City
January 2005
Department of Planning and Development with Assistance from Puget Sound Regional Council 4.2

Characteristics of ResidencyCensus 2000, Summary File 3
CRA: Downtown Commercial Core
498 135 0 135 56 18 38 307 242 65
PCT20. PLACE OF BIRTH BY YEAR OF ENTRY BY CITIZENSHIP STATUS FOR FOREIGN-BORN POPULATIONUniverse: Foreign-born population
Entry 1990 to March 2000: Entry 1980 to 1989: Entry before 1980:
Naturalized citizen
Not a citizenTotalTotal
Region Naturalized citizen
Not a citizenTotal
Naturalized citizen
Not a citizenTotal
Europe 132 29 0 29 0 0 0 103 84 19Asia 187 52 0 52 45 18 27 90 79 11Africa 60 27 0 27 0 0 0 33 20 13Oceania 15 15 0 15 0 0 0 0 0 0Americas: 104 Latin America: 64 Caribbean 10 0 0 0 0 0 0 10 0 10 Central America: 54 Mexico 22 0 0 0 0 0 0 22 22 0 Other Central America 32 0 0 0 11 0 11 21 9 12 South America 0 0 0 0 0 0 0 0 0 0 Northern America 40 12 0 12 0 0 0 28 28 0Born at sea 0 0 0 0 0 0 0 0 0 0
Total 498
1995 to March 2000 1041990 to 1994 311985 to 1989 291980 to 1984 271975 to 1979 481970 to 1974 1471965 to 1969 10Before 1965 102
P22. YEAR OF ENTRY FOR THE
Universe: Foreign-born populationFOREIGN-BORN POPULATION
100%
20.9%6.2%5.8%5.4%9.6%
29.5%2.0%
20.5%
Total 3,430Living in an MSA/PMSA in 2000: 3,430 Same house in 1995: 797 Central city of this MSA/PMSA 797 Remainder of this MSA/PMSA 0 Different house in 1995: 2,633 In United States in 1995: 2,496 Same MSA/PMSA in 1995: 1,413 Moved within same central city 989 Moved between central cities 20 Moved from central city to remainder of MSA 0 Moved from remainder of MSA to central city 404 Moved within remainder of MSA/PMSA 0 Different MSA/PMSA in 1995: 945 Central city in different MSA/PMSA 619 Remainder of different MSA/PMSA 326 Not in an MSA/PMSA in 1995 138
In Puerto Rico in 1995 12 Elsewhere in 1995 125
Not living in an MSA/PMSA in 2000 0
100%100.0%23.2%23.2%0.0%
76.8%72.8%41.2%28.8%0.6%0.0%
11.8%0.0%
27.6%18.0%9.5%4.0%
0.3%3.6%
0.0%
PCT22. RESIDENCE IN 1995--MSA/PMSA LEVELUniverse: Population 5 years and over
Total: 3,461
Native: 2,963 Born in state of residence 825 Born in other state in the U.S.: 2,096 Northeast 325 Midwest 615 South 430 West 726 Born outside the United States: 42 Puerto Rico 12 U.S. Island Areas 0 Born abroad of American parent(s) 30Foreign born: 498 Naturalized citizen 260 Not a citizen 238
100%
85.6%23.8%60.6%9.4%
17.8%12.4%21.0%1.2%0.3%0.0%0.9%
14.4%7.5%6.9%
P21. PLACE OF BIRTH BY CITIZENSHIP STATUSUniverse: Total population
Total: 3,430Same house in 1995 797Different house in 1995: 2,633 In United States in 1995: 2,496 Same city or town: 989 Same county 989 Different county (same state) 0 Not same city or town: 1,507 Same county 333 Different county: 1,174 Same state 261 Different state: 913 Northeast 106 Midwest 173 South 214 West 420 In Puerto Rico in 1995 12 Elsewhere in 1995 125
PCT21. RESIDENCE IN 1995
Universe: Population 5 years and over--STATE, COUNTY, PLACE LEVEL
100%23.2%76.8%72.8%28.8%28.8%0.0%
43.9%9.7%
34.2%7.6%
26.6%3.1%5.0%6.2%
12.2%0.3%3.6%
Total
Page 13Community Reporting Area LevelDowntown Commercial Core
January 2005
Department of Planning and Development with Assistance from Puget Sound Regional Council 13.2

Characteristics of ResidencyCensus 2000, Summary File 3
CRA: Duwamish/SODO
527 228 5 223 148 93 55 151 130 21
PCT20. PLACE OF BIRTH BY YEAR OF ENTRY BY CITIZENSHIP STATUS FOR FOREIGN-BORN POPULATIONUniverse: Foreign-born population
Entry 1990 to March 2000: Entry 1980 to 1989: Entry before 1980:
Naturalized citizen
Not a citizenTotalTotal
Region Naturalized citizen
Not a citizenTotal
Naturalized citizen
Not a citizenTotal
Europe 25 5 0 5 0 0 0 20 16 4Asia 275 75 5 70 102 55 47 98 91 7Africa 71 48 0 48 15 10 5 8 3 5Oceania 0 0 0 0 0 0 0 0 0 0Americas: 156 Latin America: 136 Caribbean 0 0 0 0 0 0 0 0 0 0 Central America: 130 Mexico 118 74 0 74 31 28 3 13 13 0 Other Central America 12 12 0 12 0 0 0 0 0 0 South America 6 6 0 6 0 0 0 0 0 0 Northern America 20 8 0 8 0 0 0 12 7 5Born at sea 0 0 0 0 0 0 0 0 0 0
Total 527
1995 to March 2000 1401990 to 1994 881985 to 1989 951980 to 1984 531975 to 1979 431970 to 1974 351965 to 1969 23Before 1965 50
P22. YEAR OF ENTRY FOR THE
Universe: Foreign-born populationFOREIGN-BORN POPULATION
100%
26.6%16.7%18.0%10.1%8.2%6.6%4.4%9.5%
Total 2,430Living in an MSA/PMSA in 2000: 2,430 Same house in 1995: 808 Central city of this MSA/PMSA 808 Remainder of this MSA/PMSA 0 Different house in 1995: 1,622 In United States in 1995: 1,426 Same MSA/PMSA in 1995: 846 Moved within same central city 625 Moved between central cities 39 Moved from central city to remainder of MSA 0 Moved from remainder of MSA to central city 182 Moved within remainder of MSA/PMSA 0 Different MSA/PMSA in 1995: 538 Central city in different MSA/PMSA 434 Remainder of different MSA/PMSA 104 Not in an MSA/PMSA in 1995 42
In Puerto Rico in 1995 0 Elsewhere in 1995 196
Not living in an MSA/PMSA in 2000 0
100%100.0%33.3%33.3%0.0%
66.7%58.7%34.8%25.7%1.6%0.0%7.5%0.0%
22.1%17.9%4.3%1.7%
0.0%8.1%
0.0%
PCT22. RESIDENCE IN 1995--MSA/PMSA LEVELUniverse: Population 5 years and over
Total: 2,562
Native: 2,035 Born in state of residence 931 Born in other state in the U.S.: 1,069 Northeast 120 Midwest 327 South 257 West 365 Born outside the United States: 35 Puerto Rico 15 U.S. Island Areas 0 Born abroad of American parent(s) 20Foreign born: 527 Naturalized citizen 228 Not a citizen 299
100%
79.4%36.3%41.7%4.7%
12.8%10.0%14.2%1.4%0.6%0.0%0.8%
20.6%8.9%
11.7%
P21. PLACE OF BIRTH BY CITIZENSHIP STATUSUniverse: Total population
Total: 2,430Same house in 1995 808Different house in 1995: 1,622 In United States in 1995: 1,426 Same city or town: 625 Same county 625 Different county (same state) 0 Not same city or town: 801 Same county 195 Different county: 606 Same state 129 Different state: 477 Northeast 45 Midwest 36 South 188 West 208 In Puerto Rico in 1995 0 Elsewhere in 1995 196
PCT21. RESIDENCE IN 1995
Universe: Population 5 years and over--STATE, COUNTY, PLACE LEVEL
100%33.3%66.7%58.7%25.7%25.7%0.0%
33.0%8.0%
24.9%5.3%
19.6%1.9%1.5%7.7%8.6%0.0%8.1%
Total
Page 14Community Reporting Area LevelDuwamish/SODO
January 2005
Department of Planning and Development with Assistance from Puget Sound Regional Council 3.3

Characteristics of ResidencyCensus 2000, Summary File 3
CRA: Fauntleroy/Seaview
1,038 288 39 249 273 115 158 477 342 135
PCT20. PLACE OF BIRTH BY YEAR OF ENTRY BY CITIZENSHIP STATUS FOR FOREIGN-BORN POPULATIONUniverse: Foreign-born population
Entry 1990 to March 2000: Entry 1980 to 1989: Entry before 1980:
Naturalized citizen
Not a citizenTotalTotal
Region Naturalized citizen
Not a citizenTotal
Naturalized citizen
Not a citizenTotal
Europe 365 49 0 49 127 59 68 189 117 72Asia 261 59 7 52 82 49 33 120 101 19Africa 44 23 13 10 11 0 11 10 10 0Oceania 16 16 6 10 0 0 0 0 0 0Americas: 352 Latin America: 168 Caribbean 7 0 0 0 0 0 0 7 7 0 Central America: 98 Mexico 88 49 0 49 26 0 26 13 13 0 Other Central America 10 0 0 0 0 0 0 10 10 0 South America 63 18 0 18 20 0 20 25 8 17 Northern America 184 74 13 61 7 7 0 103 76 27Born at sea 0 0 0 0 0 0 0 0 0 0
Total 1,038
1995 to March 2000 1491990 to 1994 1391985 to 1989 1701980 to 1984 1031975 to 1979 581970 to 1974 951965 to 1969 83Before 1965 241
P22. YEAR OF ENTRY FOR THE
Universe: Foreign-born populationFOREIGN-BORN POPULATION
100%
14.4%13.4%16.4%9.9%5.6%9.2%8.0%
23.2%
Total 12,503Living in an MSA/PMSA in 2000: 12,503 Same house in 1995: 6,940 Central city of this MSA/PMSA 6,940 Remainder of this MSA/PMSA 0 Different house in 1995: 5,563 In United States in 1995: 5,309 Same MSA/PMSA in 1995: 3,540 Moved within same central city 2,802 Moved between central cities 109 Moved from central city to remainder of MSA 0 Moved from remainder of MSA to central city 629 Moved within remainder of MSA/PMSA 0 Different MSA/PMSA in 1995: 1,615 Central city in different MSA/PMSA 873 Remainder of different MSA/PMSA 742 Not in an MSA/PMSA in 1995 154
In Puerto Rico in 1995 0 Elsewhere in 1995 254
Not living in an MSA/PMSA in 2000 0
100%100.0%55.5%55.5%0.0%
44.5%42.5%28.3%22.4%0.9%0.0%5.0%0.0%
12.9%7.0%5.9%1.2%
0.0%2.0%
0.0%
PCT22. RESIDENCE IN 1995--MSA/PMSA LEVELUniverse: Population 5 years and over
Total: 13,186
Native: 12,148 Born in state of residence 6,301 Born in other state in the U.S.: 5,627 Northeast 993 Midwest 1,624 South 908 West 2,102 Born outside the United States: 220 Puerto Rico 11 U.S. Island Areas 0 Born abroad of American parent(s) 209Foreign born: 1,038 Naturalized citizen 496 Not a citizen 542
100%
92.1%47.8%42.7%7.5%
12.3%6.9%
15.9%1.7%0.1%0.0%1.6%7.9%3.8%4.1%
P21. PLACE OF BIRTH BY CITIZENSHIP STATUSUniverse: Total population
Total: 12,503Same house in 1995 6,940Different house in 1995: 5,563 In United States in 1995: 5,309 Same city or town: 2,802 Same county 2,802 Different county (same state) 0 Not same city or town: 2,507 Same county 638 Different county: 1,869 Same state 527 Different state: 1,342 Northeast 154 Midwest 205 South 246 West 737 In Puerto Rico in 1995 0 Elsewhere in 1995 254
PCT21. RESIDENCE IN 1995
Universe: Population 5 years and over--STATE, COUNTY, PLACE LEVEL
100%55.5%44.5%42.5%22.4%22.4%0.0%
20.1%5.1%
14.9%4.2%
10.7%1.2%1.6%2.0%5.9%0.0%2.0%
Total
Page 15Community Reporting Area LevelFauntleroy/Seaview
January 2005
Department of Planning and Development with Assistance from Puget Sound Regional Council 1.2

Characteristics of ResidencyCensus 2000, Summary File 3
CRA: First Hill
2,658 1,758 236 1,522 494 224 270 406 372 34
PCT20. PLACE OF BIRTH BY YEAR OF ENTRY BY CITIZENSHIP STATUS FOR FOREIGN-BORN POPULATIONUniverse: Foreign-born population
Entry 1990 to March 2000: Entry 1980 to 1989: Entry before 1980:
Naturalized citizen
Not a citizenTotalTotal
Region Naturalized citizen
Not a citizenTotal
Naturalized citizen
Not a citizenTotal
Europe 300 181 29 152 64 19 45 55 55 0Asia 1,163 697 160 537 247 166 81 219 214 5Africa 434 359 29 330 67 26 41 8 0 8Oceania 39 24 5 19 0 0 0 15 15 0Americas: 722 Latin America: 588 Caribbean 11 0 0 0 4 0 4 7 0 7 Central America: 499 Mexico 349 241 0 241 83 9 74 25 19 6 Other Central America 150 122 6 116 18 0 18 10 10 0 South America 78 63 0 63 11 4 7 4 4 0 Northern America 134 71 7 64 0 0 0 63 55 8Born at sea 0 0 0 0 0 0 0 0 0 0
Total 2,658
1995 to March 2000 1,1051990 to 1994 6531985 to 1989 3081980 to 1984 1861975 to 1979 1241970 to 1974 741965 to 1969 52Before 1965 156
P22. YEAR OF ENTRY FOR THE
Universe: Foreign-born populationFOREIGN-BORN POPULATION
100%
41.6%24.6%11.6%7.0%4.7%2.8%2.0%5.9%
Total 15,220Living in an MSA/PMSA in 2000: 15,220 Same house in 1995: 2,976 Central city of this MSA/PMSA 2,976 Remainder of this MSA/PMSA 0 Different house in 1995: 12,244 In United States in 1995: 11,068 Same MSA/PMSA in 1995: 6,498 Moved within same central city 3,216 Moved between central cities 2,212 Moved from central city to remainder of MSA 0 Moved from remainder of MSA to central city 1,070 Moved within remainder of MSA/PMSA 0 Different MSA/PMSA in 1995: 3,202 Central city in different MSA/PMSA 2,034 Remainder of different MSA/PMSA 1,168 Not in an MSA/PMSA in 1995 1,368
In Puerto Rico in 1995 0 Elsewhere in 1995 1,176
Not living in an MSA/PMSA in 2000 0
100%100.0%19.6%19.6%0.0%
80.4%72.7%42.7%21.1%14.5%0.0%7.0%0.0%
21.0%13.4%7.7%9.0%
0.0%7.7%
0.0%
PCT22. RESIDENCE IN 1995--MSA/PMSA LEVELUniverse: Population 5 years and over
Total: 15,506
Native: 12,848 Born in state of residence 4,744 Born in other state in the U.S.: 7,739 Northeast 1,038 Midwest 1,633 South 1,782 West 3,286 Born outside the United States: 365 Puerto Rico 6 U.S. Island Areas 101 Born abroad of American parent(s) 258Foreign born: 2,658 Naturalized citizen 832 Not a citizen 1,826
100%
82.9%30.6%49.9%6.7%
10.5%11.5%21.2%2.4%0.0%0.7%1.7%
17.1%5.4%
11.8%
P21. PLACE OF BIRTH BY CITIZENSHIP STATUSUniverse: Total population
Total: 15,220Same house in 1995 2,976Different house in 1995: 12,244 In United States in 1995: 11,068 Same city or town: 3,216 Same county 3,216 Different county (same state) 0 Not same city or town: 7,852 Same county 825 Different county: 7,027 Same state 4,054 Different state: 2,973 Northeast 385 Midwest 461 South 600 West 1,527 In Puerto Rico in 1995 0 Elsewhere in 1995 1,176
PCT21. RESIDENCE IN 1995
Universe: Population 5 years and over--STATE, COUNTY, PLACE LEVEL
100%19.6%80.4%72.7%21.1%21.1%0.0%
51.6%5.4%
46.2%26.6%19.5%2.5%3.0%3.9%
10.0%0.0%7.7%
Total
Page 16Community Reporting Area LevelFirst Hill
January 2005
Department of Planning and Development with Assistance from Puget Sound Regional Council 6.1

Characteristics of ResidencyCensus 2000, Summary File 3
CRA: Fremont
974 346 105 241 178 108 70 450 313 137
PCT20. PLACE OF BIRTH BY YEAR OF ENTRY BY CITIZENSHIP STATUS FOR FOREIGN-BORN POPULATIONUniverse: Foreign-born population
Entry 1990 to March 2000: Entry 1980 to 1989: Entry before 1980:
Naturalized citizen
Not a citizenTotalTotal
Region Naturalized citizen
Not a citizenTotal
Naturalized citizen
Not a citizenTotal
Europe 229 97 23 74 35 10 25 97 41 56Asia 404 131 62 69 98 78 20 175 156 19Africa 17 8 8 0 9 0 9 0 0 0Oceania 21 21 0 21 0 0 0 0 0 0Americas: 303 Latin America: 166 Caribbean 15 0 0 0 0 0 0 15 15 0 Central America: 109 Mexico 99 30 0 30 17 7 10 52 33 19 Other Central America 10 0 0 0 0 0 0 10 0 10 South America 42 29 12 17 13 13 0 0 0 0 Northern America 137 30 0 30 6 0 6 101 68 33Born at sea 0 0 0 0 0 0 0 0 0 0
Total 974
1995 to March 2000 1911990 to 1994 1551985 to 1989 751980 to 1984 1031975 to 1979 1431970 to 1974 701965 to 1969 98Before 1965 139
P22. YEAR OF ENTRY FOR THE
Universe: Foreign-born populationFOREIGN-BORN POPULATION
100%
19.6%15.9%7.7%
10.6%14.7%7.2%
10.1%14.3%
Total 13,695Living in an MSA/PMSA in 2000: 13,695 Same house in 1995: 4,672 Central city of this MSA/PMSA 4,672 Remainder of this MSA/PMSA 0 Different house in 1995: 9,023 In United States in 1995: 8,716 Same MSA/PMSA in 1995: 4,693 Moved within same central city 3,725 Moved between central cities 176 Moved from central city to remainder of MSA 0 Moved from remainder of MSA to central city 792 Moved within remainder of MSA/PMSA 0 Different MSA/PMSA in 1995: 3,376 Central city in different MSA/PMSA 2,369 Remainder of different MSA/PMSA 1,007 Not in an MSA/PMSA in 1995 647
In Puerto Rico in 1995 0 Elsewhere in 1995 307
Not living in an MSA/PMSA in 2000 0
100%100.0%34.1%34.1%0.0%
65.9%63.6%34.3%27.2%1.3%0.0%5.8%0.0%
24.7%17.3%7.4%4.7%
0.0%2.2%
0.0%
PCT22. RESIDENCE IN 1995--MSA/PMSA LEVELUniverse: Population 5 years and over
Total: 14,091
Native: 13,117 Born in state of residence 4,865 Born in other state in the U.S.: 7,932 Northeast 1,870 Midwest 2,226 South 1,043 West 2,793 Born outside the United States: 320 Puerto Rico 16 U.S. Island Areas 0 Born abroad of American parent(s) 304Foreign born: 974 Naturalized citizen 526 Not a citizen 448
100%
93.1%34.5%56.3%13.3%15.8%7.4%
19.8%2.3%0.1%0.0%2.2%6.9%3.7%3.2%
P21. PLACE OF BIRTH BY CITIZENSHIP STATUSUniverse: Total population
Total: 13,695Same house in 1995 4,672Different house in 1995: 9,023 In United States in 1995: 8,716 Same city or town: 3,725 Same county 3,725 Different county (same state) 0 Not same city or town: 4,991 Same county 724 Different county: 4,267 Same state 1,129 Different state: 3,138 Northeast 756 Midwest 573 South 422 West 1,387 In Puerto Rico in 1995 0 Elsewhere in 1995 307
PCT21. RESIDENCE IN 1995
Universe: Population 5 years and over--STATE, COUNTY, PLACE LEVEL
100%34.1%65.9%63.6%27.2%27.2%0.0%
36.4%5.3%
31.2%8.2%
22.9%5.5%4.2%3.1%
10.1%0.0%2.2%
Total
Page 17Community Reporting Area LevelFremont
January 2005
Department of Planning and Development with Assistance from Puget Sound Regional Council 11.1

Characteristics of ResidencyCensus 2000, Summary File 3
CRA: Georgetown
251 92 18 74 68 54 14 91 73 18
PCT20. PLACE OF BIRTH BY YEAR OF ENTRY BY CITIZENSHIP STATUS FOR FOREIGN-BORN POPULATIONUniverse: Foreign-born population
Entry 1990 to March 2000: Entry 1980 to 1989: Entry before 1980:
Naturalized citizen
Not a citizenTotalTotal
Region Naturalized citizen
Not a citizenTotal
Naturalized citizen
Not a citizenTotal
Europe 18 9 5 4 9 9 0 0 0 0Asia 147 49 13 36 14 0 14 84 66 18Africa 0 0 0 0 0 0 0 0 0 0Oceania 0 0 0 0 0 0 0 0 0 0Americas: 86 Latin America: 74 Caribbean 0 0 0 0 0 0 0 0 0 0 Central America: 74 Mexico 74 29 0 29 45 45 0 0 0 0 Other Central America 0 0 0 0 0 0 0 0 0 0 South America 0 0 0 0 0 0 0 0 0 0 Northern America 12 5 0 5 0 0 0 7 7 0Born at sea 0 0 0 0 0 0 0 0 0 0
Total 251
1995 to March 2000 371990 to 1994 551985 to 1989 391980 to 1984 291975 to 1979 631970 to 1974 101965 to 1969 0Before 1965 18
P22. YEAR OF ENTRY FOR THE
Universe: Foreign-born populationFOREIGN-BORN POPULATION
100%
14.7%21.9%15.5%11.6%25.1%4.0%0.0%7.2%
Total 1,040Living in an MSA/PMSA in 2000: 1,040 Same house in 1995: 494 Central city of this MSA/PMSA 494 Remainder of this MSA/PMSA 0 Different house in 1995: 546 In United States in 1995: 513 Same MSA/PMSA in 1995: 384 Moved within same central city 319 Moved between central cities 9 Moved from central city to remainder of MSA 0 Moved from remainder of MSA to central city 56 Moved within remainder of MSA/PMSA 0 Different MSA/PMSA in 1995: 112 Central city in different MSA/PMSA 106 Remainder of different MSA/PMSA 6 Not in an MSA/PMSA in 1995 17
In Puerto Rico in 1995 0 Elsewhere in 1995 33
Not living in an MSA/PMSA in 2000 0
100%100.0%47.5%47.5%0.0%
52.5%49.3%36.9%30.7%0.9%0.0%5.4%0.0%
10.8%10.2%0.6%1.6%
0.0%3.2%
0.0%
PCT22. RESIDENCE IN 1995--MSA/PMSA LEVELUniverse: Population 5 years and over
Total: 1,091
Native: 840 Born in state of residence 444 Born in other state in the U.S.: 396 Northeast 68 Midwest 112 South 74 West 142 Born outside the United States: 0 Puerto Rico 0 U.S. Island Areas 0 Born abroad of American parent(s) 0Foreign born: 251 Naturalized citizen 145 Not a citizen 106
100%
77.0%40.7%36.3%6.2%
10.3%6.8%
13.0%0.0%0.0%0.0%0.0%
23.0%13.3%9.7%
P21. PLACE OF BIRTH BY CITIZENSHIP STATUSUniverse: Total population
Total: 1,040Same house in 1995 494Different house in 1995: 546 In United States in 1995: 513 Same city or town: 319 Same county 319 Different county (same state) 0 Not same city or town: 194 Same county 36 Different county: 158 Same state 49 Different state: 109 Northeast 17 Midwest 16 South 7 West 69 In Puerto Rico in 1995 0 Elsewhere in 1995 33
PCT21. RESIDENCE IN 1995
Universe: Population 5 years and over--STATE, COUNTY, PLACE LEVEL
100%47.5%52.5%49.3%30.7%30.7%0.0%
18.7%3.5%
15.2%4.7%
10.5%1.6%1.5%0.7%6.6%0.0%3.2%
Total
Page 18Community Reporting Area LevelGeorgetown
January 2005
Department of Planning and Development with Assistance from Puget Sound Regional Council 3.2

Characteristics of ResidencyCensus 2000, Summary File 3
CRA: Green Lake
1,180 387 53 334 260 148 112 533 419 114
PCT20. PLACE OF BIRTH BY YEAR OF ENTRY BY CITIZENSHIP STATUS FOR FOREIGN-BORN POPULATIONUniverse: Foreign-born population
Entry 1990 to March 2000: Entry 1980 to 1989: Entry before 1980:
Naturalized citizen
Not a citizenTotalTotal
Region Naturalized citizen
Not a citizenTotal
Naturalized citizen
Not a citizenTotal
Europe 425 169 15 154 48 43 5 208 176 32Asia 451 125 17 108 131 93 38 195 182 13Africa 18 0 0 0 18 0 18 0 0 0Oceania 5 5 0 5 0 0 0 0 0 0Americas: 281 Latin America: 99 Caribbean 18 0 0 0 0 0 0 18 13 5 Central America: 36 Mexico 29 25 0 25 4 0 4 0 0 0 Other Central America 7 7 7 0 0 0 0 0 0 0 South America 45 14 10 4 22 6 16 9 9 0 Northern America 182 42 4 38 37 6 31 103 39 64Born at sea 0 0 0 0 0 0 0 0 0 0
Total 1,180
1995 to March 2000 2581990 to 1994 1291985 to 1989 1421980 to 1984 1181975 to 1979 1241970 to 1974 471965 to 1969 125Before 1965 237
P22. YEAR OF ENTRY FOR THE
Universe: Foreign-born populationFOREIGN-BORN POPULATION
100%
21.9%10.9%12.0%10.0%10.5%4.0%
10.6%20.1%
Total 12,419Living in an MSA/PMSA in 2000: 12,419 Same house in 1995: 5,183 Central city of this MSA/PMSA 5,183 Remainder of this MSA/PMSA 0 Different house in 1995: 7,236 In United States in 1995: 6,890 Same MSA/PMSA in 1995: 3,982 Moved within same central city 3,113 Moved between central cities 142 Moved from central city to remainder of MSA 0 Moved from remainder of MSA to central city 727 Moved within remainder of MSA/PMSA 0 Different MSA/PMSA in 1995: 2,342 Central city in different MSA/PMSA 1,765 Remainder of different MSA/PMSA 577 Not in an MSA/PMSA in 1995 566
In Puerto Rico in 1995 0 Elsewhere in 1995 346
Not living in an MSA/PMSA in 2000 0
100%100.0%41.7%41.7%0.0%
58.3%55.5%32.1%25.1%1.1%0.0%5.9%0.0%
18.9%14.2%4.6%4.6%
0.0%2.8%
0.0%
PCT22. RESIDENCE IN 1995--MSA/PMSA LEVELUniverse: Population 5 years and over
Total: 12,897
Native: 11,717 Born in state of residence 5,416 Born in other state in the U.S.: 6,064 Northeast 1,099 Midwest 1,824 South 817 West 2,324 Born outside the United States: 237 Puerto Rico 7 U.S. Island Areas 0 Born abroad of American parent(s) 230Foreign born: 1,180 Naturalized citizen 620 Not a citizen 560
100%
90.9%42.0%47.0%8.5%
14.1%6.3%
18.0%1.8%0.1%0.0%1.8%9.1%4.8%4.3%
P21. PLACE OF BIRTH BY CITIZENSHIP STATUSUniverse: Total population
Total: 12,419Same house in 1995 5,183Different house in 1995: 7,236 In United States in 1995: 6,890 Same city or town: 3,113 Same county 3,113 Different county (same state) 0 Not same city or town: 3,777 Same county 673 Different county: 3,104 Same state 1,022 Different state: 2,082 Northeast 428 Midwest 472 South 289 West 893 In Puerto Rico in 1995 0 Elsewhere in 1995 346
PCT21. RESIDENCE IN 1995
Universe: Population 5 years and over--STATE, COUNTY, PLACE LEVEL
100%41.7%58.3%55.5%25.1%25.1%0.0%
30.4%5.4%
25.0%8.2%
16.8%3.4%3.8%2.3%7.2%0.0%2.8%
Total
Page 19Community Reporting Area LevelGreen Lake
January 2005
Department of Planning and Development with Assistance from Puget Sound Regional Council 9.4
Characteristics of ResidencyCensus 2000, Summary File 3
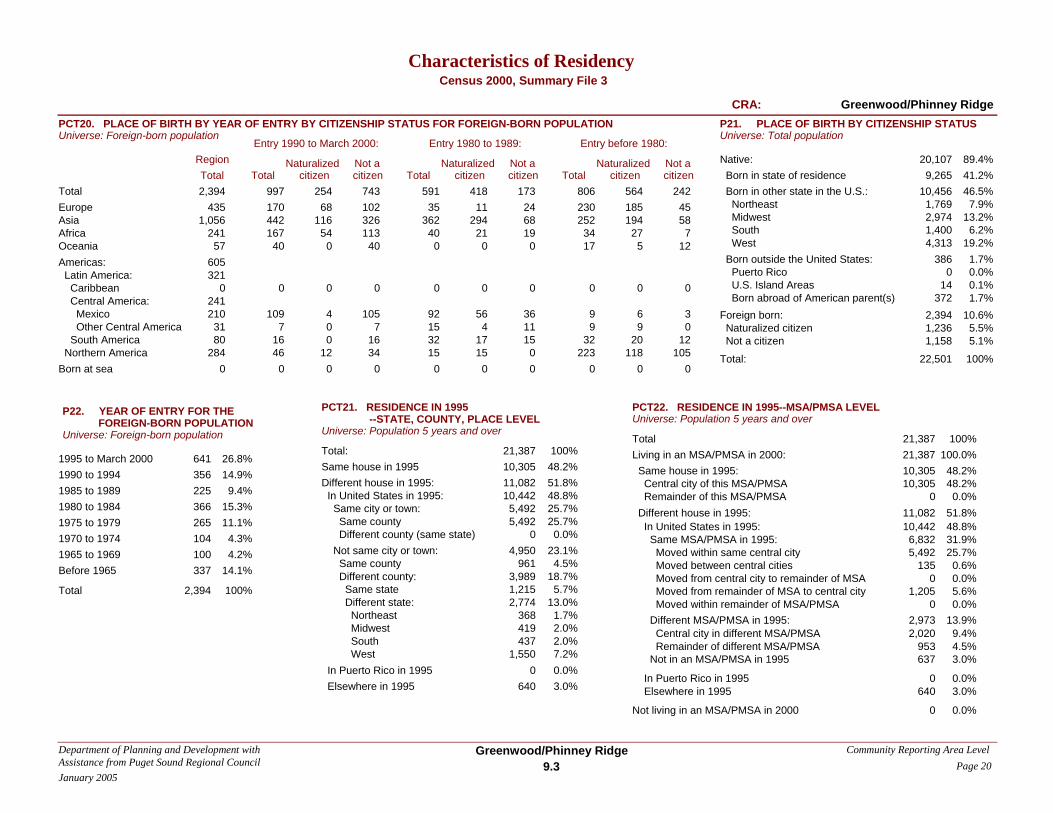
CRA: Greenwood/Phinney Ridge
2,394 997 254 743 591 418 173 806 564 242
PCT20. PLACE OF BIRTH BY YEAR OF ENTRY BY CITIZENSHIP STATUS FOR FOREIGN-BORN POPULATIONUniverse: Foreign-born population
Entry 1990 to March 2000: Entry 1980 to 1989: Entry before 1980:
Naturalized citizen
Not a citizenTotalTotal
Region Naturalized citizen
Not a citizenTotal
Naturalized citizen
Not a citizenTotal
Europe 435 170 68 102 35 11 24 230 185 45Asia 1,056 442 116 326 362 294 68 252 194 58Africa 241 167 54 113 40 21 19 34 27 7Oceania 57 40 0 40 0 0 0 17 5 12Americas: 605 Latin America: 321 Caribbean 0 0 0 0 0 0 0 0 0 0 Central America: 241 Mexico 210 109 4 105 92 56 36 9 6 3 Other Central America 31 7 0 7 15 4 11 9 9 0 South America 80 16 0 16 32 17 15 32 20 12 Northern America 284 46 12 34 15 15 0 223 118 105Born at sea 0 0 0 0 0 0 0 0 0 0
Total 2,394
1995 to March 2000 6411990 to 1994 3561985 to 1989 2251980 to 1984 3661975 to 1979 2651970 to 1974 1041965 to 1969 100Before 1965 337
P22. YEAR OF ENTRY FOR THE
Universe: Foreign-born populationFOREIGN-BORN POPULATION
100%
26.8%14.9%9.4%
15.3%11.1%4.3%4.2%
14.1%
Total 21,387Living in an MSA/PMSA in 2000: 21,387 Same house in 1995: 10,305 Central city of this MSA/PMSA 10,305 Remainder of this MSA/PMSA 0 Different house in 1995: 11,082 In United States in 1995: 10,442 Same MSA/PMSA in 1995: 6,832 Moved within same central city 5,492 Moved between central cities 135 Moved from central city to remainder of MSA 0 Moved from remainder of MSA to central city 1,205 Moved within remainder of MSA/PMSA 0 Different MSA/PMSA in 1995: 2,973 Central city in different MSA/PMSA 2,020 Remainder of different MSA/PMSA 953 Not in an MSA/PMSA in 1995 637
In Puerto Rico in 1995 0 Elsewhere in 1995 640
Not living in an MSA/PMSA in 2000 0
100%100.0%48.2%48.2%0.0%
51.8%48.8%31.9%25.7%0.6%0.0%5.6%0.0%
13.9%9.4%4.5%3.0%
0.0%3.0%
0.0%
PCT22. RESIDENCE IN 1995--MSA/PMSA LEVELUniverse: Population 5 years and over
Total: 22,501
Native: 20,107 Born in state of residence 9,265 Born in other state in the U.S.: 10,456 Northeast 1,769 Midwest 2,974 South 1,400 West 4,313 Born outside the United States: 386 Puerto Rico 0 U.S. Island Areas 14 Born abroad of American parent(s) 372Foreign born: 2,394 Naturalized citizen 1,236 Not a citizen 1,158
100%
89.4%41.2%46.5%7.9%
13.2%6.2%
19.2%1.7%0.0%0.1%1.7%
10.6%5.5%5.1%
P21. PLACE OF BIRTH BY CITIZENSHIP STATUSUniverse: Total population
Total: 21,387Same house in 1995 10,305Different house in 1995: 11,082 In United States in 1995: 10,442 Same city or town: 5,492 Same county 5,492 Different county (same state) 0 Not same city or town: 4,950 Same county 961 Different county: 3,989 Same state 1,215 Different state: 2,774 Northeast 368 Midwest 419 South 437 West 1,550 In Puerto Rico in 1995 0 Elsewhere in 1995 640
PCT21. RESIDENCE IN 1995
Universe: Population 5 years and over--STATE, COUNTY, PLACE LEVEL
100%48.2%51.8%48.8%25.7%25.7%0.0%
23.1%4.5%
18.7%5.7%
13.0%1.7%2.0%2.0%7.2%0.0%3.0%
Total
Page 20Community Reporting Area LevelGreenwood/Phinney Ridge
January 2005
Department of Planning and Development with Assistance from Puget Sound Regional Council 9.3

Characteristics of ResidencyCensus 2000, Summary File 3
CRA: Haller Lake
2,341 1,113 274 839 677 448 229 551 453 98
PCT20. PLACE OF BIRTH BY YEAR OF ENTRY BY CITIZENSHIP STATUS FOR FOREIGN-BORN POPULATIONUniverse: Foreign-born population
Entry 1990 to March 2000: Entry 1980 to 1989: Entry before 1980:
Naturalized citizen
Not a citizenTotalTotal
Region Naturalized citizen
Not a citizenTotal
Naturalized citizen
Not a citizenTotal
Europe 276 110 49 61 43 35 8 123 87 36Asia 1,510 726 211 515 468 349 119 316 258 58Africa 154 103 0 103 51 11 40 0 0 0Oceania 15 0 0 0 7 7 0 8 8 0Americas: 386 Latin America: 315 Caribbean 0 0 0 0 0 0 0 0 0 0 Central America: 289 Mexico 204 125 0 125 79 32 47 0 0 0 Other Central America 85 4 0 4 29 14 15 52 52 0 South America 26 20 7 13 0 0 0 6 6 0 Northern America 71 25 7 18 0 0 0 46 42 4Born at sea 0 0 0 0 0 0 0 0 0 0
Total 2,341
1995 to March 2000 7231990 to 1994 3901985 to 1989 2981980 to 1984 3791975 to 1979 2341970 to 1974 491965 to 1969 131Before 1965 137
P22. YEAR OF ENTRY FOR THE
Universe: Foreign-born populationFOREIGN-BORN POPULATION
100%
30.9%16.7%12.7%16.2%10.0%2.1%5.6%5.9%
Total 9,317Living in an MSA/PMSA in 2000: 9,317 Same house in 1995: 4,657 Central city of this MSA/PMSA 4,657 Remainder of this MSA/PMSA 0 Different house in 1995: 4,660 In United States in 1995: 4,000 Same MSA/PMSA in 1995: 2,905 Moved within same central city 2,179 Moved between central cities 121 Moved from central city to remainder of MSA 0 Moved from remainder of MSA to central city 605 Moved within remainder of MSA/PMSA 0 Different MSA/PMSA in 1995: 966 Central city in different MSA/PMSA 517 Remainder of different MSA/PMSA 449 Not in an MSA/PMSA in 1995 129
In Puerto Rico in 1995 0 Elsewhere in 1995 660
Not living in an MSA/PMSA in 2000 0
100%100.0%50.0%50.0%0.0%
50.0%42.9%31.2%23.4%1.3%0.0%6.5%0.0%
10.4%5.5%4.8%1.4%
0.0%7.1%
0.0%
PCT22. RESIDENCE IN 1995--MSA/PMSA LEVELUniverse: Population 5 years and over
Total: 9,846
Native: 7,505 Born in state of residence 3,890 Born in other state in the U.S.: 3,510 Northeast 554 Midwest 1,075 South 513 West 1,368 Born outside the United States: 105 Puerto Rico 0 U.S. Island Areas 0 Born abroad of American parent(s) 105Foreign born: 2,341 Naturalized citizen 1,175 Not a citizen 1,166
100%
76.2%39.5%35.6%5.6%
10.9%5.2%
13.9%1.1%0.0%0.0%1.1%
23.8%11.9%11.8%
P21. PLACE OF BIRTH BY CITIZENSHIP STATUSUniverse: Total population
Total: 9,317Same house in 1995 4,657Different house in 1995: 4,660 In United States in 1995: 4,000 Same city or town: 2,179 Same county 2,179 Different county (same state) 0 Not same city or town: 1,821 Same county 505 Different county: 1,316 Same state 502 Different state: 814 Northeast 169 Midwest 101 South 139 West 405 In Puerto Rico in 1995 0 Elsewhere in 1995 660
PCT21. RESIDENCE IN 1995
Universe: Population 5 years and over--STATE, COUNTY, PLACE LEVEL
100%50.0%50.0%42.9%23.4%23.4%0.0%
19.5%5.4%
14.1%5.4%8.7%1.8%1.1%1.5%4.3%0.0%7.1%
Total
Page 21Community Reporting Area LevelHaller Lake
January 2005
Department of Planning and Development with Assistance from Puget Sound Regional Council 9.5
Characteristics of ResidencyCensus 2000, Summary File 3
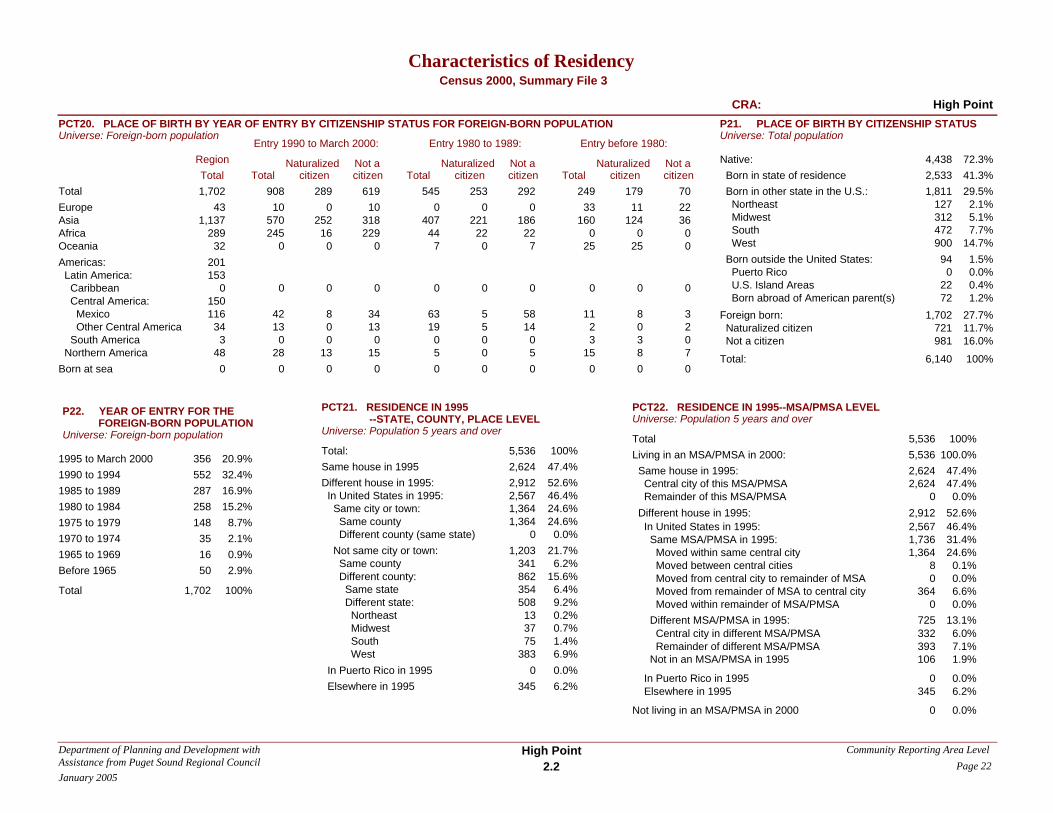
CRA: High Point
1,702 908 289 619 545 253 292 249 179 70
PCT20. PLACE OF BIRTH BY YEAR OF ENTRY BY CITIZENSHIP STATUS FOR FOREIGN-BORN POPULATIONUniverse: Foreign-born population
Entry 1990 to March 2000: Entry 1980 to 1989: Entry before 1980:
Naturalized citizen
Not a citizenTotalTotal
Region Naturalized citizen
Not a citizenTotal
Naturalized citizen
Not a citizenTotal
Europe 43 10 0 10 0 0 0 33 11 22Asia 1,137 570 252 318 407 221 186 160 124 36Africa 289 245 16 229 44 22 22 0 0 0Oceania 32 0 0 0 7 0 7 25 25 0Americas: 201 Latin America: 153 Caribbean 0 0 0 0 0 0 0 0 0 0 Central America: 150 Mexico 116 42 8 34 63 5 58 11 8 3 Other Central America 34 13 0 13 19 5 14 2 0 2 South America 3 0 0 0 0 0 0 3 3 0 Northern America 48 28 13 15 5 0 5 15 8 7Born at sea 0 0 0 0 0 0 0 0 0 0
Total 1,702
1995 to March 2000 3561990 to 1994 5521985 to 1989 2871980 to 1984 2581975 to 1979 1481970 to 1974 351965 to 1969 16Before 1965 50
P22. YEAR OF ENTRY FOR THE
Universe: Foreign-born populationFOREIGN-BORN POPULATION
100%
20.9%32.4%16.9%15.2%8.7%2.1%0.9%2.9%
Total 5,536Living in an MSA/PMSA in 2000: 5,536 Same house in 1995: 2,624 Central city of this MSA/PMSA 2,624 Remainder of this MSA/PMSA 0 Different house in 1995: 2,912 In United States in 1995: 2,567 Same MSA/PMSA in 1995: 1,736 Moved within same central city 1,364 Moved between central cities 8 Moved from central city to remainder of MSA 0 Moved from remainder of MSA to central city 364 Moved within remainder of MSA/PMSA 0 Different MSA/PMSA in 1995: 725 Central city in different MSA/PMSA 332 Remainder of different MSA/PMSA 393 Not in an MSA/PMSA in 1995 106
In Puerto Rico in 1995 0 Elsewhere in 1995 345
Not living in an MSA/PMSA in 2000 0
100%100.0%47.4%47.4%0.0%
52.6%46.4%31.4%24.6%0.1%0.0%6.6%0.0%
13.1%6.0%7.1%1.9%
0.0%6.2%
0.0%
PCT22. RESIDENCE IN 1995--MSA/PMSA LEVELUniverse: Population 5 years and over
Total: 6,140
Native: 4,438 Born in state of residence 2,533 Born in other state in the U.S.: 1,811 Northeast 127 Midwest 312 South 472 West 900 Born outside the United States: 94 Puerto Rico 0 U.S. Island Areas 22 Born abroad of American parent(s) 72Foreign born: 1,702 Naturalized citizen 721 Not a citizen 981
100%
72.3%41.3%29.5%2.1%5.1%7.7%
14.7%1.5%0.0%0.4%1.2%
27.7%11.7%16.0%
P21. PLACE OF BIRTH BY CITIZENSHIP STATUSUniverse: Total population
Total: 5,536Same house in 1995 2,624Different house in 1995: 2,912 In United States in 1995: 2,567 Same city or town: 1,364 Same county 1,364 Different county (same state) 0 Not same city or town: 1,203 Same county 341 Different county: 862 Same state 354 Different state: 508 Northeast 13 Midwest 37 South 75 West 383 In Puerto Rico in 1995 0 Elsewhere in 1995 345
PCT21. RESIDENCE IN 1995
Universe: Population 5 years and over--STATE, COUNTY, PLACE LEVEL
100%47.4%52.6%46.4%24.6%24.6%0.0%
21.7%6.2%
15.6%6.4%9.2%0.2%0.7%1.4%6.9%0.0%6.2%
Total
Page 22Community Reporting Area LevelHigh Point
January 2005
Department of Planning and Development with Assistance from Puget Sound Regional Council 2.2
Characteristics of ResidencyCensus 2000, Summary File 3
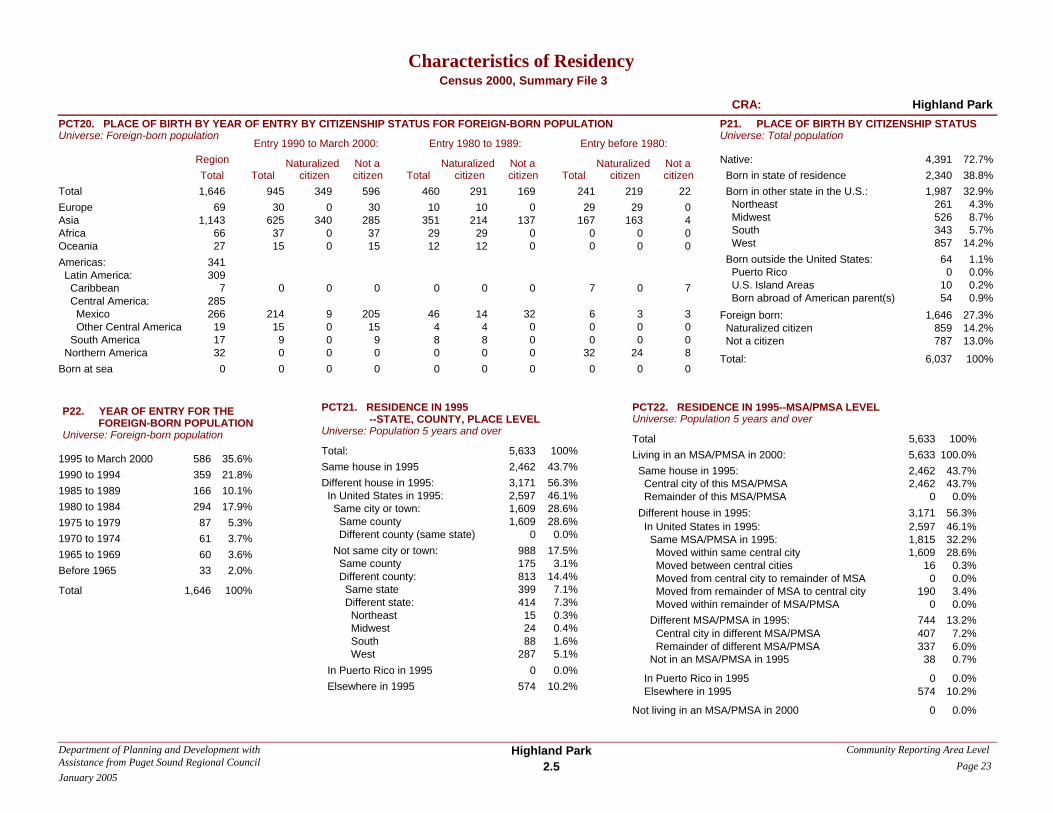
CRA: Highland Park
1,646 945 349 596 460 291 169 241 219 22
PCT20. PLACE OF BIRTH BY YEAR OF ENTRY BY CITIZENSHIP STATUS FOR FOREIGN-BORN POPULATIONUniverse: Foreign-born population
Entry 1990 to March 2000: Entry 1980 to 1989: Entry before 1980:
Naturalized citizen
Not a citizenTotalTotal
Region Naturalized citizen
Not a citizenTotal
Naturalized citizen
Not a citizenTotal
Europe 69 30 0 30 10 10 0 29 29 0Asia 1,143 625 340 285 351 214 137 167 163 4Africa 66 37 0 37 29 29 0 0 0 0Oceania 27 15 0 15 12 12 0 0 0 0Americas: 341 Latin America: 309 Caribbean 7 0 0 0 0 0 0 7 0 7 Central America: 285 Mexico 266 214 9 205 46 14 32 6 3 3 Other Central America 19 15 0 15 4 4 0 0 0 0 South America 17 9 0 9 8 8 0 0 0 0 Northern America 32 0 0 0 0 0 0 32 24 8Born at sea 0 0 0 0 0 0 0 0 0 0
Total 1,646
1995 to March 2000 5861990 to 1994 3591985 to 1989 1661980 to 1984 2941975 to 1979 871970 to 1974 611965 to 1969 60Before 1965 33
P22. YEAR OF ENTRY FOR THE
Universe: Foreign-born populationFOREIGN-BORN POPULATION
100%
35.6%21.8%10.1%17.9%5.3%3.7%3.6%2.0%
Total 5,633Living in an MSA/PMSA in 2000: 5,633 Same house in 1995: 2,462 Central city of this MSA/PMSA 2,462 Remainder of this MSA/PMSA 0 Different house in 1995: 3,171 In United States in 1995: 2,597 Same MSA/PMSA in 1995: 1,815 Moved within same central city 1,609 Moved between central cities 16 Moved from central city to remainder of MSA 0 Moved from remainder of MSA to central city 190 Moved within remainder of MSA/PMSA 0 Different MSA/PMSA in 1995: 744 Central city in different MSA/PMSA 407 Remainder of different MSA/PMSA 337 Not in an MSA/PMSA in 1995 38
In Puerto Rico in 1995 0 Elsewhere in 1995 574
Not living in an MSA/PMSA in 2000 0
100%100.0%43.7%43.7%0.0%
56.3%46.1%32.2%28.6%0.3%0.0%3.4%0.0%
13.2%7.2%6.0%0.7%
0.0%10.2%
0.0%
PCT22. RESIDENCE IN 1995--MSA/PMSA LEVELUniverse: Population 5 years and over
Total: 6,037
Native: 4,391 Born in state of residence 2,340 Born in other state in the U.S.: 1,987 Northeast 261 Midwest 526 South 343 West 857 Born outside the United States: 64 Puerto Rico 0 U.S. Island Areas 10 Born abroad of American parent(s) 54Foreign born: 1,646 Naturalized citizen 859 Not a citizen 787
100%
72.7%38.8%32.9%4.3%8.7%5.7%
14.2%1.1%0.0%0.2%0.9%
27.3%14.2%13.0%
P21. PLACE OF BIRTH BY CITIZENSHIP STATUSUniverse: Total population
Total: 5,633Same house in 1995 2,462Different house in 1995: 3,171 In United States in 1995: 2,597 Same city or town: 1,609 Same county 1,609 Different county (same state) 0 Not same city or town: 988 Same county 175 Different county: 813 Same state 399 Different state: 414 Northeast 15 Midwest 24 South 88 West 287 In Puerto Rico in 1995 0 Elsewhere in 1995 574
PCT21. RESIDENCE IN 1995
Universe: Population 5 years and over--STATE, COUNTY, PLACE LEVEL
100%43.7%56.3%46.1%28.6%28.6%0.0%
17.5%3.1%
14.4%7.1%7.3%0.3%0.4%1.6%5.1%0.0%
10.2%
Total
Page 23Community Reporting Area LevelHighland Park
January 2005
Department of Planning and Development with Assistance from Puget Sound Regional Council 2.5

Characteristics of ResidencyCensus 2000, Summary File 3
CRA: Interbay
1,119 510 87 423 270 87 183 339 195 144
PCT20. PLACE OF BIRTH BY YEAR OF ENTRY BY CITIZENSHIP STATUS FOR FOREIGN-BORN POPULATIONUniverse: Foreign-born population
Entry 1990 to March 2000: Entry 1980 to 1989: Entry before 1980:
Naturalized citizen
Not a citizenTotalTotal
Region Naturalized citizen
Not a citizenTotal
Naturalized citizen
Not a citizenTotal
Europe 404 211 37 174 68 37 31 125 77 48Asia 440 158 39 119 149 38 111 133 79 54Africa 24 14 0 14 0 0 0 10 10 0Oceania 22 22 0 22 0 0 0 0 0 0Americas: 229 Latin America: 160 Caribbean 0 0 0 0 0 0 0 0 0 0 Central America: 149 Mexico 137 84 0 84 41 0 41 12 12 0 Other Central America 12 0 0 0 12 12 0 0 0 0 South America 11 11 11 0 0 0 0 0 0 0 Northern America 69 10 0 10 0 0 0 59 17 42Born at sea 0 0 0 0 0 0 0 0 0 0
Total 1,119
1995 to March 2000 2961990 to 1994 2141985 to 1989 1421980 to 1984 1281975 to 1979 1431970 to 1974 441965 to 1969 24Before 1965 128
P22. YEAR OF ENTRY FOR THE
Universe: Foreign-born populationFOREIGN-BORN POPULATION
100%
26.5%19.1%12.7%11.4%12.8%3.9%2.1%
11.4%
Total 9,070Living in an MSA/PMSA in 2000: 9,070 Same house in 1995: 3,171 Central city of this MSA/PMSA 3,171 Remainder of this MSA/PMSA 0 Different house in 1995: 5,899 In United States in 1995: 5,601 Same MSA/PMSA in 1995: 3,239 Moved within same central city 2,477 Moved between central cities 104 Moved from central city to remainder of MSA 0 Moved from remainder of MSA to central city 658 Moved within remainder of MSA/PMSA 0 Different MSA/PMSA in 1995: 1,935 Central city in different MSA/PMSA 1,287 Remainder of different MSA/PMSA 648 Not in an MSA/PMSA in 1995 427
In Puerto Rico in 1995 15 Elsewhere in 1995 283
Not living in an MSA/PMSA in 2000 0
100%100.0%35.0%35.0%0.0%
65.0%61.8%35.7%27.3%1.1%0.0%7.3%0.0%
21.3%14.2%7.1%4.7%
0.2%3.1%
0.0%
PCT22. RESIDENCE IN 1995--MSA/PMSA LEVELUniverse: Population 5 years and over
Total: 9,360
Native: 8,241 Born in state of residence 3,516 Born in other state in the U.S.: 4,438 Northeast 760 Midwest 1,238 South 668 West 1,772 Born outside the United States: 287 Puerto Rico 25 U.S. Island Areas 10 Born abroad of American parent(s) 252Foreign born: 1,119 Naturalized citizen 369 Not a citizen 750
100%
88.0%37.6%47.4%8.1%
13.2%7.1%
18.9%3.1%0.3%0.1%2.7%
12.0%3.9%8.0%
P21. PLACE OF BIRTH BY CITIZENSHIP STATUSUniverse: Total population
Total: 9,070Same house in 1995 3,171Different house in 1995: 5,899 In United States in 1995: 5,601 Same city or town: 2,477 Same county 2,477 Different county (same state) 0 Not same city or town: 3,124 Same county 533 Different county: 2,591 Same state 594 Different state: 1,997 Northeast 199 Midwest 413 South 386 West 999 In Puerto Rico in 1995 15 Elsewhere in 1995 283
PCT21. RESIDENCE IN 1995
Universe: Population 5 years and over--STATE, COUNTY, PLACE LEVEL
100%35.0%65.0%61.8%27.3%27.3%0.0%
34.4%5.9%
28.6%6.5%
22.0%2.2%4.6%4.3%
11.0%0.2%3.1%
Total
Page 24Community Reporting Area LevelInterbay
January 2005
Department of Planning and Development with Assistance from Puget Sound Regional Council 12.2

Characteristics of ResidencyCensus 2000, Summary File 3
CRA: Judkins Park
951 378 54 324 242 113 129 331 283 48
PCT20. PLACE OF BIRTH BY YEAR OF ENTRY BY CITIZENSHIP STATUS FOR FOREIGN-BORN POPULATIONUniverse: Foreign-born population
Entry 1990 to March 2000: Entry 1980 to 1989: Entry before 1980:
Naturalized citizen
Not a citizenTotalTotal
Region Naturalized citizen
Not a citizenTotal
Naturalized citizen
Not a citizenTotal
Europe 15 4 0 4 0 0 0 11 11 0Asia 606 156 45 111 162 99 63 288 249 39Africa 110 110 9 101 0 0 0 0 0 0Oceania 21 0 0 0 0 0 0 21 16 5Americas: 199 Latin America: 188 Caribbean 20 5 0 5 11 0 11 4 0 4 Central America: 168 Mexico 159 94 0 94 65 10 55 0 0 0 Other Central America 9 9 0 9 0 0 0 0 0 0 South America 0 0 0 0 0 0 0 0 0 0 Northern America 11 0 0 0 4 4 0 7 7 0Born at sea 0 0 0 0 0 0 0 0 0 0
Total 951
1995 to March 2000 1901990 to 1994 1881985 to 1989 1601980 to 1984 821975 to 1979 1431970 to 1974 311965 to 1969 89Before 1965 68
P22. YEAR OF ENTRY FOR THE
Universe: Foreign-born populationFOREIGN-BORN POPULATION
100%
20.0%19.8%16.8%8.6%
15.0%3.3%9.4%7.2%
Total 2,090Living in an MSA/PMSA in 2000: 2,090 Same house in 1995: 994 Central city of this MSA/PMSA 994 Remainder of this MSA/PMSA 0 Different house in 1995: 1,096 In United States in 1995: 915 Same MSA/PMSA in 1995: 682 Moved within same central city 620 Moved between central cities 17 Moved from central city to remainder of MSA 0 Moved from remainder of MSA to central city 45 Moved within remainder of MSA/PMSA 0 Different MSA/PMSA in 1995: 221 Central city in different MSA/PMSA 181 Remainder of different MSA/PMSA 40 Not in an MSA/PMSA in 1995 12
In Puerto Rico in 1995 0 Elsewhere in 1995 181
Not living in an MSA/PMSA in 2000 0
100%100.0%47.6%47.6%0.0%
52.4%43.8%32.6%29.7%0.8%0.0%2.2%0.0%
10.6%8.7%1.9%0.6%
0.0%8.7%
0.0%
PCT22. RESIDENCE IN 1995--MSA/PMSA LEVELUniverse: Population 5 years and over
Total: 2,185
Native: 1,234 Born in state of residence 659 Born in other state in the U.S.: 542 Northeast 27 Midwest 142 South 216 West 157 Born outside the United States: 33 Puerto Rico 9 U.S. Island Areas 14 Born abroad of American parent(s) 10Foreign born: 951 Naturalized citizen 450 Not a citizen 501
100%
56.5%30.2%24.8%1.2%6.5%9.9%7.2%1.5%0.4%0.6%0.5%
43.5%20.6%22.9%
P21. PLACE OF BIRTH BY CITIZENSHIP STATUSUniverse: Total population
Total: 2,090Same house in 1995 994Different house in 1995: 1,096 In United States in 1995: 915 Same city or town: 620 Same county 620 Different county (same state) 0 Not same city or town: 295 Same county 51 Different county: 244 Same state 45 Different state: 199 Northeast 19 Midwest 32 South 19 West 129 In Puerto Rico in 1995 0 Elsewhere in 1995 181
PCT21. RESIDENCE IN 1995
Universe: Population 5 years and over--STATE, COUNTY, PLACE LEVEL
100%47.6%52.4%43.8%29.7%29.7%0.0%
14.1%2.4%
11.7%2.2%9.5%0.9%1.5%0.9%6.2%0.0%8.7%
Total
Page 25Community Reporting Area LevelJudkins Park
January 2005
Department of Planning and Development with Assistance from Puget Sound Regional Council 5.2
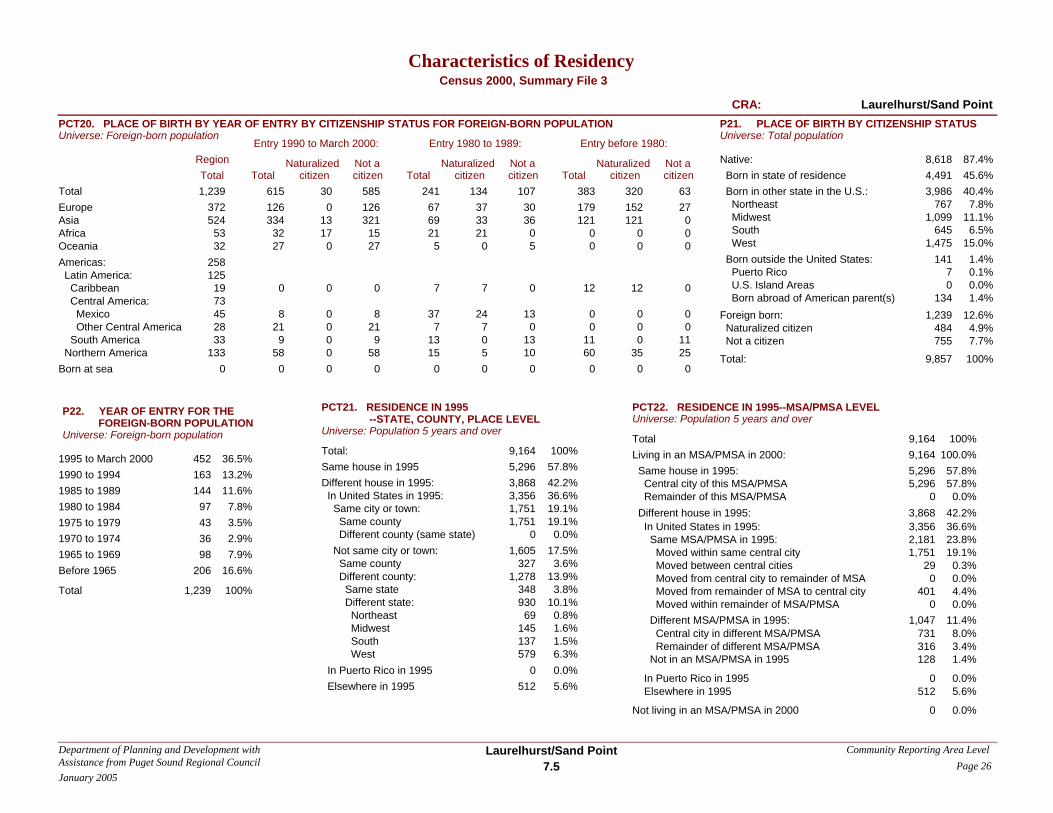
Characteristics of ResidencyCensus 2000, Summary File 3
CRA: Laurelhurst/Sand Point
1,239 615 30 585 241 134 107 383 320 63
PCT20. PLACE OF BIRTH BY YEAR OF ENTRY BY CITIZENSHIP STATUS FOR FOREIGN-BORN POPULATIONUniverse: Foreign-born population
Entry 1990 to March 2000: Entry 1980 to 1989: Entry before 1980:
Naturalized citizen
Not a citizenTotalTotal
Region Naturalized citizen
Not a citizenTotal
Naturalized citizen
Not a citizenTotal
Europe 372 126 0 126 67 37 30 179 152 27Asia 524 334 13 321 69 33 36 121 121 0Africa 53 32 17 15 21 21 0 0 0 0Oceania 32 27 0 27 5 0 5 0 0 0Americas: 258 Latin America: 125 Caribbean 19 0 0 0 7 7 0 12 12 0 Central America: 73 Mexico 45 8 0 8 37 24 13 0 0 0 Other Central America 28 21 0 21 7 7 0 0 0 0 South America 33 9 0 9 13 0 13 11 0 11 Northern America 133 58 0 58 15 5 10 60 35 25Born at sea 0 0 0 0 0 0 0 0 0 0
Total 1,239
1995 to March 2000 4521990 to 1994 1631985 to 1989 1441980 to 1984 971975 to 1979 431970 to 1974 361965 to 1969 98Before 1965 206
P22. YEAR OF ENTRY FOR THE
Universe: Foreign-born populationFOREIGN-BORN POPULATION
100%
36.5%13.2%11.6%7.8%3.5%2.9%7.9%
16.6%
Total 9,164Living in an MSA/PMSA in 2000: 9,164 Same house in 1995: 5,296 Central city of this MSA/PMSA 5,296 Remainder of this MSA/PMSA 0 Different house in 1995: 3,868 In United States in 1995: 3,356 Same MSA/PMSA in 1995: 2,181 Moved within same central city 1,751 Moved between central cities 29 Moved from central city to remainder of MSA 0 Moved from remainder of MSA to central city 401 Moved within remainder of MSA/PMSA 0 Different MSA/PMSA in 1995: 1,047 Central city in different MSA/PMSA 731 Remainder of different MSA/PMSA 316 Not in an MSA/PMSA in 1995 128
In Puerto Rico in 1995 0 Elsewhere in 1995 512
Not living in an MSA/PMSA in 2000 0
100%100.0%57.8%57.8%0.0%
42.2%36.6%23.8%19.1%0.3%0.0%4.4%0.0%
11.4%8.0%3.4%1.4%
0.0%5.6%
0.0%
PCT22. RESIDENCE IN 1995--MSA/PMSA LEVELUniverse: Population 5 years and over
Total: 9,857
Native: 8,618 Born in state of residence 4,491 Born in other state in the U.S.: 3,986 Northeast 767 Midwest 1,099 South 645 West 1,475 Born outside the United States: 141 Puerto Rico 7 U.S. Island Areas 0 Born abroad of American parent(s) 134Foreign born: 1,239 Naturalized citizen 484 Not a citizen 755
100%
87.4%45.6%40.4%7.8%
11.1%6.5%
15.0%1.4%0.1%0.0%1.4%
12.6%4.9%7.7%
P21. PLACE OF BIRTH BY CITIZENSHIP STATUSUniverse: Total population
Total: 9,164Same house in 1995 5,296Different house in 1995: 3,868 In United States in 1995: 3,356 Same city or town: 1,751 Same county 1,751 Different county (same state) 0 Not same city or town: 1,605 Same county 327 Different county: 1,278 Same state 348 Different state: 930 Northeast 69 Midwest 145 South 137 West 579 In Puerto Rico in 1995 0 Elsewhere in 1995 512
PCT21. RESIDENCE IN 1995
Universe: Population 5 years and over--STATE, COUNTY, PLACE LEVEL
100%57.8%42.2%36.6%19.1%19.1%0.0%
17.5%3.6%
13.9%3.8%
10.1%0.8%1.6%1.5%6.3%0.0%5.6%
Total
Page 26Community Reporting Area LevelLaurelhurst/Sand Point
January 2005
Department of Planning and Development with Assistance from Puget Sound Regional Council 7.5

Characteristics of ResidencyCensus 2000, Summary File 3
CRA: Licton Springs
1,781 1,000 121 879 362 264 98 419 303 116
PCT20. PLACE OF BIRTH BY YEAR OF ENTRY BY CITIZENSHIP STATUS FOR FOREIGN-BORN POPULATIONUniverse: Foreign-born population
Entry 1990 to March 2000: Entry 1980 to 1989: Entry before 1980:
Naturalized citizen
Not a citizenTotalTotal
Region Naturalized citizen
Not a citizenTotal
Naturalized citizen
Not a citizenTotal
Europe 309 177 17 160 61 35 26 71 55 16Asia 849 489 57 432 190 169 21 170 115 55Africa 195 117 34 83 78 30 48 0 0 0Oceania 6 0 0 0 0 0 0 6 6 0Americas: 422 Latin America: 321 Caribbean 0 0 0 0 0 0 0 0 0 0 Central America: 232 Mexico 174 138 0 138 9 9 0 27 7 20 Other Central America 58 9 0 9 24 21 3 25 5 20 South America 89 55 13 42 0 0 0 34 34 0 Northern America 101 15 0 15 0 0 0 86 81 5Born at sea 0 0 0 0 0 0 0 0 0 0
Total 1,781
1995 to March 2000 7081990 to 1994 2921985 to 1989 2201980 to 1984 1421975 to 1979 1461970 to 1974 581965 to 1969 76Before 1965 139
P22. YEAR OF ENTRY FOR THE
Universe: Foreign-born populationFOREIGN-BORN POPULATION
100%
39.8%16.4%12.4%8.0%8.2%3.3%4.3%7.8%
Total 7,800Living in an MSA/PMSA in 2000: 7,800 Same house in 1995: 2,648 Central city of this MSA/PMSA 2,648 Remainder of this MSA/PMSA 0 Different house in 1995: 5,152 In United States in 1995: 4,391 Same MSA/PMSA in 1995: 2,730 Moved within same central city 2,111 Moved between central cities 88 Moved from central city to remainder of MSA 0 Moved from remainder of MSA to central city 531 Moved within remainder of MSA/PMSA 0 Different MSA/PMSA in 1995: 1,333 Central city in different MSA/PMSA 793 Remainder of different MSA/PMSA 540 Not in an MSA/PMSA in 1995 328
In Puerto Rico in 1995 0 Elsewhere in 1995 761
Not living in an MSA/PMSA in 2000 0
100%100.0%33.9%33.9%0.0%
66.1%56.3%35.0%27.1%1.1%0.0%6.8%0.0%
17.1%10.2%6.9%4.2%
0.0%9.8%
0.0%
PCT22. RESIDENCE IN 1995--MSA/PMSA LEVELUniverse: Population 5 years and over
Total: 8,174
Native: 6,393 Born in state of residence 3,215 Born in other state in the U.S.: 2,908 Northeast 451 Midwest 791 South 420 West 1,246 Born outside the United States: 270 Puerto Rico 9 U.S. Island Areas 46 Born abroad of American parent(s) 215Foreign born: 1,781 Naturalized citizen 688 Not a citizen 1,093
100%
78.2%39.3%35.6%5.5%9.7%5.1%
15.2%3.3%0.1%0.6%2.6%
21.8%8.4%
13.4%
P21. PLACE OF BIRTH BY CITIZENSHIP STATUSUniverse: Total population
Total: 7,800Same house in 1995 2,648Different house in 1995: 5,152 In United States in 1995: 4,391 Same city or town: 2,111 Same county 2,111 Different county (same state) 0 Not same city or town: 2,280 Same county 460 Different county: 1,820 Same state 698 Different state: 1,122 Northeast 162 Midwest 141 South 175 West 644 In Puerto Rico in 1995 0 Elsewhere in 1995 761
PCT21. RESIDENCE IN 1995
Universe: Population 5 years and over--STATE, COUNTY, PLACE LEVEL
100%33.9%66.1%56.3%27.1%27.1%0.0%
29.2%5.9%
23.3%8.9%
14.4%2.1%1.8%2.2%8.3%0.0%9.8%
Total
Page 27Community Reporting Area LevelLicton Springs
January 2005
Department of Planning and Development with Assistance from Puget Sound Regional Council 9.2
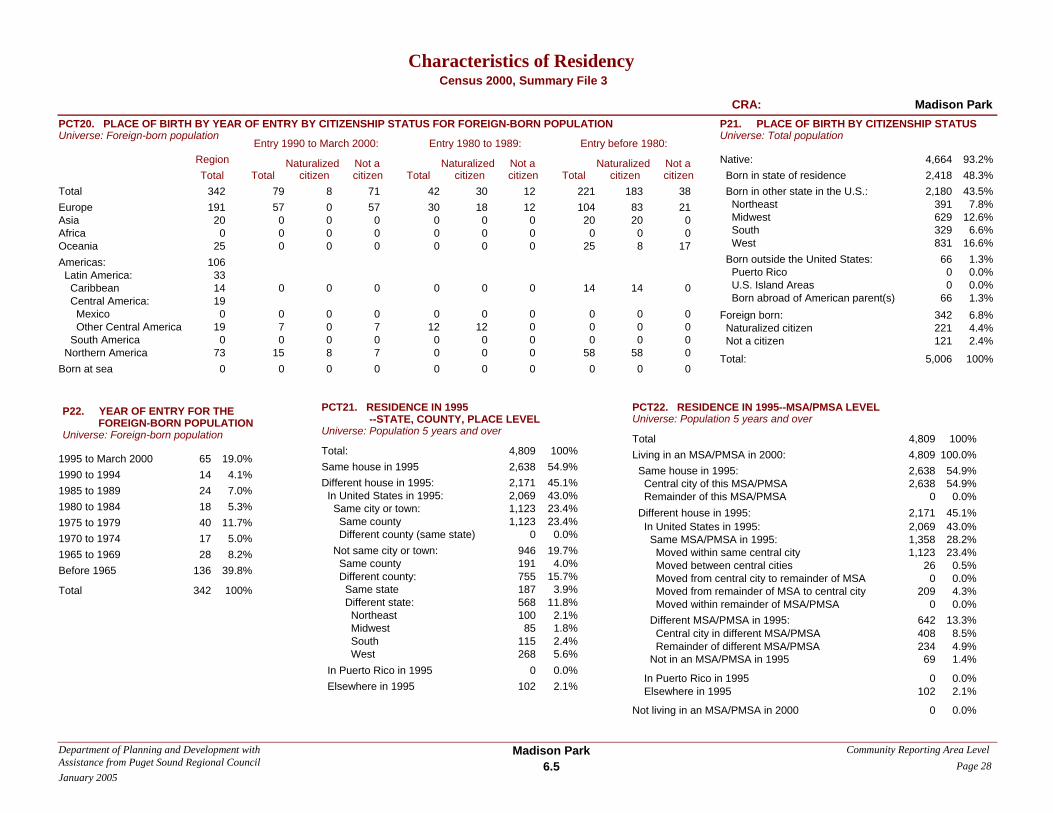
Characteristics of ResidencyCensus 2000, Summary File 3
CRA: Madison Park
342 79 8 71 42 30 12 221 183 38
PCT20. PLACE OF BIRTH BY YEAR OF ENTRY BY CITIZENSHIP STATUS FOR FOREIGN-BORN POPULATIONUniverse: Foreign-born population
Entry 1990 to March 2000: Entry 1980 to 1989: Entry before 1980:
Naturalized citizen
Not a citizenTotalTotal
Region Naturalized citizen
Not a citizenTotal
Naturalized citizen
Not a citizenTotal
Europe 191 57 0 57 30 18 12 104 83 21Asia 20 0 0 0 0 0 0 20 20 0Africa 0 0 0 0 0 0 0 0 0 0Oceania 25 0 0 0 0 0 0 25 8 17Americas: 106 Latin America: 33 Caribbean 14 0 0 0 0 0 0 14 14 0 Central America: 19 Mexico 0 0 0 0 0 0 0 0 0 0 Other Central America 19 7 0 7 12 12 0 0 0 0 South America 0 0 0 0 0 0 0 0 0 0 Northern America 73 15 8 7 0 0 0 58 58 0Born at sea 0 0 0 0 0 0 0 0 0 0
Total 342
1995 to March 2000 651990 to 1994 141985 to 1989 241980 to 1984 181975 to 1979 401970 to 1974 171965 to 1969 28Before 1965 136
P22. YEAR OF ENTRY FOR THE
Universe: Foreign-born populationFOREIGN-BORN POPULATION
100%
19.0%4.1%7.0%5.3%
11.7%5.0%8.2%
39.8%
Total 4,809Living in an MSA/PMSA in 2000: 4,809 Same house in 1995: 2,638 Central city of this MSA/PMSA 2,638 Remainder of this MSA/PMSA 0 Different house in 1995: 2,171 In United States in 1995: 2,069 Same MSA/PMSA in 1995: 1,358 Moved within same central city 1,123 Moved between central cities 26 Moved from central city to remainder of MSA 0 Moved from remainder of MSA to central city 209 Moved within remainder of MSA/PMSA 0 Different MSA/PMSA in 1995: 642 Central city in different MSA/PMSA 408 Remainder of different MSA/PMSA 234 Not in an MSA/PMSA in 1995 69
In Puerto Rico in 1995 0 Elsewhere in 1995 102
Not living in an MSA/PMSA in 2000 0
100%100.0%54.9%54.9%0.0%
45.1%43.0%28.2%23.4%0.5%0.0%4.3%0.0%
13.3%8.5%4.9%1.4%
0.0%2.1%
0.0%
PCT22. RESIDENCE IN 1995--MSA/PMSA LEVELUniverse: Population 5 years and over
Total: 5,006
Native: 4,664 Born in state of residence 2,418 Born in other state in the U.S.: 2,180 Northeast 391 Midwest 629 South 329 West 831 Born outside the United States: 66 Puerto Rico 0 U.S. Island Areas 0 Born abroad of American parent(s) 66Foreign born: 342 Naturalized citizen 221 Not a citizen 121
100%
93.2%48.3%43.5%7.8%
12.6%6.6%
16.6%1.3%0.0%0.0%1.3%6.8%4.4%2.4%
P21. PLACE OF BIRTH BY CITIZENSHIP STATUSUniverse: Total population
Total: 4,809Same house in 1995 2,638Different house in 1995: 2,171 In United States in 1995: 2,069 Same city or town: 1,123 Same county 1,123 Different county (same state) 0 Not same city or town: 946 Same county 191 Different county: 755 Same state 187 Different state: 568 Northeast 100 Midwest 85 South 115 West 268 In Puerto Rico in 1995 0 Elsewhere in 1995 102
PCT21. RESIDENCE IN 1995
Universe: Population 5 years and over--STATE, COUNTY, PLACE LEVEL
100%54.9%45.1%43.0%23.4%23.4%0.0%
19.7%4.0%
15.7%3.9%
11.8%2.1%1.8%2.4%5.6%0.0%2.1%
Total
Page 28Community Reporting Area LevelMadison Park
January 2005
Department of Planning and Development with Assistance from Puget Sound Regional Council 6.5
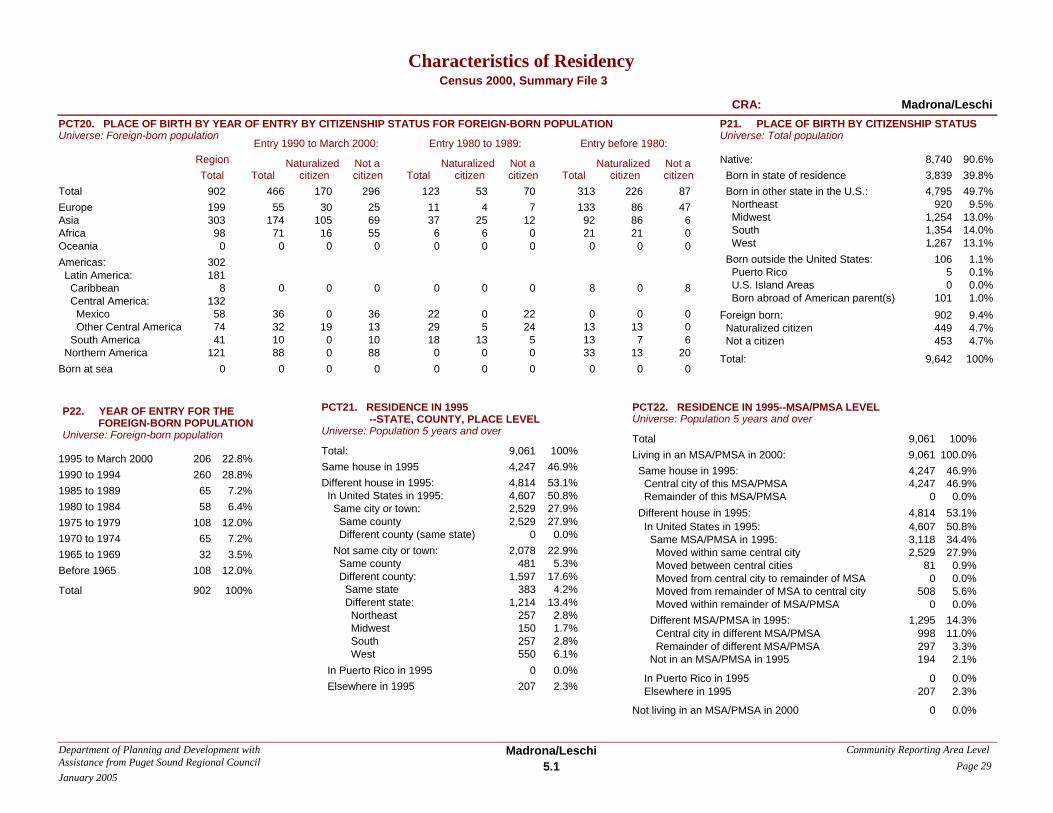
Characteristics of ResidencyCensus 2000, Summary File 3
CRA: Madrona/Leschi
902 466 170 296 123 53 70 313 226 87
PCT20. PLACE OF BIRTH BY YEAR OF ENTRY BY CITIZENSHIP STATUS FOR FOREIGN-BORN POPULATIONUniverse: Foreign-born population
Entry 1990 to March 2000: Entry 1980 to 1989: Entry before 1980:
Naturalized citizen
Not a citizenTotalTotal
Region Naturalized citizen
Not a citizenTotal
Naturalized citizen
Not a citizenTotal
Europe 199 55 30 25 11 4 7 133 86 47Asia 303 174 105 69 37 25 12 92 86 6Africa 98 71 16 55 6 6 0 21 21 0Oceania 0 0 0 0 0 0 0 0 0 0Americas: 302 Latin America: 181 Caribbean 8 0 0 0 0 0 0 8 0 8 Central America: 132 Mexico 58 36 0 36 22 0 22 0 0 0 Other Central America 74 32 19 13 29 5 24 13 13 0 South America 41 10 0 10 18 13 5 13 7 6 Northern America 121 88 0 88 0 0 0 33 13 20Born at sea 0 0 0 0 0 0 0 0 0 0
Total 902
1995 to March 2000 2061990 to 1994 2601985 to 1989 651980 to 1984 581975 to 1979 1081970 to 1974 651965 to 1969 32Before 1965 108
P22. YEAR OF ENTRY FOR THE
Universe: Foreign-born populationFOREIGN-BORN POPULATION
100%
22.8%28.8%7.2%6.4%
12.0%7.2%3.5%
12.0%
Total 9,061Living in an MSA/PMSA in 2000: 9,061 Same house in 1995: 4,247 Central city of this MSA/PMSA 4,247 Remainder of this MSA/PMSA 0 Different house in 1995: 4,814 In United States in 1995: 4,607 Same MSA/PMSA in 1995: 3,118 Moved within same central city 2,529 Moved between central cities 81 Moved from central city to remainder of MSA 0 Moved from remainder of MSA to central city 508 Moved within remainder of MSA/PMSA 0 Different MSA/PMSA in 1995: 1,295 Central city in different MSA/PMSA 998 Remainder of different MSA/PMSA 297 Not in an MSA/PMSA in 1995 194
In Puerto Rico in 1995 0 Elsewhere in 1995 207
Not living in an MSA/PMSA in 2000 0
100%100.0%46.9%46.9%0.0%
53.1%50.8%34.4%27.9%0.9%0.0%5.6%0.0%
14.3%11.0%3.3%2.1%
0.0%2.3%
0.0%
PCT22. RESIDENCE IN 1995--MSA/PMSA LEVELUniverse: Population 5 years and over
Total: 9,642
Native: 8,740 Born in state of residence 3,839 Born in other state in the U.S.: 4,795 Northeast 920 Midwest 1,254 South 1,354 West 1,267 Born outside the United States: 106 Puerto Rico 5 U.S. Island Areas 0 Born abroad of American parent(s) 101Foreign born: 902 Naturalized citizen 449 Not a citizen 453
100%
90.6%39.8%49.7%9.5%
13.0%14.0%13.1%1.1%0.1%0.0%1.0%9.4%4.7%4.7%
P21. PLACE OF BIRTH BY CITIZENSHIP STATUSUniverse: Total population
Total: 9,061Same house in 1995 4,247Different house in 1995: 4,814 In United States in 1995: 4,607 Same city or town: 2,529 Same county 2,529 Different county (same state) 0 Not same city or town: 2,078 Same county 481 Different county: 1,597 Same state 383 Different state: 1,214 Northeast 257 Midwest 150 South 257 West 550 In Puerto Rico in 1995 0 Elsewhere in 1995 207
PCT21. RESIDENCE IN 1995
Universe: Population 5 years and over--STATE, COUNTY, PLACE LEVEL
100%46.9%53.1%50.8%27.9%27.9%0.0%
22.9%5.3%
17.6%4.2%
13.4%2.8%1.7%2.8%6.1%0.0%2.3%
Total
Page 29Community Reporting Area LevelMadrona/Leschi
January 2005
Department of Planning and Development with Assistance from Puget Sound Regional Council 5.1
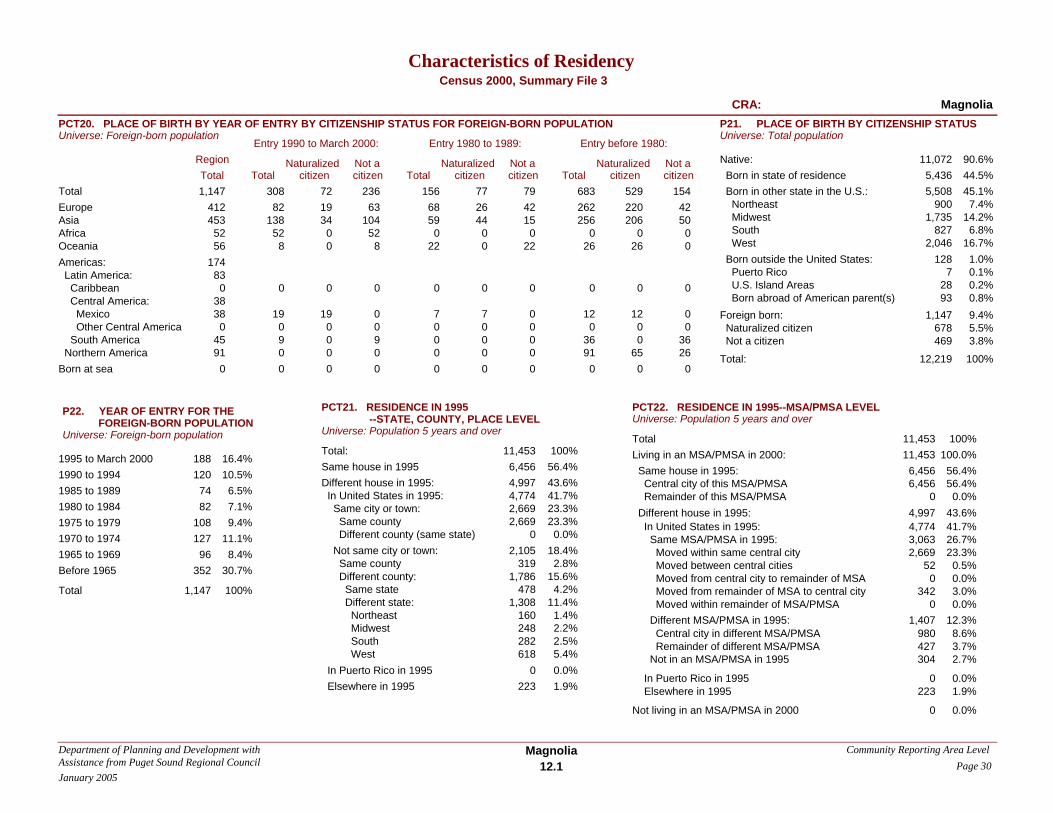
Characteristics of ResidencyCensus 2000, Summary File 3
CRA: Magnolia
1,147 308 72 236 156 77 79 683 529 154
PCT20. PLACE OF BIRTH BY YEAR OF ENTRY BY CITIZENSHIP STATUS FOR FOREIGN-BORN POPULATIONUniverse: Foreign-born population
Entry 1990 to March 2000: Entry 1980 to 1989: Entry before 1980:
Naturalized citizen
Not a citizenTotalTotal
Region Naturalized citizen
Not a citizenTotal
Naturalized citizen
Not a citizenTotal
Europe 412 82 19 63 68 26 42 262 220 42Asia 453 138 34 104 59 44 15 256 206 50Africa 52 52 0 52 0 0 0 0 0 0Oceania 56 8 0 8 22 0 22 26 26 0Americas: 174 Latin America: 83 Caribbean 0 0 0 0 0 0 0 0 0 0 Central America: 38 Mexico 38 19 19 0 7 7 0 12 12 0 Other Central America 0 0 0 0 0 0 0 0 0 0 South America 45 9 0 9 0 0 0 36 0 36 Northern America 91 0 0 0 0 0 0 91 65 26Born at sea 0 0 0 0 0 0 0 0 0 0
Total 1,147
1995 to March 2000 1881990 to 1994 1201985 to 1989 741980 to 1984 821975 to 1979 1081970 to 1974 1271965 to 1969 96Before 1965 352
P22. YEAR OF ENTRY FOR THE
Universe: Foreign-born populationFOREIGN-BORN POPULATION
100%
16.4%10.5%6.5%7.1%9.4%
11.1%8.4%
30.7%
Total 11,453Living in an MSA/PMSA in 2000: 11,453 Same house in 1995: 6,456 Central city of this MSA/PMSA 6,456 Remainder of this MSA/PMSA 0 Different house in 1995: 4,997 In United States in 1995: 4,774 Same MSA/PMSA in 1995: 3,063 Moved within same central city 2,669 Moved between central cities 52 Moved from central city to remainder of MSA 0 Moved from remainder of MSA to central city 342 Moved within remainder of MSA/PMSA 0 Different MSA/PMSA in 1995: 1,407 Central city in different MSA/PMSA 980 Remainder of different MSA/PMSA 427 Not in an MSA/PMSA in 1995 304
In Puerto Rico in 1995 0 Elsewhere in 1995 223
Not living in an MSA/PMSA in 2000 0
100%100.0%56.4%56.4%0.0%
43.6%41.7%26.7%23.3%0.5%0.0%3.0%0.0%
12.3%8.6%3.7%2.7%
0.0%1.9%
0.0%
PCT22. RESIDENCE IN 1995--MSA/PMSA LEVELUniverse: Population 5 years and over
Total: 12,219
Native: 11,072 Born in state of residence 5,436 Born in other state in the U.S.: 5,508 Northeast 900 Midwest 1,735 South 827 West 2,046 Born outside the United States: 128 Puerto Rico 7 U.S. Island Areas 28 Born abroad of American parent(s) 93Foreign born: 1,147 Naturalized citizen 678 Not a citizen 469
100%
90.6%44.5%45.1%7.4%
14.2%6.8%
16.7%1.0%0.1%0.2%0.8%9.4%5.5%3.8%
P21. PLACE OF BIRTH BY CITIZENSHIP STATUSUniverse: Total population
Total: 11,453Same house in 1995 6,456Different house in 1995: 4,997 In United States in 1995: 4,774 Same city or town: 2,669 Same county 2,669 Different county (same state) 0 Not same city or town: 2,105 Same county 319 Different county: 1,786 Same state 478 Different state: 1,308 Northeast 160 Midwest 248 South 282 West 618 In Puerto Rico in 1995 0 Elsewhere in 1995 223
PCT21. RESIDENCE IN 1995
Universe: Population 5 years and over--STATE, COUNTY, PLACE LEVEL
100%56.4%43.6%41.7%23.3%23.3%0.0%
18.4%2.8%
15.6%4.2%
11.4%1.4%2.2%2.5%5.4%0.0%1.9%
Total
Page 30Community Reporting Area LevelMagnolia
January 2005
Department of Planning and Development with Assistance from Puget Sound Regional Council 12.1

Characteristics of ResidencyCensus 2000, Summary File 3
CRA: Miller Park
482 185 38 147 82 40 42 215 162 53
PCT20. PLACE OF BIRTH BY YEAR OF ENTRY BY CITIZENSHIP STATUS FOR FOREIGN-BORN POPULATIONUniverse: Foreign-born population
Entry 1990 to March 2000: Entry 1980 to 1989: Entry before 1980:
Naturalized citizen
Not a citizenTotalTotal
Region Naturalized citizen
Not a citizenTotal
Naturalized citizen
Not a citizenTotal
Europe 154 56 0 56 10 4 6 88 69 19Asia 141 67 26 41 41 36 5 33 30 3Africa 38 27 0 27 11 0 11 0 0 0Oceania 18 11 0 11 0 0 0 7 0 7Americas: 131 Latin America: 62 Caribbean 15 5 5 0 0 0 0 10 0 10 Central America: 37 Mexico 14 0 0 0 8 0 8 6 0 6 Other Central America 23 7 7 0 0 0 0 16 16 0 South America 10 0 0 0 0 0 0 10 10 0 Northern America 69 12 0 12 12 0 12 45 37 8Born at sea 0 0 0 0 0 0 0 0 0 0
Total 482
1995 to March 2000 1391990 to 1994 461985 to 1989 281980 to 1984 541975 to 1979 491970 to 1974 231965 to 1969 11Before 1965 132
P22. YEAR OF ENTRY FOR THE
Universe: Foreign-born populationFOREIGN-BORN POPULATION
100%
28.8%9.5%5.8%
11.2%10.2%4.8%2.3%
27.4%
Total 6,208Living in an MSA/PMSA in 2000: 6,208 Same house in 1995: 2,711 Central city of this MSA/PMSA 2,711 Remainder of this MSA/PMSA 0 Different house in 1995: 3,497 In United States in 1995: 3,371 Same MSA/PMSA in 1995: 2,006 Moved within same central city 1,766 Moved between central cities 39 Moved from central city to remainder of MSA 0 Moved from remainder of MSA to central city 201 Moved within remainder of MSA/PMSA 0 Different MSA/PMSA in 1995: 1,245 Central city in different MSA/PMSA 903 Remainder of different MSA/PMSA 342 Not in an MSA/PMSA in 1995 120
In Puerto Rico in 1995 0 Elsewhere in 1995 126
Not living in an MSA/PMSA in 2000 0
100%100.0%43.7%43.7%0.0%
56.3%54.3%32.3%28.4%0.6%0.0%3.2%0.0%
20.1%14.5%5.5%1.9%
0.0%2.0%
0.0%
PCT22. RESIDENCE IN 1995--MSA/PMSA LEVELUniverse: Population 5 years and over
Total: 6,462
Native: 5,980 Born in state of residence 2,250 Born in other state in the U.S.: 3,656 Northeast 849 Midwest 804 South 791 West 1,212 Born outside the United States: 74 Puerto Rico 0 U.S. Island Areas 0 Born abroad of American parent(s) 74Foreign born: 482 Naturalized citizen 240 Not a citizen 242
100%
92.5%34.8%56.6%13.1%12.4%12.2%18.8%1.1%0.0%0.0%1.1%7.5%3.7%3.7%
P21. PLACE OF BIRTH BY CITIZENSHIP STATUSUniverse: Total population
Total: 6,208Same house in 1995 2,711Different house in 1995: 3,497 In United States in 1995: 3,371 Same city or town: 1,766 Same county 1,766 Different county (same state) 0 Not same city or town: 1,605 Same county 166 Different county: 1,439 Same state 221 Different state: 1,218 Northeast 230 Midwest 191 South 275 West 522 In Puerto Rico in 1995 0 Elsewhere in 1995 126
PCT21. RESIDENCE IN 1995
Universe: Population 5 years and over--STATE, COUNTY, PLACE LEVEL
100%43.7%56.3%54.3%28.4%28.4%0.0%
25.9%2.7%
23.2%3.6%
19.6%3.7%3.1%4.4%8.4%0.0%2.0%
Total
Page 31Community Reporting Area LevelMiller Park
January 2005
Department of Planning and Development with Assistance from Puget Sound Regional Council 6.4
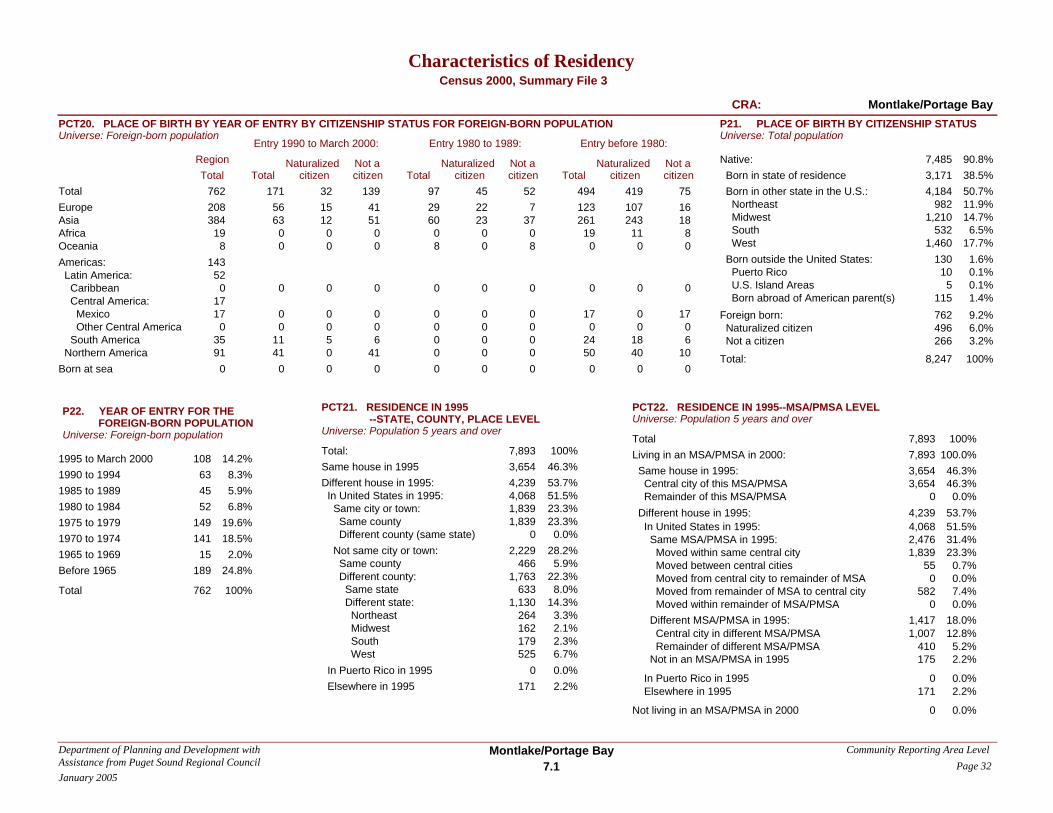
Characteristics of ResidencyCensus 2000, Summary File 3
CRA: Montlake/Portage Bay
762 171 32 139 97 45 52 494 419 75
PCT20. PLACE OF BIRTH BY YEAR OF ENTRY BY CITIZENSHIP STATUS FOR FOREIGN-BORN POPULATIONUniverse: Foreign-born population
Entry 1990 to March 2000: Entry 1980 to 1989: Entry before 1980:
Naturalized citizen
Not a citizenTotalTotal
Region Naturalized citizen
Not a citizenTotal
Naturalized citizen
Not a citizenTotal
Europe 208 56 15 41 29 22 7 123 107 16Asia 384 63 12 51 60 23 37 261 243 18Africa 19 0 0 0 0 0 0 19 11 8Oceania 8 0 0 0 8 0 8 0 0 0Americas: 143 Latin America: 52 Caribbean 0 0 0 0 0 0 0 0 0 0 Central America: 17 Mexico 17 0 0 0 0 0 0 17 0 17 Other Central America 0 0 0 0 0 0 0 0 0 0 South America 35 11 5 6 0 0 0 24 18 6 Northern America 91 41 0 41 0 0 0 50 40 10Born at sea 0 0 0 0 0 0 0 0 0 0
Total 762
1995 to March 2000 1081990 to 1994 631985 to 1989 451980 to 1984 521975 to 1979 1491970 to 1974 1411965 to 1969 15Before 1965 189
P22. YEAR OF ENTRY FOR THE
Universe: Foreign-born populationFOREIGN-BORN POPULATION
100%
14.2%8.3%5.9%6.8%
19.6%18.5%2.0%
24.8%
Total 7,893Living in an MSA/PMSA in 2000: 7,893 Same house in 1995: 3,654 Central city of this MSA/PMSA 3,654 Remainder of this MSA/PMSA 0 Different house in 1995: 4,239 In United States in 1995: 4,068 Same MSA/PMSA in 1995: 2,476 Moved within same central city 1,839 Moved between central cities 55 Moved from central city to remainder of MSA 0 Moved from remainder of MSA to central city 582 Moved within remainder of MSA/PMSA 0 Different MSA/PMSA in 1995: 1,417 Central city in different MSA/PMSA 1,007 Remainder of different MSA/PMSA 410 Not in an MSA/PMSA in 1995 175
In Puerto Rico in 1995 0 Elsewhere in 1995 171
Not living in an MSA/PMSA in 2000 0
100%100.0%46.3%46.3%0.0%
53.7%51.5%31.4%23.3%0.7%0.0%7.4%0.0%
18.0%12.8%5.2%2.2%
0.0%2.2%
0.0%
PCT22. RESIDENCE IN 1995--MSA/PMSA LEVELUniverse: Population 5 years and over
Total: 8,247
Native: 7,485 Born in state of residence 3,171 Born in other state in the U.S.: 4,184 Northeast 982 Midwest 1,210 South 532 West 1,460 Born outside the United States: 130 Puerto Rico 10 U.S. Island Areas 5 Born abroad of American parent(s) 115Foreign born: 762 Naturalized citizen 496 Not a citizen 266
100%
90.8%38.5%50.7%11.9%14.7%6.5%
17.7%1.6%0.1%0.1%1.4%9.2%6.0%3.2%
P21. PLACE OF BIRTH BY CITIZENSHIP STATUSUniverse: Total population
Total: 7,893Same house in 1995 3,654Different house in 1995: 4,239 In United States in 1995: 4,068 Same city or town: 1,839 Same county 1,839 Different county (same state) 0 Not same city or town: 2,229 Same county 466 Different county: 1,763 Same state 633 Different state: 1,130 Northeast 264 Midwest 162 South 179 West 525 In Puerto Rico in 1995 0 Elsewhere in 1995 171
PCT21. RESIDENCE IN 1995
Universe: Population 5 years and over--STATE, COUNTY, PLACE LEVEL
100%46.3%53.7%51.5%23.3%23.3%0.0%
28.2%5.9%
22.3%8.0%
14.3%3.3%2.1%2.3%6.7%0.0%2.2%
Total
Page 32Community Reporting Area LevelMontlake/Portage Bay
January 2005
Department of Planning and Development with Assistance from Puget Sound Regional Council 7.1

Characteristics of ResidencyCensus 2000, Summary File 3
CRA: Mt. Baker/North Rainier
911 425 151 274 351 173 178 135 103 32
PCT20. PLACE OF BIRTH BY YEAR OF ENTRY BY CITIZENSHIP STATUS FOR FOREIGN-BORN POPULATIONUniverse: Foreign-born population
Entry 1990 to March 2000: Entry 1980 to 1989: Entry before 1980:
Naturalized citizen
Not a citizenTotalTotal
Region Naturalized citizen
Not a citizenTotal
Naturalized citizen
Not a citizenTotal
Europe 95 12 0 12 36 9 27 47 22 25Asia 707 369 151 218 272 149 123 66 59 7Africa 32 6 0 6 26 15 11 0 0 0Oceania 0 0 0 0 0 0 0 0 0 0Americas: 77 Latin America: 61 Caribbean 0 0 0 0 0 0 0 0 0 0 Central America: 55 Mexico 0 0 0 0 0 0 0 0 0 0 Other Central America 55 32 0 32 9 0 9 14 14 0 South America 6 6 0 6 0 0 0 0 0 0 Northern America 16 0 0 0 8 0 8 8 8 0Born at sea 0 0 0 0 0 0 0 0 0 0
Total 911
1995 to March 2000 1411990 to 1994 2841985 to 1989 2091980 to 1984 1421975 to 1979 491970 to 1974 251965 to 1969 7Before 1965 54
P22. YEAR OF ENTRY FOR THE
Universe: Foreign-born populationFOREIGN-BORN POPULATION
100%
15.5%31.2%22.9%15.6%5.4%2.7%0.8%5.9%
Total 5,423Living in an MSA/PMSA in 2000: 5,423 Same house in 1995: 3,209 Central city of this MSA/PMSA 3,209 Remainder of this MSA/PMSA 0 Different house in 1995: 2,214 In United States in 1995: 2,032 Same MSA/PMSA in 1995: 1,528 Moved within same central city 1,265 Moved between central cities 34 Moved from central city to remainder of MSA 0 Moved from remainder of MSA to central city 229 Moved within remainder of MSA/PMSA 0 Different MSA/PMSA in 1995: 399 Central city in different MSA/PMSA 305 Remainder of different MSA/PMSA 94 Not in an MSA/PMSA in 1995 105
In Puerto Rico in 1995 0 Elsewhere in 1995 182
Not living in an MSA/PMSA in 2000 0
100%100.0%59.2%59.2%0.0%
40.8%37.5%28.2%23.3%0.6%0.0%4.2%0.0%7.4%5.6%1.7%1.9%
0.0%3.4%
0.0%
PCT22. RESIDENCE IN 1995--MSA/PMSA LEVELUniverse: Population 5 years and over
Total: 5,717
Native: 4,806 Born in state of residence 2,445 Born in other state in the U.S.: 2,306 Northeast 498 Midwest 490 South 634 West 684 Born outside the United States: 55 Puerto Rico 9 U.S. Island Areas 0 Born abroad of American parent(s) 46Foreign born: 911 Naturalized citizen 427 Not a citizen 484
100%
84.1%42.8%40.3%8.7%8.6%
11.1%12.0%1.0%0.2%0.0%0.8%
15.9%7.5%8.5%
P21. PLACE OF BIRTH BY CITIZENSHIP STATUSUniverse: Total population
Total: 5,423Same house in 1995 3,209Different house in 1995: 2,214 In United States in 1995: 2,032 Same city or town: 1,265 Same county 1,265 Different county (same state) 0 Not same city or town: 767 Same county 263 Different county: 504 Same state 87 Different state: 417 Northeast 133 Midwest 47 South 66 West 171 In Puerto Rico in 1995 0 Elsewhere in 1995 182
PCT21. RESIDENCE IN 1995
Universe: Population 5 years and over--STATE, COUNTY, PLACE LEVEL
100%59.2%40.8%37.5%23.3%23.3%0.0%
14.1%4.8%9.3%1.6%7.7%2.5%0.9%1.2%3.2%0.0%3.4%
Total
Page 33Community Reporting Area LevelMt. Baker/North Rainier
January 2005
Department of Planning and Development with Assistance from Puget Sound Regional Council 4.4

Characteristics of ResidencyCensus 2000, Summary File 3
CRA: North Beach/Blue Ridge
1,382 420 60 360 169 84 85 793 694 99
PCT20. PLACE OF BIRTH BY YEAR OF ENTRY BY CITIZENSHIP STATUS FOR FOREIGN-BORN POPULATIONUniverse: Foreign-born population
Entry 1990 to March 2000: Entry 1980 to 1989: Entry before 1980:
Naturalized citizen
Not a citizenTotalTotal
Region Naturalized citizen
Not a citizenTotal
Naturalized citizen
Not a citizenTotal
Europe 611 81 0 81 48 12 36 482 442 40Asia 468 213 60 153 73 36 37 182 158 24Africa 52 42 0 42 0 0 0 10 10 0Oceania 14 8 0 8 0 0 0 6 6 0Americas: 237 Latin America: 97 Caribbean 0 0 0 0 0 0 0 0 0 0 Central America: 48 Mexico 37 25 0 25 12 0 12 0 0 0 Other Central America 11 5 0 5 0 0 0 6 6 0 South America 49 11 0 11 31 31 0 7 7 0 Northern America 140 35 0 35 5 5 0 100 65 35Born at sea 0 0 0 0 0 0 0 0 0 0
Total 1,382
1995 to March 2000 2351990 to 1994 1851985 to 1989 601980 to 1984 1091975 to 1979 981970 to 1974 1281965 to 1969 77Before 1965 490
P22. YEAR OF ENTRY FOR THE
Universe: Foreign-born populationFOREIGN-BORN POPULATION
100%
17.0%13.4%4.3%7.9%7.1%9.3%5.6%
35.5%
Total 10,436Living in an MSA/PMSA in 2000: 10,436 Same house in 1995: 6,078 Central city of this MSA/PMSA 6,078 Remainder of this MSA/PMSA 0 Different house in 1995: 4,358 In United States in 1995: 4,154 Same MSA/PMSA in 1995: 2,940 Moved within same central city 2,414 Moved between central cities 0 Moved from central city to remainder of MSA 0 Moved from remainder of MSA to central city 526 Moved within remainder of MSA/PMSA 0 Different MSA/PMSA in 1995: 977 Central city in different MSA/PMSA 596 Remainder of different MSA/PMSA 381 Not in an MSA/PMSA in 1995 237
In Puerto Rico in 1995 0 Elsewhere in 1995 204
Not living in an MSA/PMSA in 2000 0
100%100.0%58.2%58.2%0.0%
41.8%39.8%28.2%23.1%0.0%0.0%5.0%0.0%9.4%5.7%3.7%2.3%
0.0%2.0%
0.0%
PCT22. RESIDENCE IN 1995--MSA/PMSA LEVELUniverse: Population 5 years and over
Total: 10,969
Native: 9,587 Born in state of residence 5,613 Born in other state in the U.S.: 3,878 Northeast 648 Midwest 1,157 South 518 West 1,555 Born outside the United States: 96 Puerto Rico 0 U.S. Island Areas 0 Born abroad of American parent(s) 96Foreign born: 1,382 Naturalized citizen 838 Not a citizen 544
100%
87.4%51.2%35.4%5.9%
10.5%4.7%
14.2%0.9%0.0%0.0%0.9%
12.6%7.6%5.0%
P21. PLACE OF BIRTH BY CITIZENSHIP STATUSUniverse: Total population
Total: 10,436Same house in 1995 6,078Different house in 1995: 4,358 In United States in 1995: 4,154 Same city or town: 2,414 Same county 2,414 Different county (same state) 0 Not same city or town: 1,740 Same county 230 Different county: 1,510 Same state 500 Different state: 1,010 Northeast 158 Midwest 140 South 150 West 562 In Puerto Rico in 1995 0 Elsewhere in 1995 204
PCT21. RESIDENCE IN 1995
Universe: Population 5 years and over--STATE, COUNTY, PLACE LEVEL
100%58.2%41.8%39.8%23.1%23.1%0.0%
16.7%2.2%
14.5%4.8%9.7%1.5%1.3%1.4%5.4%0.0%2.0%
Total
Page 34Community Reporting Area LevelNorth Beach/Blue Ridge
January 2005
Department of Planning and Development with Assistance from Puget Sound Regional Council 10.1

Characteristics of ResidencyCensus 2000, Summary File 3
CRA: North Beacon Hill/Jefferson Park
5,658 2,633 893 1,740 1,542 934 608 1,483 1,191 292
PCT20. PLACE OF BIRTH BY YEAR OF ENTRY BY CITIZENSHIP STATUS FOR FOREIGN-BORN POPULATIONUniverse: Foreign-born population
Entry 1990 to March 2000: Entry 1980 to 1989: Entry before 1980:
Naturalized citizen
Not a citizenTotalTotal
Region Naturalized citizen
Not a citizenTotal
Naturalized citizen
Not a citizenTotal
Europe 105 39 15 24 0 0 0 66 50 16Asia 4,275 1,728 662 1,066 1,364 869 495 1,183 1,021 162Africa 381 305 130 175 59 30 29 17 8 9Oceania 135 51 24 27 18 18 0 66 58 8Americas: 762 Latin America: 735 Caribbean 0 0 0 0 0 0 0 0 0 0 Central America: 648 Mexico 510 430 62 368 49 17 32 31 13 18 Other Central America 138 57 0 57 33 0 33 48 6 42 South America 87 23 0 23 19 0 19 45 17 28 Northern America 27 0 0 0 0 0 0 27 18 9Born at sea 0 0 0 0 0 0 0 0 0 0
Total 5,658
1995 to March 2000 1,0871990 to 1994 1,5461985 to 1989 7341980 to 1984 8081975 to 1979 5421970 to 1974 3031965 to 1969 246Before 1965 392
P22. YEAR OF ENTRY FOR THE
Universe: Foreign-born populationFOREIGN-BORN POPULATION
100%
19.2%27.3%13.0%14.3%9.6%5.4%4.3%6.9%
Total 12,659Living in an MSA/PMSA in 2000: 12,659 Same house in 1995: 6,600 Central city of this MSA/PMSA 6,600 Remainder of this MSA/PMSA 0 Different house in 1995: 6,059 In United States in 1995: 5,298 Same MSA/PMSA in 1995: 4,213 Moved within same central city 3,412 Moved between central cities 75 Moved from central city to remainder of MSA 0 Moved from remainder of MSA to central city 726 Moved within remainder of MSA/PMSA 0 Different MSA/PMSA in 1995: 937 Central city in different MSA/PMSA 615 Remainder of different MSA/PMSA 322 Not in an MSA/PMSA in 1995 148
In Puerto Rico in 1995 0 Elsewhere in 1995 761
Not living in an MSA/PMSA in 2000 0
100%100.0%52.1%52.1%0.0%
47.9%41.9%33.3%27.0%0.6%0.0%5.7%0.0%7.4%4.9%2.5%1.2%
0.0%6.0%
0.0%
PCT22. RESIDENCE IN 1995--MSA/PMSA LEVELUniverse: Population 5 years and over
Total: 13,381
Native: 7,723 Born in state of residence 4,508 Born in other state in the U.S.: 2,998 Northeast 296 Midwest 604 South 781 West 1,317 Born outside the United States: 217 Puerto Rico 10 U.S. Island Areas 19 Born abroad of American parent(s) 188Foreign born: 5,658 Naturalized citizen 3,018 Not a citizen 2,640
100%
57.7%33.7%22.4%2.2%4.5%5.8%9.8%1.6%0.1%0.1%1.4%
42.3%22.6%19.7%
P21. PLACE OF BIRTH BY CITIZENSHIP STATUSUniverse: Total population
Total: 12,659Same house in 1995 6,600Different house in 1995: 6,059 In United States in 1995: 5,298 Same city or town: 3,412 Same county 3,412 Different county (same state) 0 Not same city or town: 1,886 Same county 705 Different county: 1,181 Same state 340 Different state: 841 Northeast 139 Midwest 65 South 80 West 557 In Puerto Rico in 1995 0 Elsewhere in 1995 761
PCT21. RESIDENCE IN 1995
Universe: Population 5 years and over--STATE, COUNTY, PLACE LEVEL
100%52.1%47.9%41.9%27.0%27.0%0.0%
14.9%5.6%9.3%2.7%6.6%1.1%0.5%0.6%4.4%0.0%6.0%
Total
Page 35Community Reporting Area LevelNorth Beacon Hill/Jefferson Park
January 2005
Department of Planning and Development with Assistance from Puget Sound Regional Council 3.6

Characteristics of ResidencyCensus 2000, Summary File 3
CRA: North Capitol Hill
484 215 37 178 125 97 28 144 123 21
PCT20. PLACE OF BIRTH BY YEAR OF ENTRY BY CITIZENSHIP STATUS FOR FOREIGN-BORN POPULATIONUniverse: Foreign-born population
Entry 1990 to March 2000: Entry 1980 to 1989: Entry before 1980:
Naturalized citizen
Not a citizenTotalTotal
Region Naturalized citizen
Not a citizenTotal
Naturalized citizen
Not a citizenTotal
Europe 181 77 6 71 77 66 11 27 11 16Asia 157 65 21 44 28 11 17 64 59 5Africa 45 26 7 19 0 0 0 19 19 0Oceania 23 11 0 11 0 0 0 12 12 0Americas: 78 Latin America: 49 Caribbean 14 0 0 0 0 0 0 14 14 0 Central America: 35 Mexico 25 25 0 25 0 0 0 0 0 0 Other Central America 10 3 3 0 7 7 0 0 0 0 South America 0 0 0 0 0 0 0 0 0 0 Northern America 29 8 0 8 13 13 0 8 8 0Born at sea 0 0 0 0 0 0 0 0 0 0
Total 484
1995 to March 2000 1201990 to 1994 951985 to 1989 641980 to 1984 611975 to 1979 761970 to 1974 361965 to 1969 0Before 1965 32
P22. YEAR OF ENTRY FOR THE
Universe: Foreign-born populationFOREIGN-BORN POPULATION
100%
24.8%19.6%13.2%12.6%15.7%7.4%0.0%6.6%
Total 3,912Living in an MSA/PMSA in 2000: 3,912 Same house in 1995: 1,430 Central city of this MSA/PMSA 1,430 Remainder of this MSA/PMSA 0 Different house in 1995: 2,482 In United States in 1995: 2,300 Same MSA/PMSA in 1995: 1,109 Moved within same central city 921 Moved between central cities 45 Moved from central city to remainder of MSA 0 Moved from remainder of MSA to central city 143 Moved within remainder of MSA/PMSA 0 Different MSA/PMSA in 1995: 1,046 Central city in different MSA/PMSA 696 Remainder of different MSA/PMSA 350 Not in an MSA/PMSA in 1995 145
In Puerto Rico in 1995 0 Elsewhere in 1995 182
Not living in an MSA/PMSA in 2000 0
100%100.0%36.6%36.6%0.0%
63.4%58.8%28.3%23.5%1.2%0.0%3.7%0.0%
26.7%17.8%8.9%3.7%
0.0%4.7%
0.0%
PCT22. RESIDENCE IN 1995--MSA/PMSA LEVELUniverse: Population 5 years and over
Total: 4,045
Native: 3,561 Born in state of residence 1,106 Born in other state in the U.S.: 2,350 Northeast 612 Midwest 629 South 294 West 815 Born outside the United States: 105 Puerto Rico 3 U.S. Island Areas 0 Born abroad of American parent(s) 102Foreign born: 484 Naturalized citizen 257 Not a citizen 227
100%
88.0%27.3%58.1%15.1%15.6%7.3%
20.1%2.6%0.1%0.0%2.5%
12.0%6.4%5.6%
P21. PLACE OF BIRTH BY CITIZENSHIP STATUSUniverse: Total population
Total: 3,912Same house in 1995 1,430Different house in 1995: 2,482 In United States in 1995: 2,300 Same city or town: 921 Same county 921 Different county (same state) 0 Not same city or town: 1,379 Same county 169 Different county: 1,210 Same state 236 Different state: 974 Northeast 281 Midwest 170 South 143 West 380 In Puerto Rico in 1995 0 Elsewhere in 1995 182
PCT21. RESIDENCE IN 1995
Universe: Population 5 years and over--STATE, COUNTY, PLACE LEVEL
100%36.6%63.4%58.8%23.5%23.5%0.0%
35.3%4.3%
30.9%6.0%
24.9%7.2%4.3%3.7%9.7%0.0%4.7%
Total
Page 36Community Reporting Area LevelNorth Capitol Hill
January 2005
Department of Planning and Development with Assistance from Puget Sound Regional Council 6.3

Characteristics of ResidencyCensus 2000, Summary File 3
CRA: North Delridge
615 284 52 232 220 96 124 111 93 18
PCT20. PLACE OF BIRTH BY YEAR OF ENTRY BY CITIZENSHIP STATUS FOR FOREIGN-BORN POPULATIONUniverse: Foreign-born population
Entry 1990 to March 2000: Entry 1980 to 1989: Entry before 1980:
Naturalized citizen
Not a citizenTotalTotal
Region Naturalized citizen
Not a citizenTotal
Naturalized citizen
Not a citizenTotal
Europe 108 20 0 20 50 41 9 38 20 18Asia 211 78 52 26 100 41 59 33 33 0Africa 17 17 0 17 0 0 0 0 0 0Oceania 16 16 0 16 0 0 0 0 0 0Americas: 263 Latin America: 217 Caribbean 0 0 0 0 0 0 0 0 0 0 Central America: 180 Mexico 167 113 0 113 50 5 45 4 4 0 Other Central America 13 4 0 4 4 0 4 5 5 0 South America 37 29 0 29 0 0 0 8 8 0 Northern America 46 7 0 7 16 9 7 23 23 0Born at sea 0 0 0 0 0 0 0 0 0 0
Total 615
1995 to March 2000 1021990 to 1994 1821985 to 1989 1301980 to 1984 901975 to 1979 191970 to 1974 251965 to 1969 53Before 1965 14
P22. YEAR OF ENTRY FOR THE
Universe: Foreign-born populationFOREIGN-BORN POPULATION
100%
16.6%29.6%21.1%14.6%3.1%4.1%8.6%2.3%
Total 4,080Living in an MSA/PMSA in 2000: 4,080 Same house in 1995: 1,389 Central city of this MSA/PMSA 1,389 Remainder of this MSA/PMSA 0 Different house in 1995: 2,691 In United States in 1995: 2,453 Same MSA/PMSA in 1995: 1,722 Moved within same central city 1,419 Moved between central cities 9 Moved from central city to remainder of MSA 0 Moved from remainder of MSA to central city 294 Moved within remainder of MSA/PMSA 0 Different MSA/PMSA in 1995: 609 Central city in different MSA/PMSA 413 Remainder of different MSA/PMSA 196 Not in an MSA/PMSA in 1995 122
In Puerto Rico in 1995 0 Elsewhere in 1995 238
Not living in an MSA/PMSA in 2000 0
100%100.0%34.0%34.0%0.0%
66.0%60.1%42.2%34.8%0.2%0.0%7.2%0.0%
14.9%10.1%4.8%3.0%
0.0%5.8%
0.0%
PCT22. RESIDENCE IN 1995--MSA/PMSA LEVELUniverse: Population 5 years and over
Total: 4,338
Native: 3,723 Born in state of residence 1,897 Born in other state in the U.S.: 1,808 Northeast 320 Midwest 516 South 239 West 733 Born outside the United States: 18 Puerto Rico 10 U.S. Island Areas 0 Born abroad of American parent(s) 8Foreign born: 615 Naturalized citizen 241 Not a citizen 374
100%
85.8%43.7%41.7%7.4%
11.9%5.5%
16.9%0.4%0.2%0.0%0.2%
14.2%5.6%8.6%
P21. PLACE OF BIRTH BY CITIZENSHIP STATUSUniverse: Total population
Total: 4,080Same house in 1995 1,389Different house in 1995: 2,691 In United States in 1995: 2,453 Same city or town: 1,419 Same county 1,419 Different county (same state) 0 Not same city or town: 1,034 Same county 210 Different county: 824 Same state 248 Different state: 576 Northeast 92 Midwest 119 South 111 West 254 In Puerto Rico in 1995 0 Elsewhere in 1995 238
PCT21. RESIDENCE IN 1995
Universe: Population 5 years and over--STATE, COUNTY, PLACE LEVEL
100%34.0%66.0%60.1%34.8%34.8%0.0%
25.3%5.1%
20.2%6.1%
14.1%2.3%2.9%2.7%6.2%0.0%5.8%
Total
Page 37Community Reporting Area LevelNorth Delridge
January 2005
Department of Planning and Development with Assistance from Puget Sound Regional Council 2.1

Characteristics of ResidencyCensus 2000, Summary File 3
CRA: Northgate/Maple Leaf
2,586 1,246 115 1,131 638 370 268 702 562 140
PCT20. PLACE OF BIRTH BY YEAR OF ENTRY BY CITIZENSHIP STATUS FOR FOREIGN-BORN POPULATIONUniverse: Foreign-born population
Entry 1990 to March 2000: Entry 1980 to 1989: Entry before 1980:
Naturalized citizen
Not a citizenTotalTotal
Region Naturalized citizen
Not a citizenTotal
Naturalized citizen
Not a citizenTotal
Europe 471 170 17 153 92 73 19 209 163 46Asia 1,462 778 82 696 345 193 152 339 296 43Africa 285 161 0 161 102 67 35 22 15 7Oceania 0 0 0 0 0 0 0 0 0 0Americas: 368 Latin America: 266 Caribbean 10 0 0 0 0 0 0 10 0 10 Central America: 191 Mexico 133 63 0 63 48 22 26 22 11 11 Other Central America 58 23 16 7 35 15 20 0 0 0 South America 65 43 0 43 7 0 7 15 15 0 Northern America 102 8 0 8 9 0 9 85 62 23Born at sea 0 0 0 0 0 0 0 0 0 0
Total 2,586
1995 to March 2000 8721990 to 1994 3741985 to 1989 3921980 to 1984 2461975 to 1979 1841970 to 1974 1491965 to 1969 80Before 1965 289
P22. YEAR OF ENTRY FOR THE
Universe: Foreign-born populationFOREIGN-BORN POPULATION
100%
33.7%14.5%15.2%9.5%7.1%5.8%3.1%
11.2%
Total 12,052Living in an MSA/PMSA in 2000: 12,052 Same house in 1995: 5,093 Central city of this MSA/PMSA 5,093 Remainder of this MSA/PMSA 0 Different house in 1995: 6,959 In United States in 1995: 6,071 Same MSA/PMSA in 1995: 4,128 Moved within same central city 3,348 Moved between central cities 101 Moved from central city to remainder of MSA 0 Moved from remainder of MSA to central city 679 Moved within remainder of MSA/PMSA 0 Different MSA/PMSA in 1995: 1,716 Central city in different MSA/PMSA 1,048 Remainder of different MSA/PMSA 668 Not in an MSA/PMSA in 1995 227
In Puerto Rico in 1995 12 Elsewhere in 1995 876
Not living in an MSA/PMSA in 2000 0
100%100.0%42.3%42.3%0.0%
57.7%50.4%34.3%27.8%0.8%0.0%5.6%0.0%
14.2%8.7%5.5%1.9%
0.1%7.3%
0.0%
PCT22. RESIDENCE IN 1995--MSA/PMSA LEVELUniverse: Population 5 years and over
Total: 12,655
Native: 10,069 Born in state of residence 4,989 Born in other state in the U.S.: 4,919 Northeast 690 Midwest 1,517 South 685 West 2,027 Born outside the United States: 161 Puerto Rico 0 U.S. Island Areas 22 Born abroad of American parent(s) 139Foreign born: 2,586 Naturalized citizen 1,047 Not a citizen 1,539
100%
79.6%39.4%38.9%5.5%
12.0%5.4%
16.0%1.3%0.0%0.2%1.1%
20.4%8.3%
12.2%
P21. PLACE OF BIRTH BY CITIZENSHIP STATUSUniverse: Total population
Total: 12,052Same house in 1995 5,093Different house in 1995: 6,959 In United States in 1995: 6,071 Same city or town: 3,348 Same county 3,348 Different county (same state) 0 Not same city or town: 2,723 Same county 505 Different county: 2,218 Same state 826 Different state: 1,392 Northeast 191 Midwest 213 South 235 West 753 In Puerto Rico in 1995 12 Elsewhere in 1995 876
PCT21. RESIDENCE IN 1995
Universe: Population 5 years and over--STATE, COUNTY, PLACE LEVEL
100%42.3%57.7%50.4%27.8%27.8%0.0%
22.6%4.2%
18.4%6.9%
11.5%1.6%1.8%1.9%6.2%0.1%7.3%
Total
Page 38Community Reporting Area LevelNorthgate/Maple Leaf
January 2005
Department of Planning and Development with Assistance from Puget Sound Regional Council 8.1

Characteristics of ResidencyCensus 2000, Summary File 3
CRA: Olympic Hills/Victory Heights
2,655 1,173 203 970 828 568 260 654 468 186
PCT20. PLACE OF BIRTH BY YEAR OF ENTRY BY CITIZENSHIP STATUS FOR FOREIGN-BORN POPULATIONUniverse: Foreign-born population
Entry 1990 to March 2000: Entry 1980 to 1989: Entry before 1980:
Naturalized citizen
Not a citizenTotalTotal
Region Naturalized citizen
Not a citizenTotal
Naturalized citizen
Not a citizenTotal
Europe 554 252 50 202 97 38 59 205 125 80Asia 1,517 636 141 495 594 471 123 287 237 50Africa 223 136 12 124 39 18 21 48 36 12Oceania 7 0 0 0 0 0 0 7 0 7Americas: 354 Latin America: 243 Caribbean 24 15 0 15 0 0 0 9 9 0 Central America: 188 Mexico 156 77 0 77 58 16 42 21 0 21 Other Central America 32 13 0 13 11 0 11 8 8 0 South America 31 6 0 6 25 25 0 0 0 0 Northern America 111 38 0 38 4 0 4 69 53 16Born at sea 0 0 0 0 0 0 0 0 0 0
Total 2,655
1995 to March 2000 7521990 to 1994 4211985 to 1989 3641980 to 1984 4641975 to 1979 2041970 to 1974 1221965 to 1969 81Before 1965 247
P22. YEAR OF ENTRY FOR THE
Universe: Foreign-born populationFOREIGN-BORN POPULATION
100%
28.3%15.9%13.7%17.5%7.7%4.6%3.1%9.3%
Total 13,263Living in an MSA/PMSA in 2000: 13,263 Same house in 1995: 6,636 Central city of this MSA/PMSA 6,636 Remainder of this MSA/PMSA 0 Different house in 1995: 6,627 In United States in 1995: 5,948 Same MSA/PMSA in 1995: 4,070 Moved within same central city 3,329 Moved between central cities 71 Moved from central city to remainder of MSA 0 Moved from remainder of MSA to central city 670 Moved within remainder of MSA/PMSA 0 Different MSA/PMSA in 1995: 1,504 Central city in different MSA/PMSA 1,060 Remainder of different MSA/PMSA 444 Not in an MSA/PMSA in 1995 374
In Puerto Rico in 1995 0 Elsewhere in 1995 679
Not living in an MSA/PMSA in 2000 0
100%100.0%50.0%50.0%0.0%
50.0%44.8%30.7%25.1%0.5%0.0%5.1%0.0%
11.3%8.0%3.3%2.8%
0.0%5.1%
0.0%
PCT22. RESIDENCE IN 1995--MSA/PMSA LEVELUniverse: Population 5 years and over
Total: 13,871
Native: 11,216 Born in state of residence 5,766 Born in other state in the U.S.: 5,255 Northeast 794 Midwest 1,425 South 706 West 2,330 Born outside the United States: 195 Puerto Rico 0 U.S. Island Areas 16 Born abroad of American parent(s) 179Foreign born: 2,655 Naturalized citizen 1,239 Not a citizen 1,416
100%
80.9%41.6%37.9%5.7%
10.3%5.1%
16.8%1.4%0.0%0.1%1.3%
19.1%8.9%
10.2%
P21. PLACE OF BIRTH BY CITIZENSHIP STATUSUniverse: Total population
Total: 13,263Same house in 1995 6,636Different house in 1995: 6,627 In United States in 1995: 5,948 Same city or town: 3,329 Same county 3,329 Different county (same state) 0 Not same city or town: 2,619 Same county 522 Different county: 2,097 Same state 750 Different state: 1,347 Northeast 178 Midwest 112 South 219 West 838 In Puerto Rico in 1995 0 Elsewhere in 1995 679
PCT21. RESIDENCE IN 1995
Universe: Population 5 years and over--STATE, COUNTY, PLACE LEVEL
100%50.0%50.0%44.8%25.1%25.1%0.0%
19.7%3.9%
15.8%5.7%
10.2%1.3%0.8%1.7%6.3%0.0%5.1%
Total
Page 39Community Reporting Area LevelOlympic Hills/Victory Heights
January 2005
Department of Planning and Development with Assistance from Puget Sound Regional Council 8.2

Characteristics of ResidencyCensus 2000, Summary File 3
CRA: Pioneer Square/International District
1,977 947 309 638 550 365 185 480 345 135
PCT20. PLACE OF BIRTH BY YEAR OF ENTRY BY CITIZENSHIP STATUS FOR FOREIGN-BORN POPULATIONUniverse: Foreign-born population
Entry 1990 to March 2000: Entry 1980 to 1989: Entry before 1980:
Naturalized citizen
Not a citizenTotalTotal
Region Naturalized citizen
Not a citizenTotal
Naturalized citizen
Not a citizenTotal
Europe 45 19 0 19 12 0 12 14 10 4Asia 1,540 703 249 454 448 308 140 389 311 78Africa 210 161 60 101 49 49 0 0 0 0Oceania 0 0 0 0 0 0 0 0 0 0Americas: 182 Latin America: 161 Caribbean 13 0 0 0 0 0 0 13 13 0 Central America: 138 Mexico 132 48 0 48 35 8 27 49 0 49 Other Central America 6 0 0 0 6 0 6 0 0 0 South America 10 10 0 10 0 0 0 0 0 0 Northern America 21 6 0 6 0 0 0 15 11 4Born at sea 0 0 0 0 0 0 0 0 0 0
Total 1,977
1995 to March 2000 4921990 to 1994 4551985 to 1989 2561980 to 1984 2941975 to 1979 1631970 to 1974 721965 to 1969 96Before 1965 149
P22. YEAR OF ENTRY FOR THE
Universe: Foreign-born populationFOREIGN-BORN POPULATION
100%
24.9%23.0%12.9%14.9%8.2%3.6%4.9%7.5%
Total 3,798Living in an MSA/PMSA in 2000: 3,798 Same house in 1995: 1,195 Central city of this MSA/PMSA 1,195 Remainder of this MSA/PMSA 0 Different house in 1995: 2,603 In United States in 1995: 2,080 Same MSA/PMSA in 1995: 1,180 Moved within same central city 1,003 Moved between central cities 50 Moved from central city to remainder of MSA 0 Moved from remainder of MSA to central city 127 Moved within remainder of MSA/PMSA 0 Different MSA/PMSA in 1995: 833 Central city in different MSA/PMSA 627 Remainder of different MSA/PMSA 206 Not in an MSA/PMSA in 1995 67
In Puerto Rico in 1995 0 Elsewhere in 1995 523
Not living in an MSA/PMSA in 2000 0
100%100.0%31.5%31.5%0.0%
68.5%54.8%31.1%26.4%1.3%0.0%3.3%0.0%
21.9%16.5%5.4%1.8%
0.0%13.8%
0.0%
PCT22. RESIDENCE IN 1995--MSA/PMSA LEVELUniverse: Population 5 years and over
Total: 3,919
Native: 1,942 Born in state of residence 655 Born in other state in the U.S.: 1,177 Northeast 205 Midwest 278 South 362 West 332 Born outside the United States: 110 Puerto Rico 29 U.S. Island Areas 0 Born abroad of American parent(s) 81Foreign born: 1,977 Naturalized citizen 1,019 Not a citizen 958
100%
49.6%16.7%30.0%5.2%7.1%9.2%8.5%2.8%0.7%0.0%2.1%
50.4%26.0%24.4%
P21. PLACE OF BIRTH BY CITIZENSHIP STATUSUniverse: Total population
Total: 3,798Same house in 1995 1,195Different house in 1995: 2,603 In United States in 1995: 2,080 Same city or town: 1,003 Same county 1,003 Different county (same state) 0 Not same city or town: 1,077 Same county 146 Different county: 931 Same state 142 Different state: 789 Northeast 195 Midwest 90 South 128 West 376 In Puerto Rico in 1995 0 Elsewhere in 1995 523
PCT21. RESIDENCE IN 1995
Universe: Population 5 years and over--STATE, COUNTY, PLACE LEVEL
100%31.5%68.5%54.8%26.4%26.4%0.0%
28.4%3.8%
24.5%3.7%
20.8%5.1%2.4%3.4%9.9%0.0%
13.8%
Total
Page 40Community Reporting Area LevelPioneer Square/International District
January 2005
Department of Planning and Development with Assistance from Puget Sound Regional Council 13.3
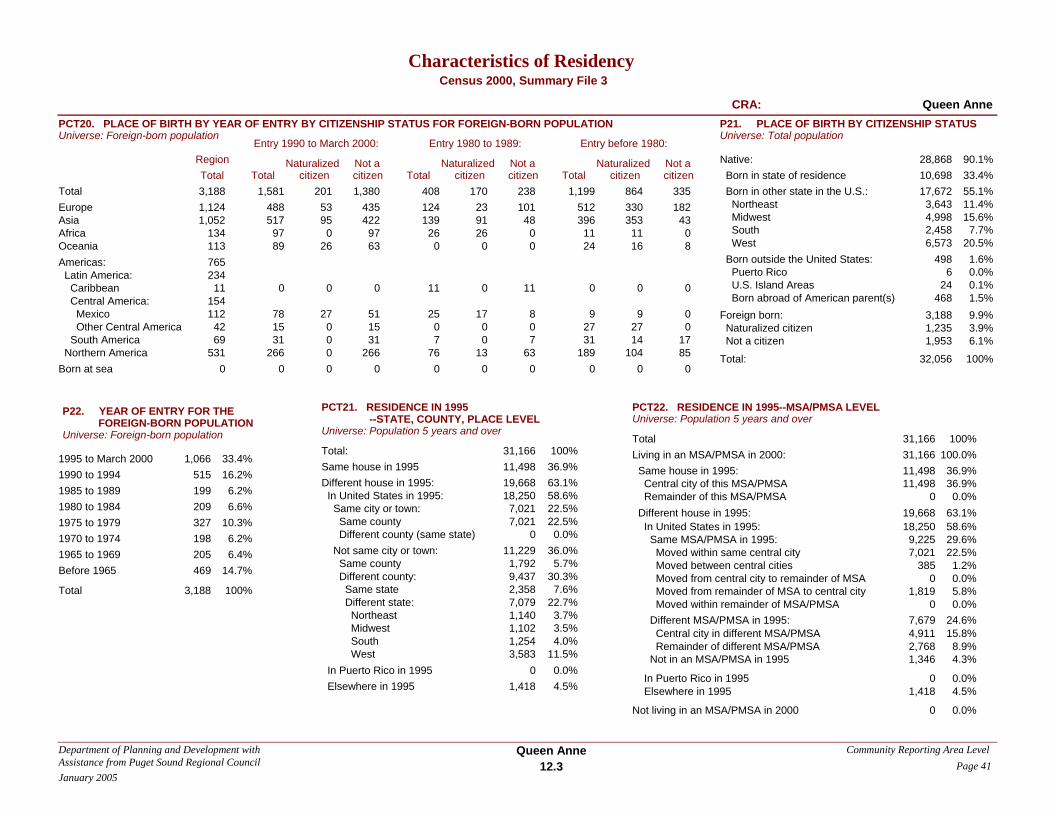
Characteristics of ResidencyCensus 2000, Summary File 3
CRA: Queen Anne
3,188 1,581 201 1,380 408 170 238 1,199 864 335
PCT20. PLACE OF BIRTH BY YEAR OF ENTRY BY CITIZENSHIP STATUS FOR FOREIGN-BORN POPULATIONUniverse: Foreign-born population
Entry 1990 to March 2000: Entry 1980 to 1989: Entry before 1980:
Naturalized citizen
Not a citizenTotalTotal
Region Naturalized citizen
Not a citizenTotal
Naturalized citizen
Not a citizenTotal
Europe 1,124 488 53 435 124 23 101 512 330 182Asia 1,052 517 95 422 139 91 48 396 353 43Africa 134 97 0 97 26 26 0 11 11 0Oceania 113 89 26 63 0 0 0 24 16 8Americas: 765 Latin America: 234 Caribbean 11 0 0 0 11 0 11 0 0 0 Central America: 154 Mexico 112 78 27 51 25 17 8 9 9 0 Other Central America 42 15 0 15 0 0 0 27 27 0 South America 69 31 0 31 7 0 7 31 14 17 Northern America 531 266 0 266 76 13 63 189 104 85Born at sea 0 0 0 0 0 0 0 0 0 0
Total 3,188
1995 to March 2000 1,0661990 to 1994 5151985 to 1989 1991980 to 1984 2091975 to 1979 3271970 to 1974 1981965 to 1969 205Before 1965 469
P22. YEAR OF ENTRY FOR THE
Universe: Foreign-born populationFOREIGN-BORN POPULATION
100%
33.4%16.2%6.2%6.6%
10.3%6.2%6.4%
14.7%
Total 31,166Living in an MSA/PMSA in 2000: 31,166 Same house in 1995: 11,498 Central city of this MSA/PMSA 11,498 Remainder of this MSA/PMSA 0 Different house in 1995: 19,668 In United States in 1995: 18,250 Same MSA/PMSA in 1995: 9,225 Moved within same central city 7,021 Moved between central cities 385 Moved from central city to remainder of MSA 0 Moved from remainder of MSA to central city 1,819 Moved within remainder of MSA/PMSA 0 Different MSA/PMSA in 1995: 7,679 Central city in different MSA/PMSA 4,911 Remainder of different MSA/PMSA 2,768 Not in an MSA/PMSA in 1995 1,346
In Puerto Rico in 1995 0 Elsewhere in 1995 1,418
Not living in an MSA/PMSA in 2000 0
100%100.0%36.9%36.9%0.0%
63.1%58.6%29.6%22.5%1.2%0.0%5.8%0.0%
24.6%15.8%8.9%4.3%
0.0%4.5%
0.0%
PCT22. RESIDENCE IN 1995--MSA/PMSA LEVELUniverse: Population 5 years and over
Total: 32,056
Native: 28,868 Born in state of residence 10,698 Born in other state in the U.S.: 17,672 Northeast 3,643 Midwest 4,998 South 2,458 West 6,573 Born outside the United States: 498 Puerto Rico 6 U.S. Island Areas 24 Born abroad of American parent(s) 468Foreign born: 3,188 Naturalized citizen 1,235 Not a citizen 1,953
100%
90.1%33.4%55.1%11.4%15.6%7.7%
20.5%1.6%0.0%0.1%1.5%9.9%3.9%6.1%
P21. PLACE OF BIRTH BY CITIZENSHIP STATUSUniverse: Total population
Total: 31,166Same house in 1995 11,498Different house in 1995: 19,668 In United States in 1995: 18,250 Same city or town: 7,021 Same county 7,021 Different county (same state) 0 Not same city or town: 11,229 Same county 1,792 Different county: 9,437 Same state 2,358 Different state: 7,079 Northeast 1,140 Midwest 1,102 South 1,254 West 3,583 In Puerto Rico in 1995 0 Elsewhere in 1995 1,418
PCT21. RESIDENCE IN 1995
Universe: Population 5 years and over--STATE, COUNTY, PLACE LEVEL
100%36.9%63.1%58.6%22.5%22.5%0.0%
36.0%5.7%
30.3%7.6%
22.7%3.7%3.5%4.0%
11.5%0.0%4.5%
Total
Page 41Community Reporting Area LevelQueen Anne
January 2005
Department of Planning and Development with Assistance from Puget Sound Regional Council 12.3

Characteristics of ResidencyCensus 2000, Summary File 3
CRA: Rainier Beach
3,761 1,368 432 936 1,582 1,031 551 811 673 138
PCT20. PLACE OF BIRTH BY YEAR OF ENTRY BY CITIZENSHIP STATUS FOR FOREIGN-BORN POPULATIONUniverse: Foreign-born population
Entry 1990 to March 2000: Entry 1980 to 1989: Entry before 1980:
Naturalized citizen
Not a citizenTotalTotal
Region Naturalized citizen
Not a citizenTotal
Naturalized citizen
Not a citizenTotal
Europe 131 0 0 0 33 20 13 98 80 18Asia 2,862 922 400 522 1,371 899 472 569 465 104Africa 183 149 14 135 34 34 0 0 0 0Oceania 192 92 18 74 44 44 0 56 56 0Americas: 393 Latin America: 361 Caribbean 24 0 0 0 0 0 0 24 15 9 Central America: 329 Mexico 252 192 0 192 38 6 32 22 22 0 Other Central America 77 13 0 13 42 20 22 22 22 0 South America 8 0 0 0 8 8 0 0 0 0 Northern America 32 0 0 0 12 0 12 20 13 7Born at sea 0 0 0 0 0 0 0 0 0 0
Total 3,761
1995 to March 2000 5231990 to 1994 8451985 to 1989 6161980 to 1984 9661975 to 1979 3021970 to 1974 2381965 to 1969 87Before 1965 184
P22. YEAR OF ENTRY FOR THE
Universe: Foreign-born populationFOREIGN-BORN POPULATION
100%
13.9%22.5%16.4%25.7%8.0%6.3%2.3%4.9%
Total 13,649Living in an MSA/PMSA in 2000: 13,649 Same house in 1995: 7,381 Central city of this MSA/PMSA 7,381 Remainder of this MSA/PMSA 0 Different house in 1995: 6,268 In United States in 1995: 5,895 Same MSA/PMSA in 1995: 4,305 Moved within same central city 3,234 Moved between central cities 126 Moved from central city to remainder of MSA 0 Moved from remainder of MSA to central city 945 Moved within remainder of MSA/PMSA 0 Different MSA/PMSA in 1995: 1,325 Central city in different MSA/PMSA 957 Remainder of different MSA/PMSA 368 Not in an MSA/PMSA in 1995 265
In Puerto Rico in 1995 0 Elsewhere in 1995 373
Not living in an MSA/PMSA in 2000 0
100%100.0%54.1%54.1%0.0%
45.9%43.2%31.5%23.7%0.9%0.0%6.9%0.0%9.7%7.0%2.7%1.9%
0.0%2.7%
0.0%
PCT22. RESIDENCE IN 1995--MSA/PMSA LEVELUniverse: Population 5 years and over
Total: 14,658
Native: 10,897 Born in state of residence 6,020 Born in other state in the U.S.: 4,638 Northeast 390 Midwest 892 South 1,864 West 1,492 Born outside the United States: 239 Puerto Rico 8 U.S. Island Areas 79 Born abroad of American parent(s) 152Foreign born: 3,761 Naturalized citizen 2,136 Not a citizen 1,625
100%
74.3%41.1%31.6%2.7%6.1%
12.7%10.2%1.6%0.1%0.5%1.0%
25.7%14.6%11.1%
P21. PLACE OF BIRTH BY CITIZENSHIP STATUSUniverse: Total population
Total: 13,649Same house in 1995 7,381Different house in 1995: 6,268 In United States in 1995: 5,895 Same city or town: 3,234 Same county 3,234 Different county (same state) 0 Not same city or town: 2,661 Same county 907 Different county: 1,754 Same state 597 Different state: 1,157 Northeast 116 Midwest 162 South 383 West 496 In Puerto Rico in 1995 0 Elsewhere in 1995 373
PCT21. RESIDENCE IN 1995
Universe: Population 5 years and over--STATE, COUNTY, PLACE LEVEL
100%54.1%45.9%43.2%23.7%23.7%0.0%
19.5%6.6%
12.9%4.4%8.5%0.8%1.2%2.8%3.6%0.0%2.7%
Total
Page 42Community Reporting Area LevelRainier Beach
January 2005
Department of Planning and Development with Assistance from Puget Sound Regional Council 4.1

Characteristics of ResidencyCensus 2000, Summary File 3
CRA: Ravenna/Bryant
2,644 1,449 194 1,255 434 221 213 761 631 130
PCT20. PLACE OF BIRTH BY YEAR OF ENTRY BY CITIZENSHIP STATUS FOR FOREIGN-BORN POPULATIONUniverse: Foreign-born population
Entry 1990 to March 2000: Entry 1980 to 1989: Entry before 1980:
Naturalized citizen
Not a citizenTotalTotal
Region Naturalized citizen
Not a citizenTotal
Naturalized citizen
Not a citizenTotal
Europe 850 482 65 417 110 32 78 258 204 54Asia 1,125 670 108 562 185 103 82 270 235 35Africa 141 56 0 56 37 37 0 48 41 7Oceania 26 0 0 0 13 0 13 13 9 4Americas: 502 Latin America: 221 Caribbean 15 0 0 0 7 0 7 8 8 0 Central America: 98 Mexico 98 71 19 52 19 19 0 8 8 0 Other Central America 0 0 0 0 0 0 0 0 0 0 South America 108 52 2 50 27 6 21 29 26 3 Northern America 281 118 0 118 36 24 12 127 100 27Born at sea 0 0 0 0 0 0 0 0 0 0
Total 2,644
1995 to March 2000 9351990 to 1994 5141985 to 1989 2051980 to 1984 2291975 to 1979 1561970 to 1974 1211965 to 1969 138Before 1965 346
P22. YEAR OF ENTRY FOR THE
Universe: Foreign-born populationFOREIGN-BORN POPULATION
100%
35.4%19.4%7.8%8.7%5.9%4.6%5.2%
13.1%
Total 21,244Living in an MSA/PMSA in 2000: 21,244 Same house in 1995: 9,398 Central city of this MSA/PMSA 9,398 Remainder of this MSA/PMSA 0 Different house in 1995: 11,846 In United States in 1995: 10,844 Same MSA/PMSA in 1995: 6,761 Moved within same central city 5,138 Moved between central cities 317 Moved from central city to remainder of MSA 0 Moved from remainder of MSA to central city 1,306 Moved within remainder of MSA/PMSA 0 Different MSA/PMSA in 1995: 3,324 Central city in different MSA/PMSA 1,921 Remainder of different MSA/PMSA 1,403 Not in an MSA/PMSA in 1995 759
In Puerto Rico in 1995 0 Elsewhere in 1995 1,002
Not living in an MSA/PMSA in 2000 0
100%100.0%44.2%44.2%0.0%
55.8%51.0%31.8%24.2%1.5%0.0%6.1%0.0%
15.6%9.0%6.6%3.6%
0.0%4.7%
0.0%
PCT22. RESIDENCE IN 1995--MSA/PMSA LEVELUniverse: Population 5 years and over
Total: 22,392
Native: 19,748 Born in state of residence 9,200 Born in other state in the U.S.: 10,103 Northeast 1,893 Midwest 2,630 South 1,559 West 4,021 Born outside the United States: 445 Puerto Rico 15 U.S. Island Areas 26 Born abroad of American parent(s) 404Foreign born: 2,644 Naturalized citizen 1,046 Not a citizen 1,598
100%
88.2%41.1%45.1%8.5%
11.7%7.0%
18.0%2.0%0.1%0.1%1.8%
11.8%4.7%7.1%
P21. PLACE OF BIRTH BY CITIZENSHIP STATUSUniverse: Total population
Total: 21,244Same house in 1995 9,398Different house in 1995: 11,846 In United States in 1995: 10,844 Same city or town: 5,138 Same county 5,138 Different county (same state) 0 Not same city or town: 5,706 Same county 1,174 Different county: 4,532 Same state 1,547 Different state: 2,985 Northeast 432 Midwest 480 South 381 West 1,692 In Puerto Rico in 1995 0 Elsewhere in 1995 1,002
PCT21. RESIDENCE IN 1995
Universe: Population 5 years and over--STATE, COUNTY, PLACE LEVEL
100%44.2%55.8%51.0%24.2%24.2%0.0%
26.9%5.5%
21.3%7.3%
14.1%2.0%2.3%1.8%8.0%0.0%4.7%
Total
Page 43Community Reporting Area LevelRavenna/Bryant
January 2005
Department of Planning and Development with Assistance from Puget Sound Regional Council 7.3

Characteristics of ResidencyCensus 2000, Summary File 3
CRA: Riverview
1,334 553 76 477 486 316 170 295 189 106
PCT20. PLACE OF BIRTH BY YEAR OF ENTRY BY CITIZENSHIP STATUS FOR FOREIGN-BORN POPULATIONUniverse: Foreign-born population
Entry 1990 to March 2000: Entry 1980 to 1989: Entry before 1980:
Naturalized citizen
Not a citizenTotalTotal
Region Naturalized citizen
Not a citizenTotal
Naturalized citizen
Not a citizenTotal
Europe 52 8 0 8 15 0 15 29 21 8Asia 988 397 44 353 380 290 90 211 147 64Africa 121 69 32 37 52 16 36 0 0 0Oceania 0 0 0 0 0 0 0 0 0 0Americas: 173 Latin America: 149 Caribbean 0 0 0 0 0 0 0 0 0 0 Central America: 142 Mexico 142 59 0 59 39 10 29 44 21 23 Other Central America 0 0 0 0 0 0 0 0 0 0 South America 7 7 0 7 0 0 0 0 0 0 Northern America 24 13 0 13 0 0 0 11 0 11Born at sea 0 0 0 0 0 0 0 0 0 0
Total 1,334
1995 to March 2000 2751990 to 1994 2781985 to 1989 2131980 to 1984 2731975 to 1979 1641970 to 1974 351965 to 1969 36Before 1965 60
P22. YEAR OF ENTRY FOR THE
Universe: Foreign-born populationFOREIGN-BORN POPULATION
100%
20.6%20.8%16.0%20.5%12.3%2.6%2.7%4.5%
Total 4,104Living in an MSA/PMSA in 2000: 4,104 Same house in 1995: 2,206 Central city of this MSA/PMSA 2,206 Remainder of this MSA/PMSA 0 Different house in 1995: 1,898 In United States in 1995: 1,759 Same MSA/PMSA in 1995: 1,459 Moved within same central city 1,297 Moved between central cities 16 Moved from central city to remainder of MSA 0 Moved from remainder of MSA to central city 146 Moved within remainder of MSA/PMSA 0 Different MSA/PMSA in 1995: 243 Central city in different MSA/PMSA 155 Remainder of different MSA/PMSA 88 Not in an MSA/PMSA in 1995 57
In Puerto Rico in 1995 0 Elsewhere in 1995 139
Not living in an MSA/PMSA in 2000 0
100%100.0%53.8%53.8%0.0%
46.2%42.9%35.6%31.6%0.4%0.0%3.6%0.0%5.9%3.8%2.1%1.4%
0.0%3.4%
0.0%
PCT22. RESIDENCE IN 1995--MSA/PMSA LEVELUniverse: Population 5 years and over
Total: 4,408
Native: 3,074 Born in state of residence 1,722 Born in other state in the U.S.: 1,297 Northeast 148 Midwest 380 South 288 West 481 Born outside the United States: 55 Puerto Rico 0 U.S. Island Areas 0 Born abroad of American parent(s) 55Foreign born: 1,334 Naturalized citizen 581 Not a citizen 753
100%
69.7%39.1%29.4%3.4%8.6%6.5%
10.9%1.2%0.0%0.0%1.2%
30.3%13.2%17.1%
P21. PLACE OF BIRTH BY CITIZENSHIP STATUSUniverse: Total population
Total: 4,104Same house in 1995 2,206Different house in 1995: 1,898 In United States in 1995: 1,759 Same city or town: 1,297 Same county 1,297 Different county (same state) 0 Not same city or town: 462 Same county 158 Different county: 304 Same state 61 Different state: 243 Northeast 24 Midwest 45 South 79 West 95 In Puerto Rico in 1995 0 Elsewhere in 1995 139
PCT21. RESIDENCE IN 1995
Universe: Population 5 years and over--STATE, COUNTY, PLACE LEVEL
100%53.8%46.2%42.9%31.6%31.6%0.0%
11.3%3.8%7.4%1.5%5.9%0.6%1.1%1.9%2.3%0.0%3.4%
Total
Page 44Community Reporting Area LevelRiverview
January 2005
Department of Planning and Development with Assistance from Puget Sound Regional Council 2.3

Characteristics of ResidencyCensus 2000, Summary File 3
CRA: Roxhill/Westwood
2,506 1,161 168 993 693 350 343 652 577 75
PCT20. PLACE OF BIRTH BY YEAR OF ENTRY BY CITIZENSHIP STATUS FOR FOREIGN-BORN POPULATIONUniverse: Foreign-born population
Entry 1990 to March 2000: Entry 1980 to 1989: Entry before 1980:
Naturalized citizen
Not a citizenTotalTotal
Region Naturalized citizen
Not a citizenTotal
Naturalized citizen
Not a citizenTotal
Europe 239 79 0 79 44 0 44 116 105 11Asia 1,475 638 145 493 483 294 189 354 311 43Africa 125 47 0 47 67 51 16 11 0 11Oceania 7 7 0 7 0 0 0 0 0 0Americas: 660 Latin America: 566 Caribbean 6 0 0 0 6 0 6 0 0 0 Central America: 548 Mexico 525 354 23 331 87 5 82 84 84 0 Other Central America 23 11 0 11 0 0 0 12 12 0 South America 12 2 0 2 0 0 0 10 0 10 Northern America 94 23 0 23 6 0 6 65 65 0Born at sea 0 0 0 0 0 0 0 0 0 0
Total 2,506
1995 to March 2000 7731990 to 1994 3881985 to 1989 3841980 to 1984 3091975 to 1979 2871970 to 1974 811965 to 1969 52Before 1965 232
P22. YEAR OF ENTRY FOR THE
Universe: Foreign-born populationFOREIGN-BORN POPULATION
100%
30.8%15.5%15.3%12.3%11.5%3.2%2.1%9.3%
Total 11,202Living in an MSA/PMSA in 2000: 11,202 Same house in 1995: 5,435 Central city of this MSA/PMSA 5,435 Remainder of this MSA/PMSA 0 Different house in 1995: 5,767 In United States in 1995: 5,160 Same MSA/PMSA in 1995: 3,760 Moved within same central city 2,957 Moved between central cities 29 Moved from central city to remainder of MSA 0 Moved from remainder of MSA to central city 774 Moved within remainder of MSA/PMSA 0 Different MSA/PMSA in 1995: 1,046 Central city in different MSA/PMSA 712 Remainder of different MSA/PMSA 334 Not in an MSA/PMSA in 1995 354
In Puerto Rico in 1995 0 Elsewhere in 1995 607
Not living in an MSA/PMSA in 2000 0
100%100.0%48.5%48.5%0.0%
51.5%46.1%33.6%26.4%0.3%0.0%6.9%0.0%9.3%6.4%3.0%3.2%
0.0%5.4%
0.0%
PCT22. RESIDENCE IN 1995--MSA/PMSA LEVELUniverse: Population 5 years and over
Total: 12,077
Native: 9,571 Born in state of residence 5,319 Born in other state in the U.S.: 4,135 Northeast 535 Midwest 994 South 684 West 1,922 Born outside the United States: 117 Puerto Rico 0 U.S. Island Areas 0 Born abroad of American parent(s) 117Foreign born: 2,506 Naturalized citizen 1,095 Not a citizen 1,411
100%
79.2%44.0%34.2%4.4%8.2%5.7%
15.9%1.0%0.0%0.0%1.0%
20.8%9.1%
11.7%
P21. PLACE OF BIRTH BY CITIZENSHIP STATUSUniverse: Total population
Total: 11,202Same house in 1995 5,435Different house in 1995: 5,767 In United States in 1995: 5,160 Same city or town: 2,957 Same county 2,957 Different county (same state) 0 Not same city or town: 2,203 Same county 733 Different county: 1,470 Same state 399 Different state: 1,071 Northeast 98 Midwest 95 South 184 West 694 In Puerto Rico in 1995 0 Elsewhere in 1995 607
PCT21. RESIDENCE IN 1995
Universe: Population 5 years and over--STATE, COUNTY, PLACE LEVEL
100%48.5%51.5%46.1%26.4%26.4%0.0%
19.7%6.5%
13.1%3.6%9.6%0.9%0.8%1.6%6.2%0.0%5.4%
Total
Page 45Community Reporting Area LevelRoxhill/Westwood
January 2005
Department of Planning and Development with Assistance from Puget Sound Regional Council 2.4

Characteristics of ResidencyCensus 2000, Summary File 3
CRA: Seward Park
2,390 1,260 241 1,019 756 533 223 374 337 37
PCT20. PLACE OF BIRTH BY YEAR OF ENTRY BY CITIZENSHIP STATUS FOR FOREIGN-BORN POPULATIONUniverse: Foreign-born population
Entry 1990 to March 2000: Entry 1980 to 1989: Entry before 1980:
Naturalized citizen
Not a citizenTotalTotal
Region Naturalized citizen
Not a citizenTotal
Naturalized citizen
Not a citizenTotal
Europe 129 9 0 9 8 0 8 112 92 20Asia 1,651 851 175 676 602 409 193 198 185 13Africa 90 48 13 35 36 36 0 6 6 0Oceania 52 46 4 42 6 6 0 0 0 0Americas: 468 Latin America: 413 Caribbean 9 0 0 0 0 0 0 9 9 0 Central America: 306 Mexico 262 211 18 193 51 31 20 0 0 0 Other Central America 44 31 0 31 13 11 2 0 0 0 South America 98 58 31 27 40 40 0 0 0 0 Northern America 55 6 0 6 0 0 0 49 45 4Born at sea 0 0 0 0 0 0 0 0 0 0
Total 2,390
1995 to March 2000 7751990 to 1994 4851985 to 1989 4551980 to 1984 3011975 to 1979 451970 to 1974 1101965 to 1969 19Before 1965 200
P22. YEAR OF ENTRY FOR THE
Universe: Foreign-born populationFOREIGN-BORN POPULATION
100%
32.4%20.3%19.0%12.6%1.9%4.6%0.8%8.4%
Total 8,528Living in an MSA/PMSA in 2000: 8,528 Same house in 1995: 4,987 Central city of this MSA/PMSA 4,987 Remainder of this MSA/PMSA 0 Different house in 1995: 3,541 In United States in 1995: 2,978 Same MSA/PMSA in 1995: 2,117 Moved within same central city 1,704 Moved between central cities 39 Moved from central city to remainder of MSA 0 Moved from remainder of MSA to central city 374 Moved within remainder of MSA/PMSA 0 Different MSA/PMSA in 1995: 734 Central city in different MSA/PMSA 468 Remainder of different MSA/PMSA 266 Not in an MSA/PMSA in 1995 127
In Puerto Rico in 1995 0 Elsewhere in 1995 563
Not living in an MSA/PMSA in 2000 0
100%100.0%58.5%58.5%0.0%
41.5%34.9%24.8%20.0%0.5%0.0%4.4%0.0%8.6%5.5%3.1%1.5%
0.0%6.6%
0.0%
PCT22. RESIDENCE IN 1995--MSA/PMSA LEVELUniverse: Population 5 years and over
Total: 9,230
Native: 6,840 Born in state of residence 3,752 Born in other state in the U.S.: 2,943 Northeast 448 Midwest 772 South 750 West 973 Born outside the United States: 145 Puerto Rico 6 U.S. Island Areas 37 Born abroad of American parent(s) 102Foreign born: 2,390 Naturalized citizen 1,111 Not a citizen 1,279
100%
74.1%40.7%31.9%4.9%8.4%8.1%
10.5%1.6%0.1%0.4%1.1%
25.9%12.0%13.9%
P21. PLACE OF BIRTH BY CITIZENSHIP STATUSUniverse: Total population
Total: 8,528Same house in 1995 4,987Different house in 1995: 3,541 In United States in 1995: 2,978 Same city or town: 1,704 Same county 1,704 Different county (same state) 0 Not same city or town: 1,274 Same county 379 Different county: 895 Same state 156 Different state: 739 Northeast 106 Midwest 97 South 84 West 452 In Puerto Rico in 1995 0 Elsewhere in 1995 563
PCT21. RESIDENCE IN 1995
Universe: Population 5 years and over--STATE, COUNTY, PLACE LEVEL
100%58.5%41.5%34.9%20.0%20.0%0.0%
14.9%4.4%
10.5%1.8%8.7%1.2%1.1%1.0%5.3%0.0%6.6%
Total
Page 46Community Reporting Area LevelSeward Park
January 2005
Department of Planning and Development with Assistance from Puget Sound Regional Council 4.3

Characteristics of ResidencyCensus 2000, Summary File 3
CRA: South Beacon Hill/NewHolly
5,476 2,696 834 1,862 1,724 984 740 1,056 892 164
PCT20. PLACE OF BIRTH BY YEAR OF ENTRY BY CITIZENSHIP STATUS FOR FOREIGN-BORN POPULATIONUniverse: Foreign-born population
Entry 1990 to March 2000: Entry 1980 to 1989: Entry before 1980:
Naturalized citizen
Not a citizenTotalTotal
Region Naturalized citizen
Not a citizenTotal
Naturalized citizen
Not a citizenTotal
Europe 64 36 0 36 0 0 0 28 28 0Asia 4,226 1,838 678 1,160 1,472 902 570 916 831 85Africa 689 540 130 410 130 57 73 19 0 19Oceania 55 19 0 19 16 11 5 20 6 14Americas: 442 Latin America: 429 Caribbean 10 7 0 7 0 0 0 3 3 0 Central America: 399 Mexico 355 212 26 186 96 14 82 47 14 33 Other Central America 44 44 0 44 0 0 0 0 0 0 South America 20 0 0 0 10 0 10 10 10 0 Northern America 13 0 0 0 0 0 0 13 0 13Born at sea 0 0 0 0 0 0 0 0 0 0
Total 5,476
1995 to March 2000 1,0821990 to 1994 1,6141985 to 1989 9141980 to 1984 8101975 to 1979 5771970 to 1974 1911965 to 1969 114Before 1965 174
P22. YEAR OF ENTRY FOR THE
Universe: Foreign-born populationFOREIGN-BORN POPULATION
100%
19.8%29.5%16.7%14.8%10.5%3.5%2.1%3.2%
Total 10,668Living in an MSA/PMSA in 2000: 10,668 Same house in 1995: 5,546 Central city of this MSA/PMSA 5,546 Remainder of this MSA/PMSA 0 Different house in 1995: 5,122 In United States in 1995: 4,183 Same MSA/PMSA in 1995: 3,432 Moved within same central city 2,965 Moved between central cities 51 Moved from central city to remainder of MSA 0 Moved from remainder of MSA to central city 416 Moved within remainder of MSA/PMSA 0 Different MSA/PMSA in 1995: 645 Central city in different MSA/PMSA 486 Remainder of different MSA/PMSA 159 Not in an MSA/PMSA in 1995 106
In Puerto Rico in 1995 0 Elsewhere in 1995 939
Not living in an MSA/PMSA in 2000 0
100%100.0%52.0%52.0%0.0%
48.0%39.2%32.2%27.8%0.5%0.0%3.9%0.0%6.0%4.6%1.5%1.0%
0.0%8.8%
0.0%
PCT22. RESIDENCE IN 1995--MSA/PMSA LEVELUniverse: Population 5 years and over
Total: 11,452
Native: 5,976 Born in state of residence 3,789 Born in other state in the U.S.: 1,970 Northeast 159 Midwest 484 South 759 West 568 Born outside the United States: 217 Puerto Rico 8 U.S. Island Areas 107 Born abroad of American parent(s) 102Foreign born: 5,476 Naturalized citizen 2,710 Not a citizen 2,766
100%
52.2%33.1%17.2%1.4%4.2%6.6%5.0%1.9%0.1%0.9%0.9%
47.8%23.7%24.2%
P21. PLACE OF BIRTH BY CITIZENSHIP STATUSUniverse: Total population
Total: 10,668Same house in 1995 5,546Different house in 1995: 5,122 In United States in 1995: 4,183 Same city or town: 2,965 Same county 2,965 Different county (same state) 0 Not same city or town: 1,218 Same county 413 Different county: 805 Same state 179 Different state: 626 Northeast 86 Midwest 20 South 85 West 435 In Puerto Rico in 1995 0 Elsewhere in 1995 939
PCT21. RESIDENCE IN 1995
Universe: Population 5 years and over--STATE, COUNTY, PLACE LEVEL
100%52.0%48.0%39.2%27.8%27.8%0.0%
11.4%3.9%7.5%1.7%5.9%0.8%0.2%0.8%4.1%0.0%8.8%
Total
Page 47Community Reporting Area LevelSouth Beacon Hill/NewHolly
January 2005
Department of Planning and Development with Assistance from Puget Sound Regional Council 3.4

Characteristics of ResidencyCensus 2000, Summary File 3
CRA: South Park
1,250 808 136 672 346 164 182 96 42 54
PCT20. PLACE OF BIRTH BY YEAR OF ENTRY BY CITIZENSHIP STATUS FOR FOREIGN-BORN POPULATIONUniverse: Foreign-born population
Entry 1990 to March 2000: Entry 1980 to 1989: Entry before 1980:
Naturalized citizen
Not a citizenTotalTotal
Region Naturalized citizen
Not a citizenTotal
Naturalized citizen
Not a citizenTotal
Europe 15 0 0 0 0 0 0 15 0 15Asia 423 207 76 131 188 114 74 28 28 0Africa 0 0 0 0 0 0 0 0 0 0Oceania 12 12 0 12 0 0 0 0 0 0Americas: 800 Latin America: 794 Caribbean 8 0 0 0 8 0 8 0 0 0 Central America: 749 Mexico 701 535 32 503 119 27 92 47 14 33 Other Central America 48 26 0 26 22 14 8 0 0 0 South America 37 28 28 0 9 9 0 0 0 0 Northern America 6 0 0 0 0 0 0 6 0 6Born at sea 0 0 0 0 0 0 0 0 0 0
Total 1,250
1995 to March 2000 4841990 to 1994 3241985 to 1989 691980 to 1984 2771975 to 1979 361970 to 1974 231965 to 1969 25Before 1965 12
P22. YEAR OF ENTRY FOR THE
Universe: Foreign-born populationFOREIGN-BORN POPULATION
100%
38.7%25.9%5.5%
22.2%2.9%1.8%2.0%1.0%
Total 3,380Living in an MSA/PMSA in 2000: 3,380 Same house in 1995: 1,526 Central city of this MSA/PMSA 1,526 Remainder of this MSA/PMSA 0 Different house in 1995: 1,854 In United States in 1995: 1,571 Same MSA/PMSA in 1995: 1,241 Moved within same central city 844 Moved between central cities 4 Moved from central city to remainder of MSA 0 Moved from remainder of MSA to central city 393 Moved within remainder of MSA/PMSA 0 Different MSA/PMSA in 1995: 209 Central city in different MSA/PMSA 130 Remainder of different MSA/PMSA 79 Not in an MSA/PMSA in 1995 121
In Puerto Rico in 1995 0 Elsewhere in 1995 283
Not living in an MSA/PMSA in 2000 0
100%100.0%45.1%45.1%0.0%
54.9%46.5%36.7%25.0%0.1%0.0%
11.6%0.0%6.2%3.8%2.3%3.6%
0.0%8.4%
0.0%
PCT22. RESIDENCE IN 1995--MSA/PMSA LEVELUniverse: Population 5 years and over
Total: 3,717
Native: 2,467 Born in state of residence 1,459 Born in other state in the U.S.: 1,000 Northeast 53 Midwest 310 South 227 West 410 Born outside the United States: 8 Puerto Rico 0 U.S. Island Areas 0 Born abroad of American parent(s) 8Foreign born: 1,250 Naturalized citizen 342 Not a citizen 908
100%
66.4%39.3%26.9%1.4%8.3%6.1%
11.0%0.2%0.0%0.0%0.2%
33.6%9.2%
24.4%
P21. PLACE OF BIRTH BY CITIZENSHIP STATUSUniverse: Total population
Total: 3,380Same house in 1995 1,526Different house in 1995: 1,854 In United States in 1995: 1,571 Same city or town: 844 Same county 844 Different county (same state) 0 Not same city or town: 727 Same county 392 Different county: 335 Same state 112 Different state: 223 Northeast 0 Midwest 19 South 20 West 184 In Puerto Rico in 1995 0 Elsewhere in 1995 283
PCT21. RESIDENCE IN 1995
Universe: Population 5 years and over--STATE, COUNTY, PLACE LEVEL
100%45.1%54.9%46.5%25.0%25.0%0.0%
21.5%11.6%9.9%3.3%6.6%0.0%0.6%0.6%5.4%0.0%8.4%
Total
Page 48Community Reporting Area LevelSouth Park
January 2005
Department of Planning and Development with Assistance from Puget Sound Regional Council 3.1

Characteristics of ResidencyCensus 2000, Summary File 3
CRA: Sunset Hill/Loyal Heights
1,081 323 39 284 187 106 81 571 389 182
PCT20. PLACE OF BIRTH BY YEAR OF ENTRY BY CITIZENSHIP STATUS FOR FOREIGN-BORN POPULATIONUniverse: Foreign-born population
Entry 1990 to March 2000: Entry 1980 to 1989: Entry before 1980:
Naturalized citizen
Not a citizenTotalTotal
Region Naturalized citizen
Not a citizenTotal
Naturalized citizen
Not a citizenTotal
Europe 484 83 34 49 46 10 36 355 238 117Asia 256 85 0 85 75 63 12 96 78 18Africa 41 28 0 28 13 13 0 0 0 0Oceania 5 5 0 5 0 0 0 0 0 0Americas: 295 Latin America: 165 Caribbean 13 13 0 13 0 0 0 0 0 0 Central America: 87 Mexico 39 34 0 34 5 0 5 0 0 0 Other Central America 48 0 0 0 28 0 28 20 13 7 South America 65 22 0 22 20 20 0 23 7 16 Northern America 130 53 5 48 0 0 0 77 53 24Born at sea 0 0 0 0 0 0 0 0 0 0
Total 1,081
1995 to March 2000 1961990 to 1994 1271985 to 1989 1651980 to 1984 221975 to 1979 771970 to 1974 491965 to 1969 99Before 1965 346
P22. YEAR OF ENTRY FOR THE
Universe: Foreign-born populationFOREIGN-BORN POPULATION
100%
18.1%11.7%15.3%2.0%7.1%4.5%9.2%
32.0%
Total 12,598Living in an MSA/PMSA in 2000: 12,598 Same house in 1995: 6,472 Central city of this MSA/PMSA 6,472 Remainder of this MSA/PMSA 0 Different house in 1995: 6,126 In United States in 1995: 5,699 Same MSA/PMSA in 1995: 3,893 Moved within same central city 3,104 Moved between central cities 46 Moved from central city to remainder of MSA 0 Moved from remainder of MSA to central city 743 Moved within remainder of MSA/PMSA 0 Different MSA/PMSA in 1995: 1,521 Central city in different MSA/PMSA 1,028 Remainder of different MSA/PMSA 493 Not in an MSA/PMSA in 1995 285
In Puerto Rico in 1995 13 Elsewhere in 1995 414
Not living in an MSA/PMSA in 2000 0
100%100.0%51.4%51.4%0.0%
48.6%45.2%30.9%24.6%0.4%0.0%5.9%0.0%
12.1%8.2%3.9%2.3%
0.1%3.3%
0.0%
PCT22. RESIDENCE IN 1995--MSA/PMSA LEVELUniverse: Population 5 years and over
Total: 13,251
Native: 12,170 Born in state of residence 6,381 Born in other state in the U.S.: 5,589 Northeast 966 Midwest 1,867 South 752 West 2,004 Born outside the United States: 200 Puerto Rico 0 U.S. Island Areas 0 Born abroad of American parent(s) 200Foreign born: 1,081 Naturalized citizen 534 Not a citizen 547
100%
91.8%48.2%42.2%7.3%
14.1%5.7%
15.1%1.5%0.0%0.0%1.5%8.2%4.0%4.1%
P21. PLACE OF BIRTH BY CITIZENSHIP STATUSUniverse: Total population
Total: 12,598Same house in 1995 6,472Different house in 1995: 6,126 In United States in 1995: 5,699 Same city or town: 3,104 Same county 3,104 Different county (same state) 0 Not same city or town: 2,595 Same county 652 Different county: 1,943 Same state 596 Different state: 1,347 Northeast 216 Midwest 197 South 218 West 716 In Puerto Rico in 1995 13 Elsewhere in 1995 414
PCT21. RESIDENCE IN 1995
Universe: Population 5 years and over--STATE, COUNTY, PLACE LEVEL
100%51.4%48.6%45.2%24.6%24.6%0.0%
20.6%5.2%
15.4%4.7%
10.7%1.7%1.6%1.7%5.7%0.1%3.3%
Total
Page 49Community Reporting Area LevelSunset Hill/Loyal Heights
January 2005
Department of Planning and Development with Assistance from Puget Sound Regional Council 10.3

Characteristics of ResidencyCensus 2000, Summary File 3
CRA: University District
2,945 1,903 188 1,715 762 449 313 280 214 66
PCT20. PLACE OF BIRTH BY YEAR OF ENTRY BY CITIZENSHIP STATUS FOR FOREIGN-BORN POPULATIONUniverse: Foreign-born population
Entry 1990 to March 2000: Entry 1980 to 1989: Entry before 1980:
Naturalized citizen
Not a citizenTotalTotal
Region Naturalized citizen
Not a citizenTotal
Naturalized citizen
Not a citizenTotal
Europe 535 351 54 297 108 68 40 76 46 30Asia 2,052 1,340 134 1,206 577 347 230 135 111 24Africa 44 36 0 36 0 0 0 8 8 0Oceania 11 11 0 11 0 0 0 0 0 0Americas: 303 Latin America: 229 Caribbean 0 0 0 0 0 0 0 0 0 0 Central America: 190 Mexico 81 70 0 70 5 0 5 6 0 6 Other Central America 109 33 0 33 38 8 30 38 38 0 South America 39 32 0 32 7 7 0 0 0 0 Northern America 74 30 0 30 27 19 8 17 11 6Born at sea 0 0 0 0 0 0 0 0 0 0
Total 2,945
1995 to March 2000 1,3481990 to 1994 5551985 to 1989 3821980 to 1984 3801975 to 1979 1111970 to 1974 671965 to 1969 53Before 1965 49
P22. YEAR OF ENTRY FOR THE
Universe: Foreign-born populationFOREIGN-BORN POPULATION
100%
45.8%18.8%13.0%12.9%3.8%2.3%1.8%1.7%
Total 16,641Living in an MSA/PMSA in 2000: 16,641 Same house in 1995: 2,647 Central city of this MSA/PMSA 2,647 Remainder of this MSA/PMSA 0 Different house in 1995: 13,994 In United States in 1995: 12,107 Same MSA/PMSA in 1995: 5,367 Moved within same central city 2,039 Moved between central cities 632 Moved from central city to remainder of MSA 0 Moved from remainder of MSA to central city 2,696 Moved within remainder of MSA/PMSA 0 Different MSA/PMSA in 1995: 5,396 Central city in different MSA/PMSA 2,895 Remainder of different MSA/PMSA 2,501 Not in an MSA/PMSA in 1995 1,344
In Puerto Rico in 1995 0 Elsewhere in 1995 1,887
Not living in an MSA/PMSA in 2000 0
100%100.0%15.9%15.9%0.0%
84.1%72.8%32.3%12.3%3.8%0.0%
16.2%0.0%
32.4%17.4%15.0%8.1%
0.0%11.3%
0.0%
PCT22. RESIDENCE IN 1995--MSA/PMSA LEVELUniverse: Population 5 years and over
Total: 16,810
Native: 13,865 Born in state of residence 6,460 Born in other state in the U.S.: 6,951 Northeast 749 Midwest 1,484 South 1,054 West 3,664 Born outside the United States: 454 Puerto Rico 0 U.S. Island Areas 98 Born abroad of American parent(s) 356Foreign born: 2,945 Naturalized citizen 851 Not a citizen 2,094
100%
82.5%38.4%41.4%4.5%8.8%6.3%
21.8%2.7%0.0%0.6%2.1%
17.5%5.1%
12.5%
P21. PLACE OF BIRTH BY CITIZENSHIP STATUSUniverse: Total population
Total: 16,641Same house in 1995 2,647Different house in 1995: 13,994 In United States in 1995: 12,107 Same city or town: 2,039 Same county 2,039 Different county (same state) 0 Not same city or town: 10,068 Same county 2,544 Different county: 7,524 Same state 4,325 Different state: 3,199 Northeast 344 Midwest 461 South 467 West 1,927 In Puerto Rico in 1995 0 Elsewhere in 1995 1,887
PCT21. RESIDENCE IN 1995
Universe: Population 5 years and over--STATE, COUNTY, PLACE LEVEL
100%15.9%84.1%72.8%12.3%12.3%0.0%
60.5%15.3%45.2%26.0%19.2%2.1%2.8%2.8%
11.6%0.0%
11.3%
Total
Page 50Community Reporting Area LevelUniversity District
January 2005
Department of Planning and Development with Assistance from Puget Sound Regional Council 7.2

Characteristics of ResidencyCensus 2000, Summary File 3
CRA: Wallingford
1,728 760 107 653 411 209 202 557 414 143
PCT20. PLACE OF BIRTH BY YEAR OF ENTRY BY CITIZENSHIP STATUS FOR FOREIGN-BORN POPULATIONUniverse: Foreign-born population
Entry 1990 to March 2000: Entry 1980 to 1989: Entry before 1980:
Naturalized citizen
Not a citizenTotalTotal
Region Naturalized citizen
Not a citizenTotal
Naturalized citizen
Not a citizenTotal
Europe 627 248 42 206 134 48 86 245 146 99Asia 694 327 44 283 187 136 51 180 166 14Africa 44 40 6 34 4 4 0 0 0 0Oceania 57 30 0 30 22 0 22 5 0 5Americas: 306 Latin America: 103 Caribbean 17 0 0 0 0 0 0 17 17 0 Central America: 49 Mexico 26 0 0 0 14 0 14 12 5 7 Other Central America 23 13 4 9 5 5 0 5 0 5 South America 37 17 0 17 16 16 0 4 0 4 Northern America 203 85 11 74 29 0 29 89 80 9Born at sea 0 0 0 0 0 0 0 0 0 0
Total 1,728
1995 to March 2000 5241990 to 1994 2361985 to 1989 2091980 to 1984 2021975 to 1979 1381970 to 1974 691965 to 1969 93Before 1965 257
P22. YEAR OF ENTRY FOR THE
Universe: Foreign-born populationFOREIGN-BORN POPULATION
100%
30.3%13.7%12.1%11.7%8.0%4.0%5.4%
14.9%
Total 13,866Living in an MSA/PMSA in 2000: 13,866 Same house in 1995: 4,501 Central city of this MSA/PMSA 4,501 Remainder of this MSA/PMSA 0 Different house in 1995: 9,365 In United States in 1995: 8,700 Same MSA/PMSA in 1995: 4,418 Moved within same central city 3,275 Moved between central cities 221 Moved from central city to remainder of MSA 0 Moved from remainder of MSA to central city 922 Moved within remainder of MSA/PMSA 0 Different MSA/PMSA in 1995: 3,504 Central city in different MSA/PMSA 2,417 Remainder of different MSA/PMSA 1,087 Not in an MSA/PMSA in 1995 778
In Puerto Rico in 1995 0 Elsewhere in 1995 665
Not living in an MSA/PMSA in 2000 0
100%100.0%32.5%32.5%0.0%
67.5%62.7%31.9%23.6%1.6%0.0%6.6%0.0%
25.3%17.4%7.8%5.6%
0.0%4.8%
0.0%
PCT22. RESIDENCE IN 1995--MSA/PMSA LEVELUniverse: Population 5 years and over
Total: 14,322
Native: 12,594 Born in state of residence 4,805 Born in other state in the U.S.: 7,457 Northeast 1,451 Midwest 2,127 South 962 West 2,917 Born outside the United States: 332 Puerto Rico 11 U.S. Island Areas 50 Born abroad of American parent(s) 271Foreign born: 1,728 Naturalized citizen 730 Not a citizen 998
100%
87.9%33.5%52.1%10.1%14.9%6.7%
20.4%2.3%0.1%0.3%1.9%
12.1%5.1%7.0%
P21. PLACE OF BIRTH BY CITIZENSHIP STATUSUniverse: Total population
Total: 13,866Same house in 1995 4,501Different house in 1995: 9,365 In United States in 1995: 8,700 Same city or town: 3,275 Same county 3,275 Different county (same state) 0 Not same city or town: 5,425 Same county 849 Different county: 4,576 Same state 1,570 Different state: 3,006 Northeast 413 Midwest 694 South 411 West 1,488 In Puerto Rico in 1995 0 Elsewhere in 1995 665
PCT21. RESIDENCE IN 1995
Universe: Population 5 years and over--STATE, COUNTY, PLACE LEVEL
100%32.5%67.5%62.7%23.6%23.6%0.0%
39.1%6.1%
33.0%11.3%21.7%3.0%5.0%3.0%
10.7%0.0%4.8%
Total
Page 51Community Reporting Area LevelWallingford
January 2005
Department of Planning and Development with Assistance from Puget Sound Regional Council 11.2

Characteristics of ResidencyCensus 2000, Summary File 3
CRA: Wedgwood/View Ridge
1,991 717 181 536 553 382 171 721 607 114
PCT20. PLACE OF BIRTH BY YEAR OF ENTRY BY CITIZENSHIP STATUS FOR FOREIGN-BORN POPULATIONUniverse: Foreign-born population
Entry 1990 to March 2000: Entry 1980 to 1989: Entry before 1980:
Naturalized citizen
Not a citizenTotalTotal
Region Naturalized citizen
Not a citizenTotal
Naturalized citizen
Not a citizenTotal
Europe 416 116 23 93 104 58 46 196 163 33Asia 1,102 431 114 317 298 228 70 373 325 48Africa 143 82 7 75 55 46 9 6 6 0Oceania 24 19 9 10 0 0 0 5 5 0Americas: 306 Latin America: 155 Caribbean 26 10 0 10 0 0 0 16 16 0 Central America: 86 Mexico 46 9 9 0 30 10 20 7 7 0 Other Central America 40 17 7 10 18 9 9 5 5 0 South America 43 0 0 0 31 31 0 12 12 0 Northern America 151 33 12 21 17 0 17 101 68 33Born at sea 0 0 0 0 0 0 0 0 0 0
Total 1,991
1995 to March 2000 3821990 to 1994 3351985 to 1989 3071980 to 1984 2461975 to 1979 1581970 to 1974 1081965 to 1969 122Before 1965 333
P22. YEAR OF ENTRY FOR THE
Universe: Foreign-born populationFOREIGN-BORN POPULATION
100%
19.2%16.8%15.4%12.4%7.9%5.4%6.1%
16.7%
Total 13,776Living in an MSA/PMSA in 2000: 13,776 Same house in 1995: 8,300 Central city of this MSA/PMSA 8,300 Remainder of this MSA/PMSA 0 Different house in 1995: 5,476 In United States in 1995: 5,098 Same MSA/PMSA in 1995: 3,513 Moved within same central city 2,795 Moved between central cities 94 Moved from central city to remainder of MSA 0 Moved from remainder of MSA to central city 624 Moved within remainder of MSA/PMSA 0 Different MSA/PMSA in 1995: 1,324 Central city in different MSA/PMSA 724 Remainder of different MSA/PMSA 600 Not in an MSA/PMSA in 1995 261
In Puerto Rico in 1995 0 Elsewhere in 1995 378
Not living in an MSA/PMSA in 2000 0
100%100.0%60.2%60.2%0.0%
39.8%37.0%25.5%20.3%0.7%0.0%4.5%0.0%9.6%5.3%4.4%1.9%
0.0%2.7%
0.0%
PCT22. RESIDENCE IN 1995--MSA/PMSA LEVELUniverse: Population 5 years and over
Total: 14,549
Native: 12,558 Born in state of residence 6,383 Born in other state in the U.S.: 5,862 Northeast 1,145 Midwest 1,807 South 721 West 2,189 Born outside the United States: 313 Puerto Rico 9 U.S. Island Areas 24 Born abroad of American parent(s) 280Foreign born: 1,991 Naturalized citizen 1,170 Not a citizen 821
100%
86.3%43.9%40.3%7.9%
12.4%5.0%
15.0%2.2%0.1%0.2%1.9%
13.7%8.0%5.6%
P21. PLACE OF BIRTH BY CITIZENSHIP STATUSUniverse: Total population
Total: 13,776Same house in 1995 8,300Different house in 1995: 5,476 In United States in 1995: 5,098 Same city or town: 2,795 Same county 2,795 Different county (same state) 0 Not same city or town: 2,303 Same county 493 Different county: 1,810 Same state 565 Different state: 1,245 Northeast 209 Midwest 184 South 227 West 625 In Puerto Rico in 1995 0 Elsewhere in 1995 378
PCT21. RESIDENCE IN 1995
Universe: Population 5 years and over--STATE, COUNTY, PLACE LEVEL
100%60.2%39.8%37.0%20.3%20.3%0.0%
16.7%3.6%
13.1%4.1%9.0%1.5%1.3%1.6%4.5%0.0%2.7%
Total
Page 52Community Reporting Area LevelWedgwood/View Ridge
January 2005
Department of Planning and Development with Assistance from Puget Sound Regional Council 7.4

Characteristics of ResidencyCensus 2000, Summary File 3
CRA: West Seattle Junction/Genesee Hill
1,330 432 56 376 292 128 164 606 473 133
PCT20. PLACE OF BIRTH BY YEAR OF ENTRY BY CITIZENSHIP STATUS FOR FOREIGN-BORN POPULATIONUniverse: Foreign-born population
Entry 1990 to March 2000: Entry 1980 to 1989: Entry before 1980:
Naturalized citizen
Not a citizenTotalTotal
Region Naturalized citizen
Not a citizenTotal
Naturalized citizen
Not a citizenTotal
Europe 429 80 6 74 64 8 56 285 232 53Asia 472 197 41 156 134 95 39 141 125 16Africa 49 19 9 10 17 17 0 13 13 0Oceania 34 26 0 26 0 0 0 8 8 0Americas: 346 Latin America: 180 Caribbean 29 19 0 19 0 0 0 10 10 0 Central America: 128 Mexico 108 27 0 27 38 0 38 43 10 33 Other Central America 20 11 0 11 0 0 0 9 9 0 South America 23 0 0 0 8 8 0 15 15 0 Northern America 166 53 0 53 31 0 31 82 51 31Born at sea 0 0 0 0 0 0 0 0 0 0
Total 1,330
1995 to March 2000 2621990 to 1994 1701985 to 1989 1661980 to 1984 1261975 to 1979 1761970 to 1974 421965 to 1969 34Before 1965 354
P22. YEAR OF ENTRY FOR THE
Universe: Foreign-born populationFOREIGN-BORN POPULATION
100%
19.7%12.8%12.5%9.5%
13.2%3.2%2.6%
26.6%
Total 15,438Living in an MSA/PMSA in 2000: 15,438 Same house in 1995: 8,380 Central city of this MSA/PMSA 8,380 Remainder of this MSA/PMSA 0 Different house in 1995: 7,058 In United States in 1995: 6,717 Same MSA/PMSA in 1995: 4,750 Moved within same central city 3,801 Moved between central cities 183 Moved from central city to remainder of MSA 0 Moved from remainder of MSA to central city 766 Moved within remainder of MSA/PMSA 0 Different MSA/PMSA in 1995: 1,625 Central city in different MSA/PMSA 996 Remainder of different MSA/PMSA 629 Not in an MSA/PMSA in 1995 342
In Puerto Rico in 1995 0 Elsewhere in 1995 341
Not living in an MSA/PMSA in 2000 0
100%100.0%54.3%54.3%0.0%
45.7%43.5%30.8%24.6%1.2%0.0%5.0%0.0%
10.5%6.5%4.1%2.2%
0.0%2.2%
0.0%
PCT22. RESIDENCE IN 1995--MSA/PMSA LEVELUniverse: Population 5 years and over
Total: 16,312
Native: 14,982 Born in state of residence 7,666 Born in other state in the U.S.: 6,998 Northeast 974 Midwest 2,514 South 952 West 2,558 Born outside the United States: 318 Puerto Rico 27 U.S. Island Areas 10 Born abroad of American parent(s) 281Foreign born: 1,330 Naturalized citizen 657 Not a citizen 673
100%
91.8%47.0%42.9%6.0%
15.4%5.8%
15.7%1.9%0.2%0.1%1.7%8.2%4.0%4.1%
P21. PLACE OF BIRTH BY CITIZENSHIP STATUSUniverse: Total population
Total: 15,438Same house in 1995 8,380Different house in 1995: 7,058 In United States in 1995: 6,717 Same city or town: 3,801 Same county 3,801 Different county (same state) 0 Not same city or town: 2,916 Same county 838 Different county: 2,078 Same state 579 Different state: 1,499 Northeast 156 Midwest 238 South 305 West 800 In Puerto Rico in 1995 0 Elsewhere in 1995 341
PCT21. RESIDENCE IN 1995
Universe: Population 5 years and over--STATE, COUNTY, PLACE LEVEL
100%54.3%45.7%43.5%24.6%24.6%0.0%
18.9%5.4%
13.5%3.8%9.7%1.0%1.5%2.0%5.2%0.0%2.2%
Total
Page 53Community Reporting Area LevelWest Seattle Junction/Genesee Hill
January 2005
Department of Planning and Development with Assistance from Puget Sound Regional Council 1.3

Characteristics of ResidencyCensus 2000, Summary File 3
CRA: Whittier Heights
981 294 36 258 226 104 122 461 358 103
PCT20. PLACE OF BIRTH BY YEAR OF ENTRY BY CITIZENSHIP STATUS FOR FOREIGN-BORN POPULATIONUniverse: Foreign-born population
Entry 1990 to March 2000: Entry 1980 to 1989: Entry before 1980:
Naturalized citizen
Not a citizenTotalTotal
Region Naturalized citizen
Not a citizenTotal
Naturalized citizen
Not a citizenTotal
Europe 381 100 27 73 64 30 34 217 156 61Asia 225 77 0 77 66 48 18 82 82 0Africa 65 30 9 21 10 0 10 25 25 0Oceania 17 0 0 0 0 0 0 17 9 8Americas: 293 Latin America: 154 Caribbean 24 0 0 0 0 0 0 24 15 9 Central America: 94 Mexico 26 7 0 7 19 0 19 0 0 0 Other Central America 68 33 0 33 35 18 17 0 0 0 South America 36 27 0 27 9 0 9 0 0 0 Northern America 139 20 0 20 23 8 15 96 71 25Born at sea 0 0 0 0 0 0 0 0 0 0
Total 981
1995 to March 2000 1371990 to 1994 1571985 to 1989 1511980 to 1984 751975 to 1979 631970 to 1974 771965 to 1969 41Before 1965 280
P22. YEAR OF ENTRY FOR THE
Universe: Foreign-born populationFOREIGN-BORN POPULATION
100%
14.0%16.0%15.4%7.6%6.4%7.8%4.2%
28.5%
Total 10,501Living in an MSA/PMSA in 2000: 10,501 Same house in 1995: 4,932 Central city of this MSA/PMSA 4,932 Remainder of this MSA/PMSA 0 Different house in 1995: 5,569 In United States in 1995: 5,318 Same MSA/PMSA in 1995: 3,531 Moved within same central city 2,885 Moved between central cities 147 Moved from central city to remainder of MSA 0 Moved from remainder of MSA to central city 499 Moved within remainder of MSA/PMSA 0 Different MSA/PMSA in 1995: 1,431 Central city in different MSA/PMSA 1,057 Remainder of different MSA/PMSA 374 Not in an MSA/PMSA in 1995 356
In Puerto Rico in 1995 8 Elsewhere in 1995 243
Not living in an MSA/PMSA in 2000 0
100%100.0%47.0%47.0%0.0%
53.0%50.6%33.6%27.5%1.4%0.0%4.8%0.0%
13.6%10.1%3.6%3.4%
0.1%2.3%
0.0%
PCT22. RESIDENCE IN 1995--MSA/PMSA LEVELUniverse: Population 5 years and over
Total: 11,082
Native: 10,101 Born in state of residence 4,407 Born in other state in the U.S.: 5,488 Northeast 808 Midwest 1,626 South 879 West 2,175 Born outside the United States: 206 Puerto Rico 0 U.S. Island Areas 18 Born abroad of American parent(s) 188Foreign born: 981 Naturalized citizen 498 Not a citizen 483
100%
91.1%39.8%49.5%7.3%
14.7%7.9%
19.6%1.9%0.0%0.2%1.7%8.9%4.5%4.4%
P21. PLACE OF BIRTH BY CITIZENSHIP STATUSUniverse: Total population
Total: 10,501Same house in 1995 4,932Different house in 1995: 5,569 In United States in 1995: 5,318 Same city or town: 2,885 Same county 2,885 Different county (same state) 0 Not same city or town: 2,433 Same county 457 Different county: 1,976 Same state 599 Different state: 1,377 Northeast 89 Midwest 262 South 279 West 747 In Puerto Rico in 1995 8 Elsewhere in 1995 243
PCT21. RESIDENCE IN 1995
Universe: Population 5 years and over--STATE, COUNTY, PLACE LEVEL
100%47.0%53.0%50.6%27.5%27.5%0.0%
23.2%4.4%
18.8%5.7%
13.1%0.8%2.5%2.7%7.1%0.1%2.3%
Total
Page 54Community Reporting Area LevelWhittier Heights
January 2005
Department of Planning and Development with Assistance from Puget Sound Regional Council 10.2