characteristics of plasma polymerized membrane from octamethyltrisiloxane and its application to the...
TRANSCRIPT

Journal of Membrane Science, 88 (1994) 85-92
Elsevier Science B.V., Amsterdam 85
Characteristics of plasma polymerized membrane from octamethyltrisiloxane and its application to the pervaporation of ethanol-water mixture
Hideto Matsuyama*, Ayao Kariya and Masaaki Teramoto Department of Chemistry and Materials Technology, Kyoto Institute of Technology, Matsugasaki, Sakyo-ku, Kyoto 606 (Japan)
(Received March 2,1993; accepted in revised form October 8,1993)
Abstract
Plasma polymerized membranes were prepared from octamethyltrisiloxane and were applied to the pervaporation of ethanol-water mixture. The structure of the plasma polymer was analyzed by IR, XPS and solid-state NMR. When the parameter W/FM (W, power input; F, monomer flow rate; M monomer molecular weight) was small, the plasma polymer considerably preserved the monomeric structure. With increasing W/FM, both the extent of the cross-linked structure and the amount of oxygen incorporated in the polymer increased. In the relationship between the C/Si ratio analyzed by XPS measurements and W/FM, there was a minimum. The correlations between the pervaporation performances and W/ FM aa well as between the deposition rates and W/FM showed single trends. Although permeation rates decreased monotonously with the increase of W/FM, the separation coeffrcienta showed a maximum. The value of W/FM at which the separation coefficient was maximum corresponded to the value at which the C/Si ratio was minimum. The separation coefficient and permeation rate obtained were 5.1 and 6.2 kg/m* h, respectively. The high permeation rate was characteristic for the plasma polymerized membranes.
Key words: plasma polymerization; composite membrane; membrane preparation and structure; octamethyltrisiloxane; pervaporation of ethanol-water
Introduction
A polymeric material can be deposited on a substrate by glow discharge of an organic va- por, i.e., plasma polymerization [1,2]. The plasma polymerization has the advantages that not only compounds having double bonds but also most other organic compounds can be po- lymerized, and that the obtained polymeric films are thin, uniform and pinhole-free. Many
VTo whom correspondence should be addressed.
studies have been performed on the application of this technique to optical or medical mate- rials, resist films and separation membranes [3-51.
On the other hand, pervaporation is well known as an efficient separation method for organic liquid mixtures, and is superior to dis- tillation, especially in the separations of axeo- tropic mixtures or mixture8 of components having similar boiling points. With respect to the separation of ethanol-water mixtures, water selective membranes are already used commer-
0376-7388/94/$07.00 0 1994 Elsevier Science B.V. All rights reserved. SSDZ0376-7388(93)E0170-0

86 H. Matsuyama et al. /J. Membrane Sci. 88 (1994) 85-92
cially, while there are relatively few studies on the ethanol selective membranes in spite of the large industrial demand, e.g., for the recovery of ethanol from fermented ethanol solution. Membranes in which silicon [6,7] or fluorine [8,9] is incorporated for the purpose of in- creasing the hydrophobicity were reported as ethanol permselective membranes.
In this work, the plasma polymerized mem- brane was prepared from octamethyltrisilox- ane, and the ethanol permselectivity of the pre- pared membrane was examined in the pervaporation of ethanol-water. Because the cross-linked structure of the plasma polymer- ized membrane prevents swelling and the thin thickness of the membranes leads to high permeability, several studies [5,10,11] have been performed on the pervaporation by plasma polymerized membranes. The purpose of this work is to clarify the relationship between the plasma conditions in the preparation of the membrane, such as power input and monomer flow rate, the structure of the obtained mem- brane, and the pervaporation performance. This relationship has not been investigated in detail so far.
Experimental
Plusma polymerization
The apparatus used for the plasma polymer- ization (Samco International Institute Co. Ltd., BP-1 ) is schematically shown in Fig. 1. The ap- paratus consisted of a bell-jar type reaction chamber made of Pylex glass (bottom diame- ter: 31.5 cm, height: 35.5 cm) equipped with a pair of parallel electrodes, 13.56 MHz radio fre- quency (rf) generator, matching network al- lowing the reflected power to be minimized, and a vessel for monomer thermostated at 298 K. The temperature of the lower electrode on which the substrates were mounted was main- tained at 298 K by circulating temperature-
Thermostated bath
Fig. 1. Schematic diagram of the plasma polymerization apparatus.
controlled water. Vapor of the monomer was supplied without any carrier gas to the cham- ber after the system was evacuated to less than 2.6 Pa. Then, the rf power was turned on and the plasma polymerization was initiated. The pressure in the chamber was fixed at 26 Pa, and both the rf power and the monomer flow rate were the operating parameters.
Octamethyltrisiloxane, supplied by Shin- Etsu Chemical Co. Ltd., was used as the mono- mer without further purification.
The substrate on which plasma polymers de- posited was a porous membrane made of mixed esters of cellulose (Millipore VS, mean pore di- ameter: 0.025 ,um, supplied by Japan Millipore Ltd. ) .
The deposition rates of the plasma polymer- ization were obtained by weighing the deposits on the glass substrate. It was confirmed in sev- eral experiments that the deposition rates on glass were almost equal to those on the porous membrane used in the pervaporation experiments.
Pervaporation
The pervaporation experiments were carried out by using a permeation apparatus consisting of a feed-side cell and a receiving-side cell. The

H. Matsuyama et al. /J. Membrane Sci. 88 (1994) 85-92 81
volume of the feed solution (ethanol-water mixture, ethanol concentration: 5 ~01% ) was 300 cm3, and the effective membrane area was 4.97 cm2. The pressure of the receiving-side was kept below 400 Pa by a rotary pump. Vapors permeated through the membrane were con- densed in a liquid nitrogen trap, and the amounts of the permeates were obtained by the weight increase of the trap. The compositions of the permeates were analyzed by a gas chro- matograph equipped with a thermal conductiv- ity detector (Shimadzu GCSA ).
The permeation experiments were carried out at 298 K.
Analysis of obtained membrane
Fourier-transform infrared (FT-IR) and X- ray photoelectron spectra (XPS ) of the plasma polymerized films deposited on aluminium foils were recorded with a Shimadzu model FT-IR 4100 spectrophotometer by attenuated total re- flection method and with a Shimadzu model 750 electronspectrometer employing Mea excit- ing radiation, respectively. 13C and 2QSi solid- state NMR spectra of the plasma deposits were measured on a CP/MAS NMR spectrometer (Chemagnetics-Otsuka Co. Ltd., CMX-300). Contact angles of water against the plasma films on the porous substrate membrane were measured with a contact-angle meter (Kyowa Kaimenkagaku Co. Ltd., CA-A) at N 293 K and N 50% humidity.
Results and discussion
Deposition rate
Figure 2 shows the effects of a power input, W (watt), and a monomer flow rate, F (mol/ s ) , on the deposition rate, DR (g/m” min ) . With the decrease of F and with the increase of W, DR increased. This means that the increase of the power supply per unit amount of monomer
0” 0 Fx106 [mol/s]
Fig. 2. Effect of Wand F on deposition rate.
E *go.04
B al 5 L 0.02 EI 'Z= g
00 2 100 200 W/FM [kJ/gl
Fig. 3. Relation between deposition rate and W/FM.
brought about the increase of DR. Figure 3 shows the relationship between DR and the plasma parameter, W/FM where M is the mo- lecular weight of the monomer. The parameter W/FM was firstly presented by Yasuda and Hirotsu [ 121 to describe the characteristics of the plasma polymerization. Despite the differ- ent power inputs and the monomer flow rates, the correlation showed a single trend between DR and W/FM.
Generally, state of plasma deposition can be divided into three regions [ 131: (1) the power- deficient region, (2) the monomer-deficient re- gion and (3) the intermediate region. In region (1)) the deposition rate is dependent on only the power input regardless of the monomer flow rate, while in region (2 ) the deposition rate is dependent on only the monomer flow rate. It was reported that the correlation between DR/ FM and W/FM was useful to describe the de-

88
position rates [ 13-151. Because DR/FM is a function of only W in region (1) and is nearly constant in region (2), the relation between DR/FM and W/FM shows a single curve in both region (1) and (2). However, in region (3), there is no inevitability that the correla- tion shows the single trend.
The plasma polymerization in this work is considered to correspond to region (3 ) because DR depended on both W and F, as shown in Fig. 2. Therefore, the plot of DR/FM against W/FM is not necessarily reasonable. In this work, the plot of DR against W/FM was con- firmed to be useful as shown in Fig. 3, which suggests that in region (3 ), the deposition rates are nearly the same under the condition that the energy supply per unit mass of the mono- mer is the same. This tendency is not seen in region (1) and (2 ) , and may be characteristic of region (3).
Characteristics of membranes
IR spectra of the plasma polymers formed at various W/FM values are shown in Fig. 4. The polymers showed IR spectra containing ab- sorptions at 2960 (CH, stretching), 2130 (Si- H stretching), 1410 (CH, deformation), 1250 ( Si-CH3 deformation) 1060 (Si-O-R stretch-
W,FM=38.4 kJ/g
+=I15 kJ/g ~
W/FM=,%? kJ/g
--Y- -“V-
Irlllllllllllllllll 0 3000 2000 ,500 1000 mc
Wave number [cm-‘]
,
H. Matsuyama et al. /J. Membrane Sci. 88 (1994) 85-92
ing) ,102O (Si-0-Si stretching) and 700-800 cm- ’ ( Si-CHB wagging, Si-C stretching and Si- CHB rocking). The Si-H groups in the plasma polymers, which were not contained in the monomer, were formed by the dissociation of Si-CH3 or Si-0 groups. The absorptions at 2960 and 1410 (CH,), and 1250 cm-’ (Si-CH,) de- creased with the increase of W/FM. This sug- gests that the larger the W/FM value was, the more easily the cross-linking occurred. Thus, it was confirmed that the structure of the plasma polymers can be changed or adjusted by the plasma conditions. This is different from the results of Inagaki et al. [ 16,171, who found no substantial change in the infrared spectra of plasma polymers formed from silicon-contain- ing monomers at different W/FM values.
The ratios of oxygen and carbon to silicon in the polymers detected by XPS measurements are shown in Fig. 5. All the ratios of O/Si were greater than the value of monomer (0.67) and, as recognized widely, the ratios increased with the increase of W/FM due to the increase of the residual radicals which can react with oxygen or water vapor in the atmosphere [ 181. On the
0 15w
1 q 5w I-- A 1W
0.9 / 0 .a -%0-o b 0 .7+++-
2.4-
I
=? O/O
23 7’ 0 15w - I,Y 0 5w _
A 1W
‘% I I I I I
100 200 300 W/FM [kJ/gl
Fig. 4. IR spectra of plasma polymer. F= 1.1 X lO-‘j mol/s. Fig. 5. Effect of W/FM on O/S and C/Si.
H. Matsuyama et al. /J. Membrane Sci. 88 (1994) 85-92
other hand, the C/Si ratio decreased firstly, reached a minimum at - 20 kJ/g of W/FM, and then increased. As far as we know, such a ten- dency has not been reported yet. In the plasma polymerization of tetramethylsilane, Kokai et al. reported that the C/Si ratio increased with the increase of W/FM, and explained this ten- dency by the formation of relatively stable hy- drocarbon fragments which contribute to the deposition less than the silicon-containing fragments [ 181. By assuming that the hydro- carbon fragments are also less reactive than the silicon-containing fragments in this system, the obtained results can be explained as follows. When the value of W/FM is very small, the monomer is not decomposed enough, and the C/Si ratio of the polymer is relatively close to that of monomer (2.67). As W/FM increases gradually, the more reactive silicon-containing fragments contribute to a larger extent to the deposition, which results in the decrease of the C/Si ratio. On the other hand, at larger W/FM values, the C/Si ratio increases because the re- decomposition reaction of hydrocarbons takes place more easily, and the hydrocarbon frag- ments become more reactive.
Figure 6 shows the (a) Si, and (b) C1, spec- tra by XPS measurements. The both spectra of Si, showed peaks at - 102.2 eV, assigned to Si-0 [ 161. The peak at N 101.0 eV, assigned to SCC [ 161, increased as W/FM increased. As shown in Fig. 5, the C/Si ratio increased at large W/FM values, which may be attributable to the
Fig. 6. (a) Si, and (b) C1, spectra of plasma polymer.
89
increase of Si-C groups. On both spectra of Cls, there appeared peaks at - 285 eV, assigned to aliphatic carbon and C-Si [ 161. The larger W/ FM value was, the larger the peak at N 286.6 eV, assigned to C-O [ 161, was. This coincides with the result of the increase of the O/Si ratio shown in Fig. 5.
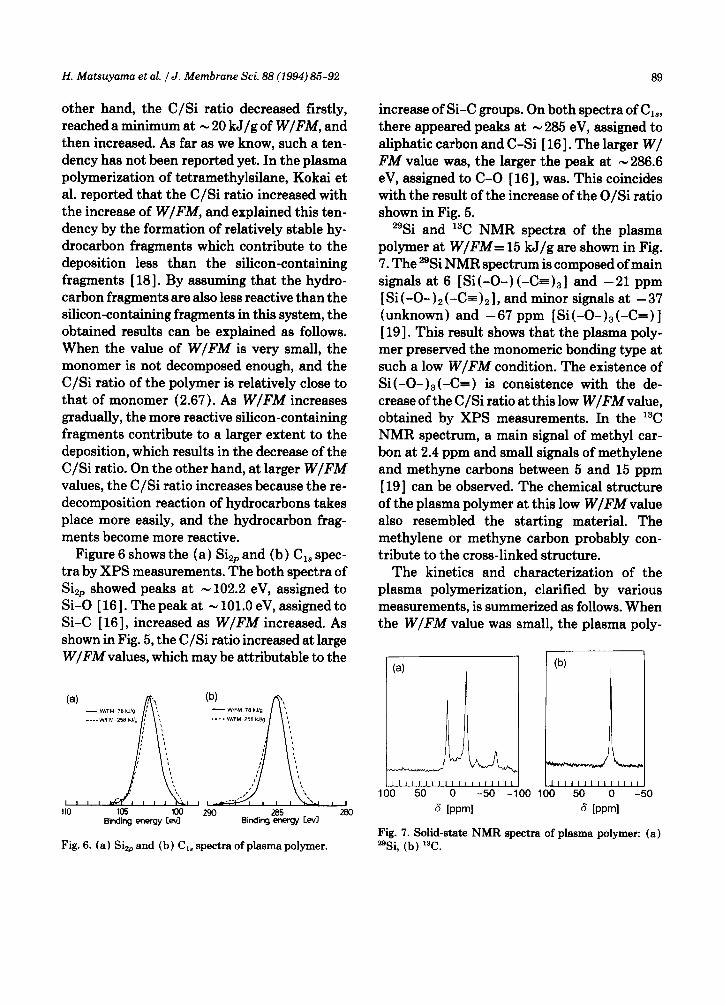
2gSi and 13C NMR spectra of the plasma polymer at W/FM= 15 kJ/g are shown in Fig. 7. The 2gSi NMR spectrum is composed of main signals at 6 [Si(-O-)(-C=),] and -21 ppm [Si(-O-),(-C=),], and minor signals at -37 (unknown) and -67 ppm [Si(-O-),(-C=)] [ 191. This result shows that the plasma poly- mer preserved the monomeric bonding type at such a low W/FM condition. The existence of Si(-O-),(-C=) is consistence with the de- crease of the C/Si ratio at this low W/FM value, obtained by XPS measurements. In the 13C NMR spectrum, a main signal of methyl car- bon at 2.4 ppm and small signals of methylene and methyne carbons between 5 and 15 ppm [ 191 can be observed. The chemical structure of the plasma polymer at this low W/FM value also resembled the starting material. The methylene or methyne carbon probably con- tribute to the cross-linked structure.
The kinetics and characterization of the plasma polymerization, clarified by various measurements, is summer&d as follows. When the W/FM value was small, the plasma poly-
(4 04
r;l Fig. 7. Solid-state NMR spectra of plasma polymer: ‘@Si, (b) 13C.
(a)

90 H. Matsuyama et al. / J. Membrane Sci. 88 (1994) 85-92
mer considerably preserved the monomeric structure. With the increase of W/FM, the more reactive silicon-containing fragments contrib- uted to a larger extent to the deposition, which resulted in the formation of a polymer with a low C/Si ratio. When W/FM increased fur- thermore, the hydrocarbon fragments became more reactive and were incorporated in the polymer. The increases of both the extent of the cross-linked structures and the amounts of oxygen incorporated in the polymer were ac- companied by the increase of W/FM.
Pervaporation performance of plusma polymerized membrane
Figure 8 shows the effects of W/FM on the separation coefficient, CYE~~H and the total per- meation rate, Q. (YE~~H is defined as
aEtOH = (W/XF I/ cJwx~ 1 (1)
where X, and X, are the weight fractions in the permeate and the feed solution, and super- scripts Et and W denote ethanol and water, re-
-
0
I I I I I I I
0 50 100 150 200 W/FM [kJ/gl
Fig. 8. Effect of W/FM on cxatOH and Q. Deposition time: 60 min.
spectively. The correlation between (YE~~H and W/FM and also that between Q and W/FM showed approximately single trends. The pa- rameter W/FM was confirmed to be valid for correlating these pervaporation performances as well as the deposition rates, described above. The permeation rates decreased monotonously with the increase of W/FM. This is because the increase in deposition rate, brought about by the increase of W/FM as shown in Fig. 3, re- sulted in increasing resistance of permeation. The formation of the cross-linked structure at high W/FM may also be one of the causes of the low permeation rate. The separation coef- ficient showed a maximum at low W/FM, and then decreased with W/FM. An enlargement of the low W/FM region in Fig. 8 is shown in Fig. 9, and a maximum was clearly observed. The maximum of aEtoH was 5.4 and the correspond-
Fig. 9. Relationship between aEtOH and W/FM region.
W/FM in the low
Rio ’ I I I 1
110 120 130 contact angle (water)
Fig. 10. Relationship between aEtOH and contact angle of water. W/FM> 30 kJ/g.

H. Matsuyama et al. / J. Membrane Sci. 88 (1994) 85-92 91
6
0 t--J--Jo 20 40 60
Deposition time [min]
Fig. 11. Effect of deposition time. W/FM= 36 U/g, W = 5 W.
ing permeation rate was 3.4 kg/m2 h. Although the separation coefficient was not necessarily large, the permeation rate was fairly high. This high permeation rate is one of the characteris- tics of the plasma polymerized membrane, whose thickness1 can be thinned. The value of W/FM at which (Y ztOH was maximum was nearly the same as the value at which the C/Si ratio was minimum, Fig. 5. The decrease of the C/Si ratio means an increase of the flexible sil- oxane bonds. Therefore, the increase of the ethanol diffusivity, which is usually smaller than that of water, may result in the maximum
of (YEtOH-
The relationship between c&ton and the con- tact angles of water is shown in Fig. 10. In this figure, the data near the region where ~~zton showed a maximum in Fig. 8 were omitted. The correlation between (Y&on and the contact an- gles was good. The increase of the contact angle corresponds to an increase of the hydrophobic- ity of the membrane surface. Therefore, the re- sult in Fig. 10 suggests that the separation coef- ficients depended on the difference in solubility based on the difference of the affinities to the polymer rather than that in the diffusivity. As
‘The thickness of the deposit layer was found by SEM to be N 0.3 pm with W/FM = 20 kJ/g and a deposition time of 60 min. Because even the thickness at low W/FM was much larger than 5 times the radius of pores of the sub- strate, it was considered that all of the pores were plugged WI.
w/FM increases, the amount of oxygen incor- porated in the polymer increases, as shown in Fig. 5, and the membrane surface becomes more hydrophilic. This is the reason for the decrease
of aEtOH at the high W/FM conditions shown in Fig. 8.
The effect of the deposition time is shown in Fig. 11. The separation coefficient was nearly constant regardless of the time, which indi- cates that after 10 min, all the pores were plugged and also that the structures of the de- posit layers did not changed. c&on and Q ob- tained at a deposition time of 10 min were 5.1 and 6.2 kg/m2 h, respectively. The obtained permeation rate was more than ten times larger than the values of the plasma polymerized membranes from silicon compounds reported by Inagaki et al. [lo] and Kashiwagi et al. [ 51.
Conclusion
(1) In the plasma polymerization of octa- methyltrisiloxane, the correlation between the deposition rate and the parameter W/FM showed a single trend despite the different power inputs and monomer flow rates.
(2) The structure of the plasma polymer was analyzed by IR, XPS and solid-state NMR. When the W/FM value was small, the plasma polymer considerably preserved the mono- meric structure. With the increase of W/FM, both the extent of the cross-linked structure and the amounts of oxygen incorporated in the polymer increased. There was a minimum in the correlation between the C/Si ratio of the membrane surface and W/FM.
(3 ) The parameter W/FM was also useful to correlate the separation coefficients and the permeation rates of the plasma polymerized membranes to pervaporation. Although the permeation rate decreased monotonously with the increase of W/FM, the separation coeffi- cient had a maximum against W/FM. The value of W/FM at which the separation coefficient

92 H. Matsuyama et al. /J. Membrane Sci. 88 (1994) 85-9.2
was maximum nearly corresponded to the value at which the C/Si ratio was minimum. The sep- aration coefficient and the permeation rates obtained were 5.1 and 6.2 kg/m2 h, respec- tively. This high permeation rate is character- istic of plasma polymerized membranes.
9
10
Acknowledgements 11
We express our thanks to Shin-Etsu Chem- ical Co. Ltd. for supplying octamethylsiloxane. We also thank Japan Millipore Limited for supplying the porous membrane.
12
References 13
K. Ishihara and K. Matsui, Pervaporation of ethanol- water mixture through composite membranes com- posed of styrene-fluoroalkyl acrylate graft copolymers and cross-linked polydimethylsiloxane membrane, J. Appl. Polym. Sci., 34 (1987) 437. N. Inagaki, S. Tanaka and Y. Kobayashi, Pervapora- tion of ethanol-water mixture by plasma films pre- pared from hexamethyldisiloxane, Desalination, 70 (1988) 465. T. Masuoka, T. Iwatsubo and K. Mizoguchi, Perva- poration membranes for ethanol-water mixture pre- pared by plasma polymerization of fluorocarbons. II. Perfluoropropane membranes, J. Membrane Sci., 69 (1992) 109. H. Yasuda and T. Hirotsu, Critical evaluation of con- ditions of plasma polymerization, J. Polym. Sci., Po- lym. Chem. Ed., 16 (1978) 743. H. Nomura, P.W. Kramer and H. Yasuda, Prepara- tion of gas separation membranes by plasma polymer- ization with fluoro compounds, Thin Solid Films, 118 (1984) 187. C. Ho and H. Yasuda, Coatings and surface modifi- cation by methane plasma polymerization, J. Appl. Polym. Sci., 39 (1990) 1541. S.Y. Park and N. Kim, Mechanism and kinetics of organosilicon plasma polymerization, J. Appl. Polym. Sci., Appl. Polym. Symp., 46 ( 1990) 91. N. Inagaki and A. Kishi, Glow discharge polymeriza- tion of tetramethylsilane investigated by infrared spectroscopy and ESCA, J. Polym. Sci., Polym. Chem. Ed., 21 (1983) 1847. N. Inagaki and H. Yamazaki, Role of unsaturated groups in glow discharge polymerization, J. Appl. Po- lym. Sci., 29 (1984) 1369. F. Kokai, T. Kubota, M. Ichjyo and J. Wakai, Plasma diagnostics and structure of plasma polymers of tetra- methylsilane, J. Appl. Polym. Sci., Appl. Polym. Symp., 42 (1988) 197. I. Tajima and M. Yamamoto, Characterization of plasma polymers from tetramethylsilane, octamethyl- cyclotetrasiloxane, and methyltrimethoxysilane, J. Polym. Sci., Part A: Polym. Chem., 25 (1987) 1737. J. Sakata, M. Hirai and M. Yamamoto, Plasma-po- lymerized membranes and gas permeability. III, J. Appl. Polym. Sci., 34 (1987) 2701.
H. Yasuda, Glow discharge polymerization, J. Polym. Sci., Macromol. Rev., 16 (1981) 199. J.R. Hollahan and A.T. Bell, Techniques and Appli- cations of Plasma Chemistry, Wiley, New York, 1974. H. Yasuda and C.E. Lamaze, Preparation of reverse osmosis membranes by plasma polymerization of or- ganic compounds, J. Appl. Polym. Sci., 17 (1973) 201. A.F. Stance1 and A.T. Spencer, Composite permselec- tive membrane by deposition of an ultrathin coating from a plasma, J. Appl. Polym. Sci., 16 (1972) 1505. T. Kashiwagi, K. Okabe and K. Okita, Separation of ethanol from ethanol/water mixtures by plasma-po- lymerized membranes form silicone compounds, J. Membrane Sci., 36 (1988) 353. S. Kimura and T. Nomura, Pervaporation of alcohol- water mixtures with silicone rubber membrane, Mem- brane, 7 (1982) 353. K. Okamoto, A. Butsuen, S. Tsuru, S. Nishioka, K. Tanaka, H. Kita and S. Asakawa, Pervaporation of water-ethanol mixtures through polydimethylsilox- ane block-copolymer membranes, Polym. J., 19 (1987) 747. K. Ishihara, R. Kogure and K. Matsui, Separation of ethanol through styrene-dimethylsiloxane graft co- polymer membranes by pervaporation, Kobunshi Ronbunshu, 43 (1986) 779.
14
15
16
17
18
19
20