characteristics of individuals and employment among … · characteristics of individuals and...
TRANSCRIPT
Characteristics of Individuals and Employment Among First Responders
U.S. Department of Labor
Chief Evaluation Officer
Authors: Kristina Schafer
Ryan Sutter
Scott Gibbons
Revised August 6, 2015

<This page left blank for double-sided copying>

DISCLAIMER
This report was prepared for the U.S. Department of Labor (DOL), Chief Evaluation Office. The
views expressed are those of the authors and should not be attributed to DOL, nor does
mention of trade names, commercial products, or organizations imply endorsement of same by
the U.S. Government.

<This page left blank for double-sided copying>
i
EXECUTIVE SUMMARY
First responders are employed in critical occupations that help to promote and ensure the
safety, health and protection of individuals and communities. Their daily responsibilities may
involve managing crisis situations or working in dangerous or unstable environments. This
report describes a cluster of first responder occupations, with particular emphasis on trends
and patterns in employment, the characteristics of the individuals who do these jobs, the
nature of their work, and adverse experiences they may face as a result of their potentially
hazardous work.
The report was prepared to provide general, national level, background statistical information
on workers in three occupational categories: police, firefighters, and emergency medical
technicians (EMTs).1 The material in this report is presented in several sequential sections, with
each section relying on a distinct kind of data to describe an important aspect of first
responders: personal characteristics, employment patterns, compensation, occupational
outlook, and work related injuries, illnesses and fatalities.
Characteristics of the Workforce
The report describes the characteristics of career first responders based on the Current
Population Survey.
The majority of the more than 1.2 million workers in these three occupational
categories are White, male, and 25 to 54 years old.
3 out of 4 EMTs and paramedics are men.
7 out of 8 police officers are men.
19 out of 20 firefighters are men.
The racial and ethnic diversity in this workforce varies by occupation.
Blacks or African Americans represent a higher proportion of police officers
than their proportion in the overall employed population, but are
underrepresented among firefighters and EMTs.
Hispanics as a proportion of first responders represent a lower share than their
proportion of the overall employed.
These categories of first responders generally have higher levels of post high school
education than the total employed, and fewer have not completed high school.
1 Volunteers are important in this sector, but the report focuses on career first responders because official
employment surveys do not include volunteers.
ii
Earnings
The report analyzes data from the Current Population Survey and Occupational Employment
Statistics to describe the trends and patterns in employment and wages for career first
responders.
Police and firefighters tend to have higher earnings than the overall working.
population, but it is important to note that across all categories of first responders, they
also tend to work more hours.
Although there are considerably more male first responders than female, the gap
between male and female earnings among police and EMTs is much smaller than is
typically seen in the labor force as a whole.
Employment Trends
There are substantially more police than firefighters or EMTs. Between 2000 and 2013,
each year the level of employment among police officers has been consistently more
than twice that of firefighters, and nearly three times that of EMTs.
EMT employment has been growing faster than police or firefighters. Employment
levels for EMTs have been growing approximately four times as fast as police and
firefighters, both of which have had nearly the same growth rate from 2000 to 2013.
Employment levels for EMTs have not shown declines in any year since 2010, which is
not true for police and firefighters.
Projected Future Employment
Between 2012 and 2022, the Bureau of Labor Statistics (BLS) projects that firefighter
and police occupations are likely to grow by 6.6% and 5.9% respectively, a rate
somewhat slower than for all occupations (where the rate is about 11%).
EMTs and paramedics are expected to see a much higher increase in employment
between 2012 and 2022 at 23.1%. However the projected growth for EMTs and
paramedics in local government is much lower at 6.8%.
Workplace Safety and Health
Finally, it is an unfortunate reality that first responder work is dangerous, and can lead to injury.
This report uses occupational safety and health statistics that are compiled in two documents
from the Bureau of Labor Statistics: Nonfatal Occupational Injuries and Illnesses Requiring Days
Away From Work and the Census of Fatal Occupational Injuries.
Police and firefighters have much higher occurrences of injuries, and resulting days
away from work, than most other occupations.
Compared to other workers, first responders are more likely to have injuries related to
physical over-exertion, transportation incidents, and violent situations, and their work-
related fatality rate is higher.
iii
CONTENTS
I. Introduction .................................................................................................................... 1
II. Characteristics of First Responders ................................................................................... 2
Sources of Data to Describe the Characteristics of First Responders .............................................2
Characteristics and Demographics of Career First Responders......................................................3
III. Earnings, Hours, and Employment Patterns of First Responders ....................................... 7
Sources of Data on Earnings, Hours, and Employment .................................................................7
Average Earnings in Longest Job Held for 2013 ............................................................................8
Average Usual Weekly Hours Worked in 2013 .............................................................................9
Trends in Employment and Hourly Wages ................................................................................ 10
IV. The Impact of Occupationally Related Injury, Illness and Fatalities on First Responders .. 12
V. Employment Projections for First Responder Occupations .............................................. 18
VI. Conclusion / Summary .................................................................................................... 19
Technical Appendix: Data Sources and Processing Code ....................................................... 22
iv
FIGURES
Figure 1. Gender Distribution of First Responders .................................................................. 3
Figure 2. Race/Ethnicity of First Responders .......................................................................... 4
Figure 3. Age Distribution of First Responders ........................................................................ 4
Figure 4. Educational Attainment of First Responders ............................................................ 5
Figure 5. Higher Educational Attainment of First Responders ................................................. 5
Figure 6. Veteran Status of First Responders .......................................................................... 6
Figure 7. Average Earnings in Longest Job Held, Select Occupations: 2013 .............................. 8
Figure 8. Average Earnings in Longest Job Held, by Gender: 2013 ........................................... 9
Figure 9. Average Usual Weekly Hours Worked, by Gender: 2013 ......................................... 10
Figure 10. Employment Levels, First Responders: 2000 – 2013 .............................................. 10
Figure 11. Average Hourly Wages, First Responders: 2000 – 2013 ......................................... 11
Figure 12. Nonfatal Occupational Injuries and Illnesses Involving Days Away from Work, by
Occupational Category: 2013 ................................................................................ 13
Figure 13. Nonfatal Occupational Injuries and Illnesses Involving Days Away from Work: 2013
............................................................................................................................ 14
Figure 14. Events Associated with Injuries for Police and Sheriff’s Patrol Officers: 2013 ........ 16
Figure 15. Events Associated with Injuries for Firefighters: 2013........................................... 16
Figure 16. Fatal Occupational Injuries Among Occupational Groups, Highlighting Protective
Service Workers: 2013 .......................................................................................... 17
Figure 17. Projected Employment for First Responders (Employment in Thousands)............. 18
Figure 18. Projected Employment for First Responders in Local Government (Employment in
Thousands) .......................................................................................................... 19
1
I. Introduction
First responders are employed in critical occupations that help to promote and ensure the
safety, health and protection of individuals and communities. The jobs of first responders may
involve dealing with crisis situations or working in dangerous or unstable environments.
Categories of occupations usually considered to be first responders include firefighters,
emergency medical technicians (EMTs) and paramedics. Police are also an important category
of first responders but the occupations that make up this category are diverse and can include
occupations as varied as police officers, sheriff’s patrol officers, detectives and criminal
investigators, transit and railroad police, and fish and game wardens.2
This paper describes the individuals who do these jobs, aspects of their work as first
responders, and adverse experiences they may face as a result of potentially dangerous work.
The material presented in this report is divided up into several sections. Each section uses a
distinct kind of data to examine an important aspect of the jobs that first responders do.
Examining of all of the different data, and the relationships among them, provides a detailed
view of how the jobs of first responders compare to each other, as well as their similarities and
differences with the patterns found in the working population as a whole.
The first section presents characteristics and demographics of first responders, using data from
the Current Population Survey (CPS). The second section summarizes the annual and hourly
earnings of first responders as well as the overall working population. Included are some trends
in earnings over the last two economic cycles. The third section looks at accident and injury
rates, as well as some of the consequences such as days lost from work. The fourth section
contains a brief economic outlook for the expected growth in particular occupations.
These are descriptive statistics and are not intended to make inferences about the diversity of
the occupations nor used to evaluate the workforce or employment practices of particular
departments.
2 The occupational codes used to define firefighters and EMTs are standardized throughout this report. Firefighters
are defined by the Standard Occupational Classification (SOC) code assignment 33-2011 and EMTs and paramedics are defined by SOC code assignment 29-2041. Police (and sheriff’s patrol officers) are defined by SOC code assignment 33-3051. Some statistics describing protective service may also include: Detectives and Criminal Investigators (33-3021), Fish and game wardens (33-3031), and Transit and railroad police (33-3052). See technical appendix on how first responders were identified.
2
II. Characteristics of First Responders
This section describes basic individual characteristics for career first responders such as age,
gender, race, education and Veteran’s status. The individuals described in this section are
identified primarily by their having worked predominantly as a first responder in the recent
past. The statistics presented in this section do not include individuals who volunteer their
services to perform first responder duties, since they are not reported in the Federal data
sources.3
Sources of Data to Describe the Characteristics of First Responders
The data to describe the characteristics and demographics of first responders and total
employed comes from the Current Population Survey (CPS) of the U.S. Census Bureau and the
U.S. Bureau of Labor Statistics. About 60,000 households are surveyed each month. The
individuals eligible for the CPS are the civilian non-institutional population residing in the
United States and those armed forces members living with civilians either on or off base within
these households. The CPS provides data on characteristics such as age, sex, and educational
attainment that are collected along with economic data on earnings and occupation. The 2014
annual averages presented in this section are compiled from the monthly data.
An important and challenging aspect to describing the first responder population is finding a
way to capture comparable data on volunteers and those who are paid. While these are both
vital parts of the first responder community, considerably more data are collected around
wages and employment, and considerably less around volunteering and organizational support.
This section focuses on formally employed paid workers only, using data from the CPS
presenting common elements as a basis to compare and contrast individual characteristics
among career first responders, as well as, the total employed in 2014.
3 The descriptions in this report include individuals who are paid workers. Volunteers, particularly among
firefighters, represent an important part of the first responder population, but the Federal surveys on employment do not report volunteers. Some estimates suggest that over two-thirds of firefighters in the United States are volunteers. See, for example, Hylton J.G. Haynes and Gary P. Stein, U.S. Fire Department Profile 2013, National Fire Protection Association, Fire Analysis and Research Division (Quincy MA 2014).

3
Characteristics and Demographics of Career First Responders
The data in this section is provided for descriptive purposes and were not tested for statistically
significant differences.
Figure 1 presents the gender
composition of broad career first
responder groups including EMTs,
firefighters, and police. The graph
also shows the gender composition
for the total employed 16 years of
age and older as a point of
comparison. While the proportion of
males and females in the population
is roughly equal, first responder
occupations are comprised of
significantly higher proportions of
males. Approximately three out of four EMTs and paramedics are male and seven out of every
eight police officers are male. Firefighters have the highest proportion of males, where almost
19 out of 20 are male.
Figure 2 provides data for career first responders by race and Hispanic origin, and for the total
employed.4 First, Whites constitute the majority of first responders. In general, Whites are
overrepresented in the three first responder categories, particularly for firefighters and EMTs,
and other groups are underrepresented. Second, Blacks are employed as police officers at
levels that exceed their share of the working population (14.7% compared to 10.7%), but Blacks
are underrepresented among EMTs (7.8% compared to 10.7% of the total employed). The
proportion of Hispanics for all of the first responder occupations is below the proportion of
Hispanics in the total employed.
4 The race/ethnicity categories in this report are defined as White (White alone non-Hispanic), Black (Black alone
non-Hispanic), Hispanic (any race) and Other.
Figure 1. Gender Distribution of First Responders
Source: Current Population Survey, Annual Averages 2014
100%
80%
60%
40%
20%
0%
Total EMTs Firefighters PoliceEmployed
16+ Male Female

4
There is also a very clear age pattern, illustrated below in Figure 3, which shows that first
responders tend to have higher proportions of employed individuals within younger age ranges,
and lower proportions of working individuals among older age ranges the total employed. This
pattern is consistent across the first responder occupations. There is a notable decline in the
share of those employed as first responders in the older age ranges, beginning between ages 45
and 55. The total employed has
roughly equal proportions in the
age brackets from 25 to 54. In
contrast, all of the first
responder occupations show
lower percentages beginning
with the 45-54 year old age
ranges, and the shares of
employment among first
responders, aged 55 and older,
drop dramatically. This decrease
is also seen among the total
employed, however, not to the
same degree.
EMTs have the highest share of employment in the 25-34 age bracket; following that, there is a
steady drop over the next three age groups. Firefighters have their peak share of employment
Source: Current Population Survey, Annual Averages 2014
Figure 2. Race/Ethnicity of First Responders EMTs
5.7% 8.3%
7.8%
78.2%
White Non-HispanicBlack Non-HispanicHispanic
Other
Total Employed 16+
7.8%
16.1%
10.7% 65.4%
White Non-Hispanic
Black Non-Hispanic
Hispanic
Other
Firefighters
2.8% 9.6%
9.1%
78.6%
White Non-Hispanic
Black Non-Hispanic
Hispanic
Other
Police
4.7% 13.3%
14.7% 67.3%
White Non-Hispanic
Black Non-Hispanic
Hispanic
Other
Figure 3. Age Distribution of First Responders
Source: Current Population Survey, Annual Averages 2014
40% ta
lf
To
30%
ot 20%
nec
Pe
r 10%
0%
Total EMTs Firefighters PoliceEmployed
16+
16-19 20-24 25-34 35-44 45-54 55-64 65+

5
in the 35-44 year age group, followed by a steady drop in the percentage of individuals
employed in the next two age groups. For police, the highest share of employment is in the 35-
44 age range, followed by moderate reductions in the share of employment in the 45-54 and
then a large decline in the share of employment starting with age 55.
Figure 4 shows that all three
types of first responders also
have fairly high levels of
educational attainment. The
percentage of career first
responders without a high
school degree is quite small,
and considerably lower than
for the total employed. In
addition, career first
responders consist of a higher
proportion of individuals with
post-secondary education, and
EMTs have the highest
proportion of individuals with post-secondary education.
In Figure 5, EMTs and
Firefighters have a lower
proportion of bachelor’s
degrees with 16.2% and 21.6%
respectively, compared to the
working population. Police
officers have the highest
proportion of individuals
having a bachelor degree or
higher (35.7%) among the first
responder occupations and the
total employed.
Source: Current Population Survey, Annual Averages 2014
Figure 5. Higher Educational Attainment of First Responders
100%
80%
60%
40%
20%
0%
Total Employed EMTs Firefighters Police16+
Less Than High School High School Graduate
Some College Associate Degree
Bachelor Degree or Higher
Figure 4. Educational Attainment of First Responders
Source: Current Population Survey, Annual Averages 2014
Post High School Education
High School Graduate
Less ThanHigh School
0% 20% 40% 60% 80% 100%Percent of Total
Total Employed 16+
EMTs
Firefighters
Police
6
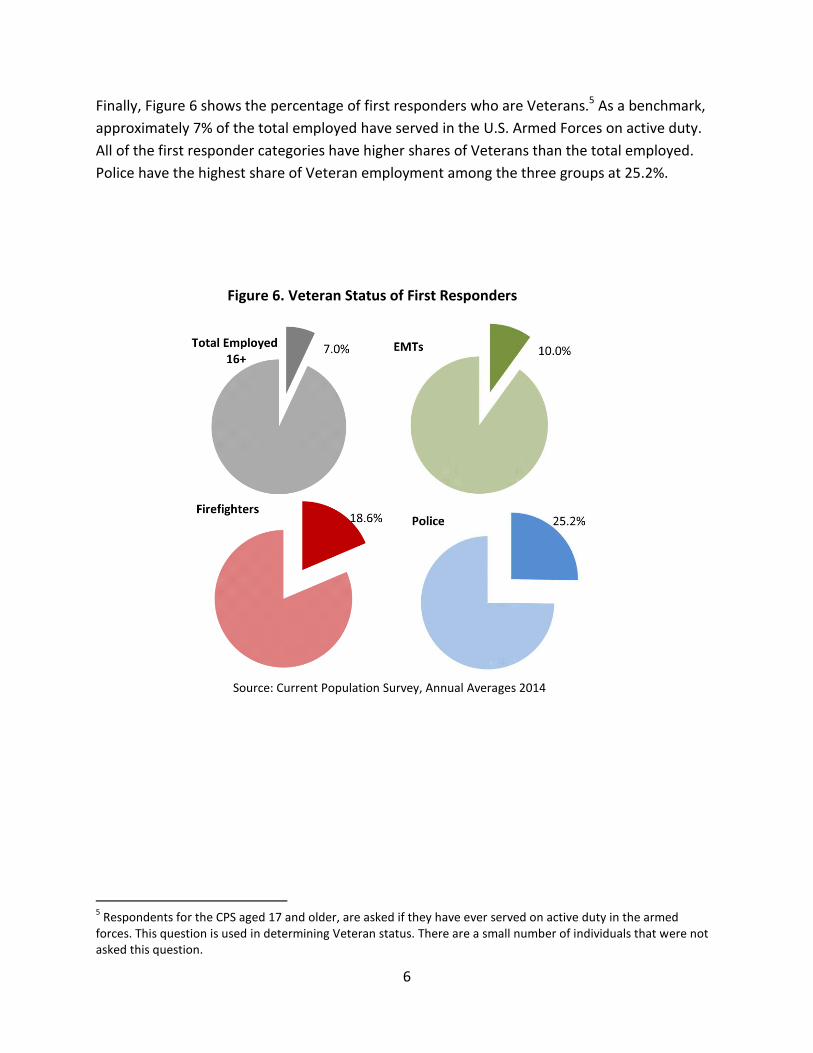
Finally, Figure 6 shows the percentage of first responders who are Veterans.5 As a benchmark,
approximately 7% of the total employed have served in the U.S. Armed Forces on active duty.
All of the first responder categories have higher shares of Veterans than the total employed.
Police have the highest share of Veteran employment among the three groups at 25.2%.
5 Respondents for the CPS aged 17 and older, are asked if they have ever served on active duty in the armed
forces. This question is used in determining Veteran status. There are a small number of individuals that were not asked this question.
Figure 6. Veteran Status of First Responders
Source: Current Population Survey, Annual Averages 2014

7
III. Earnings, Hours, and Employment Patterns of First Responders
Estimates for earnings, hours usually worked in a week, and employment levels for first
responders and the working population are presented using the most recent available data. In
addition, trends in hours worked, employment levels and annual and hourly earnings are
presented for years spanning the last two economic cycles, from 2000 to 2013.
Sources of Data on Earnings, Hours, and Employment
The most complete source of publicly available data to describe the characteristics and
demographics, as well as the annual income, of first responders comes from the 2014 Annual
Social and Economic (ASEC) supplement of the Current Population Survey (CPS) of the U.S.
Census Bureau and the U.S. Bureau of Labor Statistics. The ASEC sample includes the regular
CPS March sample of 72,500 households, a quarter of the February and April samples not in the
March sample, and an additional Hispanic sample of 6,500, for approximately 98,000
households. The individuals eligible for the ASEC supplement are the civilian non-institutional
population residing in the United States and those armed forces members living with civilians
either on or off base within these households. The ASEC provides data on characteristics such
as age, sex, and educational attainment that are collected along with economic data on income,
occupation, and hours worked per week. Data on earnings from the longest job held and
number of hours usually worked during a week in 2013 for career first responders, the working
population 16+, and non-first responders comes from the 2014 Annual Social and Economic
(ASEC) Supplement of the CPS. Information on demographics refers to the time the survey was
collected while data on employment and income refer to the preceding year.6
Data from the Occupational Employment Statistics (OES)7 program, produced by the Bureau of
Labor Statistics are used to expand on the recent annual data provided by the ASEC, and to
present trends in estimated employment levels, as well as estimates of hourly wages for select
first responder occupations over time.8 The OES program produces employment and wage
6 For the purposes of this section, data are averaged across individuals. Two EMT observations were excluded from
the average earnings information presented in Figures 7 and 8 due to extreme earnings values. See the Technical Appendix for more information. 7 General background information and specific methods and techniques used by OES program can be found at http://www.bls.gov/oes/.Tables showing the data presented in this report can be found at http://www.bls.gov/oes/tables.htm. 8 Challenges in using OES data as a time series include changes in the occupational, industrial, and geographical
classification systems, changes in the way data are collected, changes in the survey reference period, and changes in mean wage estimation methodology, as well as permanent features of the methodology. The data are presented here only to provide the user with a general sense of the data available to describe recent trends and patterns in wages and employment over the last two economic cycles.
8
estimates annually for over 800 occupations, for the nation as a whole, and for geographic
areas such as individual States, metropolitan areas and nonmetropolitan areas.
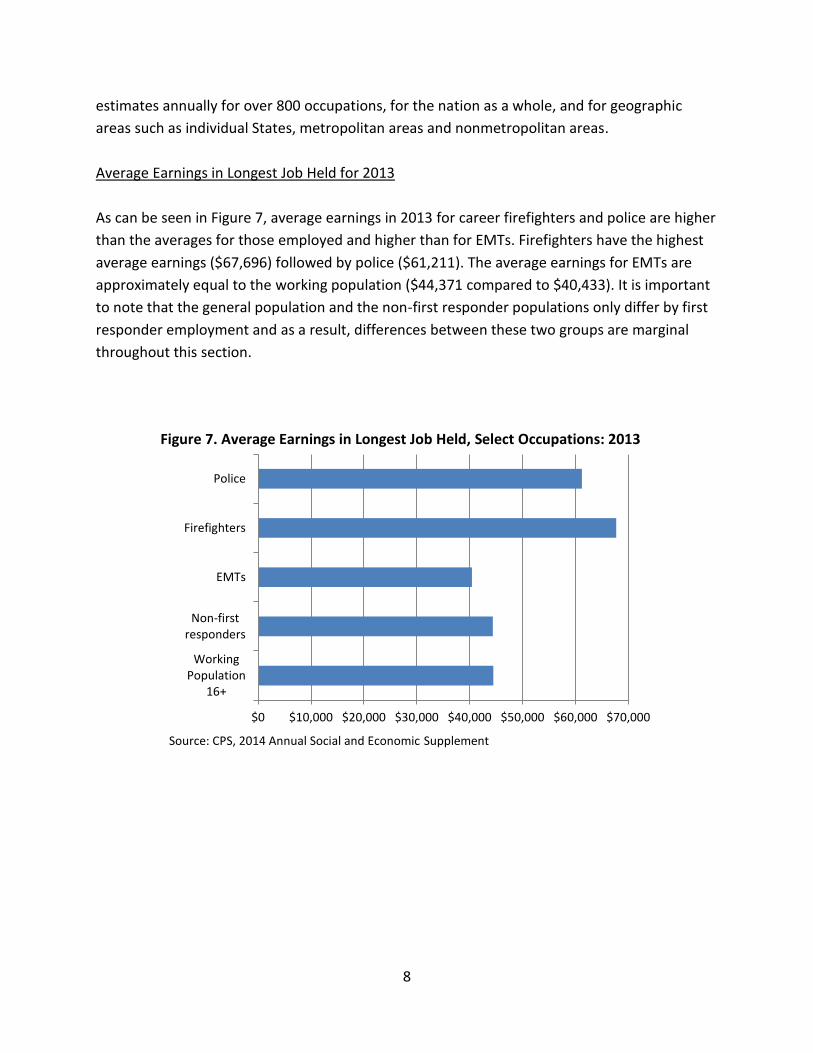
Average Earnings in Longest Job Held for 2013
As can be seen in Figure 7, average earnings in 2013 for career firefighters and police are higher
than the averages for those employed and higher than for EMTs. Firefighters have the highest
average earnings ($67,696) followed by police ($61,211). The average earnings for EMTs are
approximately equal to the working population ($44,371 compared to $40,433). It is important
to note that the general population and the non-first responder populations only differ by first
responder employment and as a result, differences between these two groups are marginal
throughout this section.
Police
Firefighters
EMTs
Non-firstresponders
WorkingPopulation
16+
$0 $10,000 $20,000 $30,000 $40,000 $50,000 $60,000 $70,000
Source: CPS, 2014 Annual Social and Economic Supplement
Figure 7. Average Earnings in Longest Job Held, Select Occupations: 2013
9
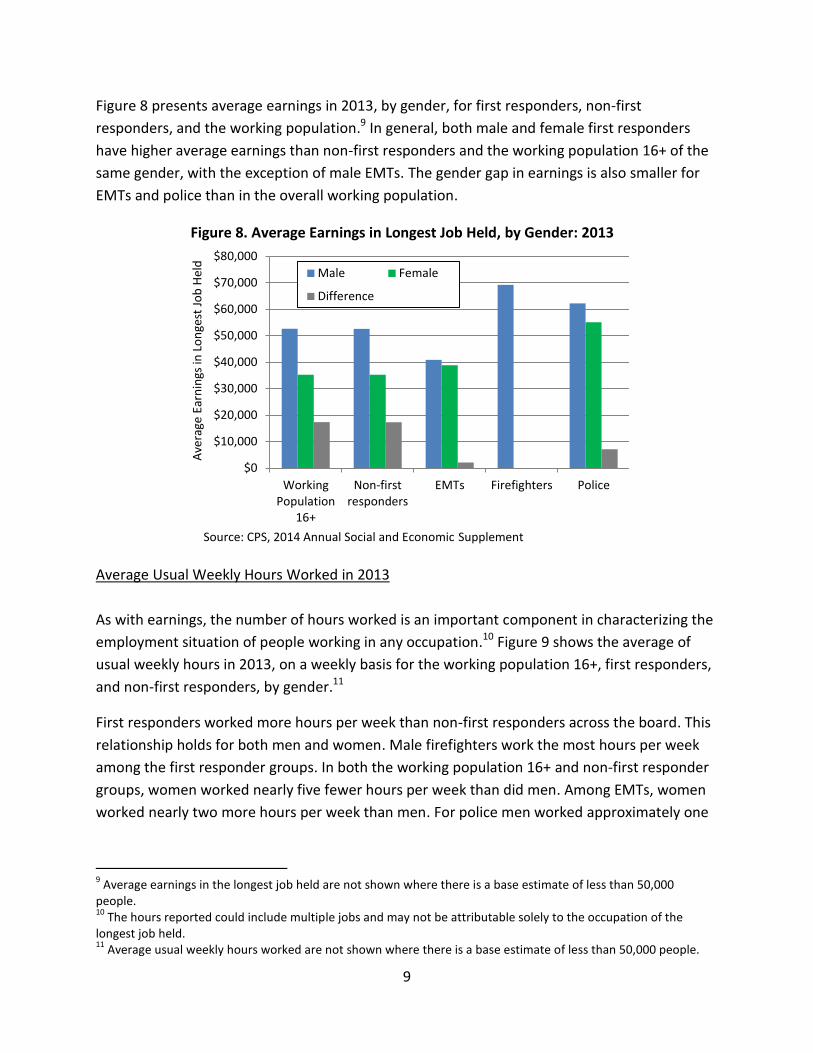
Figure 8 presents average earnings in 2013, by gender, for first responders, non-first
responders, and the working population.9 In general, both male and female first responders
have higher average earnings than non-first responders and the working population 16+ of the
same gender, with the exception of male EMTs. The gender gap in earnings is also smaller for
EMTs and police than in the overall working population.
Average Usual Weekly Hours Worked in 2013
As with earnings, the number of hours worked is an important component in characterizing the
employment situation of people working in any occupation.10 Figure 9 shows the average of
usual weekly hours in 2013, on a weekly basis for the working population 16+, first responders,
and non-first responders, by gender.11
First responders worked more hours per week than non-first responders across the board. This
relationship holds for both men and women. Male firefighters work the most hours per week
among the first responder groups. In both the working population 16+ and non-first responder
groups, women worked nearly five fewer hours per week than did men. Among EMTs, women
worked nearly two more hours per week than men. For police men worked approximately one
9 Average earnings in the longest job held are not shown where there is a base estimate of less than 50,000
people. 10
The hours reported could include multiple jobs and may not be attributable solely to the occupation of the longest job held. 11
Average usual weekly hours worked are not shown where there is a base estimate of less than 50,000 people.
Figure 8. Average Earnings in Longest Job Held, by Gender: 2013
Source: CPS, 2014 Annual Social and Economic Supplement
$80,000
lde H $70,000
boJ
t s $60,000
gen $50,000
Lo in $40,000
gsin
n $30,000
arE 0,000
ge $2
rae $10,000
Av
$0
Working Non-first EMTs Firefighters PolicePopulation responders
16+
Male Female
Difference

10
hour more per week than women. The similarity in hours per week by gender represents a clear
contrast from the patterns seen among the working population.
Trends in Employment and Hourly Wages
The data and charts presented below show trends in employment levels and hourly wages for
first responder occupational groups over the last two economic cycles (2000 – 2013).
Figure 10 shows the
aggregate levels of first
responder employment, by
occupational group, from
2000 – 2013. Police have
constituted the largest share
of first responder
employment throughout this
period. The level of
employment among police
officers is more than twice
that of firefighters, and
nearly three times that of
EMTs. However, employment
levels for EMTs have been growing approximately four times as fast as police and firefighters,
Figure 9. Average Usual Weekly Hours Worked, by Gender: 2013
Source: CPS, 2014 Annual Social and Economic Supplement
Figure 10. Employment Levels, First Responders: 2000 – 2013
Source: BLS, Occupational Employment Statistics

11
which have had nearly the same growth rate from 2000 to present. Employment levels for
EMTs have not shown declines since 2010, which is not true for police and firefighters.
Figure 11 presents the average hourly real wages for first responders from 2000 to 2013.12
Police have the highest average hourly real wage over the entire period and have experienced
the most real wage growth. The growth in hourly wages on Figure 11 shows that between 2000
and 2013, average hourly real wages increased approximately 7.6% for police officers, 4.9% for
EMTs and 1.9% for firefighters. Firefighters have the second highest average hourly wage, and
EMTs have the lowest. Since 2009, growth in the average hourly real wage has been negative
for EMTs and firefighters.
12
Nominal average hourly wages were put in 2013 dollars using the seasonally adjusted CPI-U for all items (December).
Figure 11. Average Hourly Wages, First Responders: 2000 – 2013
Source: BLS, Occupational Employment Statistics
$35
2
01
3$
)
$30
( $25
geW
a
$20
al
Re
$15
rly
uo $10
H ge
ra $5
eA
v
$0
2000 2001 2002 2003 2004 2005 2006 2007 2008 2009 2010 2011 2012 2013
EMTs Firefighters Police

12
IV. The Impact of Occupationally Related Injury, Illness and Fatalities on First
Responders
Statistics compiled to assess workplace safety show that the work of first responders is
dangerous. Work related incidents that cause injury or illness occur at much higher rates for
first responders than for workers in most other occupations. This section describes
occupational hazards associated with first responder work, the trends and patterns, and
comparisons among first responder groups and other occupational categories.
The primary data sources for this section are the Survey of Occupational Injuries and Illnesses
(SOII) and the Census of Fatal Occupational Injuries (CFOI), conducted by the Bureau of Labor
Statistics.13
The SOII is the largest survey of occupational injuries and illnesses in the country, capturing
data from records of workplace injuries and illnesses that employers are required to keep under
the Occupational Safety and Health Act of 1970. The SOII provides injury and illness counts and
rates for a variety of employer, employee, and case characteristics based on a sample of over
230,000 establishments. Figures are calculated nationally and for 44 participating states and
territories (including DC), allowing for detailed analyses of the magnitude, patterns, and trends
in occupational injuries and illnesses. The estimates cover nearly all private-sector industries
under the jurisdiction of the Occupational Safety and Health Administration (OSHA), as well as
State and local government.
The CFOI is a Federal-State cooperative program that has been implemented in all 50 States
(and DC) since 1992. The census uses multiple sources to identify, verify, and profile fatal
worker injuries. Information is obtained by cross-referencing the source records, such as death
certificates, workers' compensation reports, and Federal and State agency administrative
reports. The CFOI data does include volunteers.
It is important to note that the majority of first responders are employed by local and State
governments, and the Federal OSHA program does not have jurisdiction over, or detailed
inspection data for, the large majority of establishments that would house or employ first
responders. It is also important to note that many of these data sources treat workplace
injuries in an epidemiological manner, looking not just at the number of incidents that occur,
but at the rate of incidence. The rate of incidence is computed as an annualized number of
injuries and/or illnesses per ten thousand full-time workers, so the incidence rate offers a
13
Data and reports from these programs can be found at http://www.bls.gov/iif/

13
helpful statistic in that it can be compared across occupations with very different levels of
employment or patterns of work.
Figure 12 (below) shows the number of occupationally related, nonfatal injuries and illnesses
that result in days away from work. The first column shows the major occupational groups, the
second column shows the number of incidents, and the third column shows the incidence rate.
Occupations such as production, and transportation and material moving have very high levels
of occupationally-related accidents that result in days away from work. However, protective
service occupations, which include firefighting and prevention, law enforcement workers and
other protective service workers, have the highest incidence rate, which suggests that
Figure 12. Nonfatal Occupational Injuries and
Illnesses Involving Days Away from
Work, by Occupational Category: 2013
Number Incidence
rate
Median days away from
work
All Occupations 1,162,210 109.4 8
Management 26,750 41.7 5
Business and financial operations 9,180 16.8 8
Computer and mathematical 2,460 7.6 6
Architecture and engineering 3,510 16.8 7
Life, physical, and social science 2,390 27.4 6
Community and social services 14,460 95.1 6
Legal 1,240 13.8 5
Education, training, and library 34,830 55.9 5
Arts, design, entertainment, sports, and media 8,750 65.8 19
Healthcare practitioners and technical 64,380 104.5 7
Healthcare support 69,650 239 7
Protective Service Occupations 82,650 314.7 12
Food preparation and serving related 83,520 107.8 5
Building and grounds cleaning and maintenance 80,470 249.4 8
Personal care and service 28,570 106 5
Sales and related 63,630 58.8 9
Office and administrative support 77,900 48 8
Farming, fishing, and forestry 15,990 176.7 6
Construction and extraction 90,730 200.9 11
Installation, maintenance, and repair 95,070 206.4 10
Production 109,840 140.7 8
Transportation and material moving 192,720 253.9 14
Source: Nonfatal Occupational Injuries and Illnesses Requiring Days Away From Work, 2013. Bureau of Labor Statistics. http://www.bls.gov/news.release/pdf/osh2.pdf. See Table 3; Totals among private, state, and local government employers.
14
accounting for levels of employment and hours worked, workers in the protective service
occupations experience occupationally-related accidents that result in days away from work at
a higher rate than all other occupational groups listed.
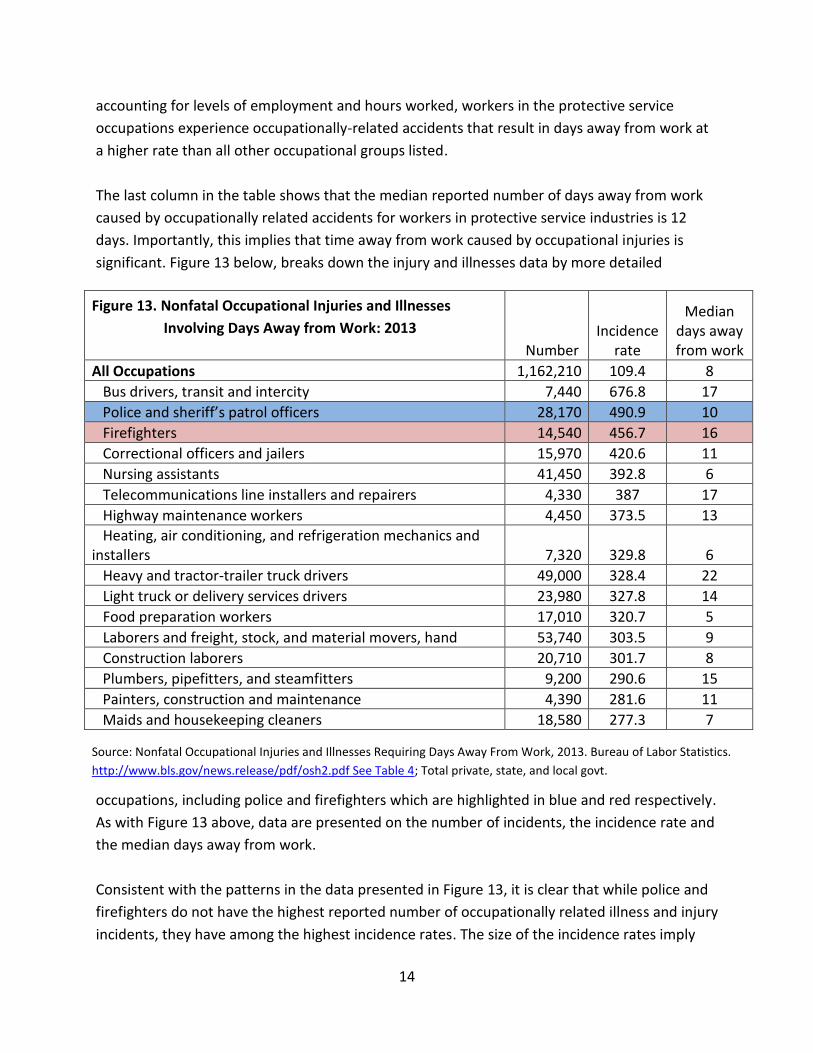
The last column in the table shows that the median reported number of days away from work
caused by occupationally related accidents for workers in protective service industries is 12
days. Importantly, this implies that time away from work caused by occupational injuries is
significant. Figure 13 below, breaks down the injury and illnesses data by more detailed
occupations, including police and firefighters which are highlighted in blue and red respectively.
As with Figure 13 above, data are presented on the number of incidents, the incidence rate and
the median days away from work.
Consistent with the patterns in the data presented in Figure 13, it is clear that while police and
firefighters do not have the highest reported number of occupationally related illness and injury
incidents, they have among the highest incidence rates. The size of the incidence rates imply
Figure 13. Nonfatal Occupational Injuries and Illnesses
Involving Days Away from Work: 2013
Number Incidence
rate
Median days away from work
All Occupations 1,162,210 109.4 8
Bus drivers, transit and intercity 7,440 676.8 17
Police and sheriff’s patrol officers 28,170 490.9 10
Firefighters 14,540 456.7 16
Correctional officers and jailers 15,970 420.6 11
Nursing assistants 41,450 392.8 6
Telecommunications line installers and repairers 4,330 387 17
Highway maintenance workers 4,450 373.5 13
Heating, air conditioning, and refrigeration mechanics and installers 7,320 329.8 6
Heavy and tractor-trailer truck drivers 49,000 328.4 22
Light truck or delivery services drivers 23,980 327.8 14
Food preparation workers 17,010 320.7 5
Laborers and freight, stock, and material movers, hand 53,740 303.5 9
Construction laborers 20,710 301.7 8
Plumbers, pipefitters, and steamfitters 9,200 290.6 15
Painters, construction and maintenance 4,390 281.6 11
Maids and housekeeping cleaners 18,580 277.3 7
Source: Nonfatal Occupational Injuries and Illnesses Requiring Days Away From Work, 2013. Bureau of Labor Statistics.
http://www.bls.gov/news.release/pdf/osh2.pdf See Table 4; Total private, state, and local govt.
15
that risks are substantial and that individuals suffer adverse impacts considerably more
frequently than in other industries.
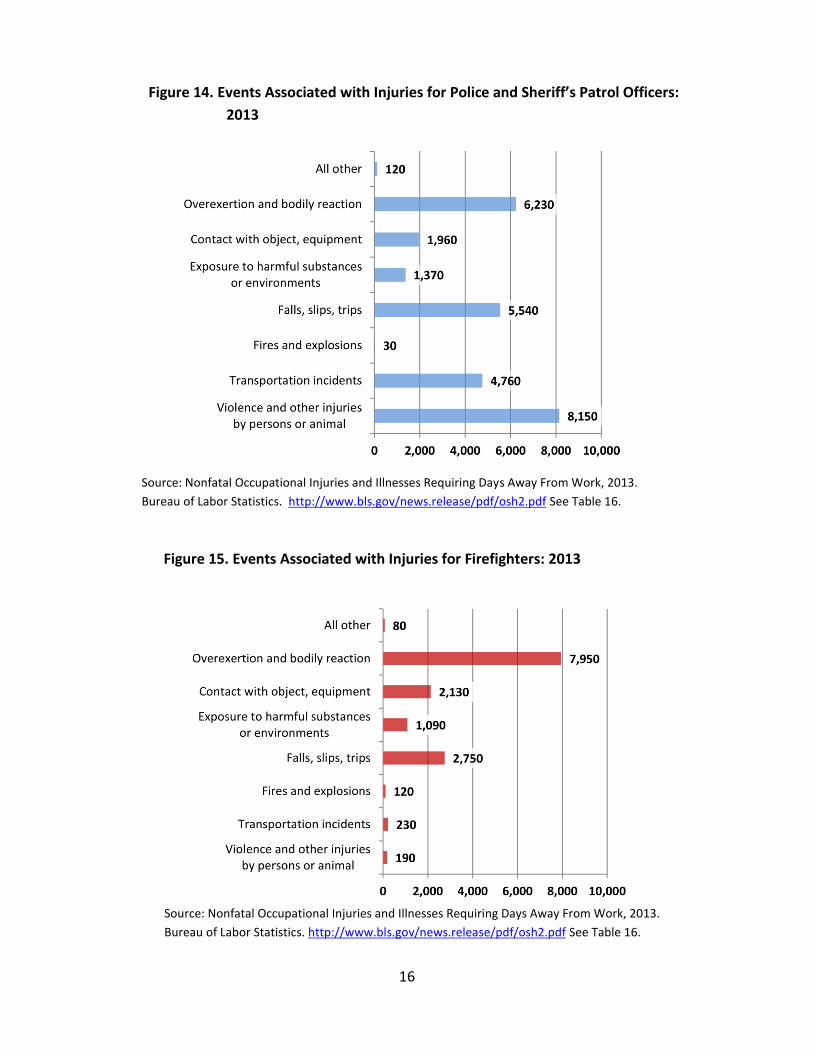
Given the high incidence rates of occupationally related injuries and illnesses, understanding
the circumstances that lead to them is important. Figure 14 below shows the general events
associated with illness or injuries that result in days away from work for police and sheriff’s
patrol officers. Incidents are predominantly associated with four categories: violence and other
injuries by persons or animal, overexertion and bodily reaction, falls and slips, and
transportation incidents. The first two categories (violence and overexertion) account for just
over 50% of the total incidents, while all four categories account for just over 85% of the total
incidents.
For firefighters, incidents are predominantly associated with overexertion and bodily reaction,
with fewer numbers of incidents caused by contact with objects, and falls and slips (Figure 15).
Approximately 55% of incidents are caused by overexertion. Incidents caused by contact with
objects, and falls and slips account for an additional 34% of all incidents.
16
Figure 15. Events Associated with Injuries for Firefighters: 2013
Source: Nonfatal Occupational Injuries and Illnesses Requiring Days Away From Work, 2013.
Bureau of Labor Statistics. http://www.bls.gov/news.release/pdf/osh2.pdf See Table 16.
Figure 14. Events Associated with Injuries for Police and Sheriff’s Patrol Officers:
2013
Source: Nonfatal Occupational Injuries and Illnesses Requiring Days Away From Work, 2013.
Bureau of Labor Statistics. http://www.bls.gov/news.release/pdf/osh2.pdf See Table 16.

17
In some cases, the hazards associated with first responder work can be extreme. Figure 16
shows the level of fatal occupational injuries sustained by individuals in various occupational
groupings. During 2013, there were 53 fatalities among fire fighting and prevention workers,
and 97 fatalities reported among law enforcement workers. Only three occupational groups
had higher rates than protective services: transportation and material moving, construction and
extraction, an
Figure 16. Fatal Occupational Injuries Among
Occupational Groups, Highlighting Protective Service Workers: 2013
Number of
Fatalities
Percent of Total
Occupational Category Totals 4,585 100%
Management 408 9%
Business and financial operations 21 *
Computer and mathematical 12 *
Architecture and engineering 37 1%
Life, physical, and social science 25 1%
Community and social services 20 *
Legal 16 *
Education, training, and library 20 * Arts, design, entertainment, sports, and media 52 1%
Healthcare practitioners and technical 60 1%
Healthcare support 18 *
Protective service 249 5%
Fire fighting and prevention 53 1%
Law enforcement workers 97 2%
Other protective service workers 69 2%
Food preparation and serving related 68 1% Building and grounds cleaning and maintenance 249 5%
Personal care and service 48 1%
Sales and related 220 5%
Office and administrative support 75 2%
Farming, fishing, and forestry 232 5%
Construction and extraction 845 18%
Installation, maintenance, and repair 370 8%
Production 213 5%
Transportation and material moving 1,255 27%
Resident Military 71 2%
* indicates values less than 0.5 Percent. Source: Census of Fatal Occupational Injuries,
Bureau of Labor Statistics. http://www.bls.gov/news.release/cfoi.t03.htm.
d installation, maintenance and repair.
18
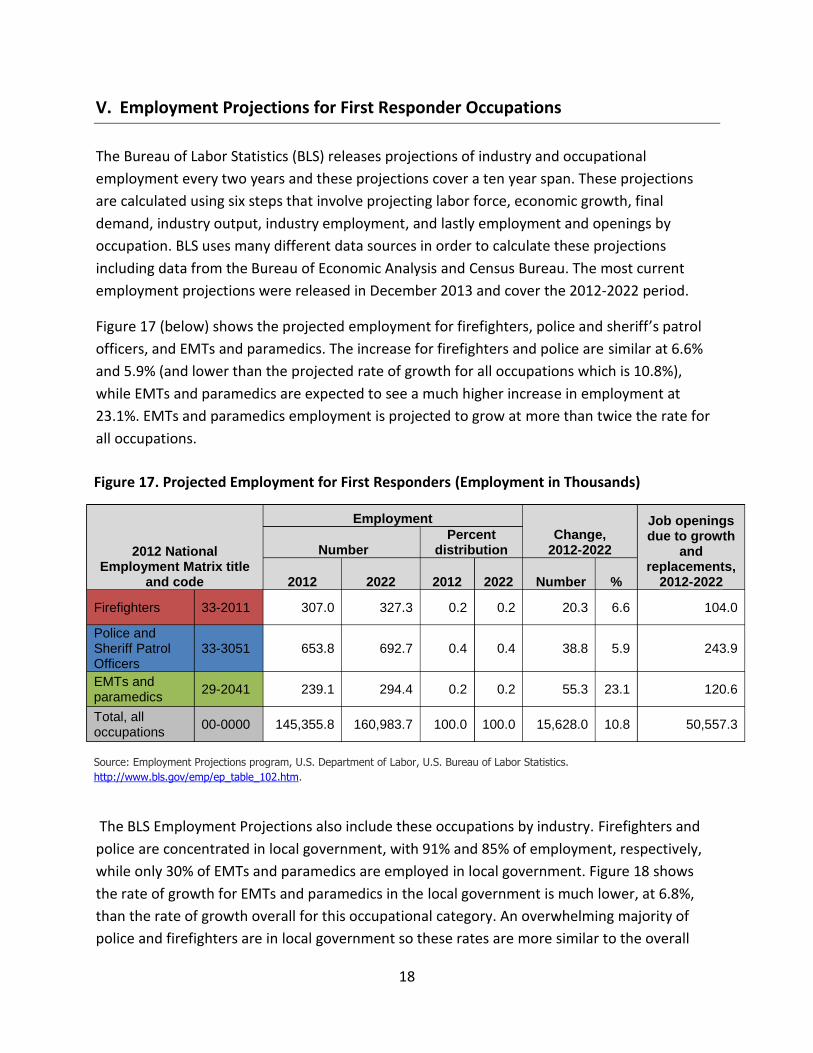
V. Employment Projections for First Responder Occupations
The Bureau of Labor Statistics (BLS) releases projections of industry and occupational
employment every two years and these projections cover a ten year span. These projections
are calculated using six steps that involve projecting labor force, economic growth, final
demand, industry output, industry employment, and lastly employment and openings by
occupation. BLS uses many different data sources in order to calculate these projections
including data from the Bureau of Economic Analysis and Census Bureau. The most current
employment projections were released in December 2013 and cover the 2012-2022 period.
Figure 17 (below) shows the projected employment for firefighters, police and sheriff’s patrol
officers, and EMTs and paramedics. The increase for firefighters and police are similar at 6.6%
and 5.9% (and lower than the projected rate of growth for all occupations which is 10.8%),
while EMTs and paramedics are expected to see a much higher increase in employment at
23.1%. EMTs and paramedics employment is projected to grow at more than twice the rate for
all occupations.
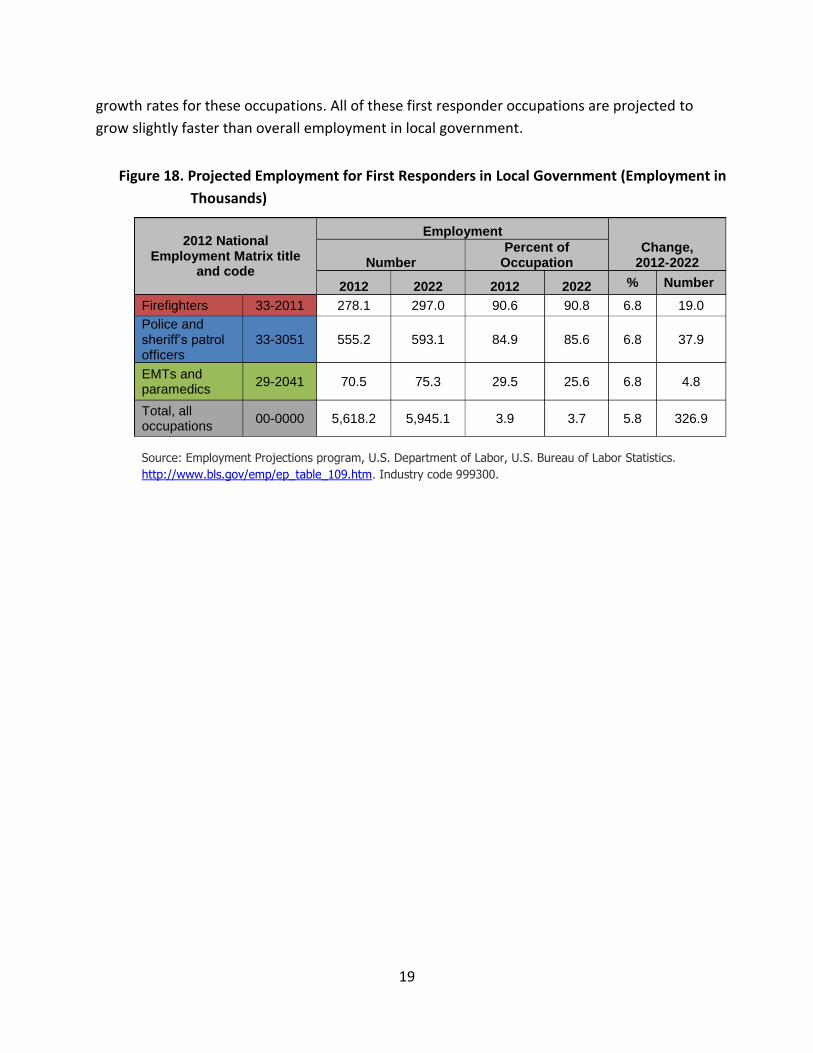
The BLS Employment Projections also include these occupations by industry. Firefighters and
police are concentrated in local government, with 91% and 85% of employment, respectively,
while only 30% of EMTs and paramedics are employed in local government. Figure 18 shows
the rate of growth for EMTs and paramedics in the local government is much lower, at 6.8%,
than the rate of growth overall for this occupational category. An overwhelming majority of
police and firefighters are in local government so these rates are more similar to the overall
Figure 17. Projected Employment for First Responders (Employment in Thousands)
Employment Job openings Percent Change, due to growth
2012 National Number distribution 2012-2022 and Employment Matrix title replacements,
and code 2012 2022 2012 2022 Number % 2012-2022
Firefighters 33-2011 307.0 327.3 0.2 0.2 20.3 6.6 104.0
Police and Sheriff Patrol 33-3051 653.8 692.7 0.4 0.4 38.8 5.9 243.9 Officers
EMTs and 29-2041
paramedics 239.1 294.4 0.2 0.2 55.3 23.1 120.6
Total, all 00-0000
occupations 145,355.8 160,983.7 100.0 100.0 15,628.0 10.8 50,557.3
Source: Employment Projections program, U.S. Department of Labor, U.S. Bureau of Labor Statistics.
http://www.bls.gov/emp/ep_table_102.htm.
19
growth rates for these occupations. All of these first responder occupations are projected to
grow slightly faster than overall employment in local government.
Figure 18. Projected Employment for First Responders in Local Government (Employment in
Thousands)
Employment 2012 National
Percent of Change, Employment Matrix title
Number Occupation 2012-2022 and code
% Number 2012 2022 2012 2022
Firefighters 33-2011 278.1 297.0 90.6 90.8 6.8 19.0
Police and sheriff’s patrol 33-3051 555.2 593.1 84.9 85.6 6.8 37.9 officers
EMTs and 29-2041 70.5 75.3 29.5 25.6 6.8 4.8
paramedics
Total, all 00-0000 5,618.2 5,945.1 3.9 3.7 5.8 326.9
occupations
Source: Employment Projections program, U.S. Department of Labor, U.S. Bureau of Labor Statistics.
http://www.bls.gov/emp/ep_table_109.htm. Industry code 999300.
20
VI. Conclusion / Summary
First responders perform essential functions that promote and ensure public safety, well-being,
and the protection of individuals. As the data in this report show, first responders in the three
groups examined, tend to be White, male, and between 20 and 54 years old. Women are
particularly underrepresented in comparison to their presence among the total employed.
Blacks are represented in police occupations in proportion to the working population, but are
underrepresented in firefighter and EMT occupations. Hispanics are underrepresented among
first responder occupations when compared to the total employed, with the lowest proportion
among EMTs.
First responders have notably higher levels of post high school education than the working-age
population, and are generally more likely to have been Veterans.
The current projected rate of growth in employment for police and firefighters is slower than
for all occupations. EMTs and paramedics are expected to see a substantial increase in
employment between 2012 and 2022. However growth in the local government for EMTs and
paramedics is much lower, at 6.8%.
Police and firefighters report higher earnings than the population as a whole. Despite these
earnings, it is important to note that first responder work is inherently dangerous, and
regrettably, leads to much higher occurrences of injuries, and resulting days away from work,
than virtually all other occupations. First responders also have higher average hours usually
worked in a week.
This report summarizes readily available public data to characterize who first responders are,
and to describe their work, however, there are a number of areas in which improved data
quality and quantity would be beneficial for characterizing first responders. The most notable is
the need for more detailed information on volunteers who work in protective service or
support career first responders. In particular, a more thorough understanding of the extent to
which these individuals could, and in practice actually do, form a pipeline for career first
responders would be helpful in guiding potential candidates towards these fields. It should be
noted that there are some existing resources such as National Fire Department Census
conducted by the U.S. Fire Administration within the Federal Emergency Management Agency
and the Department of Homeland Security, that provide information and could serve as models
for a more exhaustive and thorough collection of information.

21
Additional data would also be valuable in characterizing the typical hours worked and the
resulting wages. Differences in wages between male and female career first responders, as well
as between other groups, could be driven by a number of different factors including large
differences in reported hours worked per week, and the resulting role that overtime wages play
in constituting annual compensation. Additional specific data on less easily discerned factors
such as seniority, and the roles that individuals play within these organizations would also
provide valuable context for any differences that can be distinguished from population level
data.
The data presented in this report are descriptive statistics and are not intended to make
inferences about the diversity of the occupations nor used to evaluate the employment
practices of particular departments.

22
Technical Appendix: Data Sources and Processing Code
Identifying first responders in publicly available data
The occupational codes used to define firefighters and EMTs are standardized throughout this
report. Firefighters are defined by the detailed occupational code assignment 33-2011 and
EMTs and Paramedics are defined by the detailed occupational code assignment 29-2041. The
BLS data on Police and Sheriff’s Patrol Officers are defined by occupational code assignment 33-
3051. Data coming from the Current Population Survey uses the broad occupational code Police
Officers (33-3050), which includes Police and Sheriff’s Patrol Officers, as well as, Transit and
Railroad police (33-3052). Some statistics describing protective service may include: Detectives
and Criminal Investigators (33-3021), Fish and Game Wardens (33-3031), and Correctional
Officers and Jailers (33-3012), a complete list of occupations included in Protective Service
occupations can be found in the 2010 SOC Definitions located at
http://www.bls.gov/soc/soc_2010_definitions.pdf.
Employment Projections
Links to data:
http://www.bls.gov/ooh/protective-service/firefighters.htm#tab-6
http://www.bls.gov/ooh/protective-service/police-and-detectives.htm#tab-6
http://www.bls.gov/ooh/healthcare/emts-and-paramedics.htm#tab-6
Processing Code: Not applicable.
Description:
The Employment Projections (EP) program develops information about the labor market for the
Nation as a whole for 10 years in the future. The data compiled for this report largely comes
from the 2014–15 Occupational Outlook Handbook (OOH). This handbook is one of the nation’s
most widely used sources of career information, and is used by career counselors, students,
parents, teachers, jobseekers, career changers, education and training officials, and
researchers. The 2014–15 OOH includes 334 occupational profiles covering 580 detailed
occupations, or about 84 percent of total employment in 2012.
Technical details: Data can be tabulated for specific occupations, or for broader occupational
groups. As an example, the BLS occupational grouping for Police and Detectives is actually
comprised of four separate, specific occupational codes: Detectives and Criminal Investigators
(33-3021), Fish and Game Wardens (33-3031), Police and Sheriff’s Patrol Officers (33-3051), and
Transit and Railroad Police (33-3052). Additional information on the methods used for the

23
2012-2022 projections appears in five articles in the Monthly Labor Review. Links to these
articles are available at www.bls.gov/emp/publications.htm.
Occupational Employment Statistics (OES)
Link to data: http://www.bls.gov/oes/tables.htm
Processing Code: Not applicable.
Description: The OES program produces employment and wage estimates annually for over 800
occupations. These estimates are available for the nation as a whole, for individual States, and
for metropolitan and nonmetropolitan areas; national occupational estimates for specific
industries are also available.
Technical details: For years from 2000 through 2013, data were taken from national estimates,
using the following occupational identifiers: 29-2041, Emergency Medical Technicians and
Paramedics; 33-2011, Firefighters; 33-3051, Police and Sheriff's Patrol Officers. Data elements
and estimates used include levels of employment, mean and median hourly wage, and annual
mean wage.
Current Population Survey (CPS) Annual Averages 2014
Link to data: http://thedataweb.rm.census.gov/ftp/cps_ftp.html
Processing Code: Will be posted to the CEO website.
Description: The Current Population Survey (CPS) of the U.S. Census Bureau and the U.S.
Bureau of Labor Statistics. About 60,000 occupied households are surveyed each month. The
individuals eligible for the CPS are the civilian non-institutional population residing in the
United States and those armed forces members living with civilians either on or off base within
these households. The CPS provides data on characteristics such as age, sex, and educational
attainment that are collected along with economic data on earnings and occupation. The
estimates for annual averages are a compilation of the monthly data.
Technical details: Total employed 16+ are defined as those who were employed during the
month of interview and older than 15 (PREMPNOT=1) and PRTAGE>=16. Individuals were
categorized by their occupation code for their primary job. The first responder categories were
classified by emergency medical technicians (EMTs) and paramedics (PEIO1OCD=3400),
firefighters (PEIO1OCD=3740), and police officers (PEIO1OCD=3850). Link to the record layout
http://thedataweb.rm.census.gov/pub/cps/basic/201401-/January_2014_Record_Layout.txt
24
Current Population Survey (CPS) Annual Social and Economic Supplement (ASEC) 2014
Link to data: http://thedataweb.rm.census.gov/ftp/cps_ftp.html
Processing Code: Will be posted to the CEO website.
Description: The ASEC sample is based on the civilian noninstitutionalized population of the
United States living in housing units and includes members of the Armed Forces living with
civilians on or off a military base. The ASEC file includes the usual monthly labor force data in
addition to supplemental data on work experience, income, noncash benefits, and migration.
Additional data for persons 15 years old and older are available concerning weeks worked,
usual hours worked per week, and total income. Data are self-reported and information on
demographics refers to the time of the survey while supplemental data on employment and
income refer to the preceding year.
Technical details: Working population 16+ is defined as those who worked at a job or business
during 2013, or those who performed temporary, part-time, or seasonal work (WORKYN=1 or
WTEMP=1) and A-AGE>=16 , this is also the population included in the average hours.
Individuals were categorized by the occupation of the longest job held. The first responder
categories were classified by emergency medical technicians (EMTs) and paramedics
(OCCUP=3400), firefighters (OCCUP=3740), and police officers (OCCUP=3850). The cases
included in the earnings averages were those that had earnings from the longest job recode
(ERN-YN=1). First responders with earnings above the swap threshold (ERN-VAL>250,000) were
chosen for review. Two first responder cases were well above this threshold and excluded from
the average earnings. This cut off was chosen due to the rank proximity swapping method for
disclosure avoidance in the 2014 ASEC. Link to the technical documentation for variable
definitions http://www2.census.gov/programs-surveys/cps/techdocs/cpsmar14revised.pdf.