characteristics of h-1b specialty occupation workers ... · february 26, 2015 on behalf of the...
TRANSCRIPT

Characteristics of H-1B Specialty Occupation Workers Fiscal Year 2014 Annual Report to Congress
October 1, 2013 – September 30, 2014
February 26, 2015
U.S. Citizenship and
Immigration Services
i
Assistant Secretary for Legislative Affairs
U.S. Department of Homeland Security
Washington, DC 20528
Foreword
February 26, 2015
On behalf of the Department of Homeland Security, I am pleased to present the following report,
“Characteristics of H-1B Specialty Occupation Workers” for Fiscal Year 2013, prepared by U.S.
Citizenship and Immigration Services.
Pursuant to statutory requirements, this report is being provided to the following Members of
Congress:
The Honorable Charles Grassley
Chairman, Senate Judiciary Committee
The Honorable Patrick J. Leahy
Ranking Member, Senate Judiciary Committee
The Honorable Robert W. Goodlatte
Chairman, House Judiciary Committee
The Honorable John Conyers, Jr.
Ranking Member, House Judiciary Committee
Inquiries relating to this report may be directed to me at (202) 447-5890.
Respectfully,
Brian de Vallance
Assistant Secretary for Legislative Affairs

ii
Executive Summary
The American Competitiveness and Workforce Improvement Act of 1998 (ACWIA),
Pub. L. No. 105-277, div. C, tit. IV § 416(c)(2), 112 Stat. 2681, imposes annual reporting
requirements on U.S. Citizenship and Immigration Services (USCIS) concerning the countries of
origin and occupations of, educational levels attained by, and compensation paid to, aliens who
were issued visas or otherwise provided nonimmigrant status under section 101(a)(15)(H)(i)(b)
of the Immigration and Nationality Act (INA) during the previous fiscal year (FY).
To fulfill this requirement, USCIS submits the following report for FY 2014, October 1, 2013–
September 30, 2014.
Highlights
The number of H-1B petitions filed increased 6 percent from 299,467 in FY 2013 to
318,824 in FY 2014.
The number of H-1B petitions approved increased 10 percent from 286,773 in FY 2013
to 315,857 in FY 2014.1
Seventy-two percent of H-1B petitions approved in FY 2014 were for workers between
the ages of 25 and 34.
Forty-five percent of H-1B petitions approved in FY 2014 were for workers with a
bachelor’s degree, 43 percent had a master’s degree, 8 percent had a doctorate, and
4 percent were for workers with a professional degree.
Sixty-five percent of H-1B petitions approved in FY 2014 were for workers in computer-
related occupations.
The median salary of beneficiaries of approved petitions increased from $72,000 for FY
2013 to $75,000 for FY 2014.
1 This number does not reflect approval versus denial rates, but rather shows the number of approved petitions
overall this year versus the number approved last year. The figures for Fiscal Year 2014 include 57,410
petitions which were received prior to Fiscal Year 2014, but were approved in Fiscal Year 2014 (see footnote
11).

iii
Characteristics of H-1B Specialty Occupation Workers
Table of Contents
I. Legislative Requirement .......................................................................................................... 1
II. Background ............................................................................................................................. 2
III. Data Report ............................................................................................................................. 4
Section 3.1 – General distribution of petitions ....................................................................... 4
Section 3.2 – Distribution of petitions by country of birth ..................................................... 6
Section 3.3 – General distribution of petitions by age ............................................................ 9
Section 3.4 – Distribution of petitions by education .............................................................. 9
Section 3.5 – Distribution of petitions by occupation.............................................................11
Section 3.6 – Distribution of petitions by annual compensation ............................................16
Section 3.7 – Distribution of petitions by industry .................................................................19
IV. Appendices .............................................................................................................................22
A. H-1B petition processing ..................................................................................................22
B. Data Limitations ................................................................................................................22

1
I. Legislative Requirement
Section 416(c)(2) of the American Competitiveness and Workforce Improvement Act of 1998
(ACWIA), Pub. L. No. 105-277, div. C, tit. IV, 112 Stat. 2681, includes the following reporting
requirement:2
[T]he Attorney General3 shall submit on an annual basis, to the Committees on the
Judiciary of the United States House of Representatives and the Senate, information on
the countries of origin and occupations of, educational levels attained by, and
compensation paid to, aliens who were issued visas or otherwise provided nonimmigrant
status under section 101(a)(15)(H)(i)(b) of the Immigration and Nationality Act during
the previous fiscal year.
2 Sections 416(c)(1) and (3) of ACWIA, Pub. L. No. 105-277, div. C, tit. IV, 112 Stat. 2681, require the submission
of data on the number of aliens issued visas or otherwise provided nonimmigrant status pursuant to petitions filed by
institutions or organizations described in section 212(p) of the INA. This data is included in the “Report on H1B
Petitions” for Fiscal Year 2014. 3 As of March 1, 2003, in accordance with section 1517 of Title XV of the Homeland Security Act of 2002 (HSA),
Pub. L. No. 107-296, 116 Stat. 2135, any reference to the Attorney General in a provision of the Immigration and
Nationality Act describing functions which were transferred from the Attorney General or other Department of
Justice official to the Department of Homeland Security by the HSA “shall be deemed to refer to the Secretary” of
Homeland Security. See 6 USC 557 (2003) (codifying HSA, Title XV, § 1517).

2
II. Background
An H-1B temporary worker is an alien admitted to the United States to perform services in a
“specialty occupation.”4
The H-1B nonimmigrant classification is a vehicle through which a qualified alien may seek
admission to the United States on a temporary basis to work in his or her field of expertise. An
H-1B petition can be filed for an alien to perform services in a specialty occupation, services of
an exceptional nature relating to a Department of Defense (DOD) cooperative research and
development project or coproduction project, or services of distinguished merit and ability in the
field of fashion modeling. Prior to employing an H-1B temporary worker, the U.S. employer
must first file a Labor Condition Application (LCA) with Department of Labor (DOL) and then
file an H-1B petition with USCIS.5 The LCA specifies the job, salary, length, and geographic
location of employment. The employer must agree to pay the alien the greater of the actual or
prevailing wage for the position.
To qualify as a specialty occupation, the position must meet one of the following requirements:
(1) a bachelor’s or higher degree or its equivalent is normally the minimum entry requirement for
the position; (2) the degree requirement is common to the industry in parallel positions among
similar organizations or, in the alternative, the position is so complex or unique that it can be
performed only by an individual with a degree; (3) the employer normally requires a degree or its
equivalent for the position; or (4) the nature of the specific duties is so specialized and complex
that the knowledge required to perform the duties is usually associated with attainment of a
bachelor’s or higher degree. See 8 CFR 214.2(h)(4)(iii)(A).
In order to perform services in a specialty occupation, an alien must meet one of the following
criteria: (1) hold a U.S. bachelor’s or higher degree as required by the specialty occupation from
an accredited college or university; (2) possess a foreign degree determined to be equivalent to a
U.S. bachelor’s or higher degree as required by the specialty occupation from an accredited
college or university; (3) have any required license or other official permission to practice the
occupation (for example, architect, surveyor, physical therapist) in the state in which
employment is sought; or (4) have education, specialized training, or progressively responsible
experience (or a combination thereof) that is equivalent to completion of a U.S. bachelor’s
degree or higher in the specialty occupation, and have recognition of expertise through
progressively responsible positions directly related to the specialty occupation. See 8 CFR
214.2(h)(4)(iii)(C). Specialty occupations may include, but are not limited to, computer systems
analysts and programmers, physicians, professors, engineers, and accountants. See 8 CFR
214.2(h)(4)(ii).
4 Section 214(i)(1) of the INA, 8 USC 1184(i)(1), defines a specialty occupation as “an occupation that requires—
(A) theoretical and practical application of a body of highly specialized knowledge, and (B) attainment of a
bachelor’s or higher degree in the specific specialty (or its equivalent) as a minimum for entry into the occupation in
the United States.” 5 An LCA is not required for petitions involving DOD cooperative research and development projects or
coproduction projects. 8 CFR 214.2(h)(4)(vi)(A)(2).

3
Although USCIS is responsible for evaluating an alien’s qualifications for the H-1B
classification and effecting a change of nonimmigrant status for aliens already in the United
States in another nonimmigrant classification, approval of an H-1B petition does not guarantee
issuance of an H-1B visa or admission to the United States in H-1B status. The responsibility
for visa issuance rests primarily with U.S. Department of State (DOS), which determines
whether a prospective alien employee is eligible for issuance of a visa at a U.S. Embassy or
Consulate abroad after the H-1B petition has been approved by USCIS. Determinations of
whether to admit an alien in H-1B status are made by U.S. Customs and Border Protection
(CBP) at a port-of-entry. Possession of a visa does not guarantee admission.
An alien generally may be admitted to the United States in H-1B status for a maximum period of
six years, see INA 214(g)(4); however, each H-1B petition may only be approved for a
maximum period of three years.6 See 8 CFR 214.2(h)(9)(iii)(A)(1). The H-1B petition may be
used to sponsor an alien for an initial period of H-1B employment or to extend or change the
authorized stay of an alien previously admitted to the United States in H-1B status or another
nonimmigrant status. An employer may file the petition to sponsor an alien who currently has
H-1B nonimmigrant status working for another employer or amend a previously approved
petition. Therefore, the total number of approved petitions in any given fiscal year may exceed
the actual number of aliens who are provided nonimmigrant status in the H-1B classification. At
the end of the six-year period, the alien must either change to a different status (if eligible) or
depart the United States, unless otherwise exempt.7 USCIS regulations provide that an alien who
has resided and been physically present outside the United States for at least one year may be
eligible for a new six-year period of admission in H-1B status. See 8 CFR 214.2(h)(13)(iii)(A).
When the H-1B category was enacted in 1990, Congress set a maximum of 65,000 aliens who
could be issued H-1B visas or otherwise provided H-1B status during each fiscal year. This
limitation, commonly referred to as the “H-1B cap,” does not apply to H-1B petitions filed on
behalf of certain aliens who have previously been counted against the cap. Thus, generally, a
petition to extend an H-1B nonimmigrant’s period of stay, change the conditions of the H-1B
nonimmigrant’s current employment, or request new H-1B employment for an H-1B worker
already in the United States will not count against the H-1B fiscal year cap. An approved
petition for initial employment is also exempt from the cap if the petitioner is an institution of
higher education or nonprofit entity affiliated with or related to an institution of higher
education, or if the petitioner is a nonprofit research organization or governmental research
organization. See INA 214(g)(5)(A)-(B), 8 USC 1184(g)(5)(A)-(B).
The Immigration Act of 1990, ACWIA, and the American Competitiveness in the Twenty-first
Century Act of 2000 (AC21), made significant changes to policy and procedure governing the
6 An alien involved in DOD cooperative research and development projects or coproduction projects may be
admitted to the United States in H-1B status for a maximum period of ten years, see 8 CFR 214.2(h)(13)(iii)(B);
however, the H-1B petition may only be approved for a maximum period of five years. See 8 CFR
214.2(h)(9)(iii)(A)(2). 7 Certain aliens are exempt from the 6-year maximum period of admission under the provisions of the American
Competitiveness in the Twenty-First Century Act of 2000 (AC21), Pub. L. No. 106-313, 114 Stat. 1251.

4
H-1B classification, including providing temporary increases in the fiscal year limitations on the
number of aliens who may be issued H-1B visas or otherwise provided H-1B status and
providing certain exemptions to these limitations. Under ACWIA, the annual ceiling was
increased from 65,000 to 115,000 in FYs 1999 and 2000 and to 107,500 in FY 2001. AC21
raised the limit in FY 2001, FY 2002, and FY 2003 to 195,000. Starting in FY 2004, the H-1B
cap reverted to 65,000 per fiscal year and remains at that level.8 These statutory provisions also
provided for certain exemptions from the fiscal year H-1B cap, as described above. The H-1B
Visa Reform Act of 2004 mandated that up to 20,000 H-1B petitions filed on behalf of aliens with
U.S.-earned master’s or higher degrees will be exempt from each fiscal year’s H-1B cap. See
INA 214(g)(5)(C), 8 USC 1184(g)(5)(C).
III. Data Report
Section 3.1 – General distribution of petitions
During FY 2014, USCIS approved 315,857 H-1B petitions submitted by employers on behalf of
alien workers. The number of approved petitions exceeds the number of individual H-1B
workers sponsored because of the different types of petitions that can be filed (e.g., requests for
concurrent employment with another employer, requests for extension of stay, amended
petitions).
Table 1 shows for FYs 2011 to 2014 the number of petitions filed for initial and continuing
employment and the number of petitions approved for initial and continuing employment. Of the
petitions approved in 2014, a total of 124,326 petitions, or 39 percent, were for initial
employment.9 The corresponding number of petitions for continuing employment was 191,531.10
A worker may have had a second (or subsequent) petition filed on his or her behalf to: 1) extend
the period allowed to work with their current employer; 2) notify USCIS of changes in the
conditions of employment, including a change of employer; or 3) request concurrent H-1B status
with another employer.
8 Each fiscal year, up to 1,400 H-1B visa numbers are set aside for nationals of Chile and up to 5,400 are set aside
for nationals of Singapore under the provisions of free trade agreements between the U.S. and each country. See
INA 214(g)(8)(B)(ii), 8 USC 1184(g)(8)(B)(ii). In addition, there is a limit of no more than 100 aliens in the U.S. at
any time performing services in a DOD cooperative research and development projects or coproduction projects.
See 8 CFR 214.2(h)(8)(i)(B). 9 The terms “initial employment” and “continuing employment” are used throughout this report to identify two types
of petitions. Petitions for initial employment are filed for first-time H-1B employment with an employer, only some
of which are applied to the annual cap. Examples of petitions for initial employment that are exempt from the cap
include petitions submitted by nonprofit research organizations or governmental research organizations. Continuing
employment petitions refer to extensions, sequential employment, and concurrent employment, which are filed for
aliens already in the United States. Extensions generally are filed for H-1B workers intending to work beyond the
initial 3-year period up to a total of six years, the maximum period generally permissible under law. Sequential
employment refers to petitions for workers transferring between H-1B employers within the 6-year period. Finally,
petitions for concurrent employment are filed for H-1B workers intending to work simultaneously for an additional
H-1B employer. 10 Neither AC21 nor prior legislation established a cap on H-1B petitions for continuing employment.

5
The number of H-1B petitions filed increased 6 percent and petitions approved increased by 10
percent between FYs 2013 and 2014. For initial employment, petitions filed decreased 2 percent
and petitions approved decreased by 3 percent. Petitions filed for continuing employment
increased 13 percent and petitions approved increased by 21 percent.
Table 1. H-1B Petitions Filed and Approved by Type of Petition:
FYs 2011 to 2014
FY 2011 FY 2012 FY 2013 FY 2014
Petitions filed 267,654 307,713 299,467 318,824
Initial Employment 114,529 155,292 130,034 127,205
Continuing Employment 153,125 152,421 169,433 191,619
Petitions approved
11 269,653 262,569 286,773 315,857
Initial Employment 106,445 136,890 128,291 124,326
Continuing Employment 163,208 125,679 158,482 191,531
Table 2 shows the number of H-1B petitions filed by quarter in FYs 2011 to 2014. More than
eighty-one percent of filings for initial employment occurred in the third quarter of FY 2014,
when the cap-subject petition filing season opened. Sixty-one percent of filings for continuing
employment were received in the third and fourth quarters of FY 2014.
Table 2. H-1B Petitions Filed by Quarter:
FYs 2011 to 2014
Quarter FY
2011
FY
2012
FY
2013
FY
2014
FY 2014
Initial
Employment
Percent
of Total
FY 2014
Continuing
Employment
Percent
of Total
Total 267,654 307,713 299,467 318,824 127,205 100 191,619 100
October-December 55,781 65,186 40,048 45,211 6,681 5.3 38,530 20.1
January-March 44,995 36,217 39,433 42,781 7,221 5.7 35,560 18.6
April-June 86,716 150,104 159,380 158,623 103,473 81.3 55,150 28.8
July-September 80,162 56,206 60,606 72,709 9,830 7.7 62,379 32.6
Note: Sum of the percent may not add to 100 due to rounding.
11 These figures represent all approved petitions during the respective fiscal year, irrespective of whether the petition
was filed in the same or in a previous fiscal year. To illustrate, in FY 2014, USCIS received 318,824, but approved
315,857 petitions. Of the 315,857 petitions that were approved, 258,447 were received in FY 2014, whereas 57,410
petitions were received prior to FY 2014.

6
Table 3 provides a breakdown of approved petitions in FYs 2011 to 2014 by type of petition.
124,326 H-1B beneficiaries were approved for initial employment and 191,531 for continuing
employment in FY 2014.
The number of aliens outside the United States approved for initial employment decreased less
than 1 percent from 68,785 in FY 2013 to 68,390 in FY 2014. The corresponding number of
petitions approved for aliens in the United States requesting a change to H-1B status decreased
by 6 percent from 59,506 in FY 2013 to 55,936 in FY 2014.
Table 3. H-1B Petitions Approved by Type:
FYs 2011 to 2014
Petitions Approved
Type of Petition FY2011 Percent FY2012 Percent FY2013 Percent FY2014 Percent
Total 269,653 100 262,569 100 286,773 100 315,857 100
Initial
employment 106,445 39 136,890 52 128,291 45 124,326 39
Aliens outside
U.S. 48,665 18 74,997 28 68,785 24 68,390 22
Aliens in U.S. 57,780 21 61,893 24 59,506 21 55,936 18
Continuing
employment 163,208 61 125,679 48 158,482 55 191,531 61
Note: Sum of the percent may not add to 100 due to rounding.
Section 3.2 – Distribution of petitions by country of birth
Tables 4A and 4B show the distribution of beneficiaries by country of birth.12 Of the H-1B
petitions approved in FY 2014, 70 percent reported that the beneficiary was born in India. The
second most prevalent country of birth of H-1B beneficiaries was the People’s Republic of
China, representing 8 percent of all beneficiaries. The number of beneficiaries from India
approved for initial employment increased less than 1 percent in FY 2014, while the number of
beneficiaries approved for continuing employment increased 31 percent in FY 2014.
12 Data represent countries and territories of birth.

7
Table 4A. H-1B Petitions Approved by Country of Birth of Beneficiary and Type of
Petition (Number): FYs 2013 and 2014
All Beneficiaries Initial Employment Continuing Employment
Country of Birth FY 2013 FY 2014 FY 2013 FY 2014 FY 2013 FY 2014
Number Number Number Number Number Number
Total 286,773 315,857 128,291 124,326 158,482 191,531
India 187,270 220,286 81,992 82,263 105,278 138,023
China, People's Republic 23,429 26,393 12,651 13,708 10,778 12,685
Canada 7,971 6,853 3,096 2,561 4,875 4,292
Philippines 6,152 5,157 1,673 1,318 4,479 3,839
South Korea 4,843 4,390 2,310 2,012 2,533 2,378
United Kingdom 3,680 3,307 1,595 1,211 2,085 2,096
Mexico 3,114 2,768 1,260 1,038 1,854 1,730
Taiwan 2,470 2,406 1,260 1,176 1,210 1,230
France 2,322 2,218 1,161 920 1,161 1,161
Japan 2,464 1,983 929 691 1,535 1,292
Pakistan 2,147 1,923 851 787 1,296 1,136
Nepal 1,652 1,735 844 769 808 966
Germany 1,767 1,625 900 751 867 874
Turkey 1,683 1,619 801 672 882 947
Brazil 1,649 1,546 765 692 884 854
Colombia 1,361 1,290 529 447 832 843
Italy 1,381 1,283 760 634 621 649
Russia 1,313 1,241 741 573 572 668
Venezuela 1,310 1,230 583 439 727 791
Spain 1,188 1,155 716 573 472 582
Other countries 27,607 25,449 12,874 11,091 14,733 14,495
Note: Countries of birth are ranked based on FY 2014 data.

8
Table 4B. H-1B Petitions Approved by Country of Birth of Beneficiary and Type of
Petition (Percent): FYs 2013 and 2014
All Beneficiaries Initial Employment Continuing Employment
Country of Birth FY 2013 FY 2014 FY 2013 FY 2014 FY 2013 FY 2014
Percent Percent Percent Percent Percent Percent
Total ------ ------ ------ ------ ------ ------
Country of birth 100 100 100 100 100 100
India 65.3 69.7 63.9 66.2 66.4 72.1
China, People's Republic 8.2 8.4 9.9 11 6.8 6.6
Canada 2.8 2.2 2.4 2.1 3.1 2.2
Philippines 2.2 1.6 1.3 1.1 2.8 2.0
South Korea 1.7 1.4 1.8 1.6 1.6 1.2
United Kingdom 1.3 1.0 1.2 1.0 1.3 1.1
Mexico 1.1 0.9 1.0 0.8 1.2 0.9
Taiwan 0.9 0.8 1.0 0.9 0.8 0.6
France 0.8 0.7 0.9 0.7 0.7 0.6
Japan 0.9 0.6 0.7 0.6 1.0 0.7
Pakistan 0.7 0.6 0.7 0.6 0.8 0.6
Nepal 0.6 0.5 0.7 0.6 0.5 0.5
Germany 0.6 0.5 0.7 0.6 0.6 0.5
Turkey 0.6 0.5 0.6 0.5 0.6 0.5
Brazil 0.6 0.5 0.6 0.6 0.6 0.4
Colombia 0.5 0.4 0.4 0.4 0.5 0.4
Italy 0.5 0.4 0.6 0.5 0.4 0.3
Russia 0.5 0.4 0.6 0.5 0.4 0.3
Venezuela 0.5 0.4 0.5 0.4 0.5 0.4
Spain 0.4 0.4 0.6 0.5 0.3 0.3
Other countries 9.6 8.1 10.0 8.9 9.2 7.6
Notes: Countries of birth are ranked based on FY 2014 data.
Sum of the percent may not add to 100 due to rounding.

9
Section 3.3 – Distribution of petitions by age
Table 5 shows the age distribution of the H-1B beneficiaries in FY 2014 by type of petition.
Seventy-two percent of workers granted H-1B status during FY 2014 were between 25 and 34
years of age at the time their petitions were approved. Thirty-eight percent of initial
beneficiaries were under 30, compared with over 29 percent of continuing beneficiaries.
Table 5. H-1B Petitions Approved by Age of Beneficiary at Time of Approval
and by Type of Petition: FY 2014
Age All
Beneficiaries
Percent Initial
Employment
Percent Continuing
Employment
Percent
Total 315,857 124.326 191,531
Age known 315,796 100 128,284 100 191,512 100
Under 20 53 0.02 26 0.02 27 0.01
20-24 12,013 3.8 10,642 8.56 1,371 0.72
25-29 107,787 34.13 52,627 42.34 55,160 28.8
30-34 118,513 37.53 38,782 31.2 79,731 41.63
35-39 52,457 16.61 15,186 12.22 37,271 19.46
40-44 15,899 5.03 4,460 3.59 11,439 5.97
45-49 5,482 1.74 1,489 1.2 3,993 2.08
50-54 2,185 0.69 632 0.51 1,553 0.81
55-59 891 0.28 286 0.23 605 0.32
60-64 341 0.11 95 0.08 246 0.13
65 and over 175 0.06 59 0.05 116 0.06
Age unknown 61 ------ 42 ------ 19 ------
Notes: Anyone reported as under 16 years old and not a fashion model was assumed to be of unknown age.
Age of beneficiary is calculated based on the date the petition was approved.
Sum of the percent may not add to 100 due to rounding.
Percentages shown in the table are based on the total number of approved petitions with known ages.
Section 3.4 – Distribution of petitions by education
Tables 6 and 7 show the highest level of education achieved by the beneficiaries at the time of
filing the petition. Employers are asked to provide the highest degree (domestic or foreign)
when completing the H-1B petition, but not training or experience deemed equivalent to a
degree. The reporting of a domestic or foreign degree is not required in a standard format on
USCIS or DOL forms. However, in nearly all cases, the petitioning employer provides the
information in supporting documentation. For degrees earned outside the United States, the
employer usually supplies a credential evaluation stating that the foreign degree is “equivalent
to” a particular U.S. degree. USCIS does not maintain separate data regarding whether the

10
degree was earned in the United States or abroad. (Data on beneficiaries with U.S. advanced
degrees has been available since May 2005.)
The breakdown of the highest level of education achieved by H-1B beneficiaries remained
mostly constant between FYs 2013 and 2014. As shown in Table 6, 45 percent of all H-1B
petitions approved for workers in FY 2014 reported that the beneficiary had earned the
equivalent of a bachelor’s degree, 43 percent a master’s degree, 8 percent a doctorate, and 4
percent a professional degree.
Table 6. Percent of H-1B Petitions Approved by Level of Education:
FYs 2011-2014
Level of Education FY 2011 FY 2012 FY 2013 FY 2014
Education known 100 100 100 100
Less than a Bachelor's degree 1 1 1 1
Bachelor's degree 41 46 45 45
Master's degree 42 41 41 43
Doctorate degree 11 8 9 8
Professional degree 5 4 3 4
Note: Sum of percent may not add to 100 due to rounding.
Table 7. H-1B Petitions Approved by Level of Education of Beneficiary
and Type of Petition: Fiscal Year 2014
Level of Education All
Be
Percent Initial
Employment
Percent Continuing
Employment
Percent
Beneficiaries Employment Employment
Total 315,857 124,326 191,531
Education known 315,828 100 124,314 100 191,514 100
No high school diploma 78 0.02 32 0.03 46 0.02
High school graduate 268 0.08 133 0.11 135 0.07
Less than 1 year of college credit 60 0.02 18 0.01 42 0.02
1 or more years of college credit,
no diploma 362 0.11 133 0.11 229 0.12
Associate's degree 308 0.1 88 0.07 220 0.11
Bachelor's degree 142,148 45.01 56,843 45.73 85,305 44.54
Master's degree 136,188 43.12 51,058 41.07 85,130 44.45
Doctorate degree 24,468 7.75 11,839 9.52 12,629 6.59
Professional degree 11,948 3.78 4,170 3.35 7,778 4.06
Education unknown 29 ------- 12 ------ 17 ------
Notes: Sum of the percent may not add to 100 due to rounding.
Percentages shown in the table are based on the number of approved petitions with known levels of
education.

11
Section 3.5 – Distribution of petitions by occupation
Occupational Category
Tables 8A and 8B show the distribution of beneficiaries by occupational category for FYs 2013
and 2014. The category of computer-related occupations was the largest occupational category
in 2014; its share of total petitions approved was 65 percent in FY 2014. The corresponding
shares for initial employment and continuing employment in computer-related occupations were
65 and 64 percent, respectively. The top ten occupational categories representing 98 percent of
all beneficiaries had more continuing employment than initial employment beneficiaries.
The number of H-1B petitions approved for workers in computer-related occupations increased
by 19 percent from 2013 to 2014. The number of H-1B petitions for all other occupation groups
remained relatively constant between 2013 and 2014.

12
Table 8A. H-1B Petitions Approved by Major Occupation Group of Beneficiary and Type
of Petition (Number): Fiscal Years 2013 and 2014
All
Beneficiaries
Initial
Employment
Continuing
Employment
Occupational Category FY2013 FY2014 FY2013 FY2014 FY2013 FY2014
Number Number Number Number Number Number
Total 286,773 315,857 128,291 124.326 158,482 191,531
Occupation known 284,851 313,930 127,536 123,591 157,315 190,339
Computer-related occupations 171,613 203,425 79,870 80,877 91,743 122.368
Occupations in Architecture, Engineering
and Surveying 27,495 29,103 11,642 10,707 15,853 18,396
Occupations in Administrative Specializations 18,771 18,905 8,500 7,395 11,401 11,510
Occupations in Education 20,370 18,680 8,969 8,393 10,271 10,287
Occupations in Medicine and Health 17,138 15,358 5,587 5,020 11,551 10,338
Occupations in Mathematics and Physical Sciences 5,303 5,571 2,405 2,295 2,898 3,276
Managers and Officials N.E.C.* 5,775 5.453 2,079 1,699 3,696 3,754
Occupations in Life Sciences 5,247 4,746 2,518 2,158 2,729 2,588
Occupations in Social Sciences 3,882 3,920 1,777 1,567 2,105 2,353
Miscellaneous Professional, Technical, and
Managerial 3,882 3,861 1,639 1,294 2,243 2,567
Occupations in Art 2,613 2,518 1,200 958 1,413 1,560
Occupations in Law and Jurisprudence 982 1,018 505 486 477 532
Occupations in Writing 733 646 341 305 392 341
Miscellaneous13 473 405 219 186 254 219
Occupations in Entertainment and Recreation 211 178 90 89 121 89
Occupations in Museum, Library, and Archival
Sciences 157 158 76 71 81 87
Occupations in Religion and Theology 119 92 45 40 74 52
Sales Promotion Occupations 87 73 74 51 13 22
Occupation unknown14
1,922 1,927 755 735 1,167 1,192
Notes: Occupations ranked based on FY 2014 data.
*N.E.C. indicates not elsewhere classified.
13 The Miscellaneous category is a Major Occupation Group whose numbers are derived from the Detailed
Occupations listed in Table 9A. A full listing of the Major Occupation Groups and the corresponding Detailed
Occupations can be found in form M-746 http://www.uscis.gov/files/form/m-746.pdf. 14 The data in this chart is pulled from information captured on the Form I-129. In some instances a petitioner will
leave the beneficiary’s job code blank, which we report here as “Occupation unknown”. This does not mean,
however, that the position is not a “specialized occupation”.

13
Table 8B. H-1B Petitions Approved by Major Occupation Group of Beneficiary and Type
of Petition (Percent): FYs 2013 and 2014
All
Beneficiaries
Initial
Employment
Continuing
Employment Occupational Category FY2013
Number
FY2014
Number
FY2013
Number
FY2014
Number
FY2013
Number
FY2014
Number
Occupation known 100 100 100 100 100 100
Computer-related occupations 59.8 64.5 62.3 65.1 57.9 63.9
Occupations in Architecture, Engineering,
and Surveying 9.6 9.2 9.1 8.6 10.0 9.6
Occupations in Administrative Specializations 6.5 6.0 6.6 5.9 7.2 6.0
Occupations in Education 7.1 5.9 7.0 6.8 76.5 5.4
Occupations in Medicine and Health 6.0 4.9 4.4 4.0 7.3 5.4
Occupations in Mathematics and
Physical Sciences 1.8 1.8 1.9 1.8 1.8 1.7
Managers and Officials N.E.C.* 2.0 1.7 1.6 1.4 2.3 2.0
Occupations in Life Sciences 1.8 1.5 2.0 1.7 1.7 1.4
Occupations in Social Sciences 1.4 1.2 1.4 1.3 1.3 1.2
Miscellaneous Professional,
Technical, and Managerial 1.4 1.2 1.3 1.0 1.4 1.3
Occupations in Art 0.9 0.8 0.9 0.8 0.9 0.8
Occupations in Law and Jurisprudence 0.3 0.3 0.4 0.4 0.3 0.3
Occupations in Writing 0.3 0.2 0.3 0.2 0.2 0.2
Miscellaneous 0.2 0.1 0.2 0.1 0.2 0.1
Occupations in Entertainment and Recreation 0.1 0.1 0.1 0.1 0.1 0.0
Occupations in Museum, Library, & Archival Sciences 0.1 0.1 0.1 0.1 0.1 0.0
Occupations in Religion and Theology 0.0 0.0 0.0 0.0 0.0 0.0
Sales Promotion Occupations 0.0 0.0 0.1 0.0 0.0 0.0
Occupation unknown ---0.7--- ---0.6--- ------0.6 ------0.6 ---0.7--- ---0.6---
Notes: Occupations ranked based on FY 2014 data.
Sum of the percent may not add to 100 due to rounding.
Percentages shown in the table are based on the total number of petitions approved with known
occupations.
*N.E.C. indicates not elsewhere classified.
14
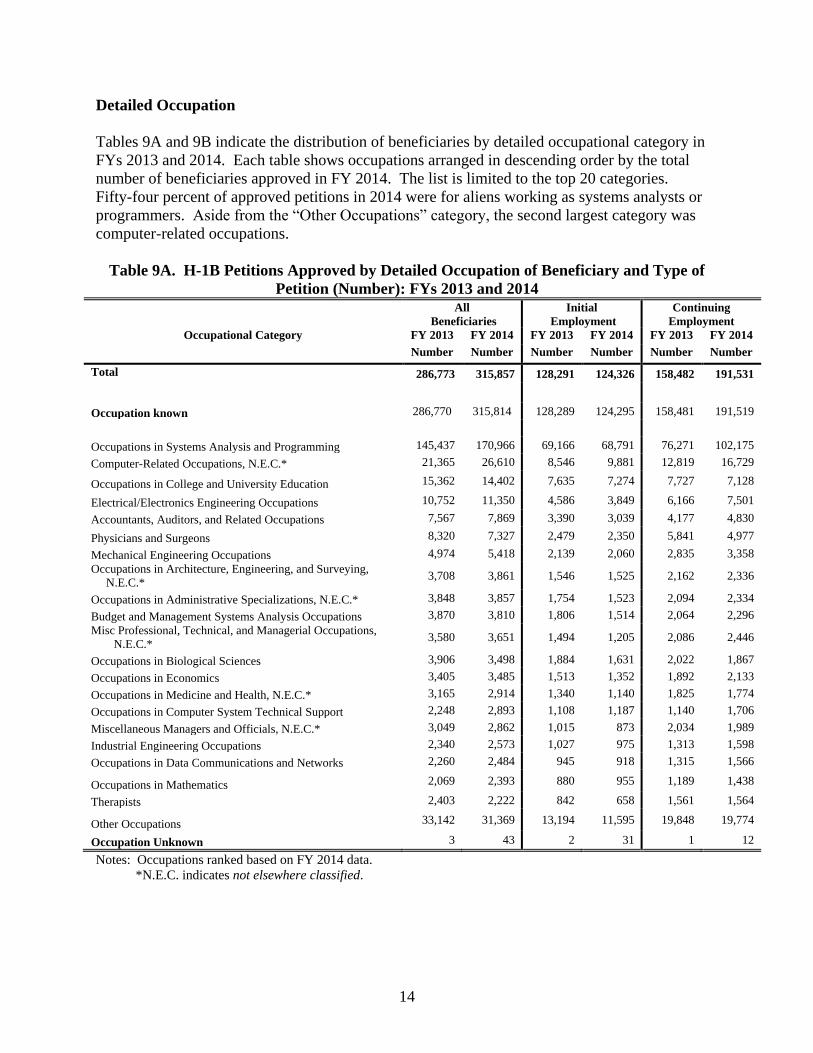
Detailed Occupation
Tables 9A and 9B indicate the distribution of beneficiaries by detailed occupational category in
FYs 2013 and 2014. Each table shows occupations arranged in descending order by the total
number of beneficiaries approved in FY 2014. The list is limited to the top 20 categories.
Fifty-four percent of approved petitions in 2014 were for aliens working as systems analysts or
programmers. Aside from the “Other Occupations” category, the second largest category was
computer-related occupations.
Table 9A. H-1B Petitions Approved by Detailed Occupation of Beneficiary and Type of
Petition (Number): FYs 2013 and 2014
All
Beneficiaries
Initial
Employment
Continuing
Employment
Occupational Category FY 2013 FY 2014 FY 2013 FY 2014 FY 2013 FY 2014
Number Number Number Number Number Number
Total 286,773 315,857 128,291 124,326 158,482 191,531
Occupation known 286,770 315,814 128,289 124,295 158,481 191,519
Occupations in Systems Analysis and Programming 145,437 170,966 69,166 68,791 76,271 102,175
Computer-Related Occupations, N.E.C.* 21,365 26,610 8,546 9,881 12,819 16,729
Occupations in College and University Education 15,362 14,402 7,635 7,274 7,727 7,128
Electrical/Electronics Engineering Occupations 10,752 11,350 4,586 3,849 6,166 7,501
Accountants, Auditors, and Related Occupations 7,567 7,869 3,390 3,039 4,177 4,830
Physicians and Surgeons 8,320 7,327 2,479 2,350 5,841 4,977
Mechanical Engineering Occupations 4,974 5,418 2,139 2,060 2,835 3,358
Occupations in Architecture, Engineering, and Surveying,
N.E.C.* 3,708 3,861 1,546 1,525 2,162 2,336
Occupations in Administrative Specializations, N.E.C.* 3,848 3,857 1,754 1,523 2,094 2,334
Budget and Management Systems Analysis Occupations 3,870 3,810 1,806 1,514 2,064 2,296
Misc Professional, Technical, and Managerial Occupations,
N.E.C.* 3,580 3,651 1,494 1,205 2,086 2,446
Occupations in Biological Sciences 3,906 3,498 1,884 1,631 2,022 1,867
Occupations in Economics 3,405 3,485 1,513 1,352 1,892 2,133
Occupations in Medicine and Health, N.E.C.* 3,165 2,914 1,340 1,140 1,825 1,774
Occupations in Computer System Technical Support 2,248 2,893 1,108 1,187 1,140 1,706
Miscellaneous Managers and Officials, N.E.C.* 3,049 2,862 1,015 873 2,034 1,989
Industrial Engineering Occupations 2,340 2,573 1,027 975 1,313 1,598
Occupations in Data Communications and Networks 2,260 2,484 945 918 1,315 1,566
Occupations in Mathematics 2,069 2,393 880 955 1,189 1,438
Therapists 2,403 2,222 842 658 1,561 1,564
Other Occupations 33,142 31,369 13,194 11,595 19,848 19,774
Occupation Unknown 3 43 2 31 1 12
Notes: Occupations ranked based on FY 2014 data.
*N.E.C. indicates not elsewhere classified.

15
Table 9B. H-1B Petitions Approved by Detailed Occupation of Beneficiary
and Type of Petition (Percent): FYs 2013 and 2014
All
Beneficiaries
Initial
Employment
Continuing
Employment
Occupational Category FY 2013 FY 2014 FY 2013 FY 2014 FY 2013 FY 2014
Percent Percent Percent Percent Percent Percent
Total ------ ------ ------ ------ ------ ------
Occupation known 100 100 100 100 100 100
Occupations in Systems Analysis and
Programming 50.7 54.1 53.9 55.3 48.1 53.7
Computer-Related Occupations, N.E.C.* 7.5 8.4 6.7 7.9 8.1 8.7
Occupations in College and University Education 5.4 4.6 6.0 5.9 4.9 3.7
Electrical/Electronics Engineering Occupations 3.7 3.6 3.6 3.1 3.9 3.9
Accountants, Auditors, and Related Occupations 2.6 2.5 2.6 2.4 2.6 2.5
Physicians and Surgeons 2.9 2.3 1.9 1.9 3.7 2.6
Mechanical Engineering Occupations 1.7 1.7 1.7 1.7 1.8 1.8
Occupations in Architecture, Engineering, and
Surveying, N.E.C.* 1.3 1.2
Occupations in Administrative Specializations,
N.E.C.* 1.3 1.2 1.4 1.2 1.3 1.2
Budget and Management Systems Analysis
Occupations 1.3 1.2 1.4 1.2 1.3 1.2
Misc Professional, Technical, and Managerial
Occupations, N.E.C.* 1.2 1.2 1.2 1.0 1.3 1.3
Occupations in Biological Sciences 1.4 1.1 1.5 1.3 1.3 1.0
Occupations in Economics 1.2 1.1 1.2 1.1 1.2 1.1
Occupations in Medicine and Health, N.E.C.* 1.1 0.9 1.0 0.9 1.2 0.9
Occupations in Computer System Technical
Support 0.8 0.9 0.9 1.0 0.7 0.9
Miscellaneous Managers and Officials, N.E.C.* 1.1 0.9 0.8 0.7 1.3 1.0
Industrial Engineering Occupations 0.8 0.8 0.8 0.8 0.8 0.8
Occupations in Data Communications and
Networks 0.8 0.8 0.7 0.7 0.8 0.8
Occupations in Mathematics 0.7 0.8 0.7 0.9 0.8 0.8
Therapists 0.8 0.7 0.7 0.5 1.0 0.8
Other Occupations 11.6 9.9 10.3 9.3 12.6 10.3
Occupation Unknown ---0.0--- -0.0----- -0.0----- -0.0----- -----0.0- ---0.0---
Notes: Occupations ranked based on FY 2014 data.
Sum of the percent may not add to 100 due to rounding.
Percentages shown in the table are based on the total number of petitions approved with known occupation
* N.E.C. indicates not elsewhere classified.
Section 3.6 – Distribution of petitions by annual compensation15
15 Annual compensation refers to what the employer agreed to pay the beneficiary at the time the application was filed.
The amount excludes non-cash compensation and benefits such as health insurance and transportation. Further,
compensation is based on full-time employment for 12 months, even if the beneficiary worked fewer than 12 months.
16
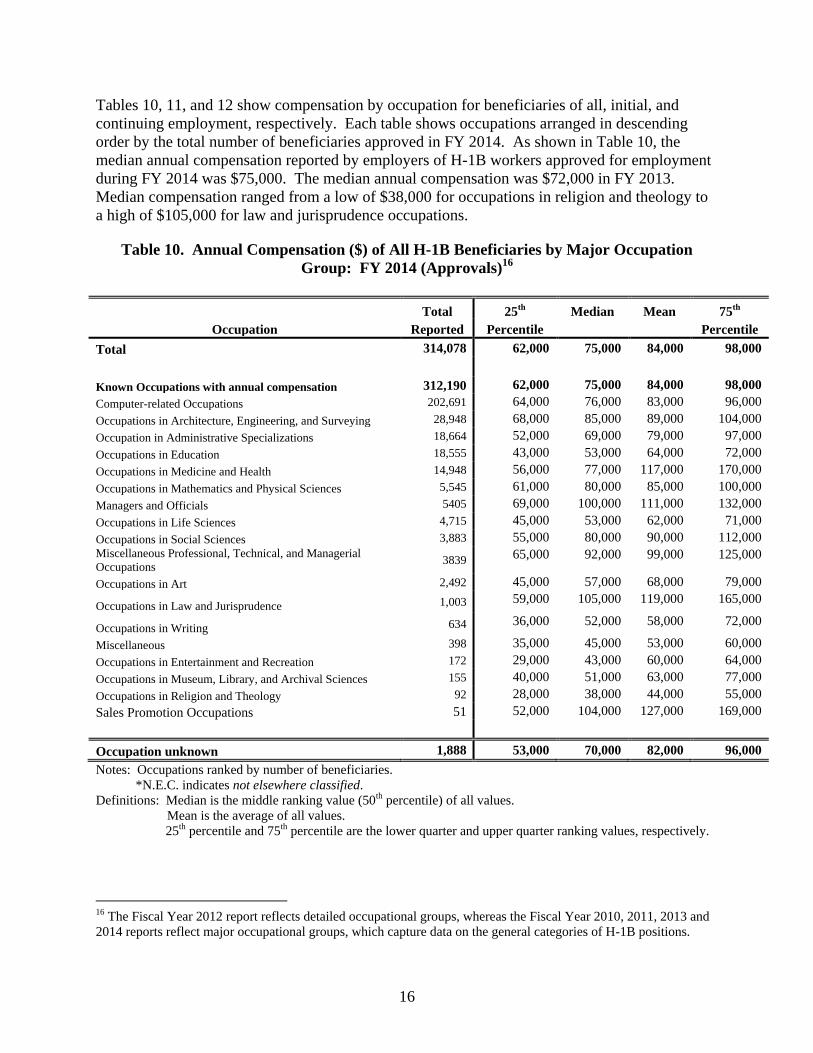
Tables 10, 11, and 12 show compensation by occupation for beneficiaries of all, initial, and
continuing employment, respectively. Each table shows occupations arranged in descending
order by the total number of beneficiaries approved in FY 2014. As shown in Table 10, the
median annual compensation reported by employers of H-1B workers approved for employment
during FY 2014 was $75,000. The median annual compensation was $72,000 in FY 2013.
Median compensation ranged from a low of $38,000 for occupations in religion and theology to
a high of $105,000 for law and jurisprudence occupations.
Table 10. Annual Compensation ($) of All H-1B Beneficiaries by Major Occupation
Group: FY 2014 (Approvals)16
Total 25th
Median Mean 75th
Occupation Reported Percentile Percentile
Total 314,078 62,000 75,000 84,000 98,000
Known Occupations with annual compensation 312,190 62,000 75,000 84,000 98,000
Computer-related Occupations 202,691 64,000 76,000 83,000 96,000
Occupations in Architecture, Engineering, and Surveying 28,948 68,000 85,000 89,000 104,000
Occupation in Administrative Specializations 18,664 52,000 69,000 79,000 97,000
Occupations in Education 18,555 43,000 53,000 64,000 72,000
Occupations in Medicine and Health 14,948 56,000 77,000 117,000 170,000
Occupations in Mathematics and Physical Sciences 5,545 61,000 80,000 85,000 100,000
Managers and Officials 5405 69,000 100,000 111,000 132,000
Occupations in Life Sciences 4,715 45,000 53,000 62,000 71,000
Occupations in Social Sciences 3,883 55,000 80,000 90,000 112,000
Miscellaneous Professional, Technical, and Managerial
Occupations 3839
65,000 92,000 99,000 125,000
Occupations in Art 2,492 45,000 57,000 68,000 79,000
Occupations in Law and Jurisprudence 1,003 59,000 105,000 119,000 165,000
Occupations in Writing 634 36,000 52,000 58,000 72,000
Miscellaneous 398 35,000 45,000 53,000 60,000
Occupations in Entertainment and Recreation 172 29,000 43,000 60,000 64,000
Occupations in Museum, Library, and Archival Sciences 155 40,000 51,000 63,000 77,000
Occupations in Religion and Theology 92 28,000 38,000 44,000 55,000
Sales Promotion Occupations 51 52,000 104,000 127,000 169,000
Occupation unknown 1,888 53,000 70,000 82,000 96,000
Notes: Occupations ranked by number of beneficiaries.
*N.E.C. indicates not elsewhere classified.
Definitions: Median is the middle ranking value (50th percentile) of all values.
Mean is the average of all values.
25th percentile and 75th percentile are the lower quarter and upper quarter ranking values, respectively.
16 The Fiscal Year 2012 report reflects detailed occupational groups, whereas the Fiscal Year 2010, 2011, 2013 and
2014 reports reflect major occupational groups, which capture data on the general categories of H-1B positions.

17
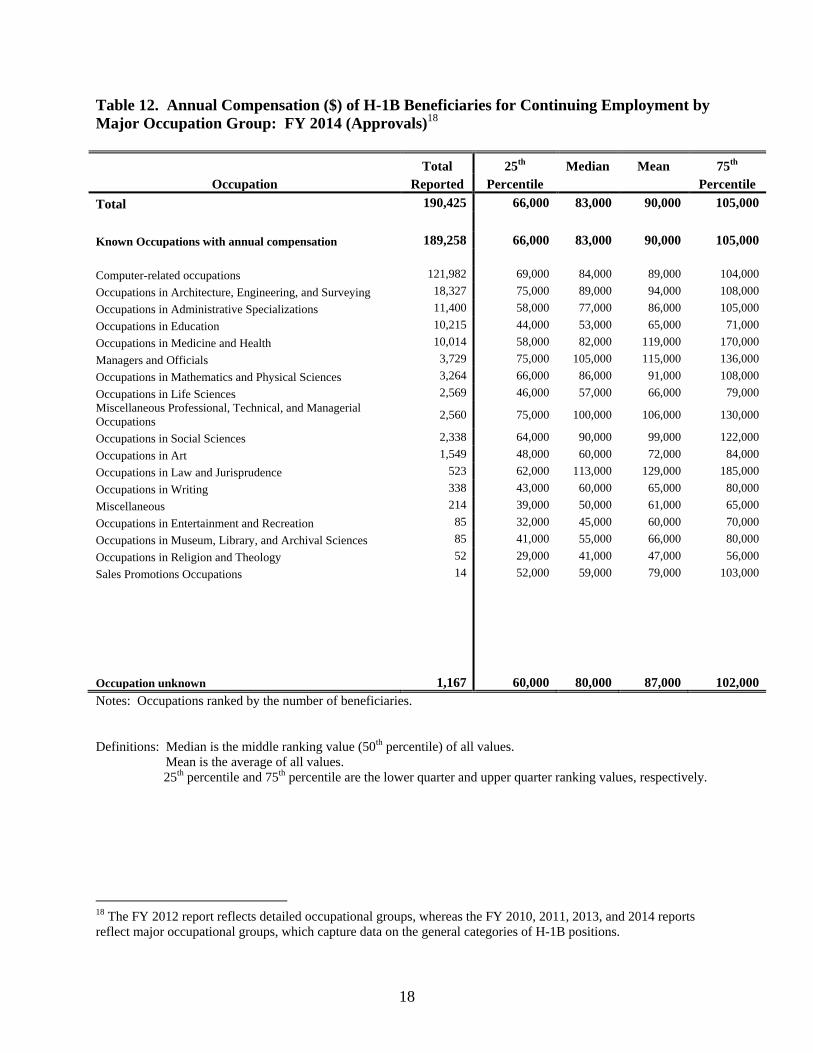
As revealed in Tables 11 and 12, beneficiaries for continuing employment reported higher annual
compensation than did beneficiaries for initial employment. Median annual compensation was
$83,000 for the former and $66,000 for the latter. In FY 2014 workers approved for continuing
employment and initial employment reported mean annual compensation of $90,000 and
$75,000 respectively.
Table 11. Annual Compensation ($) of H-1B Beneficiaries for Initial Employment
by Major Occupation Group: FY 2014 (Approvals)17
Total 25th
Median Mean 75th
Occupation Reported Percentile Percentile
Total 123,653 60,000 66,000 75,000 81,000
Known Occupations with annual compensation 122,932 60,000 66,000 75,000 81,000
Computer-related occupations 80,709 60,000 67,000 74,000 80,000
Occupations in Architecture, Engineering, and Surveying 10,621 61,000 75,000 80,000 95,000
Occupations in Education 8,340 42,000 52,000 64,000 72,000
Occupations in Administrative Specializations 7,264 46,000 57,000 67,000 76,000
Occupations in Medicine and Health 4,934 51,000 66,000 112,000 165,000
Occupations in Mathematics and Physical Sciences 2,281 55,000 70,000 75,000 90,000
Occupations in Life Sciences 2,146 43,000 50,000 57,000 64,000
Managers and Officials 1,676 60,000 90,000 101,000 120,000
Occupations in Social Sciences 1,545 46,000 65,000 76,000 96,000 Miscellaneous Professional, Technical, and Managerial
Occupations 1,279 53,000
75,000 85,000 110,000
Occupations in Art 943 40,000 52,000 60,000 68,000
Occupations in Law and Jurisprudence 480 50,000 90,000 108,000 160,000
Occupations in Writing 296 31,000 44,000 50,000 64,000
Miscellaneous 184 30,000 40,000 45,000 52,000
Occupations in Entertainment and Recreation 87 26,000 41,000 59,000 60,000
Occupations in Museum, Library, and Archival Sciences 70 39,000 48,000 60,000 67,000
Occupations in Religion and Theology 40 27,000 36,000 39,000 48,000
Sales Promotion Occupations 37 100,000 104,000 144,000 200,000
Occupation unknown 721 48,000 62,000 72,000 82,000
Notes: Occupations ranked by the number of beneficiaries.
Definitions: Median is the middle ranking value (50th percentile) of all values.
Mean is the average of all values.
25th percentile and 75th percentile are the lower quarter and upper quarter ranking values, respectively.
17 The FY 2012 report reflects detailed occupational groups, whereas the FY 2010, 2011, 2013, and 2014 reports
reflect major occupational groups, which capture data on the general categories of H-1B positions.
18
Table 12. Annual Compensation ($) of H-1B Beneficiaries for Continuing Employment by
Major Occupation Group: FY 2014 (Approvals)18
Total 25th
Median Mean 75th
Occupation Reported Percentile Percentile
Total 190,425 66,000 83,000 90,000 105,000
Known Occupations with annual compensation 189,258 66,000 83,000 90,000 105,000
Computer-related occupations 121,982 69,000 84,000 89,000 104,000
Occupations in Architecture, Engineering, and Surveying 18,327 75,000 89,000 94,000 108,000
Occupations in Administrative Specializations 11,400 58,000 77,000 86,000 105,000
Occupations in Education 10,215 44,000 53,000 65,000 71,000
Occupations in Medicine and Health 10,014 58,000 82,000 119,000 170,000
Managers and Officials 3,729 75,000 105,000 115,000 136,000
Occupations in Mathematics and Physical Sciences 3,264 66,000 86,000 91,000 108,000
Occupations in Life Sciences 2,569 46,000 57,000 66,000 79,000
Miscellaneous Professional, Technical, and Managerial
Occupations 2,560 75,000 100,000 106,000 130,000
Occupations in Social Sciences 2,338 64,000 90,000 99,000 122,000
Occupations in Art 1,549 48,000 60,000 72,000 84,000
Occupations in Law and Jurisprudence 523 62,000 113,000 129,000 185,000
Occupations in Writing 338 43,000 60,000 65,000 80,000
Miscellaneous 214 39,000 50,000 61,000 65,000
Occupations in Entertainment and Recreation 85 32,000 45,000 60,000 70,000
Occupations in Museum, Library, and Archival Sciences 85 41,000 55,000 66,000 80,000
Occupations in Religion and Theology 52 29,000 41,000 47,000 56,000
Sales Promotions Occupations 14 52,000 59,000 79,000 103,000
Occupation unknown
1,167
60,000
80,000
87,000
102,000
Notes: Occupations ranked by the number of beneficiaries.
Definitions: Median is the middle ranking value (50th percentile) of all values.
Mean is the average of all values.
25th percentile and 75th percentile are the lower quarter and upper quarter ranking values, respectively.
18 The FY 2012 report reflects detailed occupational groups, whereas the FY 2010, 2011, 2013, and 2014 reports
reflect major occupational groups, which capture data on the general categories of H-1B positions.

19
Section 3.7 – Distribution of petitions by industry
Tables 13A and 13B show the top 20 industries that employed H-1B workers in FY 2014.
Industry data are collected using the North American Industry Classification System (NAICS).
The top 20 industries listed in Tables 13A and 13B represent nearly 80 percent of H-1B workers
approved for all known industry categories as determined by the NAICS code entered on Form I-
129.19
The number of workers approved for all known industries increased 21 percent from
229,434 in FY 2013 to 277,300 in FY 2014.
19 The remaining known industries for which H-1B workers were approved are captured in the “Other Industries”
category in Tables 13A and 13B. For FY 2014, H-1B workers were approved for just over 1,400 unique industry
categories as determined by the NAICS code entered on the Form I-129. Unlike country of birth, age, education, and
occupation, USCIS does not verify the NAICS code, since the sponsor does not provide supporting documentation.

20
Table 13A. H-1B Petitions Approved by Detailed Industry and Type of Petition
(Number) FYs 2013 and 2014
Notes: Industries ranked by total beneficiaries in FY 2014.
20 See footnote 17.
All
Beneficiaries
Initial
Employment
Continuing
Employment
FY 2013 FY 2014 FY 2013 FY 2014 FY 2013 FY 2014
Industry Number Number Number Number Number Number
Total 286,773 315,857 128,291 124,326 158,482 191,531
Industry known 229,434 277,300 104,222 113,288 125,212 164,012
Custom Computer Programming
Services 82,642 98,681 41,715 45,127 40,927 53,554
Computer System Design Services 24,149 32,198 11,289 11,488 12,860 20,710
Colleges, Universities, and
Professional Schools 20,016 18,684 9,564 9,086 10,452 9,598
Computer Systems Design and
Related Services 8,091 8,318 4,445 3,999 3,646 4,319
Software Publishers 6,280 6,921 2,108 2,506 4,172 4,415
Other Computer Related Services 5,410 5,880 2,594 2,379 2,816 3,501
Engineering Services 3,300 5,826 1,574 2,686 1,726 3,140
General Medical and Surgical
Hospitals 6,077 5,566 2,004 2,021 4,073 3,545
Management, Scientific, and
Technical Consulting Services 5,073 5,440 3,790 2,986 1,283 2,454
Administrative Management and
General Management Consulting
Services
2,739 3,112 1,345 1,159 1,394 1,953
Electronic Computer Manufacturing 2,051 2,960 672 954 1,379 2,006
Elementary and Secondary Schools 2,735 2,864 617 770 2,118 2,094
Investment Banking and Securities
Dealing 433 2,769 163 780 270 1,989
Offices of Physicians (except Mental
Health Specialists) 2,685 2,742 856 810 1,829 1,932
Semiconductor and Related Device
Manufacturing 2,160 2,609 852 824 1,308 1,785
Semiconductor and Other Electronic
Component Manufacturing 2,558 2,480 1,057 836 1,501 1,644
Research and Development in the
Physical, Engineering, and Life
Sciences
2,635 2,361 1,113 1,036 1,522 1,325
Offices of Certified Public
Accountants 1,896 2,274 782 791 1,114 1,483
Radio and Television Broadcasting
and Wireless Communications
Equipment Manufacturing
2,125 2,202 920 711 1,205 1,491
Offices of Other Holding Companies 1,116 1,312 254 260 862 1,052
Other Industries20 45,263 62,101 16,508 22,079 28,755 40,022
Industry unknown 57,339 38,557 24,069 11,038 33,270 27,519

21
NAICS stands for North American Industry Classification System.
Table 13B. H-1B Petitions Approved by Detailed Industry and Type of Petition
(Percent) FYs 2013 and 2014
All
Beneficiaries
Initial
Employment
Continuing
Employment
FY2013 FY2014 FY2013 FY2014 FY2013 FY2014
Industry Percent Percent Percent Percent Percent Percent
Total 100 100 100 100 100 100
Industry known 80.0 87.8 81.2 91.1 79.0 85.6
Custom Computer Programming
Services
28.8 31.2 32.5 36.3 25.8
28.0
Computer System Design Services 8.4 10.2 8.8 9.2 8.1 10.8
Colleges, Universities, and
Professional Schools 7.0 5.9 7.5 7.3 6.6 5.0
Computer Systems Design and Related Services 2.8 2.6 3.5 3.2 2.3 2.3
Software Publishers 2.2 2.2 1.6 2.0 2.6 2.3
Other Computer Related Services 1.9 1.9 2.0 1.9 1.8 1.8
Engineering Services 1.2 1.8 1.2 2.2 1.1 1.6
General Medical and Surgical
Hospitals 2.1 1.8 1.6 1.6 2.6 1.9
Management, Scientific, and Technical
Consulting Services 1.8 1.7 3.0 2.4 0.8 1.3
Administrative Management and General
Management Consulting Services 1.0 1.0 1.0 0.9 0.9 1.0
Electronic Computer Manufacturing 0.7 0.9 0.5 0.8 0.9 1.0
Elementary and Secondary Schools 1.0 0.9 0.5 0.6 1.3 1.1
Investment Banking and Securities Dealing 0.2 0.9 0.1 0.6 0.2 1.0
Offices of Physicians (except Mental Health
Specialists) 0.9 0.9 0.7 0.7 1.2 1.0
Semiconductor and Related Device
Manufacturing 0.8 0.8 0.7 0.7 0.8 0.9
Semiconductor and other Electronic Component
Manufacturing 0.9 0.8 0.8 0.7 0.9 0.9
Research and Development in the Physical,
Engineering, and Life Sciences 0.9 0.7 0.9 0.8 1.0 0.7
Offices of Certified Public Accountants 0.7 0.7 0.6 0.6 0.7 0.8
Radio and Television Broadcasting and
Wireless Communications Equipment
Manufacturing
0.7 0.7 0.7 0.6 0.8 0.8
Offices of Other Holding Companies 0.4 0.4 0.2 0.2 0.5 0.5
Other Industries 15.8 19.7 12.9 17.8 18.1 20.9
Industry unknown 20.0 12.2 18.8 8.9 21.0 14.4
Notes: Industries ranked by total beneficiaries in FY 2014.
Sum of the percent may not add to 100 due to rounding.
Percentages shown are based on the total number of petitions approved with industry known.
NAICS stands for North American Industry Classification System

22
IV. Appendices
A. H-1B petition processing
Petitions for obtaining H-1B nonimmigrant classification for alien workers are submitted by
prospective employers on USCIS Form I-129, Petition for a Nonimmigrant Worker, the H
Classification Supplement to Form I-129, and the H-1B Data Collection and Filing Fee
Exemption Supplement. The petitions are generally mailed to one of two USCIS Service
Centers (St. Albans, Vermont, or Laguna Niguel, California) for processing, depending on the
location of the beneficiary’s worksite.
Upon receipt of a properly filed petition,21
each petition is stamped with its date of arrival at the
service center. A clerk creates a paper file that contains the original petition as well as all
supporting documentation. This file becomes the official file of record for all activities
connected with the petition.
Biographical data (such as name, date of birth, and country of birth), as well as data on
occupational and industry categories, are taken from the petition and entered by data entry clerks
into the case tracking system Computer-Linked Application Information Management System
(CLAIMS3). The computer system generates a unique receipt number for the file. After being
sorted into potential cap subject and cap exempt cases, the file is assigned to an adjudicator.
The adjudicator evaluates whether there is adequate information in the file to approve or deny
the petition, or whether a need for further information warrants a request for evidence or
initiation of an administrative investigation. If sufficient evidence is available, the adjudicator
makes a decision and enters the corresponding information into the tracking system. In the case
of insufficient evidence, the adjudicator requests additional information from the sponsoring
employer. The employer must respond to the request within a set period of time or the petition
will be denied.
After petitions are adjudicated, the petition and supporting documentation are forwarded to either
the USCIS records center in Harrisonburg, Virginia, for storage or the Kentucky Consular Center
in Williamsburg, Kentucky, for consular processing.
B. Data Limitations
The data for the tables in this report have been extracted from a USCIS Service Center electronic
data file. As such, errors in data may have occurred as a result of erroneous data submitted by
21
Petitions that are improperly filed (e.g., submitted without the correct supplements, proper signatures, or required
fees) may be rejected by the service center. Rejected petitions are returned to the petitioner with any submitted fees.
See 8 CFR 103.2(a)(7).

23
the petitioner, initial data entry errors at service centers, or improper electronic transfer from the
service centers to USCIS Headquarters. Accordingly, some data elements in the above tables are
“unknown.”
Minimal editing has been done to the data in this file and impossible or highly improbable values
(such as beneficiaries younger than 16, except for fashion models) or beneficiaries (such as those
working without compensation) have been defined as “unknown.” Information in electronic
format is not available regarding the cities or states where H-1B workers are employed.