characteristics of federally licensed firearms retailers ... 1... · characteristics of federally...
TRANSCRIPT
Journal of Urban Health: Bulletin of the New York Academy of Medicinedoi:10.1007/s11524-012-9754-y* 2012 The New York Academy of Medicine
Characteristics of Federally Licensed FirearmsRetailers and Retail Establishments in the UnitedStates: Initial Findings from the Firearms LicenseeSurvey
Garen J. Wintemute
ABSTRACT Firearms have widely supported legitimate purposes but are also frequentlyused in violent crimes. Owners and senior executives of federally licensed firearmsdealers and pawnbrokers are a potentially valuable source of information on retailcommerce in firearms, links between legal and illegal commerce, and policies designedto prevent the firearms they sell from being used in crimes. To our knowledge, there hasbeen no prior effort to gather such information. In 2011, we conducted the FirearmsLicensee Survey on a probability sample of 1,601 licensed dealers and pawnbrokers inthe United States believed to sell 50 or more firearms per year. This article presentsdetails of the design and execution of the survey and describes the characteristics of therespondents and their business establishments. The survey was conducted by mail, usingmethods developed by Dillman and others. Our response rate was 36.9 % (591respondents), similar to that for other establishment surveys using similar methods.Respondents had a median age of 54; 89 % were male, 97.6 % were White, and98.1 % were non-Hispanic. Those who held licenses under their own names had beenlicensed for a median of 18 years. A large majority of 96.3 % agreed that “privateownership of guns is essential for a free society”; just over half (54.9 %) believed that“it is too easy for criminals to get guns in this country.” A match between the job and apersonal interest in the shooting sports was the highest-ranking reason for working as afirearms retailer; the highest-ranking concerns were that “there are too many ‘guncontrol’ regulations” and that “the government might confiscate my guns.” Mostrespondents (64.3 %) were gun dealers, with significant variation by region. Residentialdealers accounted for 25.6 % of all dealers in the Midwest. Median annual sales volumewas 200 firearms for both dealers and pawnbrokers. Dealers appeared more likely thanpawnbrokers to specialize; they were more likely to rank in the highest or lowestquartile on sales of handguns, inexpensive handguns, and tactical rifles. Sales ofinexpensive handguns and sales to women were more common among pawnbrokers.Internet sales were reported by 28.3 % of respondents and sales at gun shows by14.3 %. A median of 1 % of sales were denied after purchasers failed backgroundchecks; firearm trace requests equaled G1 % of annual sales. Trace frequency wasdirectly associated with the percentage of firearm sales involving handguns, inexpensivehandguns, and sales to women. Frequency of denied sales was strongly and directlyassociated with frequency of trace requests (pG0.0001). These results are based on self-report but are consistent with those from studies using objective data.
KEYWORDS Firearms, Crime, Violence, Firearms policy, Federal firearms licensees
Wintemute is with the Susan P. Baker-Stephen P. Teret Chair in Violence Prevention, Department of EmergencyMedicine, School of Medicine, University of California, Davis, Sacramento, CA, USA.
Correspondence: Garen J. Wintemute, MD, MPH, Department of Emergency Medicine, School ofMedicine, University of California, Davis, Sacramento, CA, USA. (E-mail: [email protected])
Submitted to the Journal of Urban Health on May 22, 2012.
INTRODUCTION
Firearms are a dual-use technology. Though they have legitimate employment insport and in maintaining personal and public safety, they are also frequently used inviolent crimes. An estimated 348,975 firearm-related violent crimes, including11,015 homicides, occurred in the United States in 2010.1,2
The more than 50,000 federally licensed firearms dealers and pawnbrokers in theUnited States sell millions of firearms each year and are the principal means bywhich civilians gain access to firearms. These sales are regulated in an effort toprevent the criminal use of firearms, and extensive research has highlighted theimportance of individual retailers in both preventing and facilitating such use.3–15
Because of their sustained and direct involvement, owners of or senior executivesat licensed firearms dealers and pawnbrokers are likely to have uniquely valuableinformation on and insight into the operations of retail commerce in firearms, linksbetween legal and illegal commerce, and policies designed to prevent the firearmsthey sell from being used in crimes. To our knowledge, there has been no prior effortto gather such information. Nor, to our knowledge, has there been an effort toconstruct an aggregate statistical profile of licensed firearms dealers and pawn-brokers in the United States.
In 2011, we conducted the Firearms Licensee Survey to collect data from a largesample of such establishments across the United States that were known to beactively engaged in selling firearms. Our target respondent population was theowners or senior executives of those establishments. The survey addressed therespondents’ demographics; their incentives for and concerns about employment asa licensed retailer; characteristics of the establishments at which they worked, suchas the nature of the clientele and the number and types of firearms sold; thefrequency of illegal and adverse events such as surrogate (straw) purchases anddenied sales; the prevalence of and motivations for knowing participation in illegalcommerce by licensed retailers; and the respondents’ positions on current orproposed policies regulating firearms commerce.
This article presents details on the design and execution of the Firearms LicenseeSurvey and describes the characteristics of the respondents themselves and theirbusiness establishments.
METHODS
TerminologyIn reporting on the Firearms Licensee Survey, we use “retailer” only to refer to anindividual person.
Identifying the Study PopulationA roster of all federal firearms licensees, including manufacturers, importers, andcollectors, as well as gun dealers and pawnbrokers, is available online from theBureau of Alcohol, Tobacco, Firearms and Explosives (ATF) and is updatedmonthly.16 Entries contain the name of the licensee (who may be an individualperson or a corporation), the license type and number, the business name andtelephone number, and both premises and mailing addresses. A separate license isrequired for each fixed location at which firearms transactions are conducted; somelarge chain-store corporations hold dozens of licenses. In such cases, the mailingaddress for all locations is typically that of the corporate headquarters, but the
WINTEMUTE
premises addresses are specific to individual retail establishments. We used the listfor February 2011 to create a file with records for all 55,020 licensees who wereclassified as retail establishments: gun dealers and gunsmiths, who hold Type 01licenses, and pawnbrokers, who hold Type 02 licenses.
Retail licensees may sell firearms only occasionally or not at all, and we wished torestrict the study population to those who were known to be more than occasionalsellers of firearms. Licensees do not report their sales in most states; the data for adirect determination do not exist. However, the Federal Bureau of Investigation(FBI) collects data on background checks performed by its National Instant CriminalBackground Check System (NICS checks) on firearm purchasers at the request oflicensees. NICS checks are required for the great majority of firearm sales made bylicensed gun dealers and pawnbrokers. Records for individual requests are retainedfor 90 days after the requests are made.
The number of NICS checks requested by a licensee does not equal the number offirearms that licensee sells, for several reasons. (1) In so-called Brady alternativestates, purchases by holders of permits to carry concealed firearms and similarpermits are exempt from the requirement.17 There were 18 such states when thestudy was conducted. (2) Only one NICS check is required per transaction,regardless of the number of firearms involved. (3) A small percentage of sales aredenied (the nationwide average is 1.8 %18), and the sale does not proceed. (4)Background checks are also required when firearms are redeemed from pawn-brokers. Nonetheless, NICS checks may be considered a rough proxy measure forfirearm transactions for both dealers and pawnbrokers.
In response to a Freedom of Information Act (FOIA) request, the FBIprovided a tabulation of NICS check requests, specific to individual licensees,for the 88-day period November 13, 2010, through February 9, 2011. Thesedates were not chosen deliberately; the data were compiled as soon as possibleafter the FOIA request was approved. The tabulation was provided as a 723-page PDF document. We manually reviewed the document to identify alllicensees having Type 01 or Type 02 licenses and ten or more NICS checks.This number was chosen to represent, very roughly, 50 firearm sales and/orredemptions per year (approximately one per week): approximately 40 trans-actions [10×(365/88)], with an allowance for transactions involving multiplefirearms.
We identified 9,720 licensees having ten checks or more and prepared asampling frame containing their records from the ATF roster. These licenseesaccounted for 17.7 % of all retail licensees on the roster. A random sample oflicensees, stratified by license type, was drawn using PROC SURVEYSAMPLEin SAS software.19 The sample size was 1,601 subjects, chosen to provide 95 %confidence intervals of ±3 % when equal (50 %) proportions of respondentsprovided alternate responses to questions with binary responses, and the responserate was 60 %.20 The final sample included 16.5 % of licensees in the samplingframe.
No licensees from seven states (California, Connecticut, Hawaii, New Jersey, Nevada,Pennsylvania, and Virginia) were identified in the FBI tabulation as having NICS checkrequests. The non-represented states are all full Point of Contact (POC) states, in whichfirearms licensees contact a state agency, not the FBI, for NICS checks on all firearmtransactions.21 These states may include the license number of the requesting licenseewhen submitting the NICS check request to the FBI but are not required to andfrequently do not. Because the data are incomplete, the FBI generally does not include
CHARACTERISTICS OF FEDERALLY LICENSED FIREARMS RETAILERS
POC state transactions in their tabulations of NICS checks by licensee (personalcommunication, Andrew F. Clay, December 9, 2011). Retail licensees from these statesaccounted for 12.6 % of all retail licensees on the ATF roster.
Questionnaire DesignQuestionnaire design followed recommendations made by Dillman and col-leagues.20,22 The questionnaire was designed to promote readability and was limitedto 38 questions on 12 pages, with a final text box for respondents to offer additionalcomments. A nationally recognized expert in survey research, including research ontopics related to firearms, served as a consultant throughout the development of thequestionnaire.
We were concerned that there might be adverse effects on the implementation ofthe study should its existence be disclosed prematurely and did not pre-test thequestionnaire on a sample of licensed retailers. Instead, we conducted in-depth,multi-session cognitive interviews with two independent experts who had extensiveknowledge of the firearms industry and its practices, and three policy developmentexperts reviewed a draft of the questionnaire.
Some firearm licensees are named individuals, and others are corporations. Alongwith questions about their demographic characteristics, subjects were asked whetherthey themselves were the named individual to whom the questionnaire wasaddressed, if such an individual existed. They were asked an open-ended questionabout the nature of their job at the retail establishment where they worked.
Questions about the number and types of firearms sold requested data forcalendar year 2010. Subjects were asked how many firearms and handguns they soldand the percentage of their overall sales that were to law enforcement personnel,women, individuals who purchased multiple firearms within five business days, overthe Internet, or at gun shows. They were asked for the percentage of their handgunsales that were of handguns “priced at more than $250” (inexpensive “Saturdaynight specials” have new retail pricesG$200, and handguns from other manufac-turers are priced above $250) and for the percentage of their rifle sales that were of“tactical rifles or modern sporting rifles, such as ARs, AKs, and SKSs.”
Questions regarding denied sales and firearm trace requests, which are infrequentevents, requested annual averages over the 5 years preceding the survey—as apercentage of all firearms transactions, for denials, and as occurrences per year fortrace requests.
A copy of the questionnaire is available on request.
Survey ImplementationThe survey was implemented followed procedures developed by Dillman andcolleagues20 and used by the author in two prior surveys of individuals.23,24
Modifications recommended by Dillman and colleagues20 for establishment surveyswere incorporated. The survey was conducted by mail beginning June 16, 2011. NICScheck requests are least frequent during the summer,25 and the survey was conductedduring this time of relatively slow licensee business activity to improve the response rate.
The survey design required up to three mailings of the questionnaire, with areminder postcard sent to all subjects between the first and second questionnairemailings. Taking the mailing date of the first questionnaire as day 0, the postcardwas sent on day 7, and subsequent questionnaires were sent to nonrespondents onday 21 and day 42. A cash incentive—three uncirculated $1 bills—was included in
WINTEMUTE
the first mailing. Respondents were also offered the opportunity to request a copy ofpublications arising from the survey.
Each questionnairemailing included a cover letter explaining that the purposes of thesurvey were “to understand better the unique perspective of firearms licensees onimportant social issues and the firearms business itself” and to collect “the firstnationwide information on the day-to-day business experience of firearms licensees.”
Letters were addressed to the licensee when the licensee was a named person or tothe “firearms manager” when the licensee was a corporation and were hand-signedby the author (as were the postcards). The letters included telephone numbers for thestudy team (a dedicated telephone line for queries and comments was established)and the university’s Institutional Review Board. All mailings were sent to premisesaddresses so as to be received by on-site managers rather than by staff at acentralized corporate headquarters. The first two questionnaires and the postcardwere sent by first class mail, using commemorative stamps selected as appropriate tothe project. The third questionnaire was sent by Priority Mail.
Messages left at the project’s telephone number were transcribed daily, and a log waskept. Return calls, when needed, were made by the author. Returned questionnaireswere reviewed by the author within 1–2 days to identify unanticipated problems thatcould be corrected during survey execution. We did not attempt to contact respondentswho refused to participate or indicated that they were prohibited from doing so.
Our monitoring established that the response rate for subjects affiliated withcorporations with that held licenses for multiple business locations (chain stores) waslower than that for others.We sent personalized letters to the chief executive officer or chiefregulatory officer of each of the 25 corporations with more than one licensee in our studysample, requesting that they authorize their store managers to participate. The authormade multiple attempts to contact each corporate officer by telephone to follow up.
We also established procedures to detect and monitor discussion of the survey onthe Internet. Our primary interest was in any attempt to discourage subjects fromparticipating or to encourage collective or strategic responding. We performedsearches daily on an array of relevant keywords and phrases, beginning 1 weekbefore the first questionnaire mailing to establish a baseline level of activity.
Data Management and Statistical AnalysisWe performed data entry when questionnaires were received, using dual-entryprocedures and automated and manual comparisons.
We determined response and refusal rates and assessed questionnaire complete-ness using guidelines developed by the American Association for Public OpinionResearch.26 The response rate was calculated as the percentage of subjects in thesample who returned filled-out questionnaires. Complete questionnaires providedanswers to 980 % of questions, partial questionnaires to 50 %–80 %, and break-offquestionnaires to G50 %.
Respondents were classified by the number of questionnaires they were likely tohave received prior to responding: early, response received by us no more than2 days after the second questionnaire mailing; intermediate, response received morethan 2 days after the second questionnaire mailing and no more than 2 days after thethird; late, response received more than 2 days after the third questionnaire mailing.
All licensees in the sample were categorized by general business structure: Thelicensee was an individual named person; the licensee was a corporation, and onlyone establishment owned by that corporation appeared in the sample (corporate/single site); the licensee was a corporation, and multiple establishments owned by
CHARACTERISTICS OF FEDERALLY LICENSED FIREARMS RETAILERS
that corporation appeared in the sample (corporate/multi-site). Establishmentlocations were categorized by Census region.
Respondents who were known not to be owners, managers, or other seniorexecutives (n=21) or whose status could not be determined (n=27) were excludedfrom analyses of respondents’ personal characteristics and attitudes toward firearmsand the firearms business.
Continuous variables were stratified into quartiles for most analyses, to minimizeeffects due to outliers and clustering of responses at numbers ending in zero. Thestrata were chosen to produce quartiles of approximately equal size for allrespondents considered together. Responses on the percentage of handguns soldthat were priced at more than $250 were recoded for analysis to the percentagepriced at $250 or less. The reported average annual number of trace requests wasconverted to a percentage of firearm sales in 2010. Strata for the two questionsaddressing general attitudes about firearms and crime were collapsed from five tothree.
Most analyses relied on simple descriptive measures, with the significance ofdifferences assessed using the Pearson Chi-squared test, or the Mantel–HaenszelChi-squared test when a test for a linear association was desired. PG0.05 was takenas the threshold for statistical significance. All analyses were performed using SASversion 9.1.3 for Windows.19
The UC Davis institutional review board approved this project.
RESULTS
Response RateOf 1,601 subjects in the sample, 591 returned filled-out questionnaires, for a responserate of 36.9 %. Another 105 subjects (6.6 %) returned blank questionnaires (orcontacted us separately) and declined to participate or stated that they were prohibitedfrom participating. Of these, 66 (62.9 %) also returned the $3 incentive.
Of the filled-out questionnaires, 96.3 % were complete and 3.7 % were partial.There were no break-offs. The completion rates for the individual questionsconsidered in this article were 97.8 % or higher for those pertaining to personalcharacteristics and 94.1 % or higher for those pertaining to business characteristics,with two exceptions—91.7 % for the total number of firearms sold and 90.2 % forthe number of handguns sold.
Determinants and Timing of ResponseResponse rates for gun dealers and pawnbrokers were similar—37.2 % and 36.3 %,respectively, p=0.75. The response rate for subjects who were employed bycorporate/multi-site licensees (19.7 %) was less than half that for subjects employedby corporate/single site licensees (41.1 %) or subjects employed by licensees whowere named individual persons (40.5 %), pG0.0001. Response rates did not differsignificantly with subjects’ location (Northeast, 45.5 %; South, 35.0 %; Midwest,41.3 %; West, 35.0 %; p=0.11).
Most respondents returned questionnaires early (383, 64.8 %); there were 136(23.0 %) intermediate and 72 (12.2 %) late respondents. Respondents affiliatedwith corporate/multi-site licensees returned their questionnaires later than others did(8.6 % of early respondents, 10.3 % of intermediate respondents, 16.7 % of laterespondents, p=0.01, Appendix Table 3), and there was a similar but non-significant
WINTEMUTE
trend for pawnbrokers (32.6 % of early respondents, 40.4 % of intermediaterespondents, 43.1 % of late respondents, p=0.10) With these exceptions, early,intermediate, and late respondents were similar.
Personal CharacteristicsRespondents had a median age of 54 years [interquartile range (IQR), 43–61 years];89 % were male; 97.6 % were White, and 98.1 % were non-Hispanic. Except forage, there was little variation between gun dealers and pawnbrokers (Table 1). The230 respondents who held federal firearms licenses themselves as named individualswere older than others (median age 57 years, IQR 49–64 years; for others, median49, IQR 40–59 years; pG0.0001) (Appendix Table 3). Only 21 such respondents(9.1 %) were less than 40 years of age. The median duration of licensure for these230 licensees was 18 years (IQR, 6–26 years). Only 19.1 % of this group had beenlicensed for less than 5 years; 18.3 % had been licensed for 30 years or more.
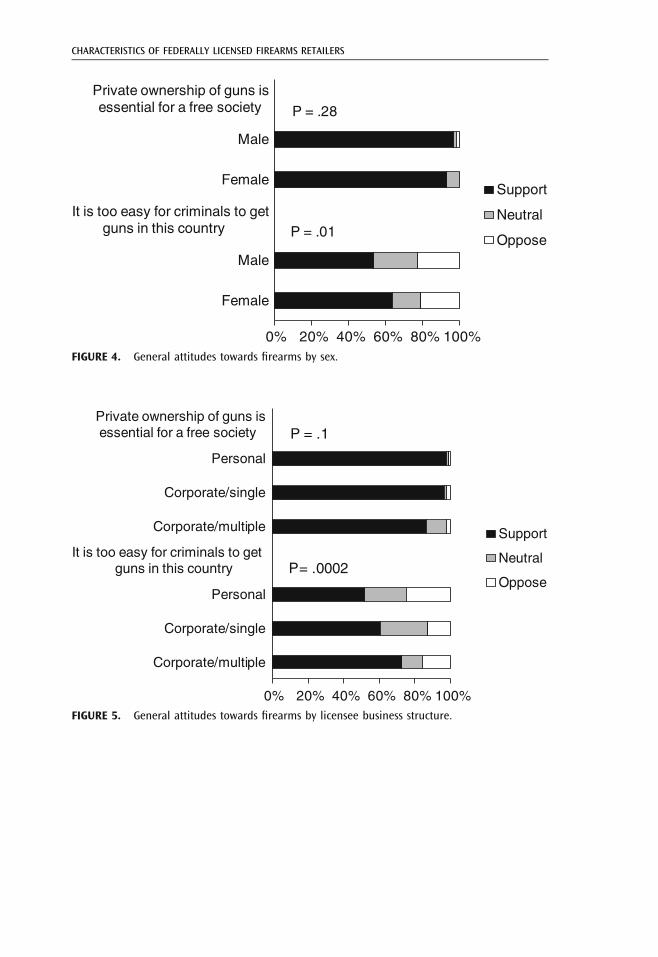
Attitudes Toward Firearms and the Firearms BusinessA large majority (518 respondents, 96.3 %) agreed that “private ownership of guns isessential for a free society,” and there was little variation among subgroups ofrespondents (Table 1, Appendix Figures 3, 4, and 5). Just over half (292 respondents,54.9 %) believed that “it is too easy for criminals to get guns in this country.”Agreement varied little with age and sex, was somewhat less common among gundealers than pawnbrokers, and was more common among respondents fromcorporate/multi-site licensees than others (Table 1, Appendix Figures 3, 4, and 5).
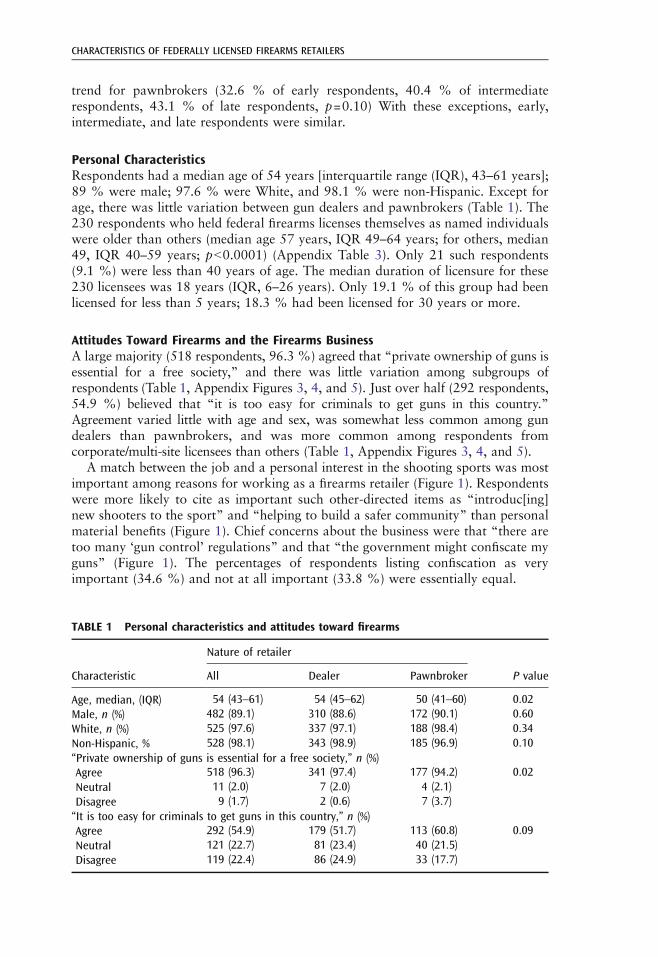
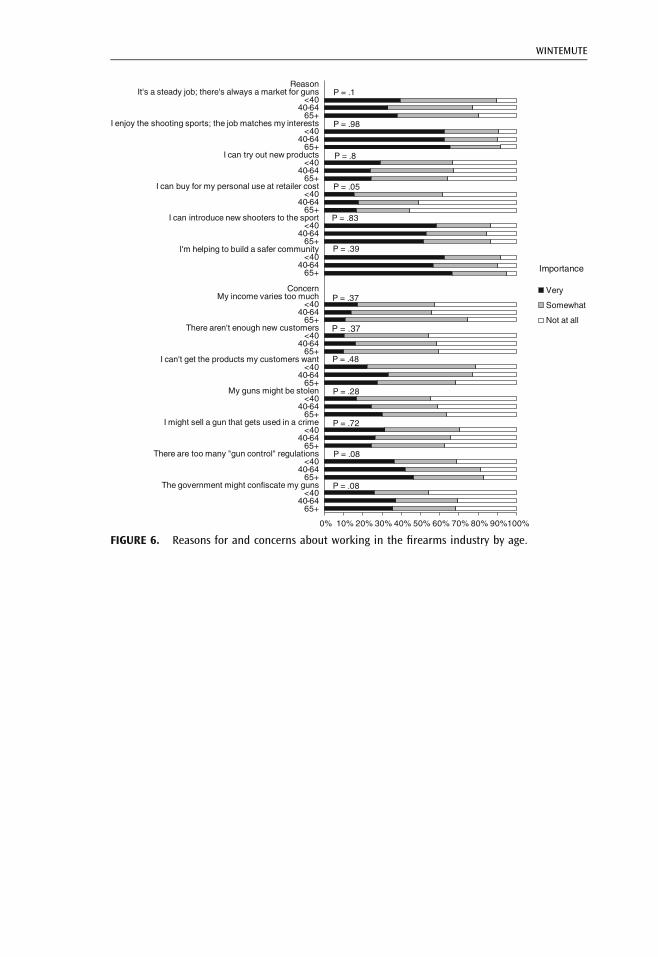
A match between the job and a personal interest in the shooting sports was mostimportant among reasons for working as a firearms retailer (Figure 1). Respondentswere more likely to cite as important such other-directed items as “introduc[ing]new shooters to the sport” and “helping to build a safer community” than personalmaterial benefits (Figure 1). Chief concerns about the business were that “there aretoo many ‘gun control’ regulations” and that “the government might confiscate myguns” (Figure 1). The percentages of respondents listing confiscation as veryimportant (34.6 %) and not at all important (33.8 %) were essentially equal.
TABLE 1 Personal characteristics and attitudes toward firearms
Characteristic
Nature of retailer
P valueAll Dealer Pawnbroker
Age, median, (IQR) 54 (43–61) 54 (45–62) 50 (41–60) 0.02Male, n (%) 482 (89.1) 310 (88.6) 172 (90.1) 0.60White, n (%) 525 (97.6) 337 (97.1) 188 (98.4) 0.34Non-Hispanic, % 528 (98.1) 343 (98.9) 185 (96.9) 0.10“Private ownership of guns is essential for a free society,” n (%)Agree 518 (96.3) 341 (97.4) 177 (94.2) 0.02Neutral 11 (2.0) 7 (2.0) 4 (2.1)Disagree 9 (1.7) 2 (0.6) 7 (3.7)“It is too easy for criminals to get guns in this country,” n (%)Agree 292 (54.9) 179 (51.7) 113 (60.8) 0.09Neutral 121 (22.7) 81 (23.4) 40 (21.5)Disagree 119 (22.4) 86 (24.9) 33 (17.7)
CHARACTERISTICS OF FEDERALLY LICENSED FIREARMS RETAILERS
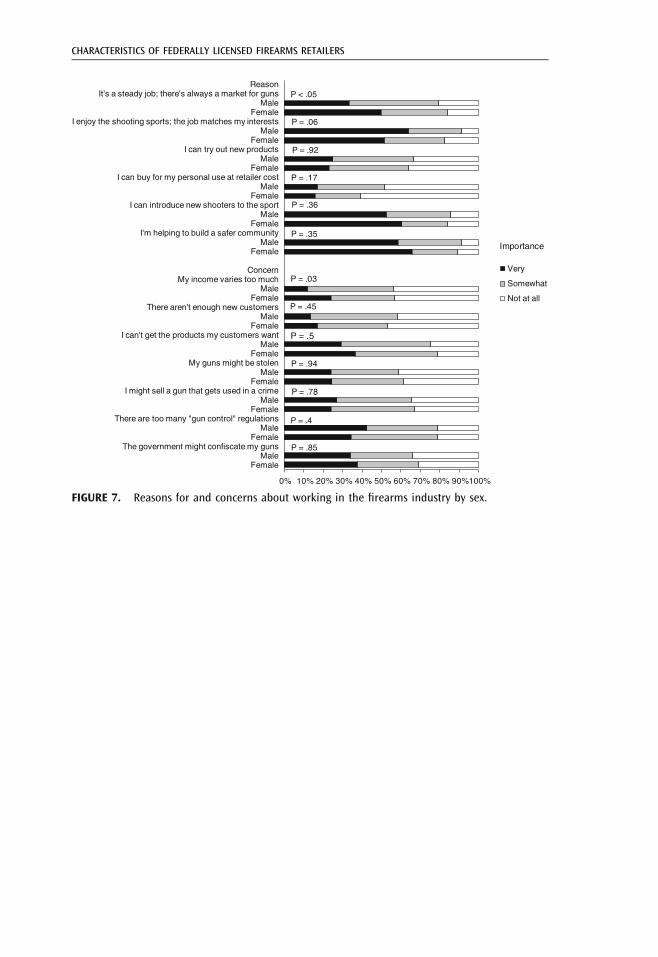
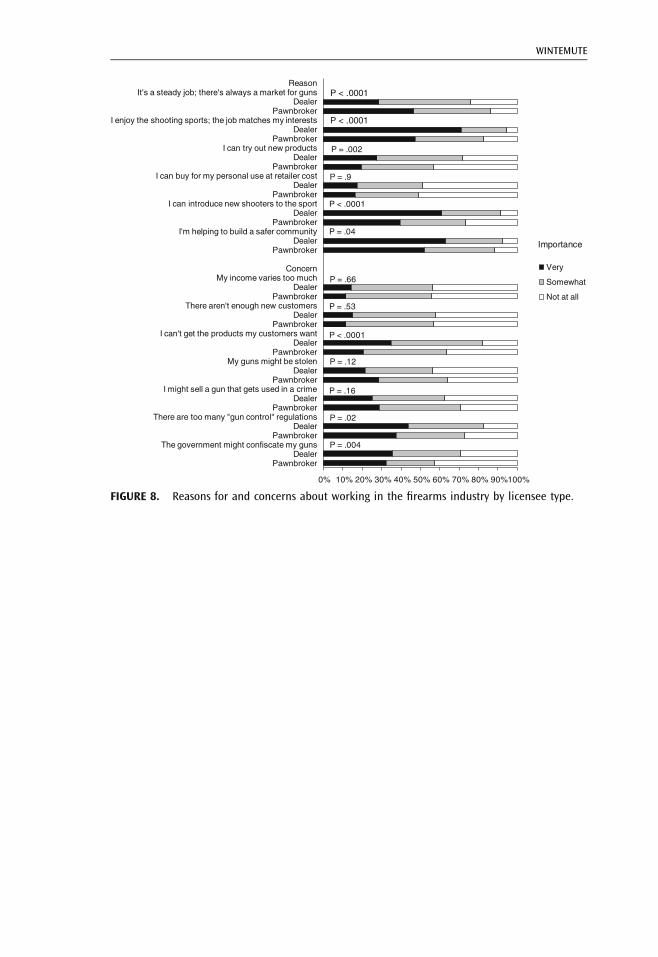
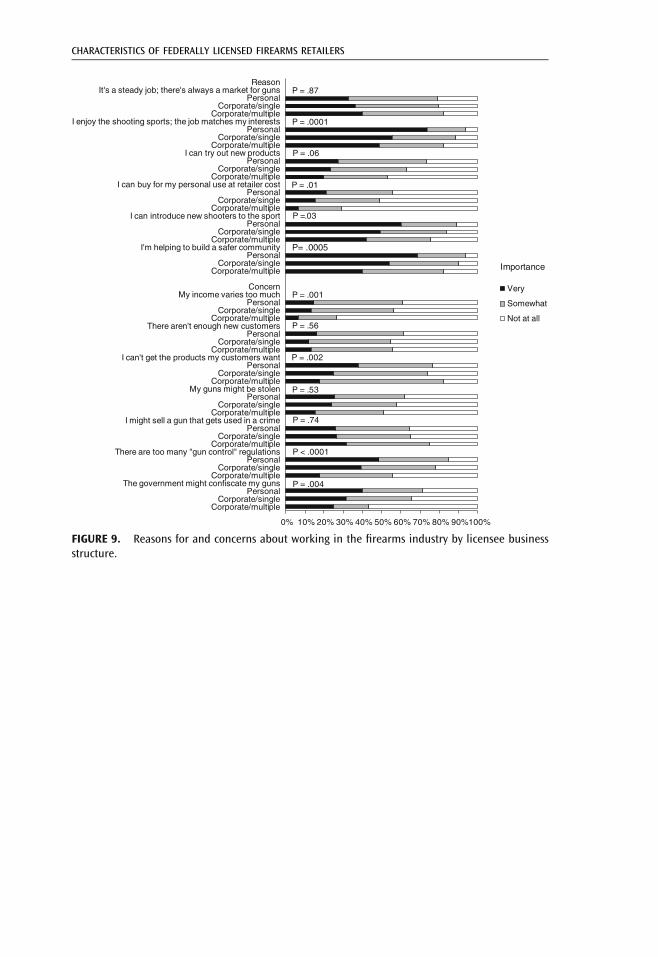
Women were more likely than men to cite a steady job as very important and lesslikely to cite a personal interest in the shooting sports; there was otherwise littledifference associatedwith respondents’ age or sex (Appendix Figures 6 and 7). The rankorder by importance of reasons for working in the business and concerns about itvaried little between gun dealers and pawnbrokers, but dealers were more likely thanpawnbrokers to rate most items as very important (Appendix Figure 8). Pawnbrokerswere more likely to rate concern for confiscation as not at all important (42.6 %) thanas very important (32.5 %). Respondents from corporate/multi-site licensees were lesslikely than others to rate most items as important (Appendix Figure 9).
Establishment Characteristics and Firearm SalesResults in this and the following sections include data provided by 48 respondentswho were not known to be owners or senior executives.
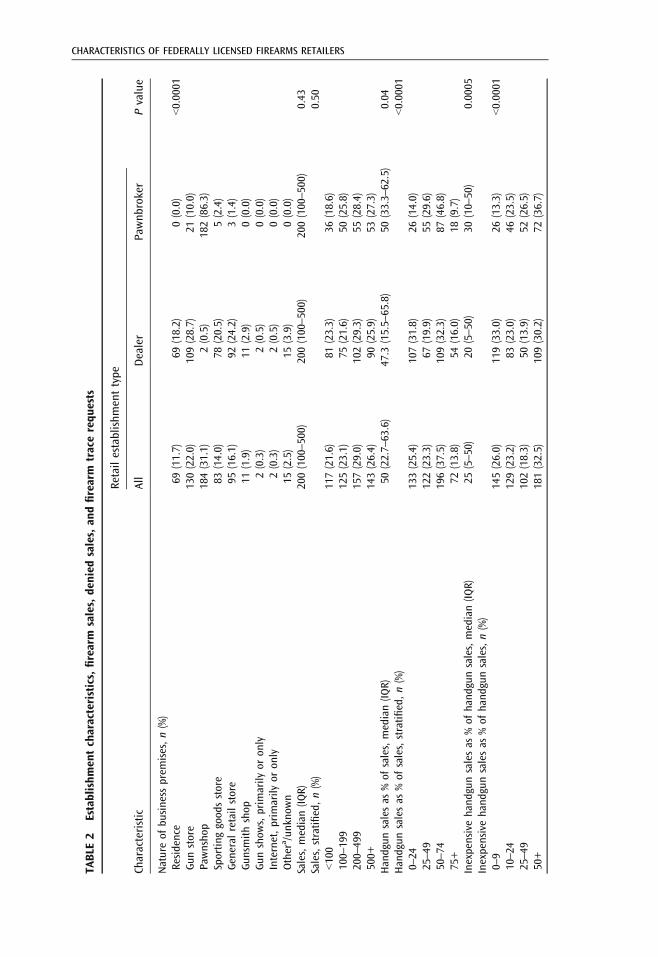
Most respondents were gun dealers (380, 64.3 %), with significant variation byregion; dealers accounted for 55.8 % of respondents in the South, 63.4 % in theWest, 78.1 % in the Midwest, and 100 % in the Northeast (pG0.0001). Dealers, butnot pawnbrokers, maintained a variety of business premises (Table 2). Residentialdealers accounted for 25.6 % of all dealers in the Midwest, 17.0 % in the West,14.6 % in the South, and 6.7 % in the Northeast (p=0.06).
Median sales volume was 200 firearms in the year preceding the survey, with nosignificant difference between dealers and pawnbrokers (Table 2). Handguns accounted forapproximately half of firearm sales in both groups (Table 2); dealers were more likely thanpawnbrokers to report either G25 % or ≥75 % of sales to be of handguns (pG0.0001).
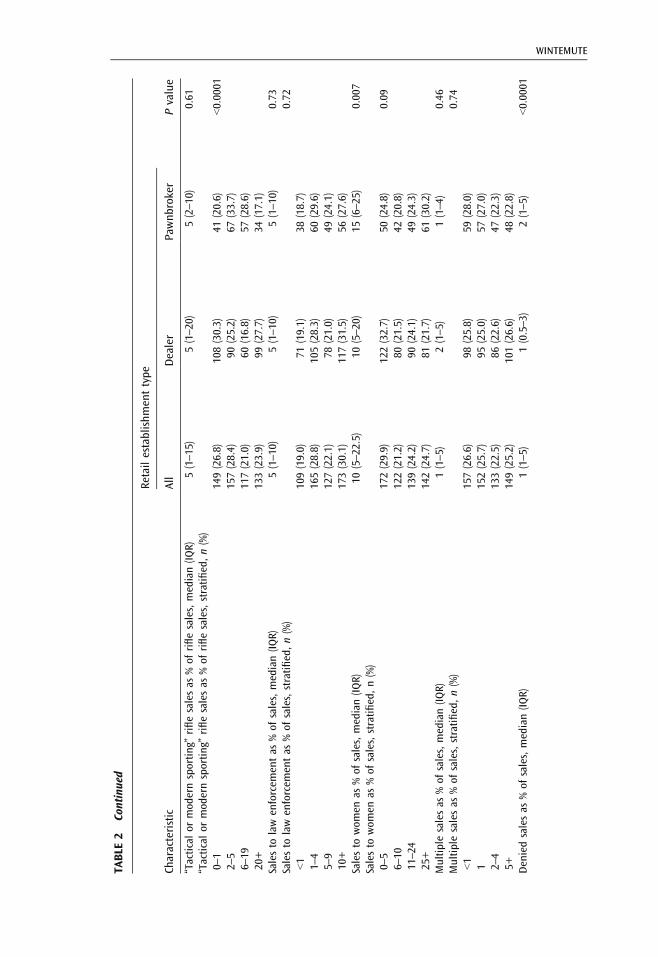
Inexpensive handguns made up a larger proportion of all handgun sales forpawnbrokers than for dealers (Table 2). There was a tendency among dealers to sellfew inexpensive handguns (G10 %, 33.0 % of dealers) or many (≥50 % or more,30.2 % of dealers). Among pawnbrokers, a plurality reported that sales ofinexpensive handguns accounted for ≥50 % of handgun sales. Tactical or modernsporting rifles accounted for a median of 5 % of rifle sales among both dealers andpawnbrokers. Again, as compared with pawnbrokers, dealers tended to sell few suchfirearms or many (pG0.0001) (Table 2).
Most respondents (472, 82.2 %) reported sales to law enforcement officers oragencies, with little variation between dealers and pawnbrokers (Table 2), and 15reported that law enforcement clients accounted for 50 % or more of their totalfirearm sales. All but five respondents reported sales to women, which were morefrequent and accounted for a larger proportion of total sales among pawnbrokers thanamong dealers (Table 2).
0% 10% 20% 30% 40% 50% 60% 70% 80% 90% 100%
The government might confiscate my gunsThere are too many "gun control" regulations
I might sell a gun that gets used in a crimeMy guns might be stolen
I can't get the products my customers wantTher aren't enough new customerse
My income varies too muchConcern
I'm helping to build a safer communityI can introduce new shooters to the sportI can buy for personal use at retailer cost
I can try out new productsI enjoy the shooting sports; the job matches my interests
It's a steady job; there's always a market for guns Reason
Very
Somewhat
Not at all
Importance
FIGURE 1. Reasons for and concerns about working in the firearms industry. Items are listed inthe order in which they are presented in the questionnaire.
WINTEMUTE
TABLE
2Establishm
entcharacteristics,firearm
sales,de
nied
sales,an
dfirearm
tracerequ
ests
Characteristic
Retailestablishm
enttype
Pvalue
All
Dealer
Pawnb
roker
Natureof
business
prem
ises,n(%)
Residence
69(11.7)
69(18.2)
0(0.0)
G0.0001
Gunstore
130(22.0)
109(28.7)
21(10.0)
Pawnsho
p184(31.1)
2(0.5)
182(86.3)
Sportin
ggood
sstore
83(14.0)
78(20.5)
5(2.4)
Generalretailstore
95(16.1)
92(24.2)
3(1.4)
Gunsmith
shop
11(1.9)
11(2.9)
0(0.0)
Gunshow
s,prim
arily
oron
ly2(0.3)
2(0.5)
0(0.0)
Internet,prim
arily
oron
ly2(0.3)
2(0.5)
0(0.0)
Other
a /un
know
n15
(2.5)
15(3.9)
0(0.0)
Sales,median(IQ
R)200(100–500)
200(100–500)
200(100–500)
0.43
Sales,stratifi
ed,n(%)
0.50
G100
117(21.6)
81(23.3)
36(18.6)
100–199
125(23.1)
75(21.6)
50(25.8)
200–499
157(29.0)
102(29.3)
55(28.4)
500+
143(26.4)
90(25.9)
53(27.3)
Handgun
salesas
%of
sales,median(IQ
R)50
(22.7–63.6)
47.3
(15.5–65.8)
50(33.3–62.5)
0.04
Handgun
salesas
%of
sales,stratified,n(%)
G0.0001
0–24
133(25.4)
107(31.8)
26(14.0)
25–49
122(23.3)
67(19.9)
55(29.6)
50–74
196(37.5)
109(32.3)
87(46.8)
75+
72(13.8)
54(16.0)
18(9.7)
Inexpensivehand
gunsalesas
%of
hand
gunsales,median(IQ
R)25
(5–50)
20(5–50)
30(10–50)
0.0005
Inexpensivehand
gunsalesas
%of
hand
gunsales,n(%)
0–9
145(26.0)
119(33.0)
26(13.3)
G0.0001
10–24
129(23.2)
83(23.0)
46(23.5)
25–49
102(18.3)
50(13.9)
52(26.5)
50+
181(32.5)
109(30.2)
72(36.7)
CHARACTERISTICS OF FEDERALLY LICENSED FIREARMS RETAILERS
TABLE
2Co
ntinued
Characteristic
Retailestablishm
enttype
Pvalue
All
Dealer
Pawnb
roker
“Tactical
ormod
ernsportin
g”riflesalesas
%of
riflesales,median(IQ
R)5(1–15)
5(1–20)
5(2–10)
0.61
“Tactical
ormod
ernsportin
g”riflesalesas
%of
riflesales,stratifi
ed,n(%)
0–1
149(26.8)
108(30.3)
41(20.6)
G0.0001
2–5
157(28.4)
90(25.2)
67(33.7)
6–19
117(21.0)
60(16.8)
57(28.6)
20+
133(23.9)
99(27.7)
34(17.1)
Salesto
lawenforcem
entas
%of
sales,median(IQ
R)5(1–10)
5(1–10)
5(1–10)
0.73
Salesto
lawenforcem
entas
%of
sales,stratifi
ed,n(%)
0.72
G1
109(19.0)
71(19.1)
38(18.7)
1–4
165(28.8)
105(28.3)
60(29.6)
5–9
127(22.1)
78(21.0)
49(24.1)
10+
173(30.1)
117(31.5)
56(27.6)
Salesto
wom
enas
%of
sales,median(IQ
R)10
(5–22.5)
10(5–20)
15(6–25)
0.007
Salesto
wom
enas
%of
sales,stratifi
ed,n(%)
0–5
172(29.9)
122(32.7)
50(24.8)
0.09
6–10
122(21.2)
80(21.5)
42(20.8)
11–24
139(24.2)
90(24.1)
49(24.3)
25+
142(24.7)
81(21.7)
61(30.2)
Multip
lesalesas
%of
sales,median(IQ
R)1(1–5)
2(1–5)
1(1–4)
0.46
Multip
lesalesas
%of
sales,stratified,n(%)
0.74
G1
157(26.6)
98(25.8)
59(28.0)
1152(25.7)
95(25.0)
57(27.0)
2–4
133(22.5)
86(22.6)
47(22.3)
5+149(25.2)
101(26.6)
48(22.8)
Deniedsalesas
%of
sales,median(IQ
R)1(1–5)
1(0.5–3)
2(1–5)
G0.0001
WINTEMUTE
Deniedsalesas
%of
sales,stratifi
ed,n(%)
G1
131(23.1)
106(28.9)
25(12.6)
G0.0001
1171(30.1)
117(31.6)
54(27.3)
2–4
114(20.1)
68(18.4)
46(23.2)
5+152(26.8)
79(21.4)
73(36.9)
Tracerequ
estsas
%of
sales,median(IQ
R)0.7(0.002–2)
0.5(0–2)
0.75
(0.25–2.3)
0.01
Tracerequ
estsas
%of
sales,stratified,n(%)
0133(25.0)
103(29.9)
30(16.0)
0.004
90,
≤0.5
119(22.4)
71(20.6)
48(25.7)
90.5,
G2
139(26.1)
81(23.5)
58(31.0)
2+141(26.5)
90(26.1)
51(27.3)
a Other
includ
esfive
auctionfacilities,four
shootin
gclub
s/ranges,on
efirearm
distribu
tor,on
epo
liceequipm
entstore,
onelawoffice,on
etransm
ission
shop
,on
ebu
siness
office
CHARACTERISTICS OF FEDERALLY LICENSED FIREARMS RETAILERS
Most respondents (458, 80 %) reported sales to clients who bought more thanone firearm in five business days, but such sales were not common (Table 2) andwere distributed similarly for dealers and pawnbrokers.
Sales on the Internet were reported by 164 respondents (28.3 %), among whomInternet sales accounted for a slightly higher percentage of all sales for dealers(median 6 %, IQR 3 %–33 %) than for pawnbrokers (median 5 %, IQR 1.5 %–10 %) (p=0.01). Twenty-two respondents, 19 of whom were dealers, reported that≥50 % of their firearm sales were made on the Internet.
Only 83 respondents (14.3 %) reported selling any firearms at gun shows. Amongthese, gun show sales accounted for a higher percentage of all sales for dealers(median 35 %, IQR 5 %–60 %) than for pawnbrokers (median 5 %, IQR 2 %–10 %) (p=0.002). Twenty-six respondents, all but one of whom were dealers,reported that ≥50 % of their firearm sales were made at gun shows.
Corporate/multi-site licensees were more likely than others to be firearms dealers,sold fewer handguns, and sold relatively more inexpensive handguns and relativelyfewer tactical or modern sporting rifles (Appendix Table 3).
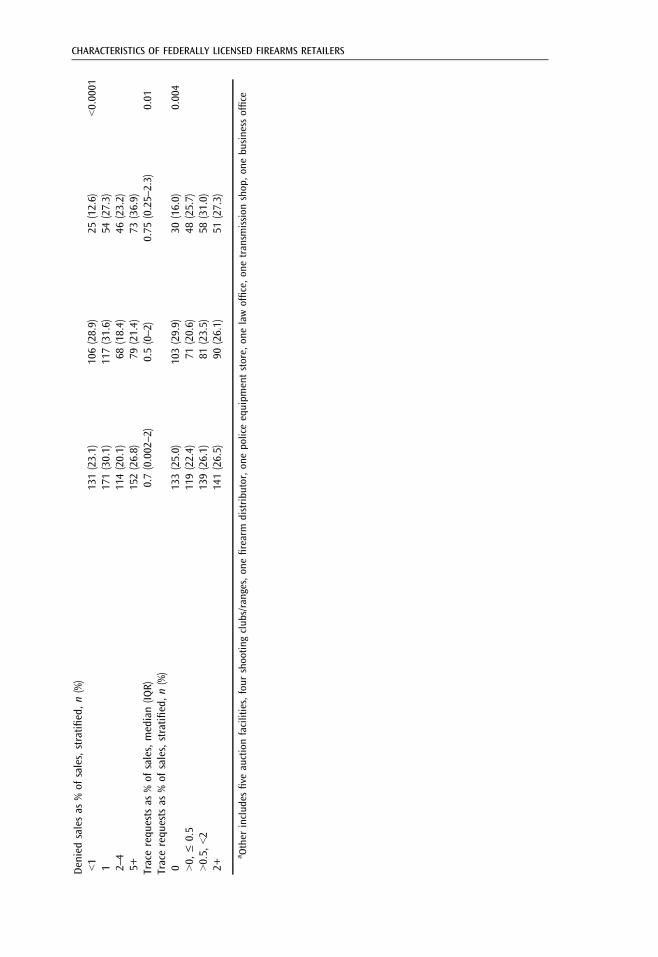
Denied Sales and Firearm TracesSales that were denied after prospective purchasers failed NICS checks accounted forapproximately 1 % of firearm sales overall (median 1 %, IQR 1 %–5 %); only 65(11.4 %) respondents reported having no denied sales over the 5 years preceding thesurvey. Denials occurred more frequently among pawnbrokers than among dealers(Table 2). Respondents reported receiving firearm trace requests, again for the 5 yearsprior to the survey, at a frequency equaling less than 1 % of their annual firearm sales(median 0.7 %, IQR 0.002–2%), and 133 (25 %) respondents received no trace requests.
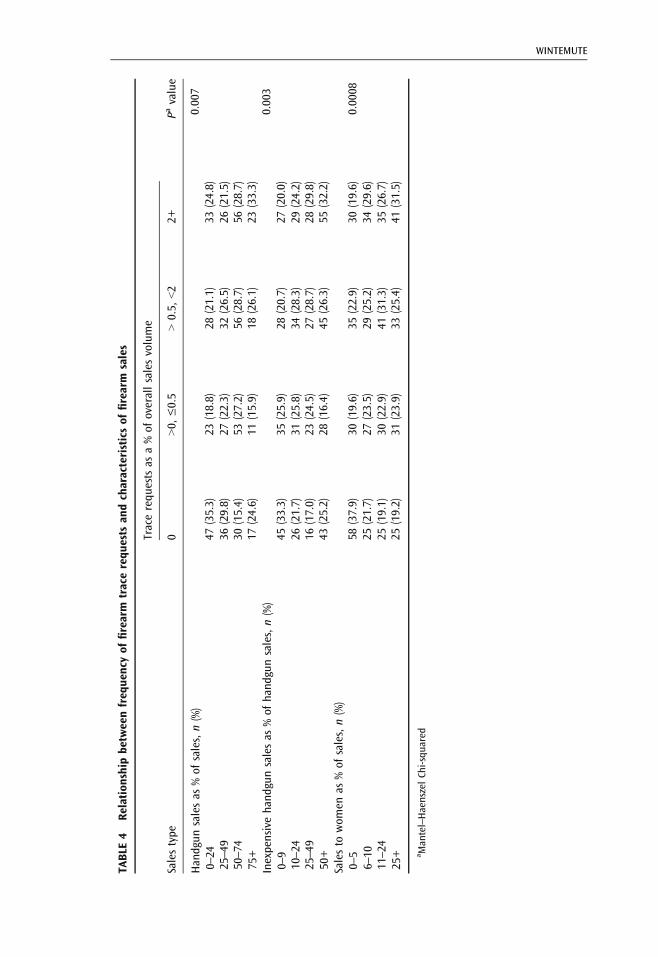
Firearm traces were also more frequent among pawnbrokers than among dealers(Table 2). Trace frequency was directly associated with the percentage of firearmsales involving handguns (p=0.007), inexpensive handguns (p=0.003), and femalepurchasers (p=0.0008) (Appendix Table 4). Both denials and traces were morecommon among corporate/multi-site licensees than others (Appendix Table 3).
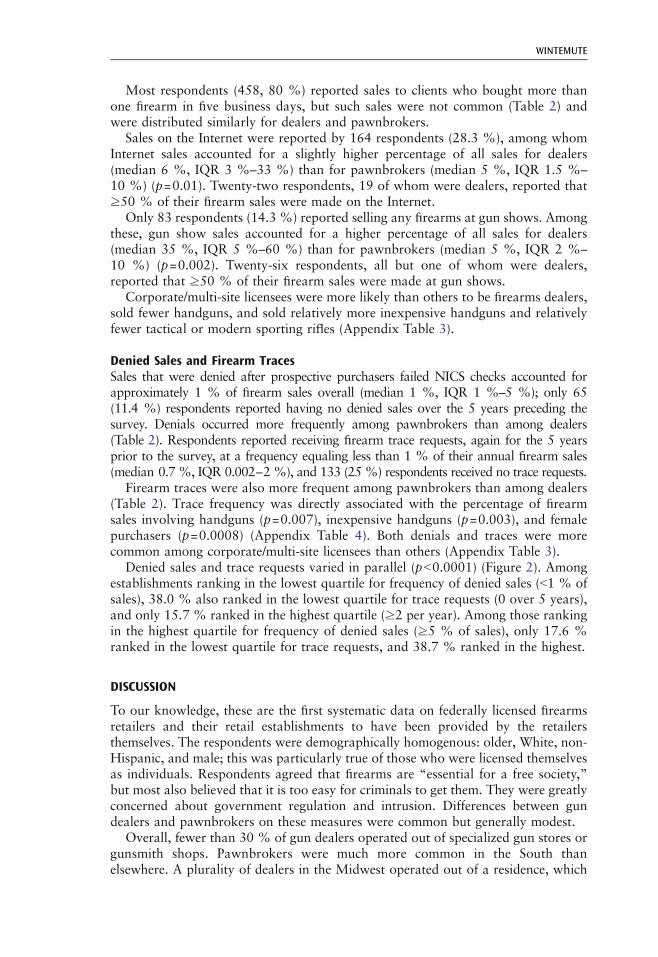
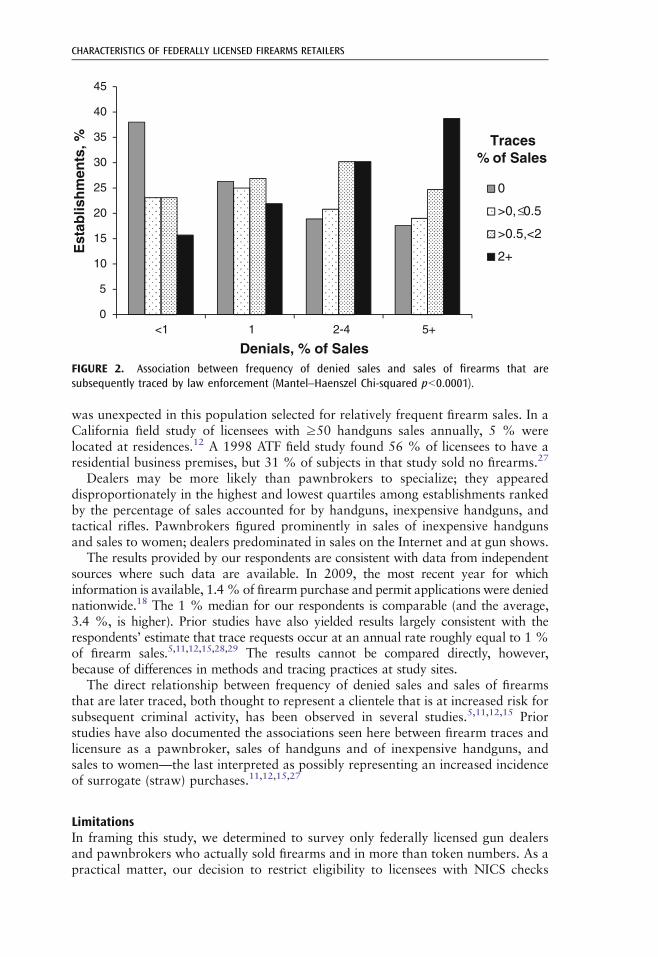
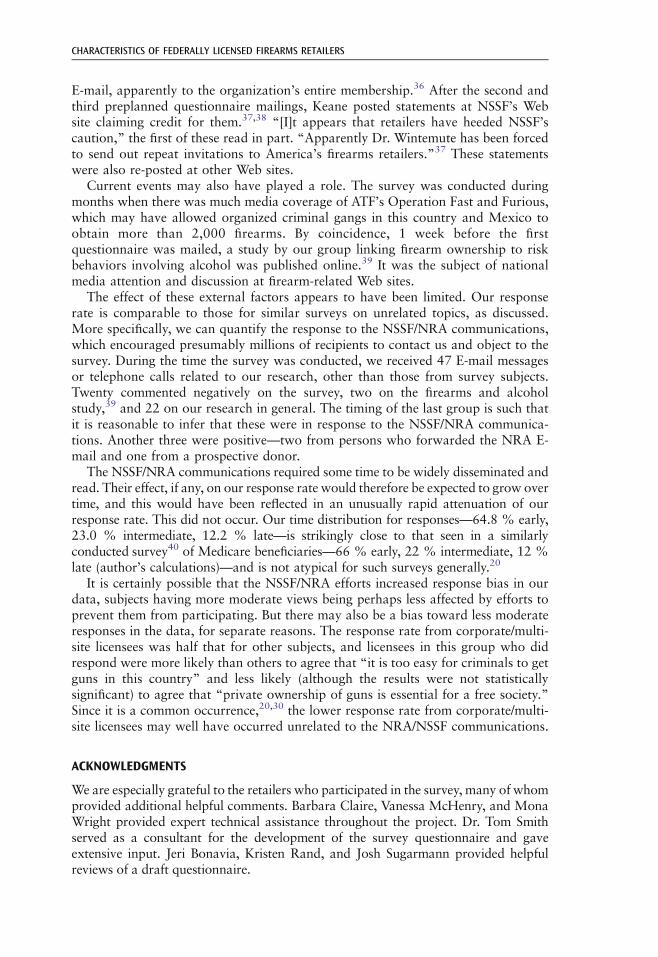
Denied sales and trace requests varied in parallel (pG0.0001) (Figure 2). Amongestablishments ranking in the lowest quartile for frequency of denied sales (G1 % ofsales), 38.0 % also ranked in the lowest quartile for trace requests (0 over 5 years),and only 15.7 % ranked in the highest quartile (≥2 per year). Among those rankingin the highest quartile for frequency of denied sales (≥5 % of sales), only 17.6 %ranked in the lowest quartile for trace requests, and 38.7 % ranked in the highest.
DISCUSSION
To our knowledge, these are the first systematic data on federally licensed firearmsretailers and their retail establishments to have been provided by the retailersthemselves. The respondents were demographically homogenous: older, White, non-Hispanic, and male; this was particularly true of those who were licensed themselvesas individuals. Respondents agreed that firearms are “essential for a free society,”but most also believed that it is too easy for criminals to get them. They were greatlyconcerned about government regulation and intrusion. Differences between gundealers and pawnbrokers on these measures were common but generally modest.
Overall, fewer than 30 % of gun dealers operated out of specialized gun stores orgunsmith shops. Pawnbrokers were much more common in the South thanelsewhere. A plurality of dealers in the Midwest operated out of a residence, which
WINTEMUTE
was unexpected in this population selected for relatively frequent firearm sales. In aCalifornia field study of licensees with ≥50 handguns sales annually, 5 % werelocated at residences.12 A 1998 ATF field study found 56 % of licensees to have aresidential business premises, but 31 % of subjects in that study sold no firearms.27
Dealers may be more likely than pawnbrokers to specialize; they appeareddisproportionately in the highest and lowest quartiles among establishments rankedby the percentage of sales accounted for by handguns, inexpensive handguns, andtactical rifles. Pawnbrokers figured prominently in sales of inexpensive handgunsand sales to women; dealers predominated in sales on the Internet and at gun shows.
The results provided by our respondents are consistent with data from independentsources where such data are available. In 2009, the most recent year for whichinformation is available, 1.4% of firearm purchase and permit applications were deniednationwide.18 The 1 % median for our respondents is comparable (and the average,3.4 %, is higher). Prior studies have also yielded results largely consistent with therespondents’ estimate that trace requests occur at an annual rate roughly equal to 1 %of firearm sales.5,11,12,15,28,29 The results cannot be compared directly, however,because of differences in methods and tracing practices at study sites.
The direct relationship between frequency of denied sales and sales of firearmsthat are later traced, both thought to represent a clientele that is at increased risk forsubsequent criminal activity, has been observed in several studies.5,11,12,15 Priorstudies have also documented the associations seen here between firearm traces andlicensure as a pawnbroker, sales of handguns and of inexpensive handguns, andsales to women—the last interpreted as possibly representing an increased incidenceof surrogate (straw) purchases.11,12,15,27
LimitationsIn framing this study, we determined to survey only federally licensed gun dealersand pawnbrokers who actually sold firearms and in more than token numbers. As apractical matter, our decision to restrict eligibility to licensees with NICS checks
0
5
10
15
20
25
30
35
40
45
<1 1 2-4 5+
Est
ablis
hm
ents
, %
Denials, % of Sales
0
>0, ≤0.5
>0.5,<2
2+
Traces% of Sales
FIGURE 2. Association between frequency of denied sales and sales of firearms that aresubsequently traced by law enforcement (Mantel–Haenszel Chi-squared pG0.0001).
CHARACTERISTICS OF FEDERALLY LICENSED FIREARMS RETAILERS
above a specified threshold excluded licensees from seven states because counts ofNICS checks were not available for those states. Licensees from so-called partialPOC states, in which licensees contact a state agency for some NICS checks and theFBI for others, are likely to be under-represented because not all of their NICS checkrequests are tabulated by the FBI. Licensees from Brady alternative states may beunder-represented because not all of their sales require NICS checks.
Conversely, some low-volume pawnbrokers may have been misclassified as eligible,since pawnbrokers request NICS checks for pawn redemptions as well as firearm sales,and the transactions are not distinguished in the FBI’s tabulations. Misclassificationwould have occurred if a pawnbroker met the eligibility criterion based on NICS checksfor sales and redemptions together but would not have done so for sales alone. Sincepawnbrokers were more prevalent in the South than elsewhere, this would also have ledto over-representation of licensees from that part of the country. For all these reasons,our results cannot be considered nationally representative.
Our overall response rate was 36.9 %. Dillman and colleagues, who developed thesurvey methods we used,20 achieved an average response rate of 38.8 % (author’scalculation) in five business surveys having questionnaires the same length as ours andrequiring materials to be addressed generically to an owner/manager, as was necessaryfor 62 % of our subjects.30 A recent review of business surveys using a variety oftraditional and adapted techniques found that response rates generally rangedbetween 28 % and 45 %.31 The questionnaire and individual question completionrates in our survey were high, including those for questions soliciting potentiallysensitive business information such as numbers of firearms sold. This suggests that theinternal validity of the data is high.
The differential response rate by business type is perhaps a greater limitation;corporate/multi-site licensees are underrepresented in our data. A lower responserate from large corporations is common to business surveys, in part because theremay be no named individual to receive the survey materials.20,30 These subjects werealso most frequent among our late respondents, validating our expenditure ofadditional resources to acquire them.32,33
The representativeness of results for these subjects is questionable. For example,corporate/multi-site licensees were found to sell handguns much less frequently thanothers but also, paradoxically, to sell disproportionate numbers of inexpensivehandguns. These findings result from the fact that 57.6 % of respondents in thisgroup are affiliated with a single large retail corporation that generally does not sellhandguns; of the remainder, 40 % are pawnbrokers.
Our results may have been affected by external factors, chief among them beingefforts to deter subjects from participating. Two days after the first questionnairewas mailed, Larry Keane, general counsel of the National Shooting SportsFoundation (NSSF), posted a notice at the organization’s Web site “stronglydiscouraging retailers from participating in this survey.”34 He included the project’stelephone number and E-mail address and encouraged “all sportsmen, gun ownersand firearms enthusiasts to contact [the investigators] to politely express theirobjections to this agenda-driven, anti-gun research.” NSSF also posted thequestionnaire and cover letter. The text of Keane’s announcement was revised afew days later to “urg[e] extreme caution should retailers decide to participate.”Reprints of the original and modified text and links to the post appeared on otherfirearm industry and consumer Web sites. The National Rifle Association (NRA)issued a notice to retailers at its Web site on June 29, “recommend[ing] that you donot respond to the survey.”35 The organization also sent its notice as a personalized
WINTEMUTE
E-mail, apparently to the organization’s entire membership.36 After the second andthird preplanned questionnaire mailings, Keane posted statements at NSSF’s Website claiming credit for them.37,38 “[I]t appears that retailers have heeded NSSF’scaution,” the first of these read in part. “Apparently Dr. Wintemute has been forcedto send out repeat invitations to America’s firearms retailers.”37 These statementswere also re-posted at other Web sites.
Current events may also have played a role. The survey was conducted duringmonths when there was much media coverage of ATF’s Operation Fast and Furious,which may have allowed organized criminal gangs in this country and Mexico toobtain more than 2,000 firearms. By coincidence, 1 week before the firstquestionnaire was mailed, a study by our group linking firearm ownership to riskbehaviors involving alcohol was published online.39 It was the subject of nationalmedia attention and discussion at firearm-related Web sites.
The effect of these external factors appears to have been limited. Our responserate is comparable to those for similar surveys on unrelated topics, as discussed.More specifically, we can quantify the response to the NSSF/NRA communications,which encouraged presumably millions of recipients to contact us and object to thesurvey. During the time the survey was conducted, we received 47 E-mail messagesor telephone calls related to our research, other than those from survey subjects.Twenty commented negatively on the survey, two on the firearms and alcoholstudy,39 and 22 on our research in general. The timing of the last group is such thatit is reasonable to infer that these were in response to the NSSF/NRA communica-tions. Another three were positive—two from persons who forwarded the NRA E-mail and one from a prospective donor.
The NSSF/NRA communications required some time to be widely disseminated andread. Their effect, if any, on our response rate would therefore be expected to grow overtime, and this would have been reflected in an unusually rapid attenuation of ourresponse rate. This did not occur. Our time distribution for responses—64.8 % early,23.0 % intermediate, 12.2 % late—is strikingly close to that seen in a similarlyconducted survey40 of Medicare beneficiaries—66 % early, 22 % intermediate, 12 %late (author’s calculations)—and is not atypical for such surveys generally.20
It is certainly possible that the NSSF/NRA efforts increased response bias in ourdata, subjects having more moderate views being perhaps less affected by efforts toprevent them from participating. But there may also be a bias toward less moderateresponses in the data, for separate reasons. The response rate from corporate/multi-site licensees was half that for other subjects, and licensees in this group who didrespond were more likely than others to agree that “it is too easy for criminals to getguns in this country” and less likely (although the results were not statisticallysignificant) to agree that “private ownership of guns is essential for a free society.”Since it is a common occurrence,20,30 the lower response rate from corporate/multi-site licensees may well have occurred unrelated to the NRA/NSSF communications.
ACKNOWLEDGMENTS
We are especially grateful to the retailers who participated in the survey, many of whomprovided additional helpful comments. Barbara Claire, Vanessa McHenry, and MonaWright provided expert technical assistance throughout the project. Dr. Tom Smithserved as a consultant for the development of the survey questionnaire and gaveextensive input. Jeri Bonavia, Kristen Rand, and Josh Sugarmann provided helpfulreviews of a draft questionnaire.
CHARACTERISTICS OF FEDERALLY LICENSED FIREARMS RETAILERS
Project support. This project was supported in part by a grant from The CaliforniaWellness Foundation. Initial planning was also supported in part by a grant from theJoyce Foundation.
APPENDIX: SUPPLEMENTAL TABLES AND FIGURES
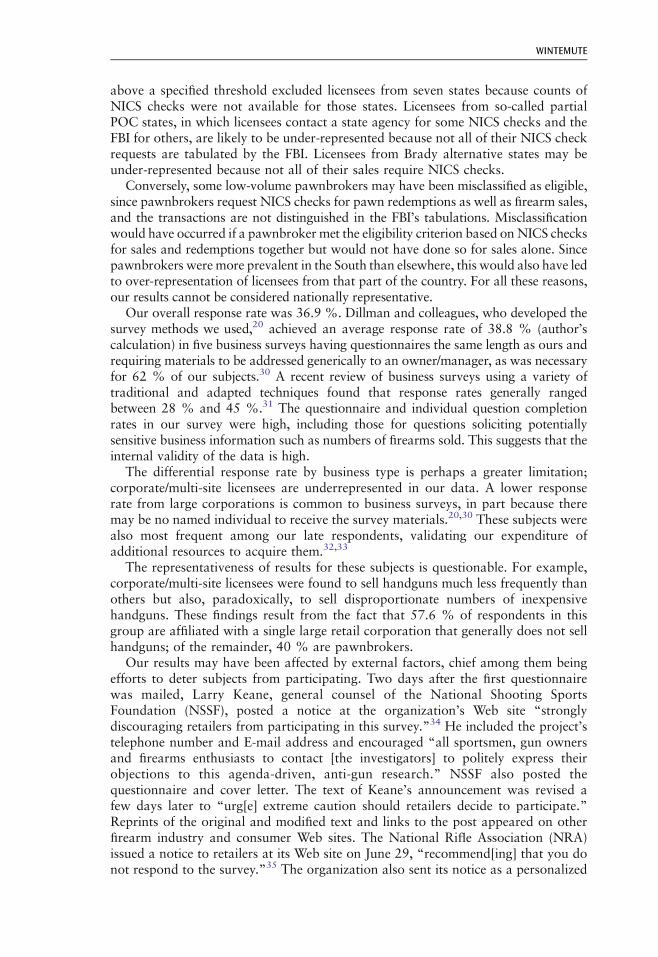
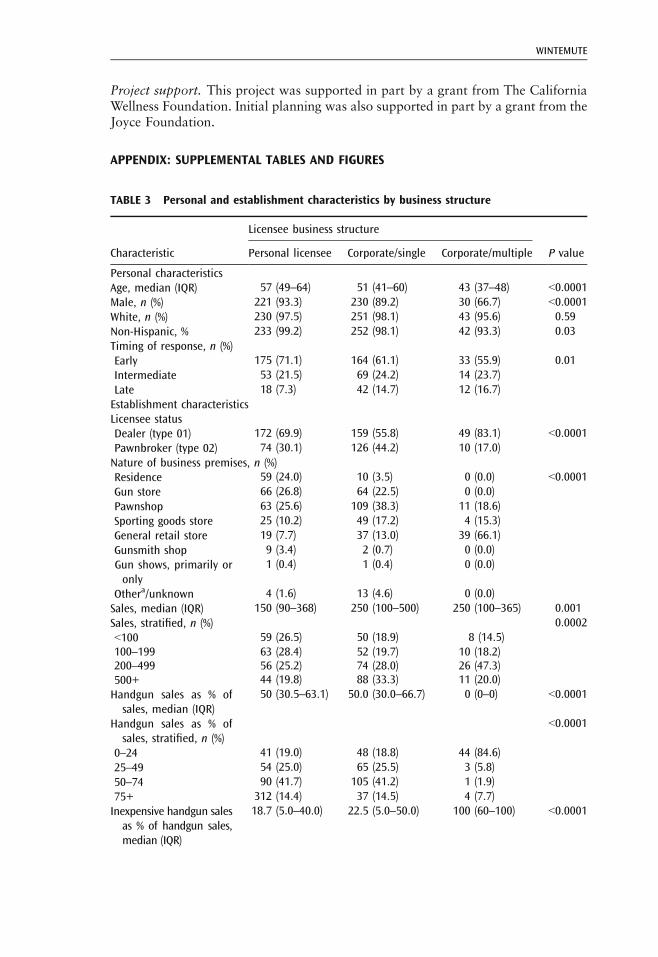
TABLE 3 Personal and establishment characteristics by business structure
Characteristic
Licensee business structure
P valuePersonal licensee Corporate/single Corporate/multiple
Personal characteristicsAge, median (IQR) 57 (49–64) 51 (41–60) 43 (37–48) G0.0001Male, n (%) 221 (93.3) 230 (89.2) 30 (66.7) G0.0001White, n (%) 230 (97.5) 251 (98.1) 43 (95.6) 0.59Non-Hispanic, % 233 (99.2) 252 (98.1) 42 (93.3) 0.03Timing of response, n (%)Early 175 (71.1) 164 (61.1) 33 (55.9) 0.01Intermediate 53 (21.5) 69 (24.2) 14 (23.7)Late 18 (7.3) 42 (14.7) 12 (16.7)Establishment characteristicsLicensee statusDealer (type 01) 172 (69.9) 159 (55.8) 49 (83.1) G0.0001Pawnbroker (type 02) 74 (30.1) 126 (44.2) 10 (17.0)Nature of business premises, n (%)Residence 59 (24.0) 10 (3.5) 0 (0.0) G0.0001Gun store 66 (26.8) 64 (22.5) 0 (0.0)Pawnshop 63 (25.6) 109 (38.3) 11 (18.6)Sporting goods store 25 (10.2) 49 (17.2) 4 (15.3)General retail store 19 (7.7) 37 (13.0) 39 (66.1)Gunsmith shop 9 (3.4) 2 (0.7) 0 (0.0)Gun shows, primarily oronly
1 (0.4) 1 (0.4) 0 (0.0)
Othera/unknown 4 (1.6) 13 (4.6) 0 (0.0)Sales, median (IQR) 150 (90–368) 250 (100–500) 250 (100–365) 0.001Sales, stratified, n (%) 0.0002G100 59 (26.5) 50 (18.9) 8 (14.5)100–199 63 (28.4) 52 (19.7) 10 (18.2)200–499 56 (25.2) 74 (28.0) 26 (47.3)500+ 44 (19.8) 88 (33.3) 11 (20.0)Handgun sales as % ofsales, median (IQR)
50 (30.5–63.1) 50.0 (30.0–66.7) 0 (0–0) G0.0001
Handgun sales as % ofsales, stratified, n (%)
G0.0001
0–24 41 (19.0) 48 (18.8) 44 (84.6)25–49 54 (25.0) 65 (25.5) 3 (5.8)50–74 90 (41.7) 105 (41.2) 1 (1.9)75+ 312 (14.4) 37 (14.5) 4 (7.7)Inexpensive handgun salesas % of handgun sales,median (IQR)
18.7 (5.0–40.0) 22.5 (5.0–50.0) 100 (60–100) G0.0001
WINTEMUTE
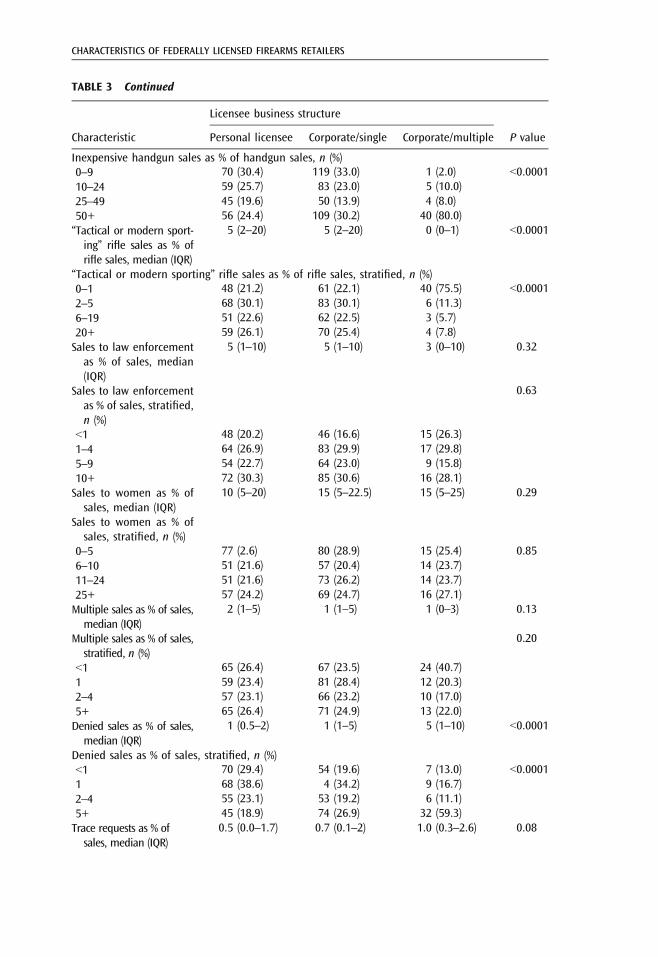
TABLE 3 Continued
Characteristic
Licensee business structure
P valuePersonal licensee Corporate/single Corporate/multiple
Inexpensive handgun sales as % of handgun sales, n (%)0–9 70 (30.4) 119 (33.0) 1 (2.0) G0.000110–24 59 (25.7) 83 (23.0) 5 (10.0)25–49 45 (19.6) 50 (13.9) 4 (8.0)50+ 56 (24.4) 109 (30.2) 40 (80.0)“Tactical or modern sport-ing” rifle sales as % ofrifle sales, median (IQR)
5 (2–20) 5 (2–20) 0 (0–1) G0.0001
“Tactical or modern sporting” rifle sales as % of rifle sales, stratified, n (%)0–1 48 (21.2) 61 (22.1) 40 (75.5) G0.00012–5 68 (30.1) 83 (30.1) 6 (11.3)6–19 51 (22.6) 62 (22.5) 3 (5.7)20+ 59 (26.1) 70 (25.4) 4 (7.8)Sales to law enforcementas % of sales, median(IQR)
5 (1–10) 5 (1–10) 3 (0–10) 0.32
Sales to law enforcementas % of sales, stratified,n (%)
0.63
G1 48 (20.2) 46 (16.6) 15 (26.3)1–4 64 (26.9) 83 (29.9) 17 (29.8)5–9 54 (22.7) 64 (23.0) 9 (15.8)10+ 72 (30.3) 85 (30.6) 16 (28.1)Sales to women as % ofsales, median (IQR)
10 (5–20) 15 (5–22.5) 15 (5–25) 0.29
Sales to women as % ofsales, stratified, n (%)
0–5 77 (2.6) 80 (28.9) 15 (25.4) 0.856–10 51 (21.6) 57 (20.4) 14 (23.7)11–24 51 (21.6) 73 (26.2) 14 (23.7)25+ 57 (24.2) 69 (24.7) 16 (27.1)Multiple sales as % of sales,median (IQR)
2 (1–5) 1 (1–5) 1 (0–3) 0.13
Multiple sales as % of sales,stratified, n (%)
0.20
G1 65 (26.4) 67 (23.5) 24 (40.7)1 59 (23.4) 81 (28.4) 12 (20.3)2–4 57 (23.1) 66 (23.2) 10 (17.0)5+ 65 (26.4) 71 (24.9) 13 (22.0)Denied sales as % of sales,median (IQR)
1 (0.5–2) 1 (1–5) 5 (1–10) G0.0001
Denied sales as % of sales, stratified, n (%)G1 70 (29.4) 54 (19.6) 7 (13.0) G0.00011 68 (38.6) 4 (34.2) 9 (16.7)2–4 55 (23.1) 53 (19.2) 6 (11.1)5+ 45 (18.9) 74 (26.9) 32 (59.3)Trace requests as % ofsales, median (IQR)
0.5 (0.0–1.7) 0.7 (0.1–2) 1.0 (0.3–2.6) 0.08
CHARACTERISTICS OF FEDERALLY LICENSED FIREARMS RETAILERS
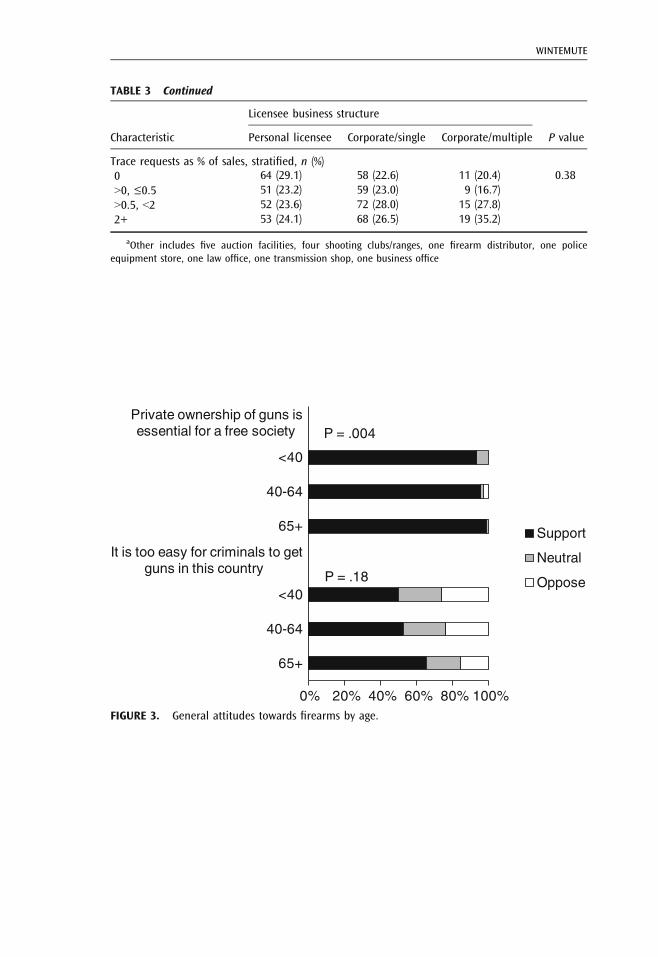
TABLE 3 Continued
Characteristic
Licensee business structure
P valuePersonal licensee Corporate/single Corporate/multiple
Trace requests as % of sales, stratified, n (%)0 64 (29.1) 58 (22.6) 11 (20.4) 0.3890, ≤0.5 51 (23.2) 59 (23.0) 9 (16.7)90.5, G2 52 (23.6) 72 (28.0) 15 (27.8)2+ 53 (24.1) 68 (26.5) 19 (35.2)
aOther includes five auction facilities, four shooting clubs/ranges, one firearm distributor, one policeequipment store, one law office, one transmission shop, one business office
0% 20% 40% 60% 80% 100%
65+
40-64
<40
It is too easy for criminals to getguns in this country
65+
40-64
<40
Private ownership of guns isessential for a free society
Support
Neutral
Oppose
P = .004
P = .18
FIGURE 3. General attitudes towards firearms by age.
WINTEMUTE
0% 20% 40% 60% 80% 100%
Female
Male
It is too easy for criminals to getguns in this country
Female
Male
Private ownership of guns isessential for a free society
Support
Neutral
Oppose
P = .28
P = .01
FIGURE 4. General attitudes towards firearms by sex.
0% 20% 40% 60% 80% 100%
Corporate/multiple
Corporate/single
Personal
It is too easy for criminals to get guns in this country
Corporate/multiple
Corporate/single
Personal
Private ownership of guns isessential for a free society
Support
Neutral
OpposeP= .0002
P = .1
FIGURE 5. General attitudes towards firearms by licensee business structure.
CHARACTERISTICS OF FEDERALLY LICENSED FIREARMS RETAILERS
0% 10% 20% 30% 40% 50% 60% 70% 80% 90%100%
65+40-64
<40The government might confiscate my guns
65+40-64
<40There are too many "gun control" regulations
65+40-64
<40I might sell a gun that gets used in a crime
65+40-64
<40My guns might be stolen
65+40-64
<40I can't get the products my customers want
65+40-64
<40There aren't enough new customers
65+40-64
<40My income varies too much
Concern
65+40-64
<40I'm helping to build a safer community
65+40-64
<40I can introduce new shooters to the sport
65+40-64
<40I can buy for my personal use at retailer cost
65+40-64
<40I can try out new products
65+40-64
<40I enjoy the shooting sports; the job matches my interests
65+40-64
<40It's a steady job; there's always a market for guns
Reason
Very
Somewhat
Not at all
Importance
P = .98
P = .1
P = .8
P = .05
P = .83
P = .39
P = .37
P = .37
P = .48
P = .28
P = .72
P = .08
P = .08
FIGURE 6. Reasons for and concerns about working in the firearms industry by age.
WINTEMUTE
0% 10% 20% 30% 40% 50% 60% 70% 80% 90%100%
FemaleMale
The government might confiscate my gunsFemale
MaleThere are too many "gun control" regulations
FemaleMale
I might sell a gun that gets used in a crimeFemale
MaleMy guns might be stolen
FemaleMale
I can't get the products my customers wantFemale
MaleThere aren't enough new customers
FemaleMale
My income varies too muchConcern
FemaleMale
I'm helping to build a safer communityFemale
MaleI can introduce new shooters to the sport
FemaleMale
I can buy for my personal use at retailer costFemale
MaleI can try out new products
FemaleMale
I enjoy the shooting sports; the job matches my interestsFemale
MaleIt's a steady job; there's always a market for guns
Reason
Very
Somewhat
Not at all
Importance
P = .06
P < .05
P = .92
P = .17
P = .36
P = .03
P = .45
P = .5
P = .94
P = .78
P = .4
P = .85
P = .35
FIGURE 7. Reasons for and concerns about working in the firearms industry by sex.
CHARACTERISTICS OF FEDERALLY LICENSED FIREARMS RETAILERS
0% 10% 20% 30% 40% 50% 60% 70% 80% 90%100%
PawnbrokerDealer
The government might confiscate my gunsPawnbroker
DealerThere are too many "gun control" regulations
PawnbrokerDealer
I might sell a gun that gets used in a crimePawnbroker
DealerMy guns might be stolen
PawnbrokerDealer
I can't get the products my customers wantPawnbroker
DealerThere aren't enough new customers
PawnbrokerDealer
My income varies too muchConcern
PawnbrokerDealer
I'm helping to build a safer communityPawnbroker
DealerI can introduce new shooters to the sport
PawnbrokerDealer
I can buy for my personal use at retailer costPawnbroker
DealerI can try out new products
PawnbrokerDealer
I enjoy the shooting sports; the job matches my interestsPawnbroker
DealerIt's a steady job; there's always a market for guns
Reason
Very
Somewhat
Not at all
Importance
P = .002
P = .9
P < .0001
P = .04
P = .66
P = .53
P < .0001
P = .12
P = .16
P = .02
P = .004
P < .0001
P < .0001
FIGURE 8. Reasons for and concerns about working in the firearms industry by licensee type.
WINTEMUTE
0% 10% 20% 30% 40% 50% 60% 70% 80% 90%100%
Corporate/multipleCorporate/single
PersonalThe government might confiscate my guns
Corporate/multipleCorporate/single
PersonalThere are too many "gun control" regulations
Corporate/multipleCorporate/single
PersonalI might sell a gun that gets used in a crime
Corporate/multipleCorporate/single
PersonalMy guns might be stolen
Corporate/multipleCorporate/single
PersonalI can't get the products my customers want
Corporate/multipleCorporate/single
PersonalThere aren't enough new customers
Corporate/multipleCorporate/single
PersonalMy income varies too much
Concern
Corporate/multipleCorporate/single
PersonalI'm helping to build a safer community
Corporate/multipleCorporate/single
PersonalI can introduce new shooters to the sport
Corporate/multipleCorporate/single
PersonalI can buy for my personal use at retailer cost
Corporate/multipleCorporate/single
PersonalI can try out new products
Corporate/multipleCorporate/single
PersonalI enjoy the shooting sports; the job matches my interests
Corporate/multipleCorporate/single
PersonalIt's a steady job; there's always a market for guns
Reason
Very
Somewhat
Not at all
Importance
P = .87
P = .06
P =.03
P = .001
P = .56
P = .002
P = .53
P = .74
P < .0001
P = .004
P = .01
P = .0001
P= .0005
FIGURE 9. Reasons for and concerns about working in the firearms industry by licensee businessstructure.
CHARACTERISTICS OF FEDERALLY LICENSED FIREARMS RETAILERS
TABLE
4Relationshipbe
tweenfreq
uencyof
firearm
tracerequ
ests
andcharacteristicsof
firearm
sales
Salestype
Tracerequ
estsas
a%of
overallsalesvolume
Pavalue
090,
≤0.5
90.5,
G2
2+
Handgun
salesas
%of
sales,n(%)
0.007
0–24
47(35.3)
23(18.8)
28(21.1)
33(24.8)
25–49
36(29.8)
27(22.3)
32(26.5)
26(21.5)
50–74
30(15.4)
53(27.2)
56(28.7)
56(28.7)
75+
17(24.6)
11(15.9)
18(26.1)
23(33.3)
Inexpensivehand
gunsalesas
%of
hand
gunsales,n(%)
0.003
0–9
45(33.3)
35(25.9)
28(20.7)
27(20.0)
10–24
26(21.7)
31(25.8)
34(28.3)
29(24.2)
25–49
16(17.0)
23(24.5)
27(28.7)
28(29.8)
50+
43(25.2)
28(16.4)
45(26.3)
55(32.2)
Salesto
wom
enas
%of
sales,n(%)
0–5
58(37.9)
30(19.6)
35(22.9)
30(19.6)
0.0008
6–10
25(21.7)
27(23.5)
29(25.2)
34(29.6)
11–24
25(19.1)
30(22.9)
41(31.3)
35(26.7)
25+
25(19.2)
31(23.9)
33(25.4)
41(31.5)
a Mantel–HaenszelChi-squ
ared
WINTEMUTE
REFERENCES
1. Truman JL, Rand MR. Criminal victimization, 2009. Washington, DC: Bureau of JusticeStatistics, 2010. NCJ 231327.
2. Murphy SL, Xu J, Kochanek KD. Deaths: preliminary data for 2010. Natl Vital Stat Rep.2012; 60(4): 1–69.
3. Bureau of Alcohol, Tobacco and Firearms. Following the gun: enforcing federal lawsagainst firearms traffickers. Washington, DC: Bureau of Alcohol, Tobacco and Firearms;2000.
4. Braga AA, Cook PJ, Kennedy DM, Moore MH. The illegal supply of firearms. In: TonryM, ed. Crime and justice: a review of research. Vol 29. Chicago: The University ofChicago Press, Chicago and London; 2002: 319–352.
5. Pierce GL, Braga AA, Hyatt RRJ, Koper CS. Characteristics and dynamics of illegalfirearms markets: implications for a supply-side enforcement strategy. Justice Q. 2004; 21(2): 391–422.
6. Koper CS. Federal legislation and gun markets: how much have recent reforms of thefederal firearms licensing system reduced criminal gun suppliers? Criminol Public Pol.2002; 1(2): 151–178.
7. Sorenson SB, Vittes K. Buying a handgun for someone else: firearm dealer willingness tosell. Inj Prev. 2003; 9(2): 147–150.
8. Webster D, Vernick J, Bulzacchelli M. Effects of a gun dealer's change in sales practices onthe supply of guns to criminals. J Urban Health. 2006; 83(5): 778–787.
9. Webster D, Bulzacchelli M, Zeoli A, Vernick J. Effects of undercover police stingsof gun dealers on the supply of new guns to criminals. Inj Prev. 2006; 12(4): 225–230.
10. Webster DW, Vernick JS, Bulzacchelli MT, Vittes KA. Temporal association betweenfederal gun laws and the diversion of guns to criminals in Milwaukee. J Urban Health.2012; 89(1): 87–97.
11. Wintemute GJ, Cook P, Wright MA. Risk factors among handgun retailers for frequentand disproportionate sales of guns used in violent and firearm related crimes. Inj Prev.2005; 11(6): 357–363.
12. Wintemute GJ. Disproportionate sales of crime guns among licensed handgun retailers inthe United States: a case-control study. Inj Prev. 2009; 15(5): 291–299.
13. Wintemute GJ. Firearm retailers' willingness to participate in an illegal gun purchase. JUrban Health. 2010; 87(5): 865–878.
14. Wintemute GJ. Inside gun shows: what goes on when everybody thinks nobody'swatching. Sacramento: Violence Prevention Research Program; 2009.
15. Wright MA, Wintemute GJ, Webster DW. Factors affecting a recently-purchasedhandgun's risk for use in crime under circumstances that suggest gun trafficking. JUrban Health. 2010; 87(3): 352–364.
16. Bureau of Alcohol, Tobacco, Firearms and Explosives. Downloadable lists of FederalFirearms Licensees (FFLs). Available at: http://www.atf.gov/about/foia/ffl-list.html.Accessed March 18, 2011.
17. Bureau of Alcohol, Tobacco, Firearms and Explosives. Permanent Brady permit chart.Available at: http://www.atf.gov/firearms/brady-law/permit-chart.html. Accessed December10, 2009.
18. Bowling M, Frandsen RJ, Lauver GA, Boutilier AD, Adams DB. Background checks forfirearms transfers, 2009 - statistical tables. Washington, DC: Bureau of Justice Statitics,2010. NCJ 231679.
19. SAS for Windows [computer program]. Version 9.1.3. Cary, NC: SAS Institute; 2003.20. Dillman D, Smith J. Internet, mail, and mixed-mode surveys: the tailored design method.
3rd ed. Hoboken: John Wiley & Sons, Inc; 2009.21. Bureau of Justice Statistics. Survey of state procedures related to firearm sales, midyear
2004. St. Louis, Missouri: Bureau of Justice Statistics, August, 2005. NCJ 209288.
CHARACTERISTICS OF FEDERALLY LICENSED FIREARMS RETAILERS
22. Dillman DA, Gertseva A, Mahon-Haft T. Achieving usability in establishment surveysthrough the application of visual design principles. J Off Stat. 2005; 21(2): 183–214.
23. Wintemute GJ, Wright MA. Swimming pool owners' opinions of strategies for preventionof drowning. Pediatrics. 1990; 85(1): 63–69.
24. Romero MP, Wintemute GJ, Vernick JS. Characteristics of a gun exchange program, andan assessment of potential benefits. Inj Prev. 1998; 4(3): 206–210.
25. Federal Bureau of Investigation. Total NICS background checks. Current version availableat: http://www.fbi.gov/about-us/cjis/nics/reports/04032012_1998_2012_monthly_yearly_totals.pdf. Accessed November, 2010.
26. The American Association for Public Opinion Research. Standard definitions: finaldispositions of case codes and outcome rates for surveys. 7th edition. 2011.
27. Bureau of Alcohol, Tobacco and Firearms. ATF snapshot 1999. Available at: http://www.atf.gov/publications/general/snapshots/atf-snapshot-1999.html. Accessed November10, 2010.
28. Koper CS. Purchase of multiple firearms as a risk factor for criminal gun use: implicationsfor gun policy and enforcement. Criminol Public Pol. 2005; 4(4): 749–778.
29. Bureau of Alcohol, Tobacco and Firearms. Commerce in firearms in the United States.Washington, DC: Bureau of Alcohol, Tobacco and Firearms; 2000.
30. Paxson MC, Dillman DA, Tarnai J, et al. Improving response to business mail surveys. In:Cox BG, Binder DA, Chinnappa BN, eds. Business survey methods. New York: JohnWiley & Sons, Inc; 1995: 303–315.
31. Kriauciunas A, Parmigiani A, Rivera-Santos M. Leaving our comfort zone: integratingestablished practices with unique adaptations to conduct survey-based strategy researchin nontraditional contexts. Strateg Manage J. 2011; 32(9): 994–1010.
32. Johnson TP, Wislar JS. Response rates and nonresponse errors in surveys. JAMA. 2012;307(17): 1805–1806.
33. Voigt LF, Koepsell TD, Daling JR. Characteristics of telephone survey respondentsaccording to willingness to participate. Am J Epidemiol. 2003; 157(1): 66–73.
34. Keane L. Firearm industry warns retailers of anti-gun survey. National Shooting SportsFoundation, 2011. Available at: http://www.nssfblog.com/firearms-industry-warns-retailers-of-anti-gun-survey/. Accessed June 18, 2011.
35. National Rifle Association. Warning—anti-gun survey of firearms dealers under way!National Rifle Association, 2011. Available at: http://www.nraila.org/legislation/federal-legislation/2011/6/warning-anti-gun-survey-of-firearms.aspx. Accessed June 30, 2011.
36. National Rifle Association Institute for Legislative Action. Warning—anti-gun survey offirearms dealers under way! [E-mail communication]. Personal communication toWintemute GJ, June 29, 2011.
37. Keane L. Retailers heeding industry's caution of anti-gun survey. National ShootingSports Foundation, 2011. Available at: http://www.nssfblog.com/retailers-heeding-industry’s-caution-of-anti-gun-survey/. Accessed July 13, 2011.
38. Keane L. Anti-gun survey continues to make the rounds; retailers heed industry's caution.National Shooting Sports Foundation, 2011. Available at: http://www.nssfblog.com/anti-gun-survey-continues-to-make-the-rounds-retailers-heed-industry%E2%80%99s-caution/.Accessed September 1, 2011.
39. Wintemute GJ. Association between firearm ownership, firearm-related risk and riskreduction behaviours and alcohol-related risk behaviours. Inj Prev. 2011; 17(6): 422–427.
40. Hassol A, Harrison H, Rodriguez B, Jarmon R, Frakt A. Survey completion rates andresource use at each step of a Dillman-style multi-modal survey. Presented at theAmerican Association of Public Opinion Research annual meeting, May 15-18, 2003,Nashville, TN, USA. Available at http://www.abtassociates.com/presentations/AAPOR-2.html. Accessed May 9, 2012.
WINTEMUTE