characteristics of construction-zone accidents
TRANSCRIPT
20 TRANSPORTATION RESEARCH RECORD 1230
Characteristics of Construction-Zone Accidents
J. w. HALL AND v. M. LORENZ
This study was undertaken to improve the safety of highway construction zones in New Mexico. The authors examined construclionzone accidents in New Mexico for a 3-year period. In contrast to the traditional technique, which relies solely on the accident record system, they utilized the locations and durations of construction activity on rural state highways. The record system was then used to identify accidents at these sites during the period of construction as well as during the identical period in the previous year. In comparison with the prior year, accident experience increased by 26 percent during construction. Contingency tables were used to compare the driver, roadway, and environmental characteristics of accidents before and during construction. At the 5 percent level of significance, the only parameter that differed between the two periods was the road surface condition, which was dry more often for accidents during construction. However, there was a moderate overrepresentation of accidents involving multiple vehicles, rearend collisions, large trucks, and the contributing factors of following too close and improper lane changing. The authors also identified deficiencies in the accident record system that result in a substantial understatement of crash experience in construction zones.
According to FHWA statistics, the total street and highway mileage nationwide increased by only 5 ,000 mi between 1980-1985. This increase represents less than 0.03 percent per year. During the previous 24 years, highway mileage increased by 0.47 percent per year (J). Rather clearly, activity has shifted from the construction of new facilities to the reconstruction of existing facilities. This has created an increased opportunity for conflict between road users and construction workers and equipment.
National statistics also indicate that accidents in construction areas are increasing. Highway fatalities in work zones jumped from 489 in 1982 to 680 in 1985 (2)-an alarming increase of 39 percent. According to FHWA, no other highwayrelated category experienced such a dramatic increase in fatalities during this period. Over half of the construction-zone fatalities occurred at night. Interstate highways, which are generally noted for their safety, accounted for 34 percent of the fatalities. Contractors are justifiably concerned, because an estimated 15 percent of the fatalities involve pedestrians, many of whom are construction workers. Studies of accidents before and during construction on selected projects have documented increases in nonfatal crashes of up to 100 percent on roadways that are under construction (3, 4). Most studies agree that site-specific factors, including traffic, geometry, and the environment, together with the accident r~te before construction, are of major importance in estimating accident
J. W. Hall, Department of Civil Engineering, University of New r.,1cAico, Albuquerque, t'!.r.,1 . 87131. \'. rv1. Lvrcnz, l'~cv.· r.,1cidCG State Highway and Transportation Department, P.O. Box 1149, Sante Fe, NM 87505.
rates during construction. Rear-end impacts are the predominant form of collision in work zones, accounting for 35 to 40 percent of the accidents. FHWA also reports that "alcohol involvement is about the same for work zone fatalities as for all fatalities" (5).
STUDY OBJECTIVES
This study was undertaken to improve the safety of highway construction zones in New Mexico. The specific objectives of this study were
• To establish the true extent of New Mexico's constructionzone accidents,
• To identify the characteristics of these accidents that differ from other accidents on comparable roadways, and
• To develop appropriate forms of remedial action.
The basic plan to achieve these objectives was to compare accidents on specific roadway sections during their construction with the accidents on the same sections in the previous year. The initial step in this process involved the use of New Mexico State Highway Department (NMSHD) records to determine the location and duration of major construction projects. Subsequently, the accident record system was used to identify those accidents occurring during the period of roadway construction and the accidents during the identical period of the previous year when the roadway section was not under construction.
It was recognized from the beginning that there would be some limitations with this study procedure. For example, many crashes, especially those occurring at night, are not reported by drivers or enforcement agencies. In addition, the accident report forms and associated computerized record systems do not provide the type of information necessary to properly analyze those crashes that are reported. And finally, a comparison of accidents occurring before construction with those occurring during construction cannot incorporate changes in traffic for two reasons: (a) New Mexico's traffic volume counting procedures specifically preclude the collection of volume data in construction zones, and (b) traffic counts are updated only once every 6 years.
NEW MEXICO CONSTRUCTION-ZONE ACCIDENTS
In New Mexico, construction-zone accidents are indicated on the Uniform Accident Report form under the Road Design

Hall and Lorenz
category. The six other choices under this category are One Way, Ramp, Freeway, Undeveloped , Alley, and Other. The Detail file of the computerized record system includes the road design features, as indicated by the investigating officer, using variables identified as RDES3 and RDES4. Because "Construction Zone" is the seventh item on the list of road design features, one of these two variables should be coded with the number 7 for a construction-zone accident. The traditional technique for identifying New Mexico's constructionzone accidents is to search for records in the Detail file coded with a 7 for either RDES3 or RDES4.
Application of this technique to New Mexico's 1977 accident data determined that 0.4 percent of the accidents occurred in construction zones. In the same process applied to 1981-1983 accident data it was found that these areas accounted for 1.0 percent of the state's accidents. It is not clear whether this apparent change is due to increases in construction activity, degradation of safety in these areas, improvements in accident reporting, or other factors. Several interesting characteristics of computerized analysis of the 1,503 constructionzone accidents in 1981-1983 are summarized below:
Characteristic
Occurred in Albuquerque Occurred at night Rear-end collision Principal contributing factor
Driver inattention Failure to yield None
Percent
64 27 36
16 13 11
Similar trends were observed for the period 1982-1985. Of the 2,022 construction-zone accidents reported during this 4-year period, 66 percent occurred in Albuquerque; of these , 84 percent were on local streets and the remainder were on the Interstate system through the city. The occurrence of nearly two-thirds of the state's construction-zone accidents in Albuquerque is suspicious. It is inconsistent with the city's share of all accidents in New Mexico (about 34 percent) and with Bernalillo County's share (6) of statewide vehicle miles of travel (26 percent). NMSHD records show that during 1982-1985, only 12 percent of the funds for highway construction were spent in Bernalillo County. Without discounting competing explanations, it is possible that officers in Albuquerque are more likely to record the construction parameter on the report form. Conversely, officers in other jurisdictions may be Jax in their completion of accident reports.
PILOT STUDY
In response to a suspicion that construction-zone accidents were not being properly documented, the New Mexico Traffic Safety Bureau supported a pilot study of these accidents in 1985. In this study, nine major construction zones in NMSHD District 5 that were active for a portion of 1981-1984 were examined in greater detail. Accidents occurring between the Jet and completion dates of these projects were identified from the record system. Of the 222 accidents in this data set, 13 (6 percent) indicated the presence of construction activity . More encouraging results were obtained by focusing on the period of May-October, when peak construction activity is expected. Of the 104 accidents on these construction sections during this 6-month period, 11 were reported as being in a construction zone. In other words, for 89 percent of the acci-
21
dents on sections of road that were under construction the presence of construction activity was not indicated. Although the pilot study did not yield definitive results, it strongly suggests that there is less-than-complete reporting of construction-zone accidents.
The research approach used in this study was similar to that employed in the pilot study. However, the limitations of the pilot study (including the small sample)-uncertainty concerning exact work dates and locations and inaccuracies in the accident record system-had to be overcome.
STUDY SITE SELECTION
The set of work zones of interest to this study consisted of major projects on rural sections of New Mexico's Interstate and Federal-Aid Primary (FAP) and Secondary (FAS) highway systems. The research was limited to those construction projects that began sometime between January 1983 and December 1985. The NMSHD provided a list of 355 projects let during the period October 1982 through December 1985. To provide a more manageable set of projects , this list was screened to eliminate minor projects using the following criteria:
• Projects costing less than $100,000, • Stockpiling, • Traffic signal installation or improvement, • Guardrail projects, • Projects occurring at "various locations," • Projects not on the Interstate or the FAP or FAS systems,
and • Projects not started by December 1985.
The rationale for these criteria are quite reasonable. Projects that primarily involve work off the roadway, such as stockpiling, should not influence highway operation. Projects that were not active during the study period or were not on rural state highways were outside the scope of this study. In addition, projects of relatively short duration as reflected by project type or cost were expected to provide little opportunity for accidents.
Application of these criteria reduced the number of candidate projects to 177. The next step in the analysis used the project list, the NMSHD roadway inventory, and other highway record systems to determine some basic information about the projects. Specifically, lists were prepared showing the following information for each project:
• Identification, route, and county, • Estimation of beginning and ending milelog, • Total cost and cost/mile, and • Estimation of average daily traffic volume (in vehicles
per day).
To achieve the objectives of the study , it was essential to have additional information concerning these construction projects . A primary need was a better description of the project location; often, the location given on the NMSHD project list was approximate or referenced to indeterminate points. A second critical parameter was the actual period of construction, including intermediate stop and restart dates. This information was obtained from the NMSHD district offices.

22
It was not possible to obtain information on all 177 projects because several were involved in litigation and the records were not readily available. Furthermore, the records for some projects indicated that the actual work took place on the roadside or at "various locations." For the reasons discussed previously, these projects were dropped from further study.
The resulting data base consisted of 168 major construction projects on rural state highways. The total contract value for these projects was nearly $400 million. The projects included 172 sections of highway with a total length of nearly 1,045 mi, including 348 mi on the Interstate. The average project length was 6.3 mi . The average project duration (from start to finish, including weekends and other nonwork periods) was 255 days. Based on the project length and duration and the average daily traffic estimates on these sections, the total travel at the construction sites was approximately 1,100 million vehicle-mi (mvm).
PROJECT DURATION
In practice, construction does not proceed continuously between the start and completion dates . Many projects involve the use of aggregate, which requires pit preparation and rock crusher installation. Depending on the other components of the project, there may be little work near the highway during this preliminary period. Similarly , toward the end of the project, the resurfacing and other work on the highway is typically completed several weeks (or sometimes months) before seeding and other tasks on the roadside are undertaken. In most cases, weekends, holidays, and days with adverse weather conditions (rain, snow, and wet or frozen ground) are not counted as work days. The effect of these adjustments varies with the climatic conditions in the area.
The effect of job suspension on traffic operations in the area is a function of the nature of the work and the duration of the stoppage. In general, the available roadway is opened to traffic during weekends and other short suspensions. However, advance construction warning signs and other traffic control devices that are relevant are left in place. Barricades, dropoffs, and hazards in the work zone may continue to exist during these periods. Procedures require that construction equipment and materials be stored a reasonable distance from the traveled way. In contrast, during the 2- to 3-month winter suspensions, the traffic control devices (excluding those at each end of the project) may be removed or covered and the roadway is normally returned to its standard condition. It is possible, of course, that an accident during the period of winter suspension could be related to construction. For the purposes of this analysis, it was assumed that the area remains a work zone only during the time when official work days are routinely counted, including intervening weekends and other short disruptions (such as holidays and occasional rain days).
ACCIDE)~TS DURING CONSTRUCTION AND COMPARISON PERIODS
The traditional method of using the New Mexico record system to identify construction-zone accidents shows that these areas account for approximately 1 percent of the state's acciu1:nl lulai. Since the darn base described above includes aii
TRANSPORTATION RESEARCH RECORD 1230
the major projects on rural state highways, an analysis was undertaken to check the validity of the traditional approach. The 1983-1985 Detail accident files were searched to identify accidents on rural state highways coded with a 7 for RDES3 or RDES4 (i.e., accidents formally identified by the record system as occurring in construction zones). This search identified 261 accidents; surprisingly, only 18 occurred at the sites and times of the 168 projects in the data set. There are several possible explanations for this situation:
• The accidents were on projects where construction started before 1983,
• The accidents were at the sites of some minor projects that were not included in this study,
• The actual work at the accident site was maintenance rather than construction,
• The locational information regarding the accident was incorrect, or
• The RDES3/RDES4 parameters were coded incorrectly.
It is possible that soine form of construction or maintenance was actually taking place on some of these sections. For example, during a 2-month period, six construction-zone accidents were reported on an 8-mi segment of F AP 32. During the remaining 34 months of the study period, no construction accidents were reported on this segment. These facts lead one to believe that some form of construction was taking place on this section, even though the NMSHD list of projects does not show any activity. Even with adjustments for these types of segments and six projects that started before January 1983, there remained 59 construction accidents that could not be explained by NMSHD construction records.
Hard-copy reports on these accidents were obtained from the NMSHD and sketches and narratives were reviewed to determine the actual accident characteristics. Nineteen occurred in minor construction zones or at locations where the narrative indicated the presence of maintenance activity (e.g., flagmen, barricades). With one exception , the remaining 40 accidents did not have the " Construction" box checked on the accident report form, and neither the narrative nor sketch indicated construction activity. Subsequent analysis indicated that all 40 errors occurred between May and August 1984. A reanalysis found that 46 percent of the initial 261 accidents occurred during this 4-month period. For example, all six of the FAP 32 accidents mentioned above occurred in May or June 1984. Although some of the 120 accidents in the summer of 1984 actually occurred in construction zones, there was clearly a massive accident data coding problem during this period that distorts the true extent of these accidents. Although the traditional technique of analyzing accidents coded as "Construction Zone" would therefore be grossly in error, the actual data base and analysis techniques employed in this study avoid this pitfall.
PRELIMINARY ANALYSIS OF ACCIDENTS
The next phase of the study sought to combine the construction project data with accident record information. This is a complicated task because the two data bases rely on different reference systems-accident data are coded by route and milelog, whereas the construction projects are referenced to
Hall and Lorenz
intersections, political boundaries, or other physical points along the highway. With considerable effort, including a review of the project managers' diaries, it was possible to establish more precise milelogs for the construction project limits. These data were incorporated into a computer program that searched the files and selected accidents meeting the following criteria:
• Accidents occurring between the beginning and ending milelogs, and
• Accidents occurring between the start and completion of construction but not during winter or other suspensions.
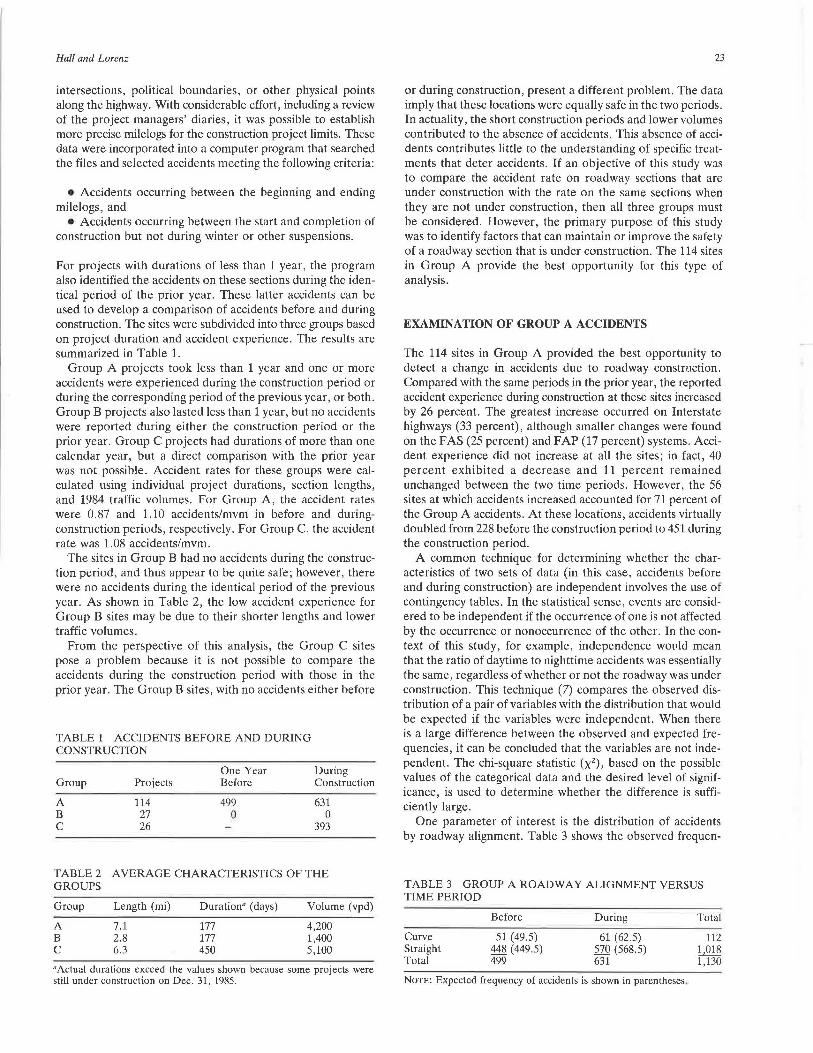
For projects with durations of less than 1 year, the program also identified the accidents on these sections during the identical period of the prior year. These latter accidents can be used to develop a comparison of accidents before and during construction. The sites were subdivided into three groups based on project duration and accident experience. The results are summarized in Table 1.
Group A projects took less than 1 year and one or more accidents were experienced during the construction period or during the corresponding period of the previous year, or both. Group B projects also lasted less than 1 year, but no accidents were reported during either the construction period or the prior year. Group C projects had durations of more than one calendar year, but a direct comparison with the prior year was not possible. Accident rates for these groups were calculated using individual project durations, section lengths, and 1984 traffic volumes. For Group A, the accident rates were 0.87 and 1.10 accidents/mvm in before and duringconstruction periods, respectively. For Group C, the accident rate was 1.08 accidents/mvm.
The sites in Group B had no accidents during the construction period, and thus appear to be quite safe; however, there were no accidents during the identical period of the previous year. As shown in Table 2, the low accident experience for Group B sites may be due to their shorter lengths and lower traffic volumes.
From the perspective of this analysis, the Group C sites pose a problem because it is not possible to compare the accidents during the construction period with those in the prior year. The Group B sites, with no accidents either before
TABLE 1 ACCIDENTS BEFORE AND DURING CONSTRUCTION
One Year During Group Projects Before Construction
A 114 499 631 B 27 0 0 c 26 393
TABLE 2 AVERAGE CHARACTERISTICS OF THE GROUPS
Group
A B c
Length (mi)
7.1 2.8 6.3
Duration" (days)
177 177 450
Volume (vpd)
4,200 1,400 5,100
"Actual durations exceed the values shown because some projects were still under construction on Dec. 31, 1985.
23
or during construction, present a different problem. The data imply that these locations were equally safe in the two periods. In actuality, the short construction periods and lower volumes contributed to the absence of accidents. This absence of accidents contributes little to the understanding of specific treatments that deter accidents. If an objective of this study was to compare the accident rate on roadway sections that are under construction with the rate on the same sections when they are not under construction, then all three groups must be considered. However, the primary purpose of this study was to identify factors that can maintain or improve the safety of a roadway section that is under construction. The 114 sites in Group A provide the best opportunity for this type of analysis.
EXAMINATION OF GROUP A ACCIDENTS
The 114 sites in Group A provided the best opportunity to detect a change in accidents due to roadway construction. Compared with the same periods in the prior year, the reported accident experience during construction at these sites increased by 26 percent. The greatest increase occurred on Interstate highways (33 percent), although smaller changes were found on the FAS (25 percent) and FAP (17 percent) systems. Accident experience did not increase at all the sites; in fact, 40 percent exhibited a decrease and 11 percent remained unchanged between the two time periods. However, the 56 sites at which accidents increased accounted for 71 percent of the Group A accidents. At these locations, accidents virtually doubled from 228 before the construction period to 451 during the construction period.
A common technique for determining whether the characteristics of two sets of data (in this case, accidents before and during construction) are independent involves the use of contingency tables. In the statistical sense, events are considered to be independent if the occurrence of one is not affected by the occurrence or nonoccurrence of the other. In the context of this study, for example, independence would mean that the ratio of daytime to nighttime accidents was essentially the same, regardless of whether or not the roadway was under construction. This technique (7) compares the observed distribution of a pair of variables with the distribution that would be expected if the variables were independent. When there is a large difference between the observed and expected frequencies, it can be concluded that the variables are not independent. The chi-square statistic (x2), based on the possible values of the categorical data and the desired level of significance, is used to determine whether the difference is sufficiently large.
One parameter of interest is the distribution of accidents by roadway alignment. Table 3 shows the observed frequen-
TABLE 3 GROUP A ROADWAY ALIGNMENT VERSUS TIME PERIOD
Curve Straight Total
Before
51 (49.5) 448 (449.5) 499
During
61 (62.5) 570 (568.5) 631
NOTE: Expected frequency of accidents is shown in parentheses.
Total
112 1,018 1,130

24
cies ( O;) of Group A accidents versus roadway alignment. The expected frequencies (E;), given by the product of the row and column totals divided by the table total, are shown in parentheses. For example, the expected number of accidents on curves during construction is
£curve, dm;ng = (631) * (112)/1130 = 62.5
As shown in Table 3, the differences between the observed and expected values are rather small. To determine whether the differences are significant, the chi-square statistic is calculated as follows:
The calculated value of the x2-statistic is less than the tabulated value of this statistic (3.84) at the 5 percent level of significance. In practical terms, the difference between observed and expected frequencies is not large, and it is concluded that roadway alignment is independent of the time period (before and during). Alternatively, one can state that the proportion (not the number) of accidents on curves does not change while roadways are under construction.
The technique was applied to other accident parameters. The characteristics evaluated were primarily those of interest to the engineer-that is, factors that might be modified with engineering countermeasures. In addition to roadway alignment, they included severity, contributing factors, weather, light condition, and manner of collision. With the exception of contributing factors, these parameters are objective, and not dependent on the investigating officer's judgment. Contingency tables for these characteristics are shown in Tables 4 through 15.
Only two parameters differ between the before and duringconstruction periods at the 5 percent level of significance. It was found that construction-zone accidents were overrepresented during clear weather and underrepresented during adverse weather conditions. Similarly, the road condition was dry more often than expected and snowy or icy less often than expected during construction. Although construction is obviously more likely to be carried out during good weather, the crash comparisons were made between identical periods of the year, and therefore the findings are unexpected.
TABLE 4 GROUP A LIGHT CONDITION VERSUS TIME PERIOD
Daytime Dark Total
Before
316 183 499
During
399 232 631
NoTE: x~.1c = 0.001, no significant difference.
Total
715 415
1,130
TABLE 5 GROUP A ROADWAY GRADE VERSUS TIME PERIOD
Before During Total
Level 339 433 772 On grade 160 198 358 Totai 499 631 l,UU
·NOTE: x~.1c = 0.060, no significant difference.
TRANSPORTATION RESEARCH RECORD 1230
TABLE 6 GROUP A DAY OF WEEK VERSUS TIME PERIOD
Weekday Weekend Total
Before
340 159 499
During
442 189 631
Norn: x~.1c = 0.478, no significant difference.
Total
782 348
1,130
TABLE 7 GROUP A NUMBER OF VEHICLES VERSUS TIME PERIOD
Single vehicle Multiple vehicles Total
Before
314 185 499
Norn: x~, 1c = 2.305, no significant difference.
During
369 262 631
TABLE 8 GROUP A HEAVY-TRUCK INVOLVEMENT VERSUS TIME PERIOD
Total
683 447
1,130
Before During Total
No trucks Trucks Total
403 91
494
499 131 630
NoTE: x~.1c = 0.983, no significant difference. "Data are missing for six accidents.
TABLE 9 GROUP A PEDESTRIAN INVOLVEMENT VERSUS TIME PERIOD
No pedestrians Pedestrians Total
Before
206 4
210
During
485 14
499
Norn: x~, 1c = 0.485, no significant difference. "Data are missing for 421 accidents.
TABLE 10 GROUP A ACCIDENT SEVERITY VERSUS TIME PERIOD
Defore During
Fatal 15 20 Injury 189 226 PDO 295 385 Total 499 631
902 222
1,124"
Total
691 18
709"
Total
35 415 680
1,130
NOTE: x~, 1c = 0.512, no significant difference. PDO = property damage only.
TABLE 11 GROUP A TIME OF DAY VERSUS TIME PERIOD
12:00 midnight to 6:00 a.m. 6:00 a.m. to 12:00 noon 12:00 noon to 6:00 p.m. 6:00 p.m. to 12:00 midnight l'otal
Before
106 137 150 106 4\1\1
Norn: x~"'' = 1.413, no significant difference .
During
150 174 186 121 631
Total
256 311 336 227
l,UU

Hall and Lorenz
TABLE 12 GROUP A WEATHER CONDITION VERSUS TIME PERIOD
Before During
Clear 402 544 Raining 31 36 Snowing 50 27 Other 16 24 Total 499 631
NOTE: X~a1c = 14.94, significant difference.
TABLE 13 GROUP A ROAD SURFACE CONDITION VERSUS TIME PERIOD
Before During
Dry 389 531 Wet 35 46 Snow or ice 72 44 Other 3 10 Total 499 631
NOTE: X~atc = 18. 78, significant difference.
TABLE 14 MANNER OF COLLISION VERSUS TIME PERIOD
Before During
Ran off road 137 158 Fixed object 83 114 Rear-end 47 87 Sideswipe 41 43 Overturn 20 21 Other 171 208 Total 499 631
NOTE: X~a1c = 6.669, no significant difference.
TABLE 15 GROUP A PRINCIPAL CONTRIBUTING FACTOR VERSUS TIME PERIOD
Before During
Inattention 111 134 Speed 92 112 Alcohol 63 82 None 66 67 Following closely 20 44 Lane change 8 21 Other 139 171 Total 499 631
NoTE: X~a1c = 9.458, no significant difference.
Total
946 67 77 40
1,130
Total
920 81
116 13
1,130
Total
295 197 134 84 41
379 1,130
Total
245 204 145 133 64 29
310 1,130
The absence of significant differences for the other parameters is surprising. For example, the accident distributions by time of day and by light condition are virtually the same in the before and during-construction periods. Despite the frequent use of detours in construction areas, the relative proportion of accidents on curves remained unchanged. Likewise, accident severity did not change significantly; in fact, the proportion of accidents resulting in a fatality or an injury dropped from 0.41 in the prior year to 0.39 during construction. Fatalities occurred in 3.0 percent of the accidents before construction and 3.2 percent of the accidents during construction. Because of the small numbers involved, this difference is not significant. The relative proportion of in-state and out-
25
of-state motorists was the same in both periods. Pedestrian accidents-9 before construction and 14 during-were few in number, and the moderate increase is certainly less than anticipated considering the presence of workers in the construction zones.
Several parameters differ between the before and duringconstruction periods at the 15 to 25 percent level of significance. Although traditional analyses might properly discount conclusions at these levels of significance, the aforementioned problems with the accident data suggest that these parameters deserve more attention. Two parameters that fall into this category are the manner of collision and the principal contributing factor.
A contingency table analysis using the data in Table 14 shows that the manner of collision is independent of construction activity. A more detailed examination finds that the relative proportion of ran-off-road, sideswipe, overturn, and other accidents decreased by 1 to 2 percent in the duringconstruction period, whereas the proportion of fixed-object and rear-end collisions increased. In fact, the proportion of rear-end collisions increased from 9.4 percent before construction to 13.8 percent during construction. A test of proportions shows that this particular increase is significant at the 2 percent level. In other words, the overall distribution of crash type is similar in the before and during-construction periods, but the specific category of rear-end collisions shows a significant increase. Likewise, the data in Table 15 show no significant difference in the overall distribution of contributing factors between the two periods. Although the total number of accidents increased by 26 percent, the proportion of accidents for most contributing factors changed by less than 1 percent between the before and during-construction periods. However, there was a decrease in the proportion of accidents for which the investigating officer cited no contributing factor. Of greater importance, the proportion of accidents in which following too close was the principal contributing factor jumped from 4 to 7 percent; a test of proportions finds that this particular increase is significant.
Because of the lack of reliable traffic volume data (for reasons previously discussed), it is not possible to calculate and compare the true accident rates before and during construction. Nevertheless, one might properly inquire whether the apparent increase in traffic accidents during construction was actually due to a growth in travel. In the absence of volume data, it is not possible to answer this question with certainty. It is informative, however, to examine the overall crash experience on the state's rural roads. Between 1982 and 1985, the number of accidents on New Mexico's rural Interstates and FAP and FAS routes decreased at annual rates of 4.5 percent, 6.7 percent, and 2.0 percent, respectively. Therefore these general trend statistics suggest that irrespective of traffic volume changes, overall accidents were declining during these years, but accidents were increasing on sections of roadway that were under construction.
Accident rates on the basis of reported 1984 traffic volumes for the different highway systems represented in the Group A sites are as follows:
Accidents per Mvm
System Before Construction During Construction
Interstate 0.67 0.89 Federal-aid primary 1.12 1.32 Federal-aid secondary 2.18 2.67

26
For all three systems, the accident rates in the before period are similar to the rates on rural sections of these highway systems. If the Group B sites, with no accidents during either of the two periods, were included, the accident rates would drop slightly.
It can be stated with a high degree of certainty that the 631 accidents assigned to Group A during construction actually occurred within the boundaries of the project while construction activity was taking place. However, it is possible that construction was not in progress at the exact time and location of a particular accident. For example, 189 of the accidents occurred on weekends. Although the contractor may not have been working on weekends, many of the hazards inherent in construction zones remain during these periods. In addition, an entire project is not under construction on a particular day. Nevertheless, it is surprising that in the computerized record system, only 46 of these 631 accidents indicated the presence of construction activity. In other words, 93 percent of the accidents that are known to be in a construction zone are not reflected as such in the computer files. This is another indication of the extent to which the accident record system seriously and systematically underestimates the incidence of these zone accidents.
FHW A CONSTRUCTION FILES
The New Mexico division of FHWA maintains records of the inspections that FHW A engineers have conducted at federalaid construction projects. Reports based on these visits provide a good description of project characteristics, including an identification of deficiencies. FHWA made these records available for this research study. Unfortunately, records in the computerized format were not available before 1985, so many of the projects considered in this research were not contained in the files. The inspections also included a significant number of projects in urban areas, which were excluded from this study. Nevertheless, the files provided some interesting insight into the types of deficiencies observed during spot inspections.
The inspection files and the associated computer records may identify one or more of the 225 "findings," including problems with earthwork, pavements, structures, labor practice, and other items. Despite the diversity of possible "findings," problems related to the proper application of traffic control devices are cited more frequently than any other category. There are several possible explanations for this situation:
• Standards for traffic control are well established; deviation from formal traffic control plans or from good practice may be easily observed by FHWA engineers;
• Standards for traffic control are normally applicable over the entire length and for the complete duration of the project, thus affording more opportunities for deficiencies;
• Periodic inspections may more readily detect the deteriorated quality of signs and markings, which are not obvious to those working on the project daily;
• Possible "findings" are often subjective, although most of those dealing with traffic control devices and related safety features are more objective; an<l
TRANSPORTATION RESEARCH RECORD 1230
• FHW A engineers are told to look more closely at traffic through construction zones.
There was no obvious correlation between the inspection results and the observed accident experience at the sites. This conclusion is not unexpected because the inspections are periodic and the time periods covered by FHW A files and the accident data differed. Nevertheless, it appears that the inspections serve a useful purpose by heightening the awareness of field personnel to proper safety techniques. Over a longer period, the inspections may assist in identifying contractors who habitually violate traffic control device standards or types of projects that are more likely to have deficiencies.
CONCLUSIONS
When this study was initiated, the authors envisioned that the accident analysis would highlight those characteristics of construction-zone crashes that could be addressed with the application of engineering countermeasures. As previously discussed, the number and rate of accidents increased during construction, but the increase appears to be uniform for various accident characteristics. It is therefore not possible to recommend safety measures to counteract a specific set of accident types that increase disproportionately during construction.
The authors have found that the frequency of accidents in construction zones is substantially greater than indicated by the accident record system. The existing records do not provide a definitive answer to the role of engineering in the occurrence of construction-zone accidents.
In comparison with the identical period in the prior year, accident experience in construction areas increased 33 percent on the rural Interstate system and 17 percent on the rural FAP and 23 percent on the rural FAS systems. The data clearly indicate that adverse weather conditions are not responsible for the increases. The data also suggest that certain accident characteristics may be overrepresented in construction-zone accidents. These parameters include accidents involving multiple vehicles, rear-end collisions, large trucks, and the contributing factors of following too close and improper lane changing. On the other hand, the relative proportions of accidents resulting in injury or occurring at night remained virtually unchanged.
Although the accident characteristics differ less than expected, they do suggest some opportunities for remedial action. For example, the proportion of rear-end collisions increased from 9 percent in the before-construction period to 14 percent during construction. This collision pattern may be partially corrected by the proper application of traffic control devices and use of flaggers and by techniques to enhance the visibility of work sites. The data collection effort required to assemble the appropriate information prompts a few conclusions regarding the adequacy of the record systems. Although shortcomings of the accident reporting and record systems have been discussed before (8), the inaccurate recording and the miscoding of construction accident data are more serious than previously considered.
The FHWA and NMSHD inspections, as well as some engiuee1s, Uia1ies, iuJicale lhat i111µ1uµe1 l1affic cuut1oi i~ the i11o~t

Hall and Lorenz
prevalent problem in construction areas. A need exists to heighten the awareness of both state employees and contractors' personnel regarding the importance of installing, maintaining, and monitoring the adequacy of these devices. A critique of traffic control deficiencies could be prepared; however, the implied criticism is potentially counterproductive. A more positive educational effort could produce better results. The traditional emphasis in courses on construction-zone traffic control has been on the use of proper devices along with some examples of inferior treatments (9). Based on this study, more attention should be devoted to the preparation of traffic control plans, modifications to plans, inspections, and recordkeeping.
ACKNOWLEDGMENTS
This study was funded by the NMSHD and FHW A. Access to the accident records was provided by the University of New Mexico Division of Government Research.
REFERENCES
1. Highway Statistics. FHWA, U.S. Department of Transportation, various years.
27
2. Work Zone Safety Arouses Concern. Engineering News Record, Mar. 12, 1987.
3. M. Faulkner and S. Richards. A Review of Work Zone afety Progmms in Selected Stales. Report FHWAITX· 2/42+263-5. Texas Transportation Institute, Texas A&M University, College Station, 1982.
4. H. McGee e1 al. Construction and Maintenance Zone . ln ynthesis of Safety Research Relaied to Traffic Control and Roadway Elemellls, Chapter 10. Report FH.WA-TS-82-233. FHWA, U.S. Department of Transportation , 1982.
5. R. Morgan. Fatalities Increase Spurs FHWA Work Zone Efforts. Roads and Bridges, Jan. 1987.
6. New Mexico Traffic Survey. Planning Bureau, New Mexico State Highway Department, Santa Fe, 1982.
7. F. Council et al. Accident Research Manual. Report FHWA/RD80/ 16. FHWA, U.S. Department of Transportation, 1980.
8. J. Hall. .Deficiencies in Accident Record Systems. Transportation Pla1111i11g and Technology, Dec. 1984.
9. J. Hall and J. Brogan. Construction and Maintenance Area Traffic ontrol. Univer ily of New Mexico. Short Course Notes . Report
FHWA-NMDOT-84-3. FHWA, U.S. Department of Transportation, 1984.
Publication of this paper sponsored by Committee on Traffic Safety in Maintenance and Construction Operations.