characteristics of career academies in 12 florida school...
TRANSCRIPT

I S S U E S & A N S W E R S R E L 2 0 1 1 – N o . 1 0 6
At SERVE Center UNC, Greensboro
Characteristics of career academies in 12 Florida school districts
I S S U E S&ANSWERS R E L 2 0 11 – N o . 1 0 6
At SERVE Center UNC, Greensboro
Characteristics of career academiesin 12 Florida school districts
March 2011
Prepared by
Angela EstacionAED
Stephanie D’SouzaAED
Robert BozickAED

WA
OR
ID
MT
NV
CA
UT
AZ
WY
ND
SD
NE
KS CO
NM
TX
OK
CO
AR
LA
MS AL GA
SC
NC
VA WV
KY
TN
PA
NY
FL
AK
MN
WI
IA
IL IN
MI
OH
VT
NH
ME
MO
At SERVE Center UNC, Greensboro
Issues & Answers is an ongoing series of reports from short-term Fast Response Projects conducted by the regional educational laboratories on current education issues of importance at local, state, and regional levels. Fast Response Project topics change to reflect new issues, as identified through lab outreach and requests for assistance from policymakers and educators at state and local levels and from communities, businesses, parents, families, and youth. All Issues & Answers reports meet Institute of Education Sciences standards for scientifically valid research.
March 2011
This report was prepared for the Institute of Education Sciences (IES) under Contract ED-06-CO-0028 by Regional Educational Laboratory Southeast administered by SERVE Center at the University of North Carolina at Greensboro. The content of the publication does not necessarily reflect the views or policies of IES or the U.S. Department of Education nor does mention of trade names, commercial products, or organizations imply endorsement by the U.S. Government.
This report is in the public domain. While permission to reprint this publication is not necessary, it should be cited as:
Estacion, A., D’Souza, S., and Bozick, R. (2011). Characteristics of career academies in 12 Florida school districts (Issues & Answers Report, REL 2011–No. 106). Washington, DC: U.S. Department of Education, Institute of Education Sciences, National Center for Education Evaluation and Regional Assistance, Regional Educational Laboratory Southeast. Retrieved from http://ies.ed.gov/ncee/edlabs.
This report is available on the regional educational laboratory website at http://ies.ed.gov/ncee/edlabs.

Summary REL 2011–No. 106
Characteristics of career academies in 12 Florida school districts
This report describes career academies in 12 Florida school districts in the 2006/07 school year. It examines their structure and career clusters, the high schools of-fering them, and the students enrolled.
Career academies are a leading high school reform designed to engage students and better prepare them for college and the workplace. They offer small, more personalized learning environments; integrated academic and tech-nical courses organized around career themes; and work-based learning opportunities.
This report responds to a Florida Depart-ment of Education request for information on Florida career academies prior to enactment of the 2007 Career and Professional Education Act, requiring each school district to open at least one career academy (Florida Legislature 2007a) and establishing benchmarks and pro-cedures to support high-quality career acad-emies (Florida Legislature 2007b).
The Florida Department of Education chose for this study the 12 school districts most consistently reporting career academy data. Student data were drawn from files provided by the state’s PK–20 Education Data Ware-house (Florida Department of Education 2007a). School data were drawn from the state’s Master School Identification file (Florida
Department of Education 2007b) and the U.S. Department of Education’s Common Core of Data (U.S Department of Education 2007).
This study is one of the first to investigate both career academy structure and clusters using multiple data sources. It provides state education leaders and other stakeholders with baseline trends and patterns to use in track-ing and evaluating Florida career academy development.
This study is driven by three research ques-tions on career academies in the 12 Florida school districts in 2006/07:
• How many career academies were there, and of what types?
• What were the characteristics of high schools offering career academies?
• How many students were enrolled in career academies, and what were their characteristics?
The findings indicate that:
• Seventy-nine percent of high schools (145 of 183) offered career academies in 2006/07, for a total of 596 career academies.

ii Summary
• Of the 145 high schools offering career academies, 70 (48 percent) used a school-withina-school structure (career academies embedded in an existing high school), and 45 (31 percent) used a wall-to-wall career academy structure (an entire school organized around multiple career academies). Information on school structure was missing for the remaining 30 high schools (21 percent).
• Most schools with wall-to-wall career academies (40 of 45; 89 percent) were in the Miami-Dade district.
• In school-within-a-school career academy structures, the most common career cluster (the field around which a career academy curriculum is organized) was hospitality and tourism (27 of 230; 12 percent). In wall-to-wall structures, the most common was arts, audiovisual technology, and communication (38 of 266; 14 percent).
• Schools configured as wall-to-wall career academies had larger average enrollment (2,356) than did schools organized as school-within-a-school career academies (1,968).
• On average, high schools offering wall-to-wall career academies had higher rates of students eligible for free or reduced-price lunch (42 percent compared with
37 percent), of racial/ethnic minority students (84 percent and 53 percent), and of students receiving special education services (25 percent and 13 percent) than their school-within-a-school counterparts.
• Of the 332,010 students enrolled across the 12 school districts, 49,795 (15 percent) were enrolled in a career academy.
• More girls (54 percent) than boys (46 percent) enrolled in career academies.
• More students were enrolled in school-within-a-school career academies (25,587; 8 percent) than in wall-to-wall career academies (20,818; 6 percent).
• A higher percentage of students enrolled in wall-to-wall career academies were Hispanic (45 percent compared with 16 percent) and received special education services (25 percent compared with 13 percent) than their school-within-aschool counterparts.
• The transportation, distribution, and logistics cluster had the smallest percentage of female students (8 percent), and education and training had the largest (84 percent).
March 2011
Table of conTenTs iii
Table of conTenTs
Why this study? 1Reviewing the literature 1Career academy legislation: before and after 2Study focus 3
Findings 5How many career academies were there, and of what types? 5What were the characteristics of high schools offering career academies? 9How many students were enrolled in career academies, and what were their characteristics? 11Florida Comprehensive Assessment Test scores and career academy structure 13
Study limitations and need for additional research 13
Appendix A Methods 15
Appendix B Student career academy enrollment by student and school characteristics 19
Appendix C Analyzing grade 8 Florida Comprehensive Assessment Test data 21
Notes 22
References 23
Boxes
1 Three basic components of career academies 2
2 Key terms 3
3 Data sources and methods 4
Figures
B1 Student career academy enrollment in 12 sample Florida school districts, by gender and career academy cluster, 2006/07 (percent) 19
B2 Student career academy enrollment in 12 sample Florida school districts, by free or reduced-price lunch eligibility and career academy cluster, 2006/07 (percent) 19
B3 Student career academy enrollment in 12 sample Florida school districts, by English language learner status and career academy cluster, 2006/07 (percent) 20
B4 Student career academy enrollment in 12 sample Florida school districts, by special education status and career academy cluster, 2006/07 (percent) 20
Tables
1 High schools with career academies by 12 sample Florida school districts, 2006/07 5
2 Structure of high schools with career academies by 12 sample Florida school districts, 2006/07 6
3 Career academies by cluster and 12 sample Florida school districts, 2006/07 (number, unless otherwise indicated) 7

iv Table of conTenTS
4 Career academy cluster by career academy structure in 12 sample Florida school districts, 2006/07 8
5 Mean high school characteristics by career academy structure in 12 sample Florida school districts, 2006/07 (percent, unless otherwise indicated) 9
6 Mean high school characteristics in 12 sample Florida school districts, by career academy cluster, 2006/07 (percent, unless otherwise indicated) 10
7 Career academy enrollment in 12 sample Florida school districts, by career academy structure and student characteristics, 2006/07 (percent, unless otherwise indicated) 11
8 Race/ethnicity of student enrollment by career academy cluster in 12 sample Florida school districts, 2006/07 (percent) 12
A1 High schools and student enrollment by 12 sample Florida school districts, 2006/07 15
A2 Data sources and variables 16
A3 Career academy clusters and codes for the career academy participant data element 17
C1 Math and reading proficiency rate in 12 sample Florida school districts, by career academy structure, 2006/07 21

1 Why ThiS STudy?
This report describes career academies in 12 Florida school districts in the 2006/07 school year. It examines their structure and career clusters, the high schools offering them, and the students enrolled.
Why ThIs sTudy?
Career academies, in use for nearly 40 years (Kemple and Willner 2008), are a leading high school reform designed to engage students and better prepare them for college and the workplace.1 Initially intended to provide vocational training to students at risk of dropping out of school, they have since become a comprehensive high school strategy (Stern, Dayton, and Raby 2000), offering small, more personalized learning environments; integrated academic and technical courses organized around career themes; and work-based learning opportunities.
This report responds to a Florida Department of Education request for information on the status of Florida career academies prior to enactment of the 2007 Career and Professional Education (CAPE)
Act, requiring each school district to open at least one career academy (Florida Legislature 2007a) and establishing benchmarks and procedures to support high-quality career academies (Florida Legislature 2007b).
The report focuses on a nonrandom sample of 12 districts using student data provided by the Florida Department of Education’s PK–20 Education Data Warehouse (Florida Department of Education 2007a) and school data from the state’s Master School Identification file (Florida Department of Education 2007b) and the U.S. Department of Education’s Common Core of Data (U.S Department of Education 2007) for 2006/07—the first school year for which data have been systematically collected and recorded for career academy structures (how a career academy is implemented) and clusters (the field around which a career academy curriculum is organized; Florida Department of Education 2006b).
Though career academies vary across schools and districts, they share three basic components: a small learning community, curricula organized by career cluster, and partnerships with employers, the community, and local postsecondary institutions (box 1; Brand 2009; Stern, Dayton, and Raby 2000). These components, identified and codified by national organizations that support career academies across the country (the National Career Academy Coalition, the National Academy Foundation, and the Career Academy Support Network), have also been adopted by Florida to standardize data collection and reporting.
Reviewing the literature
Expansion of career academies can be attributed to their overlap with two other high school reform efforts: the college and career movement, which emphasizes academic rigor and practical experience, and the small learning community movement, which encourages supportive relationships in smaller educational settings to improve teaching and learning conditions (Stern, Dayton, and Raby 2000).

2 characTeriSTicS of career academieS in 12 florida School diSTricTS
box 1
Three basic components of career academies
Career academies are small learning communities. Academies comprise groups of students who take several classes together for at least two years. Courses are taught by teams of teachers from academic and career and technical education disciplines
who coordinate course content and instructional approaches.
Career academies follow a college preparatory curriculum, organized around a career cluster. Designed to expose students to the skills and knowledge needed for their career cluster, coursework is structured to help students understand the link between academics and work.
Career academies are built around partnerships with employers, the community, and local postsecondary institutions. Drawing on their collec-tive resources, these partners provide students with workplace experience, connect them with adult mentors, and support the acquisition of the skills and training needed to succeed in college.
Source: Florida Office of Program Policy Analysis and Government Accountability 2006.
Numerous career academy studies report posi-tive student outcomes, including early evalua-tions in California and Pennsylvania (Reller 1984; Stern, Raby, and Dayton 1992; Raby 1995; Dayton, Weisberg, and Stern 1989; Stern et al. 1989) and an MDRC random-assignment study in nine sites across the country (Kemple and Willner 2008). The MDRC study, offering the most conclusive results, shows that positive labor market outcomes for ca-reer academy enrollees can be attributed to career academy participation rather than to unmeasured characteristics of enrolled students. The MDRC study also shows how career academy structure contributes to career academy success. For ex-ample, a small learning environment allows for the positive relationships necessary to successfully implement other career academy components.
Other research suggests that career academies with a strong school-within-a-school structure achieve positive results (Hanser and Stasz 1999; Maxwell 2001; Elliot and Hanser 2002; Linnehan 1996). These findings motivated comprehensive high school reform models and prompted large urban school districts to adopt a wall-to-wall structure, dividing entire schools into career academies. Less is known about the wall-to-wall approach, and it has not been compared with the traditional school-within-a-school approach of embedding a single career acad-emy within a larger high school. But several studies suggest more challenges for wall-to-wall academies, including a weaker sense of community, scheduling complications, lack of common planning time, and
the potential for de facto tracking (Kemple 2004; Allen, Almeida, and Steinberg 2001).
Research and practice indicate that career acad-emy clusters are intended to align with local labor market demands (Bradby et al. 2007; Kemple and Willner 2008). The process of identifying clusters, as exemplified by Florida, Nebraska, and South Carolina, entails assessing student interests, identifying growing local and global industries, and collaborating with area business leaders, workforce boards, and other stakeholders (States’ Career Clusters Initiative n.d.; Florida Depart-ment of Education 2006a). Identifying the clusters appropriate for the local economy is important in ensuring that students can get internships and find work once they graduate (Brand 2009; see box 2 for definitions of structure and cluster).
Career academy legislation: before and after
Between 1993 and 2001, Florida appropriated funds to develop new career academies (Florida Department of Education 2006a). In 2005 Florida launched the SUCCEED Florida Career Paths program, providing $6 million for public schools to develop and redesign existing career academies (Florida Office of Program Policy Analysis and Government Accountability 2006).2 This funding continued into 2006, and in 2007 Florida enacted the CAPE Act to increase the number and qual-ity of career academies across the state (Florida Office of Program Policy Analysis and Government

3 Why ThiS STudy?
box 2
Key terms
Career academy structure refers to how a career academy is imple-mented. The structure is either school-within-a-school or wall-to-wall. School-within-a-school career academies are part of an existing high school and provide courses in a thematic cluster. Wall-to-wall career academies structure the entire school around multiple career academies and enroll all students in the school.
Career academy cluster is the field iaround which a career academy’s curriculum is organized. Florida’s 16 career clusters (see appendix A), following the U.S. Department of Education taxonomy, are: agriculture, food, and natural resources; architec-ture and construction; arts, audio-visual technology, and communica-tions; business, management, and administration; education and train-ing; finance; government and public administration; health science; hos-pitality and tourism; human services;
nformation technology; law, public safety, and security; manufacturing; marketing, sales, and service; science, technology, engineering, and math-ematics; and transportation, distribution, and logistics. This report also presents an additional category: “no selected career cluster.”
Note: In 2009/10, “energy” was added as a 17th cluster in Florida (Florida Department of Education n.d.).
Source: Florida Department of Education 2006b.
Accountability 2008). The CAPE Act requires that each school district open at least one career academy. It established benchmarks and procedures for schools and districts developing new career acad-emies and designing curricula and mandates that core academic courses in career academies meet state curriculum standards by providing both rigorous academic and occupation-specific training.3
Before the CAPE Act was passed, there were no formal state-sanctioned career academy criteria in Florida, so career academies varied greatly in structure, organization, curricula, and standards (Florida Office of Program Policy Analysis and Government Accountability 2008). Thus, when the Florida Department of Education began mandating that school districts report the numbers, structures, and clusters of their career academies in 2006/07— the school year just before the CAPE Act was passed—data on career academy students could not be reported consistently and systematically. But after the CAPE Act was passed, Florida adopted a formal definition of a career academy—incorporating the core components used nationally (see box 1)—to standardize data collection and reporting. It began a concerted effort to collect better data on career academies and on the students enrolled.
Since 2007/08, the Florida Department of Education has required that each district register its career academies annually and that superintendents certify
that their academies meet the legislative require-ments. In 2007/08, 246 career academies were registered; by 2008/09, the total had reached 490 (Florida Department of Education 2009). And districts now must report whether career academy students took and passed an industry certification assessment.
Study focus
This study is one of the first to investigate both career academy structure and clusters using multiple data sources. It responds to the need for descriptive, baseline data on career academies in 12 Florida school districts as they existed before the CAPE Act. The districts, chosen by the Florida Department of Education as those most consistently reporting career academy data, are Alachua, Charlotte, Citrus, Duval, Escambia, Hillsborough, Marion, Miami-Dade, Okeechobee, Palm Beach, St. Lucie, and Volusia.
The information in this report will serve as a base-line for the Florida Department of Education and others in the state in understanding the development and expansion of Florida academies. The study focuses on all the sample career academies, but data from studies of career academies since the introduction of the CAPE Act will separate un-registered and registered career and professional education academies that meet the requirements as defined in the CAPE legislation.
4 characTeriSTicS of career academieS in 12 florida School diSTricTS
This study is driven by three research questions on career academies in the 12 Florida school districts in 2006/07: • How many career academies were there, and
of what types? • What were the characteristics of high schools
offering career academies?
• How many students were enrolled in career academies, and what were their characteristics?
See box 3 for a summary of the data sources and study methodology.
box 3
Data sources and methods
Data sources. Three data sources were used for this study:
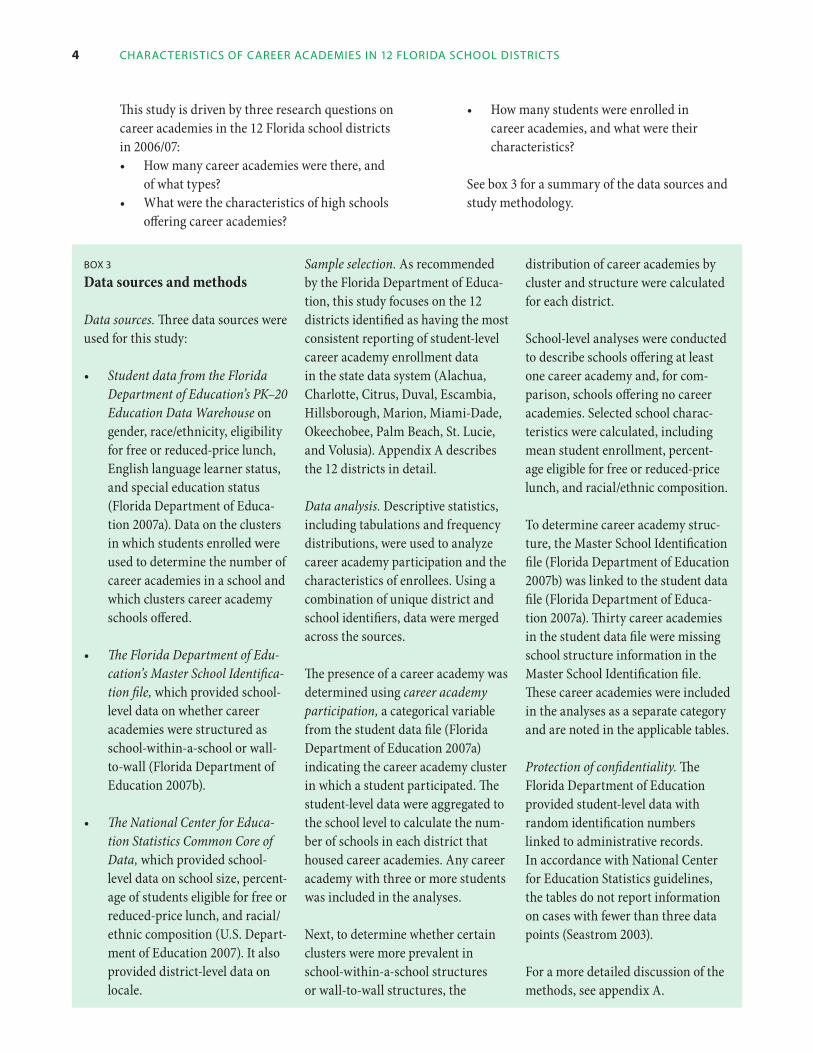
• Student data from the Florida Department of Education’s PK–20 Education Data Warehouse on gender, race/ethnicity, eligibility for free or reduced-price lunch, English language learner status, and special education status (Florida Department of Education 2007a). Data on the clusters in which students enrolled were used to determine the number of career academies in a school and which clusters career academy schools offered.
• The Florida Department of Education’s Master School Identification file, which provided school-level data on whether career academies were structured as school-within-a-school or wall-to-wall (Florida Department of Education 2007b).
• The National Center for Education Statistics Common Core of Data, which provided school-level data on school size, percentage of students eligible for free or reduced-price lunch, and racial/ ethnic composition (U.S. Department of Education 2007). It also provided district-level data on locale.
Sample selection. As recommended by the Florida Department of Education, this study focuses on the 12 districts identified as having the most consistent reporting of student-level career academy enrollment data in the state data system (Alachua, Charlotte, Citrus, Duval, Escambia, Hillsborough, Marion, Miami-Dade, Okeechobee, Palm Beach, St. Lucie, and Volusia). Appendix A describes the 12 districts in detail.
Data analysis. Descriptive statistics, including tabulations and frequency distributions, were used to analyze career academy participation and the characteristics of enrollees. Using a combination of unique district and school identifiers, data were merged across the sources.
The presence of a career academy was determined using career academy participation, a categorical variable from the student data file (Florida Department of Education 2007a) indicating the career academy cluster in which a student participated. The student-level data were aggregated to the school level to calculate the number of schools in each district that housed career academies. Any career academy with three or more students was included in the analyses.
Next, to determine whether certain clusters were more prevalent in school-within-a-school structures or wall-to-wall structures, the
distribution of career academies by cluster and structure were calculated for each district.
School-level analyses were conducted to describe schools offering at least one career academy and, for comparison, schools offering no career academies. Selected school characteristics were calculated, including mean student enrollment, percentage eligible for free or reduced-price lunch, and racial/ethnic composition.
To determine career academy structure, the Master School Identification file (Florida Department of Education 2007b) was linked to the student data file (Florida Department of Education 2007a). Thirty career academies in the student data file were missing school structure information in the Master School Identification file. These career academies were included in the analyses as a separate category and are noted in the applicable tables.
Protection of confidentiality. The Florida Department of Education provided student-level data with random identification numbers linked to administrative records. In accordance with National Center for Education Statistics guidelines, the tables do not report information on cases with fewer than three data points (Seastrom 2003).
For a more detailed discussion of the methods, see appendix A.

5 ingS find
FIndIngs
This study is one of the first to investigate both career academy structure and clusters using multiple data sources.
The findings reveal substantial career academy activity across the 12 Florida school districts in 2006/07. Almost 80 percent of schools had at least one career academy, and there were 596 distinct career academies across the 145 schools offering them. Of those, most operated as school-withina-school career academies embedded in a larger high school, with most students not participating. Fewer schools reported wall-to-wall academies, where all students participate, and these were primarily in Miami-Dade. Of the 332,010 sample high school students, 49,795 (15 percent) were identified as academy participants.
Schools with wall-to-wall academies tended to be larger, and their academies served a more disadvantaged student population (as proxied by the percentage of students eligible for free or reduced-price lunch), on average. Wall-to-wall academies also tended to address more general career clusters, such as arts, audiovisual technology, and communication, and human services. By contrast, school-within-a-school career academies tended to be in smaller schools and serve more advantaged students. School-within-a-school academies also tended to address more specific career clusters, such as hospitality and tourism.
The following sections present the findings for the three research questions for the 12 Florida sample school districts for 2006/07.
How many career academies were there, and of what types?
There were 183 high schools across the 12 sample districts (from 2 in Okeechobee to 56 in Miami-Dade) after excluding 227 nontraditional schools.4
Of these 183 schools, 145 (79 percent) offered career academies in 2006/07 (table 1). By district, high schools with career academies ranged from
50 percent of the total in one district (Okeechobee) to 100 percent in four districts (Charlotte, Citrus, Marion, and St. Lucie). The average number of career academies per high school ranged from 1 each in Citrus and Hillsborough to 10 in St. Lucie.
Career academy structure. More schools reported using the school-within-a-school structure (70; 48 percent) than the wall-to-wall structure (45; 31 percent; table 2).5 In school-within-a-school settings, 22 schools offered only one career academy, and the remaining school-within-a-school settings offered more than one academy (results not presented here). The school-within-a-school structure was more prevalent in 9 of the 12 districts (Alachua, Citrus, Duval, Escambia, Hillsborough, Okeechobee, Palm Beach, St. Lucie, and Volusia); just four districts reported wall-to-wall academies (Citrus, Duval, Miami-Dade, and Palm Beach). Although wall-to-wall structures suggest more career academies per high school, this study found that St. Lucie, reporting only school-within-a-school
Table 1
high schools with career academies by 12 sample Florida school districts, 2006/07
average number high schools with
number of career career academies School of high academies district schoolsa number Percent per school
alachua 7 6 86 2
charlotte 3 3 100 3
citrus 4 4 100 1
duval 22 17 77 3
escambia 10 6 60 2
hillsborough 25 15 60 1
marion 8 8 100 4
miami-dade 56 46 82 5
okeechobee 2 1 50 2
Palm beach 30 25 83 3
St. lucie 6 6 100 10
Volusia 10 8 80 2
Total 183 145 79 3
a. Excludes nontraditional schools.
Source: Authors’ analysis based on student data file (Florida Department of Education 2007a).

Table 2
structure of high schools with career academies by 12 sample Florida school districts, 2006/07
number of high schools
high schools missing with school - high schools information
-within a - -with wall to - on career School school career wall career academy district academies academies structurea
alachua 6 0 0
charlotte 0 0 3
citrus 3 1 0
duval 6 2 9
escambia 4 0 2
hillsborough 15 0 0
marion 0 0 8
miami-dade 0 40 6
okeechobee 1 0 0
Palm beach 21 2 2
St. lucie 6 0 0
Volusia 8 0 0
Total 70 45 30
Percent of all career academies 48 31 21
a. Career academies identified in the student data file (Florida Department of Education 2007a) but with no corresponding information in the Master School Identification file (Florida Department of Education 2007b).
Source: Presence of career academies, student data file (Florida Department of Education 2007a); career academy structure, Master School Identification file (Florida Department of Education 2007b).
6 characTeriSTicS of career academieS in 12 florida School diSTricTS
structures, had the highest average number of career academies per high school (10; see table 1). St. Lucie’s five largest high schools (each with more than 1,000 students) offered 9–12 career academies and served 48–60 percent of students.
Of the 45 schools using the wall-to-wall structure, 40 schools were in Miami-Dade, where at least 40 of the 46 schools with academies used the wall-towall structure. (Six schools were missing information for the structure variable.) Outside Miami-Dade, the wall-to-wall structure was rare—found in only 2 of 17 schools (12 percent) with career academies in Duval, 2 of 25 (8 percent) in Palm Beach, and 1 of 4 (25 percent) in Citrus.
Career academy cluster. The most prevalent cluster overall was arts, audiovisual technology, and communication (66; 11 percent; table 3); the least prevalent was manufacturing (2; less than 1 percent). Of the reported academies, 45 (8 percent) had no identified career cluster. In half the districts, no career clusters dominated: Alachua had 13 academies across 10 clusters, Charlotte had 10 across 8 clusters, Escambia had 17 across 11 clusters, Okeechobee had 3 across 3 clusters, St. Lucie had 58 across 14 clusters, and Volusia had 21 across 10 clusters.
Career academies in the other six districts tended to group into one or more dominant career clusters, reflecting a focus of the local economy. The modal career cluster in Miami-Dade was arts, audiovisual technology, and communication, (40 of 262 academies; 15 percent), reflecting the needs of a large urban labor market. In Palm Beach, the two most prevalent clusters were government and public administration, and information technology (13 each of 95 academies; 27 percent), also reflecting a more urban outlook. In Citrus, the most prevalent cluster was agriculture, food, and natural resources (4 of 5; 80 percent); in Duval, it was health science (14 of 56; 25 percent); in Hillsborough, it was hospitality and tourism (8 of 25; 32 percent); and in Marion, it was architecture and construction (7 of 31; 23 percent).
Cluster variation by structure. Some clusters occur more in one structure than the other (table 4). No human services cluster academies were reported in school-within-a-school structures, but 21 were reported in wall-to-wall structures. Similarly, several clusters were less frequent in wall-to-wall settings (business, management, and administration; health science; marketing, sales, and service; transportation, distribution, and logistics) but more frequent in school-within-a-school settings.
In wall-to-wall structures, the most common cluster was arts, audiovisual technology and communication (38 academies; 14 percent). In school-within-a-school structures, the most common was hospitality and tourism (27 academies; 12 percent).

Tab
le 3
Car
eer
acad
emie
s b
y cl
ust
er a
nd
12
sam
ple
Flo
rid
a sc
ho
ol d
istr
icts
, 200
6/07
(nu
mb
er, u
nle
ss o
ther
wis
e in
dic
ated
)
Tota
l-
hill
sm
iam
i-o
kee-
Palm
c
aree
r aca
dem
y cl
uste
r a
lach
ua
cha
rlot
te
cit
rus
duv
al
esca
mb
ia b
orou
gh
mar
ion
dad
e ch
obee
be
ach
St. l
ucie
Vo
lusi
a n
umb
er
Perc
ent
agr
icul
ture
, foo
d, a
ndna
tura
l res
ourc
es
2 1
4 0
1 1
1 13
0
3 5
2 33
5.
5
arc
hite
ctur
e an
dco
nstr
ucti
on
1 0
0 3
1 0
7 10
1
8 5
2 38
6.
4
art
s, a
udio
visu
al
tech
nolo
gy,
and
co
mm
unic
atio
n 0
1 0
5 2
1 1
40
0 8
5 3
66
11.1
busi
ness
, man
agem
ent,
and
adm
inis
trat
ion
0 1
0 2
0 3
3 1
0 1
5 0
16
2.7
educ
atio
n an
d tr
aini
ng
1 0
0 4
1 0
1 7
0 7
6 1
28
4.7
fina
nce
1 0
0 2
0 4
1 25
1
4 2
1 41
6.
9
gov
ernm
ent a
nd p
ublic
ad
min
istr
atio
n 0
1 0
4 0
0 0
14
0 13
0
2 34
5.
7
hea
lth
scie
nce
1 2
1 14
4
1 2
3 0
9 5
3 45
7.
6
hos
pit
alit
y an
d to
uris
m
1 1
0 2
1 8
4 13
0
115
2 48
8.
1
hum
an s
ervi
ces
0 0
0 2
0 0
0 19
0
0 0
0 21
3.
5
info
rmat
ion
tech
nolo
gy
1 0
0 3
1 2
3 30
0
13
5 0
58
9.7
law
, pub
lic s
afet
y, a
nd
secu
rity
2
1 0
1 2
1 0
12
0 3
4 0
26
4.4
man
ufac
turi
ng
0 0
0 0
0 0
1 0
0 0
1 0
2 0.
3
mar
keti
ng, s
ales
, and
se
rvic
e 2
0 0
110
3 0
1 0
1 5
0 23
3.
9
Scie
nce,
tech
nolo
gy,
en
gine
erin
g, a
ndm
athe
mat
ics
0 2
0 0
1 1
1 32
0
111
4 53
8.
9
Tran
spor
tati
on,
dis
trib
utio
n, a
nd lo
gist
ics
1 0
0 3
1 0
6 0
1 3
4 0
19
3.2
no
sele
cted
car
eer c
lust
er
0 0
0 0
2 0
0 42
0
0 0
1 45
7.
6
Tota
l num
ber
of h
igh
scho
ols
7 3
4 22
10
25
8
56
2 30
6
10
183
100
num
ber
of h
igh
scho
ols
wit
h ca
reer
aca
dem
ies
6 3
4 17
6
15
8 46
1
25
6 8
145
100
Tota
l num
ber
of c
aree
r ac
adem
ies
13
10
5 56
17
25
31
26
2 3
95
58
21
596
100
Note:
Hig
h sc
hool
s can
hav
e m
ore
than
one
car
eer a
cade
my.
Source: A
utho
rs’ a
naly
sis b
ased
on
stud
ent d
ata
fi le
(Flo
rida
Dep
artm
ent o
f Edu
catio
n 20
07a)
.
7 findingS

8 characTeriSTicS of career academieS in 12 florida School diSTricTS
This report does not explore the reasons behind cluster variation by type of structure. Nearly all the sample schools using the wall-to-wall struc-ture were in Miami-Dade, so the predominance of certain clusters in the wall-to-wall structure is
driven largely by career academy development in that district. Further study is needed to establish a clear relationship between a cluster’s prevalence and career academy structure.
Table 4
Career academy cluster by career academy structure in 12 sample Florida school districts, 2006/07
missing information - -School within a-school - -Wall to wall on school structurea Total
career academy cluster number Percent number Percent number Percent number Percent
agriculture, food, and natural resources 16 7.0 13 4.9 4 4.0 33 5.5
architecture and construction 17 7.4 11 4.1 10 10.0 38 6.4
arts, audiovisual technology, and communication 16 7.0 38 14.3 12 12.0 66 11.1
business, management, and administration 11 4.8 1 0.4 4 4.0 16 2.7
education and training 16 7.0 8 3.0 4 4.0 28 4.7
finance 13 5.7 26 9.8 2 2.0 41 6.9
government and public administration 15 6.5 15 5.6 4 4.0 34 5.7
health science 25 10.9 4 1.5 16 16.0 45 7.6
hospitality and tourism 27 11.7 14 5.3 7 7.0 48 8.1
human services 0 0.0 21 7.9 0 0.0 21 3.5
information technology 20 8.7 30 11.3 8 8.0 58 9.7
law, public safety, and security 11 4.8 13 4.9 2 2.0 26 4.4
manufacturing 1 0.4 0 0.0 1 1.0 2 0.3
marketing, sales, and service 15 6.5 2 0.8 6 6.0 23 3.9
Science, technology, engineering, and mathematics 16 7.0 32 12.0 5 5.0 53 8.9
Transportation, distribution, and logistics 9 3.9 1 0.4 9 9.0 19 3.2
no selected career cluster 2 0.9 37 13.9 6 6.0 45 7.6
Total number of career academies 230 266 100 596
a. Career academies identified in the student data file (Florida Department of Education 2007a) but with no corresponding structure information in the Master School Identification file (Florida Department of Education 2007b).
Source: Presence of career academies, authors’ analysis based on student data file (Florida Department of Education 2007a); career academy structure, authors’ analysis based on data from Master School Identification file (Florida Department of Education 2007b).
findingS 9
What were the characteristics of high schools offering career academies?
This research question looks at whether certain high school characteristics (average enrollment, percentage of students eligible for free or reduced-price lunch, racial/ethnic minority concentration)6 are related to the establishment of career acad-emies or to a particular career academy structure or career cluster.
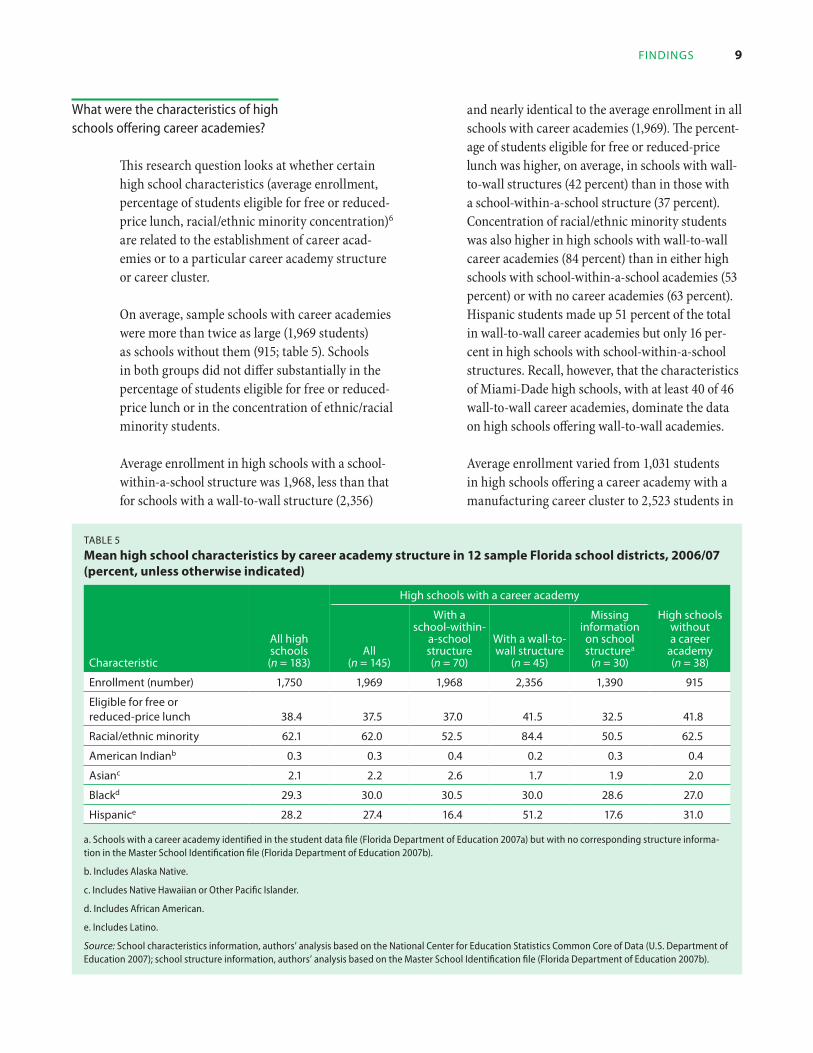
On average, sample schools with career academies were more than twice as large (1,969 students) as schools without them (915; table 5). Schools in both groups did not differ substantially in the percentage of students eligible for free or reduced-price lunch or in the concentration of ethnic/racial minority students.
Average enrollment in high schools with a school-within-a-school structure was 1,968, less than that for schools with a wall-to-wall structure (2,356)
and nearly identical to the average enrollment in all schools with career academies (1,969). The percent-age of students eligible for free or reduced-price lunch was higher, on average, in schools with wall-to-wall structures (42 percent) than in those with a school-within-a-school structure (37 percent). Concentration of racial/ethnic minority students was also higher in high schools with wall-to-wall career academies (84 percent) than in either high schools with school-within-a-school academies (53 percent) or with no career academies (63 percent). Hispanic students made up 51 percent of the total in wall-to-wall career academies but only 16 per-cent in high schools with school-within-a-school structures. Recall, however, that the characteristics of Miami-Dade high schools, with at least 40 of 46 wall-to-wall career academies, dominate the data on high schools offering wall-to-wall academies.
Average enrollment varied from 1,031 students in high schools offering a career academy with a manufacturing career cluster to 2,523 students in
Table 5
Mean high school characteristics by career academy structure in 12 sample Florida school districts, 2006/07 (percent, unless otherwise indicated)
high schools with a career academy
With a missing high schools school-within- information without
all high a-school With a wall-to- on school a career schools all structure wall structure structurea academy
characteristic (n = 183) (n = 145) (n = 70) (n = 45) (n = 30) (n = 38)
enrollment (number) 1,750 1,969 1,968 2,356 1,390 915
eligible for free or reduced-price lunch 38.4 37.5 37.0 41.5 32.5 41.8
racial/ethnic minority 62.1 62.0 52.5 84.4 50.5 62.5
american indianb 0.3 0.3 0.4 0.2 0.3 0.4
asianc 2.1 2.2 2.6 1.7 1.9 2.0
blackd 29.3 30.0 30.5 30.0 28.6 27.0
hispanice 28.2 27.4 16.4 51.2 17.6 31.0
a. Schools with a career academy identified in the student data file (Florida Department of Education 2007a) but with no corresponding structure informa-tion in the Master School Identification file (Florida Department of Education 2007b).
b. Includes Alaska Native.
c. Includes Native Hawaiian or Other Pacific Islander.
d. Includes African American.
e. Includes Latino.
Source: School characteristics information, authors’ analysis based on the National Center for Education Statistics Common Core of Data (U.S. Department of Education 2007); school structure information, authors’ analysis based on the Master School Identification file (Florida Department of Education 2007b).

10 characTeriSTicS of career academieS in 12 florida School diSTricTS
Table 6
Mean high school characteristics in 12 sample Florida school districts, by career academy cluster, 2006/07 (percent, unless otherwise indicated)
career academy clustera
Student enrollment (number)
eligible for free or reduced-
price lunch
racial/ethnic minorityb
american indian asian black hispanic Totalc
human services (n = 21) 2,523 47.8 0.1 1.3 39.6 48.7 90.7
no selected career cluster (n = 45) 2,297 43.2 0.2 1.3 30.7 51.3 84.4
law, public safety, and security (n = 26) 2,137 49.9 0.2 1.5 45.4 27.4 76.2
arts, audiovisual technology, and communication (n = 66) 2,204 40.3 0.2 1.6 30.4 40.8 74.7
information technology (n = 58) 2,221 41.9 0.2 1.6 32.5 38.6 74.6
finance (n = 41) 2,467 40.8 0.2 1.7 26.7 43.8 73.9
Science, technology, engineering, and mathematics (n = 53) 2,446 40.6 0.2 1.6 26.1 43.2 72.5
government and public administration (n = 34) 2,345 40.2 0.3 2.3 40.3 26.5 71.2
marketing, sales, and service (n = 23) 1,708 39.4 0.2 2.4 46.6 14.7 66.3
education and training (n = 28) 1,938 40.2 0.3 2.1 39.1 21.8 65.4
hospitality and tourism (n = 48) 2,089 39.8 0.3 2.2 31.2 27.1 63.2
architecture and construction (n = 38) 2,001 37.2 0.4 2.0 25.7 28.7 58.9
agriculture, food, and natural resources (n = 33) 2,153 38.5 0.4 1.7 29.5 23.9 57.5
health science (n = 45) 1,857 36.6 0.3 2.3 39.6 12.5 56.8
business, management, and administration (n = 16) 2,052 41.5 0.4 2.2 27.8 21.5 54.5
Transportation, distribution, and logistics (n = 19) 1,734 36.1 0.5 2.2 24.8 14.9 45.3
manufacturing (n = 2) 1,031 34.2 0.7 1.8 19.3 16.9 42.9
all high schools (n = 183) 1,750 38.4 0.3 2.1 29.3 28.2 62.1
has a career academy (n = 145) 1,969 37.5 0.3 2.2 30.0 27.4 62.0
no career academy (n = 38) 915 41.8 0.4 2.0 27.0 31.0 62.5
a. Clusters are displayed in descending order by overall racial/ethnic minority rates.
b. Black includes African American, Hispanic includes Latino, Asian includes Native Hawaiian or Other Pacific Islander, and American Indian includes Alaska Native.
c. Total refers to racial/ethnic minority groups only. Totals do not sum to 100 percent because “White” is omitted.
Source: Presence of career academies, authors’ analysis of student data file (Florida Department of Education 2007a); school characteristics, authors’ analysis of data from the National Center for Education Statistics Common Core of Data (U.S. Department of Education 2007).
schools offering human services (table 6). Eligibil-ity for free or reduced-price lunch varied from an average of 34 percent in schools with a manufac-turing cluster to 50 percent in schools with a law, public safety, and security cluster.
The average proportion of racial/ethnic minority groups other than White varied from 43 percent in
schools offering a career academy with a manu-facturing cluster to 91 percent in schools offer-ing human services. In schools offering a career academy with a manufacturing cluster, 19 percent of students were Black; in schools offering a career academy with a marketing, sales, and service cluster, 47 percent of students were Black. Schools offering a career academy with a health science

cluster had the smallest percentage of Hispanic students (13 percent); schools offering a career academy with no selected career cluster had the largest (51 percent).
How many students were enrolled in career academies, and what were their characteristics?
The previous section describes the schools offering career academies. This section describes the students enrolled in career academies.
findingS 11
Career academy structure. Of the 332,010 students enrolled across the 12 school districts, 49,795 (15 percent) were enrolled in a career academy (table 7). More girls (54 percent) than boys (46 percent) enrolled in career academies. More students enrolled in school-within-a-school career academies (25,587) than in wall-to-wall career academies (20,818). School-within-a-school academies served a more advantaged group of students, on average, than did wall-to-wall academies (as proxied by the percentage of students eligible for
--
- - -
Table 7
Career academy enrollment in 12 sample Florida school districts, by career academy structure and student characteristics, 2006/07 (percent, unless otherwise indicated)
Student characteristic Total
Students in a career academy
not in a career
academyall
With a school within
a school structure
With a wall to wall
structure
missing school
structure informationa
enrollment (number) 332,010 49,795 25,587 20,818 3,390 282,215
gender
male 49.6 45.8 47.7 43.2 48.0 50.3
female 50.4 54.2 52.3 56.8 52.0 49.7
other characteristics
eligible for free or reduced-price lunch 38.4 38.6 33.4 45.2 37.9 38.4
english language learner student 6.1 2.2 2.3 2.3 0.8 6.8
Special education student 19.1 18.2 13.3 24.8 14.6 19.3
race/ethnicityb
american indian 0.3 0.3 0.3 0.2 0.6 0.3
asian 2.4 2.5 2.7 2.5 2.1 2.3
black 26.3 29.4 27.1 33.2 24.3 25.7
White 38.1 37.4 51.3 16.8 58.6 38.2
hispanic 30.9 28.0 16.1 45.3 11.5 31.4
more than one race 2.1 2.4 2.6 2.0 2.9 2.1
grade
9 28.9 29.1 25.1 32.2 40.0 28.9
10 26.8 26.2 26.9 26.2 21.4 26.9
11 22.9 23.6 25.9 21.1 21.6 22.7
12 21.5 21.1 22.1 20.5 17.0 21.5
a. Career academies identified in student data file (Florida Department of Education 2007a) but with no corresponding structure information in the Master School Identification file (Florida Department of Education 2007b).
b. Unless otherwise noted, Black includes African American, Hispanic includes Latino, Asian includes Native Hawaiian or Other Pacific Islander, and American Indian includes Alaska Native.
Source: For student characteristics and presence of career academies, authors’ analysis of student data file (Florida Department of Education 2007a); for career academy structure, authors’ analysis of data from Master School Identification file (Florida Department of Education 2007b).
12 characTeriSTicS of career academieS in 12 florida School diSTricTS
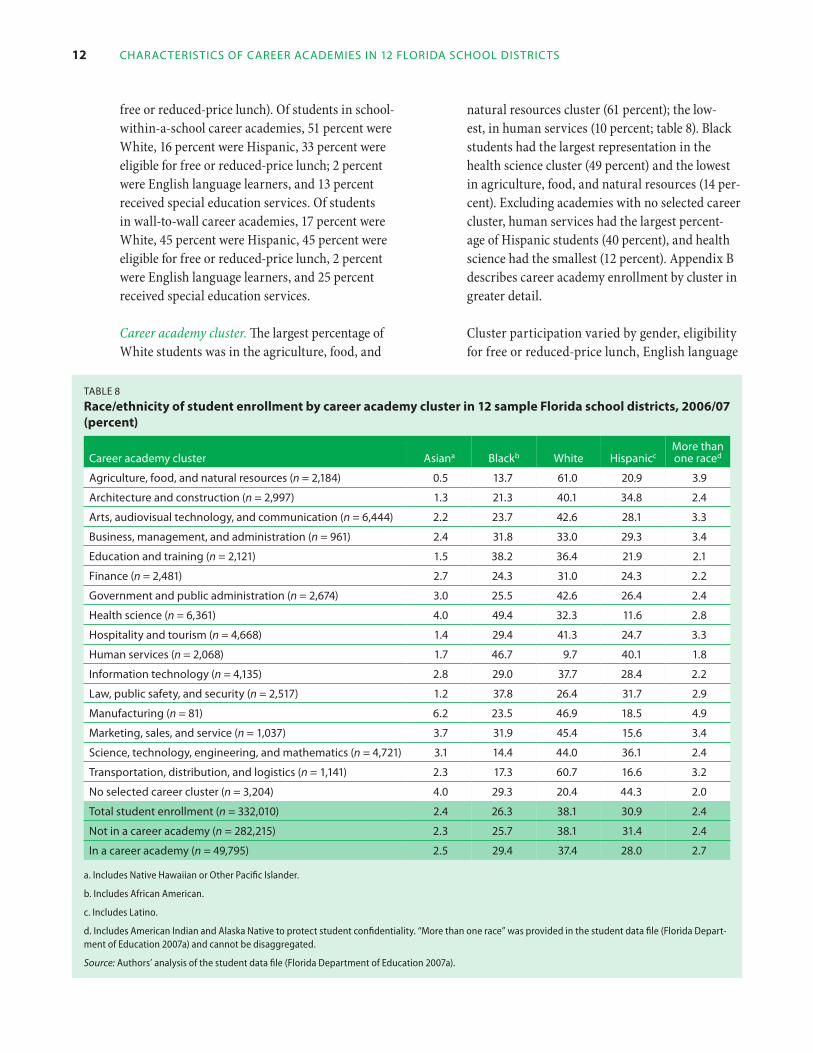
free or reduced-price lunch). Of students in school-within-a-school career academies, 51 percent were White, 16 percent were Hispanic, 33 percent were eligible for free or reduced-price lunch; 2 percent were English language learners, and 13 percent received special education services. Of students in wall-to-wall career academies, 17 percent were White, 45 percent were Hispanic, 45 percent were eligible for free or reduced-price lunch, 2 percent were English language learners, and 25 percent received special education services.
Career academy cluster. The largest percentage of White students was in the agriculture, food, and
natural resources cluster (61 percent); the low-est, in human services (10 percent; table 8). Black students had the largest representation in the health science cluster (49 percent) and the lowest in agriculture, food, and natural resources (14 per-cent). Excluding academies with no selected career cluster, human services had the largest percent-age of Hispanic students (40 percent), and health science had the smallest (12 percent). Appendix B describes career academy enrollment by cluster in greater detail.
Cluster participation varied by gender, eligibility for free or reduced-price lunch, English language
Table 8
Race/ethnicity of student enrollment by career academy cluster in(percent)
12 sample Florida school districts, 2006/07
career academy cluster asiana blackb Whitemore than
hispanicc one raced
agriculture, food, and natural resources (n = 2,184) 0.5 13.7 61.0 20.9 3.9
architecture and construction (n = 2,997) 1.3 21.3 40.1 34.8 2.4
arts, audiovisual technology, and communication (n = 6,444) 2.2 23.7 42.6 28.1 3.3
business, management, and administration (n = 961) 2.4 31.8 33.0 29.3 3.4
education and training (n = 2,121) 1.5 38.2 36.4 21.9 2.1
finance (n = 2,481) 2.7 24.3 31.0 24.3 2.2
government and public administration (n = 2,674) 3.0 25.5 42.6 26.4 2.4
health science (n = 6,361) 4.0 49.4 32.3 11.6 2.8
hospitality and tourism (n = 4,668) 1.4 29.4 41.3 24.7 3.3
human services (n = 2,068) 1.7 46.7 9.7 40.1 1.8
information technology (n = 4,135) 2.8 29.0 37.7 28.4 2.2
law, public safety, and security (n = 2,517) 1.2 37.8 26.4 31.7 2.9
manufacturing (n = 81) 6.2 23.5 46.9 18.5 4.9
marketing, sales, and service (n = 1,037) 3.7 31.9 45.4 15.6 3.4
Science, technology, engineering, and mathematics (n = 4,721) 3.1 14.4 44.0 36.1 2.4
Transportation, distribution, and logistics (n = 1,141) 2.3 17.3 60.7 16.6 3.2
no selected career cluster (n = 3,204) 4.0 29.3 20.4 44.3 2.0
Total student enrollment (n = 332,010) 2.4 26.3 38.1 30.9 2.4
not in a career academy (n = 282,215) 2.3 25.7 38.1 31.4 2.4
in a career academy (n = 49,795) 2.5 29.4 37.4 28.0 2.7
a. Includes Native Hawaiian or Other Pacific Islander.
b. Includes African American.
c. Includes Latino.
d. Includes American Indian and Alaska Native to protect student confidentiality. “More than oment of Education 2007a) and cannot be disaggregated.
ne race” was provided in the student data file (Florida Depart-
Source: Authors’ analysis of the student data file (Florida Department of Education 2007a).

STudy limiTaTionS and need for addiTional reSearch 13
learner status, and special education status (see appendix B). The transportation, distribution, and logistics cluster had the smallest percentage of female students (8 percent), and education and training had the largest (84 percent). Participation rates for students eligible for free or reduced-price lunch ranged from 31 percent in the arts, audiovisual technology, and communication cluster to 51 percent in human services. English language learner students made up less than 10 percent of enrollment in all clusters. The manufacturing cluster had the largest percentage of English language learner students (9 percent), and agriculture, food, and natural resources, the smallest (1 percent). Students receiving special education services ranged from 10 percent in the business, management, and administration cluster to 38 percent in academies with no selected career cluster.
Florida Comprehensive Assessment Test scores and career academy structure
Additional analyses of average grade 8 Florida Comprehensive Assessment Test (FCAT) proficiency levels for reading and math, by career academy structure, were conducted for the subsample of students with valid test score data (81 percent; 269,127 students). Analyzing the demographics of these students revealed an underrepresentation of English language learner students compared with the full sample (see appendix C). Findings should be interpreted with caution.
- - -
- - -
More girls than boys
enrolled in career
academies; more
students enrolled in
school within a school
career academies
than in wall-to-wall
career academies; and
school within a school
academies served a more
advantaged group of
students, on average
sTudy lIMITaTIons and need FoR addITIonal ReseaRCh
This study has two known limitations, associated with generalizability and conflicting data.
First, the results are based on the 12 sample Florida school districts identified by the Florida Department of Education as those that report career academy data most consistently. These districts do not constitute a random sample, so findings cannot be generalized to the whole state.
Second, data on career academy structure and cluster were drawn from two sources (student-level data file to identify career academy clusters and the Master School Identification file to identify the correspond-ing structures; Florida Department of Education 2007a, 2007b). But these data sources sometimes reported conflicting information. Reports of career academies in the Master School Identification file did not completely align with reported academy student participation in the student data file. This study found two scenarios: Some students were identified in the student data file as enrolled in career academies at schools not identified in the Master School Identification file as having one. And some schools identified in the Master School Identification file as having career academies did not have students identified in the student data files as enrolled. In consultation with the Florida Department of Education, this study classified a school as having a career academy if the student data file identified three or more students in that school as enrolled, even if there was no structure information from the Master School Identification file. Therefore, several tables in this report include an additional column representing schools, academies, clusters, or students for which there is no information on corresponding career academy structure.
Overall, 100 of the 596 academies did not have career academy structure information available and are classified as “missing information on school structure.” And although this report is intended to help the Florida Department of Education develop career academies and design curricula, at the time of 2006/07 data reporting, the process of identifying career academies was new. As the process evolves, it may affect how career academies are reported from year to year.

14 characTeriSTicS of career academieS in 12 florida School diSTricTS
No research systematically compares the effectiveness or relative feasibility of implementing school-within-a-school and wall-to-wall career academies. Also, additional research is needed on the types and strength of partnerships between academies and industries and communities, other support for student engagement, and student achievement across career academy structures and clusters.
That different career clusters tend to dominate in career academies across districts points to a need
for further research on the relationship with labor market demands. Investigating the relationship between the prevalence of career clusters in some districts and the availability of partners and jobs in those areas could help guide state and local policy discussion on existing and potential links between education and economic development. This would be especially fruitful in light of the increased requirements of Florida’s education policies on industry certifications for students and business partnerships with schools (Florida Department of Education 2009).

15 aPPendix a. meThodS
appendIx a MeThods
This appendix describes the sample districts, data sources, selection of the analytic sample, and data analyses.
Sample districts
Based on 2006/07 data from the National Center for Education Statistics Common Core of Data, the 12 districts chosen by the Florida Department of Education for this study ranged from smaller rural fringe districts to larger city districts (table A1). These districts were chosen because they were the 12 that reported career academy data most consistently. Student enrollment (grades 9–12) ranged from fewer than 2,000 students in Okeechobee to more than 100,000 in Miami-Dade. These numbers include only traditional high schools; nontraditional schools were excluded. (For types of schools excluded, see the section on selection
of the analytic sample.) Because the districts were not randomly selected, the results cannot be interpreted to represent all districts in the state.
Table a1
high schools and student enrollment by 12 sample Florida school districts, 2006/07
number School of high district schools enrollment locale type
alachua 7 9,340 city: midsize
charlotte 3 5,954 Suburb: midsize
citrus 4 4,817 rural: fringe
duval 22 36,790 city: large
escambia 10 12,922 Suburb: large
hillsborough 25 54,066 Suburb: large
marion 8 13,034 rural: fringe
miami-dade 56 108,596 Suburb: large
okeechobee 2 1,907 Town: distant
Palm beach 30 52,173 Suburb: large
St. lucie 6 11,471 city: midsize
Volusia 10 20,940 city: small
Total 183 332,010 —
Note: Excludes nontraditional schools.
Source: Enrollment and number of high schools, authors’ analysis of the student data file (Florida Department of Education 2007a); locale type, authors’ review of National Center for Education Statistics Common Core of Data (U.S. Department of Education 2007).
Data sources
Information on an array of student-, school-, and district-level data was drawn from three sources (table A2):
• Student data file from Florida Department of Education’s PK–20 Education Data Warehouse, on gender, race/ethnicity, eligibility for free or reduced-price lunch, English language learner status, and special education status (Florida Department of Education 2007a). Data were also available on which clusters (the field around which a career academy curriculum is organized) students enrolled in and were used to determine the number of career academies in a school and which clusters career academy schools offered. Although these data are student-level, this study used the career academy participation variable in the student data file to identify the schools offering the 16 career academy clusters, based on guidance from the Florida Department of Education. Data from the Master School Identification file and the student data file were merged through a unique district-school identifier.
• The Florida Department of Education’s Master School Identification file, which provided school-level data on whether career academies were structured as school-within-a-school, with a single career academy embedded within a larger high school, or as wall-towall, with entire schools divided into career academies (Florida Department of Education 2007b). This source is a comprehensive listing of all Florida public schools serving students in prekindergarten through high school. The 2006/07 school year was the first that it collected information on career academies.
• The National Center for Education Statistics Common Core of Data, which provided

16 characTeriSTicS of career academieS in 12 florida School diSTricTS
school-level information on school size, percentage of students eligible for free or reduced-price lunch, and racial/ethnic composition (U.S. Department of Education 2007). It also provided district-level data on locale. The data obtained from this source were linked to the student data file and Master School Identification file using a unique district-school identifier.
Selection of the analytic sample
The student data received from the Florida Department of Education’s PK–20 Education Data Warehouse included separate files for enrollment, transcripts, and demographic information. The enrollment file included some students who were eventually dropped from the analytic sample. The analytic sample excluded students who registered for the fall but did not show up on the first day of school (such as migrant students and students who moved out of state) and students in nontraditional schools.
Identifying one school per student during the 2006/07 school year. The student data files provided information on all schools a student attended in 2006/07. Therefore, the raw data files from the Florida Department of Education include multiple observations for students attending more than one school. To account for in-state student mobility, this study assigned students to the school in which they were enrolled at the end of 2006/07 in order to retain one school record per student. The school record from the last school attended would have been reported during the end-of-year survey (survey 5). However, the Florida Department of Education staff confirmed that there is no variable designating a student observation as being from survey 5. Instead, student records with valid withdrawal dates and reasons were used to identify an end-of-year (survey 5) record. Student observations determined to have come from survey 5, and thus the last school attended, were identified and kept in the analysis.
Table a2
data sources and variables
data element unit of analysis data source data description/variable
career academy School master School • Type of career academy model at the school: structurea identification file • School-within-a-school
• Wall-to-wall
• not applicable (no career academies at the school).
career academy cluster School/academy Student data file • categorical variable at the student level identifying: • number of career academies (career academy level). • Schools offering particular career clusters (school level).
Student enrollment in a Student Student data file • categorical variable indicating the career cluster of the career academyb career academy in which the student participated during
the school year.
Student characteristics Student Student data file • gender.
• race/ethnicity.
• eligibility for free or reduced-price lunch.
• english language learner status.
• Special education status.
School characteristics School common core • School size. of data • Percent of students eligible for free or reduced-price lunch.
• racial/ethnic composition.
a. Called “Career academy type” in Master School Identification file (Florida Department of Education 2007b).
b. Called “Career academy participant” in student data file (Florida Department of Education 2007a).
Source: Authors’ review of data sources.

17 aPPendix a. meThodS
Excluding students in nontraditional schools. Students attending nontraditional high schools in the 12 school districts were identified using information from the Master School Identification file and the Common Core of Data. These 227 schools, and the students who attended them, were excluded from the analysis to create an analytic sample of “typical” public high schools and students. The types of schools considered nontraditional were:
• Adult. • Alternative to expulsion. • Area vocational/technical centers. • Department of juvenile justice. • Hospital/homebound. • Jails. • Private/voucher. • Schools for neglected/delinquent students. • Special education schools. • Superintendent’s office. • University labs. • Virtual schools.
Arriving at the analytic sample. Following data cleaning, the final sample across the 12 districts included 183 schools, 145 of them with a total of 596 career academies.
Data analyses
Descriptive statistics, including tabulations and frequency distributions, were used to analyze career academy participation and the characteristics of enrollees. Using a combination of unique district and school identifiers, data were merged across the sources.
The presence of a career academy was determined using career academy participation, a categorical variable from the student data file (Florida Department of Education 2007a) indicating the career academy cluster in which a student participated. The student-level data were aggregated to the school level to calculate the number of schools in each district that housed career academies. Any career academy with three or more students was included in the analyses.
The presence of particular career clusters was also determined using the career academy participation variable. This variable includes 16 career cluster codes (table A3; Florida Department of Education 2006b). An additional category identifies students with no selected career cluster. Next, to determine whether certain clusters were more prevalent in school-within-a-school structures or wall-to-wall structures, the distribution of career academies by cluster and structure were calculated for each district.
School-level analyses were conducted to describe schools offering at least one career academy and, for comparison, schools offering no career academies. Selected school characteristics were calculated, including mean student enrollment, percentage eligible for free or reduced-price lunch, and racial/ethnic composition.
Table a3
Career academy clusters and codes for the career academy participant data element
code career academy cluster
a agriculture, food, and natural resources
b architecture and construction
c arts, audiovisual technology, and communications
d business, management, and administration
e education and training
f finance
g government and public administration
h health science
i hospitality and tourism
J human services
K information technology
l law, public safety, and security
m manufacturing
n nonea
o marketing, sales, and service
P Science, technology, engineering, and mathematics
Q Transportation, distribution, and logistics
Z career academy student without a selected career cluster
a. Student did not participate in a career academy during the reporting year.
Source: Florida Department of Education 2006b.
18 characTeriSTicS of career academieS in 12 florida School diSTricTS
To determine career academy structure, the Master School Identification file (Florida Department of Education 2007b) was linked to the student data file (Florida Department of Education 2007a). Thirty career academies were missing school structure information in the Master School Identification file. These career academies were included in the analyses as a separate category and are noted in the applicable tables.
Protection of confidentiality
To avoid identifying students, the student records were assigned random IDs linked to administrative records. In accordance with
National Center for Education Statistics guidelines, cell sizes of fewer than three cases were not reported (Seastrom 2003). Moreover, strict data precautions were taken, as required by the Florida Department of Education. This included submitting confidentiality agreements signed by the researchers. This data protection approach was approved by the University of North Carolina–Greensboro’s Institutional Review Board.
Limitations
See main report for study limitations.

appendix b. sTudenT career academy enrollmenT by sTudenT and school characTerisTics 19
appendix b sTudenT career academy enrollmenT by sTudenT and school characTerisTics
Not enrolled in a career academyEnrolled in a career academy
All students
No selected career clusterTransportation, distribution, and logistics
Science, technology, engineering, and mathematicsMarketing, sales, and service
ManufacturingLaw, public safety, and security
Information technologyHuman services
Hospitality and tourismHealth science
Government and public administrationFinance
Education and trainingBusiness, management, and administration
Arts, audiovisual technology, and communicationArchitecture and construction
Agriculture, food, and natural resources
49.6
50.3
45.8
45.8
91.7
62.9
43.9
87.7
34.9
60.5
22.1
44.8
25.8
45.8
49.9
15.6
53.6
43.2
46.4
72.2
53.6
27.8
56.8
46.4
84.4
50.1
54.2
74.2
55.2
78.0
39.5
65.1
12.4
56.1
37.1
8.3
54.7
50.4
54.2
49.7
Male Female
0 25 50 75 100
figure b1
student career academy enrollment in 12 sample florida school districts, by gender and career academy cluster, 2006/07 (percent)
Source: Authors’ analysis based on student data file (Florida Department of Education 2007a).
Not enrolled in a career academyEnrolled in a career academy
All students
No selected career clusterTransportation, distribution, and logistics
Science, technology, engineering, and mathematicsMarketing, sales, and service
ManufacturingLaw, public safety, and security
Information technologyHuman services
Hospitality and tourismHealth science
Government and public administrationFinance
Education and trainingBusiness, management, and administration
Arts, audiovisual technology, and communicationArchitecture and construction
Agriculture, food, and natural resources
38.4
38.6
38.4
44.1
32.3
34.2
32.3
33.3
49.8
38.2
50.7
36.0
44.1
40.6
37.4
44.3
44.6
30.6
31.3
36.0
68.7
64.0
69.4
55.4
55.7
62.6
59.4
55.9
64.0
49.3
61.8
50.2
66.7
67.7
65.8
67.8
55.9
61.6
61.4
61.6
Eligible for free or reduced-price lunch Not eligible for free or reduced-price lunch
0 25 50 75 100
figure b2
student career academy enrollment in 12 sample florida school districts, by free or reduced-price lunch eligibility and career academy cluster, 2006/07 (percent)
Source: Authors’ analysis based on student data file (Florida Department of Education 2007a).

Not enrolled in a career academy Enrolled in a career academy
All students
No selected career cluster Transportation, distribution, and logistics
Science, technology, engineering, and mathematics Marketing, sales, and service
Manufacturing Law, public safety, and security
Information technology Human services
Hospitality and tourism Health science
Government and public administration Finance
Education and training Business, management, and administration
Arts, audiovisual technology, and communication Architecture and construction
Agriculture, food, and natural resources
6.1
6.8
2.2
1.5
1.5
2.4
2.0
8.6
1.4
2.5
3.6
3.3
1.5
3.1
1.3
2.3
6.5
1.8
0.6
2.4
99.5
97.6
98.2
93.6
97.7
98.7
96.9
98.5
96.7
96.4
97.5
98.7
91.4
98.0
97.7
98.5
98.5
93.9
97.8
93.3
English language learner student Non–English language learner student
0 25 50 75 100
figure b3
student career academy enrollment in 12 sample Florida school districts, by english language learner status and career academy cluster, 2006/07 (percent)
Source: Authors’ analysis based on student data file (Florida Department of Education 2007a).
20 characTeriSTicS of career academieS in 12 florida School diSTricTS
Not enrolled in a career academy Enrolled in a career academy
All students
No selected career cluster Transportation, distribution, and logistics
Science, technology, engineering, and mathematics Marketing, sales, and service
Manufacturing Law, public safety, and security
Information technology Human services
Hospitality and tourism Health science
Government and public administration Finance
Education and training Business, management, and administration
Arts, audiovisual technology, and communication Architecture and construction
Agriculture, food, and natural resources
19.1
19.3
18.2
37.7
20.8
21.7
14.6
14.8
16.1
12.7
18.6
15.9
10.4
23.0
17.2
11.1
10.2
20.7
18.0
20.9
82.0
79.1
79.4
89.8
88.9
82.8
77.0
89.6
84.1
81.4
87.3
84.0
85.2
85.4
78.3
79.2
62.3
80.9
81.8
80.7
Special education student Non–special education student
0 25 50 75 100
figure b4
student career academy enrollment in 12 sample Florida school districts, by special education status and career academy cluster, 2006/07 (percent)
Source: Authors’ analysis based on student data file (Florida Department of Education 2007a).
21 aPPendix c. analyZing grade 8 florida comPrehenSiVe aSSeSSmenT TeST daTa
appendIx C analyzIng gRade 8 FloRIda CoMpRehensIve assessMenT TesT daTa
This appendix presents grade 8 Florida Comprehensive Assessment Test (FCAT) proficiency levels by career academy structure for the sub-sample of students with valid FCAT scores. The results in the main report were based on 332,010 students. But this appendix reports on 269,127 students—the 81 percent with valid reading and math FCAT scores.7 The sample of students with valid FCAT scores differed from the sample of students missing FCAT scores, primarily in the prevalence of English language learner students. Specifically, 3 percent of students with valid FCAT scores were English language learners, compared with 20 percent of students missing valid FCAT scores.
Florida policies provide guidelines on FCAT exemptions for English language learner students and students with disabilities (Florida Department of Education 2005). According to the guidelines, students enrolled in a limited English proficiency
program for one year or less may be exempt from the FCAT. And students who completed grade 8 outside Florida would not have taken FCATs and thus would be missing in the FCAT data file.
Differences in analytic samples warrant caution in interpreting the association between FCAT scores and academy structure. Miami-Dade, with the most English language learner students in the sample, comprises almost 90 percent of wall-to-wall career academies in the study. Because of the policies exempting English language learner students from taking the FCAT, average scores among students in wall-to-wall career academies undercount this population.
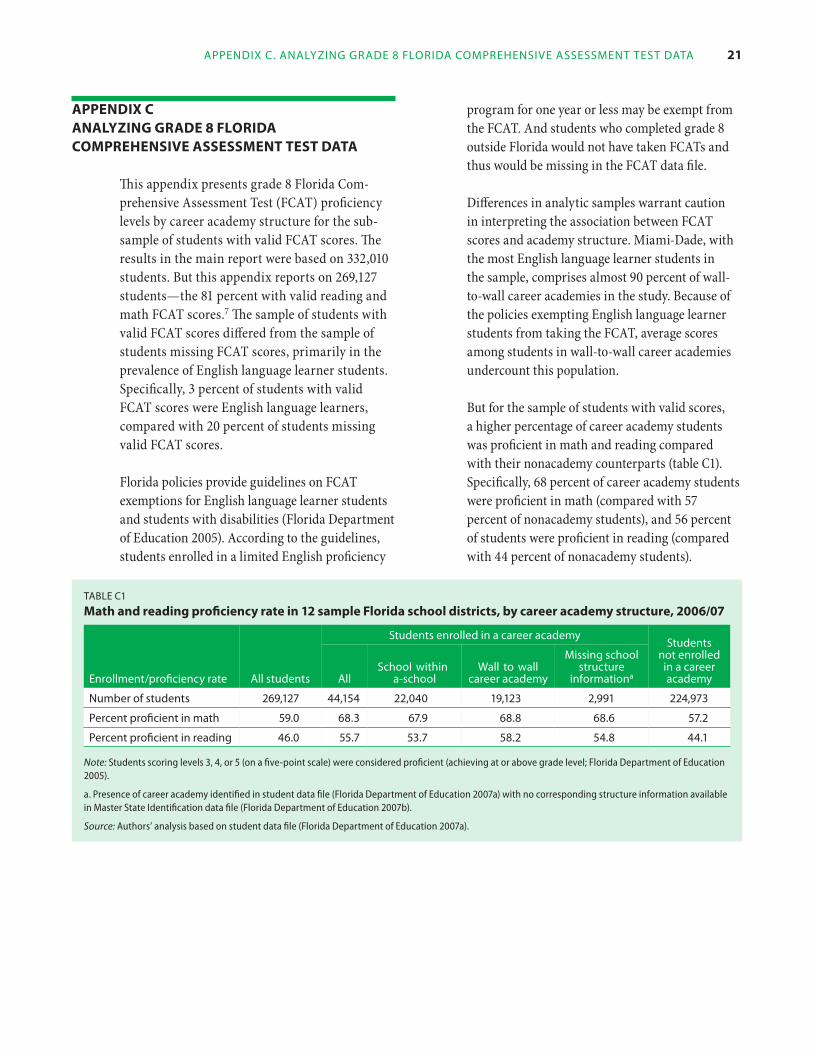
But for the sample of students with valid scores, a higher percentage of career academy students was proficient in math and reading compared with their nonacademy counterparts (table C1). Specifically, 68 percent of career academy students were proficient in math (compared with 57 percent of nonacademy students), and 56 percent of students were proficient in reading (compared with 44 percent of nonacademy students).
Table c1
Math and reading proficiency rate in 12 sample Florida school districts, by career academy structure, 2006/07
Students enrolled in a career academy Students
missing school not enrolled -School within - - -Wall to wall structure in a career
enrollment/proficiency rate all students all a-school career academy informationa academy
number of students 269,127 44,154 22,040 19,123 2,991 224,973
Percent proficient in math 59.0 68.3 67.9 68.8 68.6 57.2
Percent proficient in reading 46.0 55.7 53.7 58.2 54.8 44.1
Note: Students scoring levels 3, 4, or 5 (on a five-point scale) were considered proficient (achieving at or above grade level; Florida Department of Education 2005).
a. Presence of career academy identified in student data file (Florida Department of Education 2007a) with no corresponding structure information available in Master State Identification data file (Florida Department of Education 2007b).
Source: Authors’ analysis based on student data file (Florida Department of Education 2007a).

22 characTeriSTicS of career academieS in 12 florida School diSTricTS
noTes
The authors thank Mark Baird, Nancy Copa, and Jeff Sellers (all of the Florida Department of Education) for input and advice along the way; and Corinne Alfeld, Amy Detgen, Laura Feagans Gould, Nettie Legters, and Jason Snipes (all of AED) for helpful feedback on drafts of this report. Dia Adams, Brittany Davis, Amelie Hopkins, and Pamela Levine (all of AED) provided research assistance. Reginald Lee (University of South Florida) aided in accessing data, and Peter Rosenblatt (Johns Hopkins University) provided programming assistance. Kathryn Borman (University of South Florida) and Kellie Kim and Becky Smerdon (Quill Research Associates, LLC) developed the initial study plan while at AED.
1. Several federal legislative initiatives are de-signed to bolster the academic rigor of career and technical education, including the Carl D. Perkins Vocational and Applied Technology Education Act, reauthorized in 1998 and in 2006 (Carl D. Perkins Vocational and Applied Technology Education Amendments of 1998; Carl D. Perkins Career and Technical Education Improvement Act of 2006). The Perkins legislation requires that career and technical education programs receiving federal funding incorporate academics into their curricula. The legislation describes career academies as one of several possible methods for meeting this directive but does not mandate their use or prescribe a focus or structure.
2. At least one school from each sample district received funding through this program.
3. The Florida Department of Education provides many resources to districts in support
of this requirement (see http://www.fldoe.org/ workforce/careeracademies/ca_home.asp).
4. Nontraditional schools were adult, alternative to expulsion, area vocational/technical centers, department of juvenile justice, hospital/ homebound, jails, private/voucher, schools for neglected/delinquent students, special educa-tion schools, superintendent’s office, university labs, and virtual schools.
5. The school structure variable was miss-ing for 30 of the sample schools with career academies. In six districts, at least one school reported in the student data file was missing data on career academy school structure in the Master School Identification file. In Char-lotte and Marion, all schools were missing information on school structure.
6. Locale/urbanicity was initially considered for inclusion as well. But it was ultimately excluded because such an analysis would be driven largely by Miami-Dade, home to almost 90 percent of the sample wall-to-wall academies. Other school characteristics, such as number of staff and accelerated course of-ferings, were excluded due to lack of data avail-ability or lack of alignment with the research focus. Participation in accelerated course-taking mechanisms in Florida will be addressed in a forthcoming Issues & Answers report.
7. Students were required to have valid data on both math and reading FCAT exams. Sensitivity analyses reveal that this requirement does not change the results.
23 referenceS
ReFeRenCes
Allen, L., Almeida, C., and Steinberg, A. (2001) Wall to wall: implementing small learning communities in five Boston high schools. Providence, RI: The Education Alliance at Brown University.
Bradby, D., Malloy, A., Hanna, T., and Dayton, C. (2007). A profile of the California partnership academies 2004– 2005. Berkeley, CA: ConnectEd.
Brand, B. (2009). High school career academies: a 40-year proven model for improving college and career readiness. Retrieved January 1, 2010, from http://www.aypf.org/ documents/092409CareerAcademiesPolicyPaper.pdf.
Carl D. Perkins Career and Technical Education Improvement Act of 2006. Pub. L. No. 109–270, 120 Stat. 683.
Carl D. Perkins Vocational and Applied Technology Education Amendments of 1998. Pub. L. No. 105–332, 112 Stat. 3076.
Dayton, C., Weisberg, A., and Stern, D. (1989). California Partnership Academies: 1987–88 evaluation report. Berkeley, CA: University of California, Policy Analysis for California Education.
Elliott, M.N., and Hanser, L. (2002). Career academies: additional evidence of positive student outcomes. Journal of Education for Students Placed At Risk, 7(1), 71–90.
Florida Department of Education. (n.d.). Energy career cluster. Retrieved June 15, 2010, from http://www.fldoe. org/workforce/programs/energy.asp?style=print.
Florida Department of Education. (2005). FCAT handbook—a resource for educators. Retrieved August 4, 2010, from http://fcat.fldoe.org/handbk/complete.pdf.
Florida Department of Education. (2006a). Florida’s career academies, 2006–07. Retrieved October 1, 2009, from http://www.fldoe.org/workforce/pdf/ FloridasCareerAcadamies06-07.pdf.
Florida Department of Education. (2006b). Identifying career academies and reporting career academy student information: technical assistance paper. Retrieved
October 1, 2009, from http://www.fldoe.org/workforce/ careeracademies/pdf/ca_ta_90606.pdf.
Florida Department of Education. (2007a). Student data file. Received from PK–20 Education Data Warehouse, March 6, 2009.
Florida Department of Education. (2007b). Master school identification file. Received from Rhonda Forbes, Program Specialist, Florida Department of Education, Office of Education Information and Accountability Services, September 30, 2009.
Florida Department of Education. (2009). Career and professional academy enrollment and performance report 2008–09. Retrieved June 14, 2010, from http://www. fldoe.org/workforce/pdf/cpaepr.pdf.
Florida Legislature. (2007a). S1232: Career and Professional Education Act of 2007, Section 1003.492(2). Retrieved June 17, 2010, from http://www.flsenate.gov/statutes/ index.cfm?App_mode=Display_Statute&Search_ String=&URL=Ch1003/SEC492.HTM&Title=->2007 ->Ch1003->Section%20492#1003.492.
Florida Legislature. (2007b). S1232: Career and Professional Education Act of 2007, Section 1003.493. Retrieved June 17, 2010, from http://www.flsenate.gov/statutes/index. cfm?App_mode=Display_Statute&Search_String= &URL=Ch1003/SEC493.HTM&Title=->2007->Ch1003 ->Section%20493#1003.493.
Florida Office of Program Policy Analysis and Government Accountability. (2006). More than half of the state’s school districts have career academies, most operating in 2004–05 incorporated nationally recognized core elements (Report 06-55). Retrieved June 15, 2010, from http://www.oppaga.state.fl.us/MonitorDocs/Reports/ pdf/0655rpt.pdf.
Florida Office of Program Policy Analysis and Government Accountability. (2008). Legislature overhauled Florida’s system of career and professional academies (Report 08-59). Retrieved October 1, 2009, from http://www. oppaga.state.fl.us/reports/pdf/0859rpt.pdf.

24 characTeriSTicS of career academieS in 12 florida School diSTricTS
Hanser, L., and Stasz, C. (1999, April). The effects of enrollment in the Transportation Career Academy Program on student outcomes. Paper presented at the annual meeting of the American Educational Research Association, Montreal, Quebec.
Kemple, J.J. (2004). Career academies: impacts on labor market outcomes and educational attainment. New York: MDRC.
Kemple, J.J., and Willner, C.J. (2008). Career academies: long-term impacts on labor market outcomes, educational attainment, and transitions to adulthood. New York: MDRC.
Linnehan, F. (1996). Measuring the effectiveness of a career academy program from an employer’s perspective. Educational Evaluation and Policy Analysis, 18(1), 73–89.
Maxwell, N.L. (2001). Step to college: moving from the high school career academy through the four-year university. Evaluation Review, 25(6), 619–654.
Raby, M. (1995). The career academies. In W.N. Grubb (Ed.), Education through occupations in American high schools. New York: Teachers College Press.
Reller, D. (1984). The peninsula academies: final technical evaluation report. Palo Alto, CA: American Institutes for Research.
Seastrom, M. (2003). NCES statistical standards (NCES 2003601). Washington, DC: U.S. Department of Education.
States’ Career Clusters Initiative. (n.d.). Career clusters: a plan for education for a global economy. Retrieved August 4, 2010, from http://www.careerclusters.org/ resources/publications/Career_Cluster_Research_ Brief.pdf.
States’ Career Clusters Initiative. (2010). The 16 career clusters. Retrieved June 14, 2010, from http://www. careerclusters.org/16clusters.cfm.
Stern, D., Dayton, C., Paik, I., and Weisberg, A. (1989). Benefits and costs of dropout prevention in a high school program combining academic and vocational education: third-year results from replications of the California Partnership Academies. Educational Evaluation and Policy Analysis, 11(4), 405–416.
Stern, D., Dayton, C., and Raby, M. (2000). Career academies: building blocks for reconstructing American high schools. Berkeley, CA: University of California, Career Academy Support Network. (ERIC ED455445).
Stern, D., Raby, M., and Dayton, C. (1992). Career academies: partnerships for reconstructing American high schools. San Francisco, CA: Jossey-Bass.
U.S. Department of Education, National Center for Education Statistics. (2007). Common Core of Data. Local Education Agency Universe Survey, Year 2006–07 v.1c. Retrieved December 30, 2009 from http://nces.ed.gov/ ccd/.