characteristics of bus rapid transit for decision- making ...€¦ · planning 8 welcome new ......
TRANSCRIPT

continued on p.2
4 From shop floor to classroom door: Partnering for excellence
5 National Transit Database Sampling Menu developed
Vol 19. No 2. 2009
7 Best practices in transit service planning
8 Welcome new faculty
9 Customizing the TRIMMS© Model
11 FDOT/FPTA/CUTR Workshop
12 CUTR honors Jim Hargrett, Jr.
Characteristics of Bus Rapid Transit for Decision-Making updated
The 2009 Characteristics of Bus Rapid Transit for Decision-Making (CBRT) report was pre-pared by CUTR’s National Bus Rapid Transit
Institute (NBRTI) to provide transportation planners and decision-makers with basic information and data to support the development and evaluation of bus rapid transit concepts as one of many options during alterna-tives analyses and subsequent project planning. The re-port provides information on BRT systems in a single, easy-to-use reference tool for transportation planners in selecting from the large array of BRT elements and integrating them into comprehensive systems.
The report explores BRT through a progression of three different perspectives. First, seven major elements of BRT are presented along with their respective features and attributes. Second, the BRT elements are related to attributes of system performance. Finally, the benefits of BRT systems are discussed. This order of the discussion suggests the relationship between BRT elements, system performance, and system benefits. BRT systems are con-structed by choosing and integrating among BRT elements. The integration of elements improves system performance and improves the experience for customers. Improvements
to system performance (in combination with features of BRT elements) generate benefits to transit agencies and communities.

CUTRlines, Vol. 19, No. 2, 20092
For more information, contact:Dr. Edward A. Mierzejewski, Director, CUTR
College of Engineering, University of South Florida4202 E. Fowler Ave., CUT100, Tampa, FL 33620
(813) 974-3120, fax 974-5168E-mail: [email protected] www.cutr.usf.edu
CUTR was created to find cost-effective, state-of-the-art solutions to transportation problems. CUTR’s expertise in policy analysis, planning,
engineering, economics, geography, safety, and communications offers in-novative solutions to public and private sector organizations nationwide.
Vol. 19, No. 2, 2009
CUTRlines is produced three times per year by the Center for Urban Transportation Research (CUTR) at the University of South Florida’s
College of Engineering to inform the public and private sectors about its research and professional activities.
Editor: Ed Mierzejewski Designer: Wendy Teague© CUTR 2009
CUTRlines
One of the Federal Transit Administration’s (FTA) objec-tives is to provide local and state officials with the infor-mation they need to make informed transit investment decisions. The report describes the physical, operational, cost, performance, and potential benefits of BRT’s elements, both individually and combined as integrated systems. Its intended audience includes urban transportation profes-sionals and officials involved in developing and evaluating high performance transit systems, of which BRT is one alternative.
What is BRT?BRT is flexible, high-performance rapid transit mode that combines a variety of physical, operating, and system ele-ments into a permanently-integrated system with a quality image and unique identity. It encompasses a wide variety of applications, each one tailored to a particular set of travel markets and physical environments. Its flexibility derives from the facts that BRT vehicles (e.g., buses, specialized BRT vehicles) can travel anywhere there is pavement and that BRT’s basic service unit, a single vehicle, is relatively small compared to train-based rapid transit modes. A given BRT corridor application might encompass route segments where vehicles operate both in mixed traffic and on a dedi-cated, fully grade-separated transitway with major stations. BRT is an integrated system that is designated to improve the speed, reliability, and identity of bus transit.
BRT’s inherent flexibility means that no two BRT systems will look exactly the same within a given region, let alone between two different metropolitan areas. There is an exten-sive body of information and data describing each of BRT’s elements and a growing body of literature on the cumulative impacts of packaging multiple elements into integrated BRT systems. Since the publication of the first edition of Charac-teristics of Bus Rapid Transit for Decision-Making in 2004, the body of experience with BRT both in the United States and throughout the world has grown. Information from more of these systems is presented in the 2009 edition.
Intended Use of CBRTThe purpose of the CBRT report is to pro-vide a useful reference for transit and transpor-tation planning officials involved in both sketch planning and detailed alternatives analyses. The report provides a detailed overview of BRT’s seven basic elements and the costs and benefits of combin-ing them in different ways. It provides useful information to planners and decision-makers on each element and how the elements might be packaged into an integrated system to produce the maximum benefits. The report is meant to provide a description of the possibilities that BRT provides and the experience of various BRT systems around the world. As a description of practice, the CBRT report is not intended to prescribe solutions for local communities interested in implementing BRT; that task is left to the many industry guidance documents. The data provided in

CUTRlines, Vol. 19, No. 2, 2009 3
this report also can be used to assess the reasonableness of cost estimates and ridership forecasts prepared as part of FTA alternative analyses through detailed engineering studies, ridership projections, and cost modeling. The report provides information that can be used as a baseline to assess the reasonableness of forecasts produced from these require-ments. In cases where more detailed alternatives develop-ment and analysis are needed before decision-makers can
reach closure, the CBRT report provides practitioners with benchmark data to assess the reasonability and reliability of the benefits, costs, and impact assessment results produced by more detailed analysis tools such as travel forecasting, multi-modal traffic simulation, and fully allocated or incre-mental operating and maintenance cost models.
New Content in CBRT 2009The 2009 edition of the CBRT report incorporates a number of revisions and additions since the original 2004 edition. Throughout the document, more information from BRT systems is presented to reflect the growing experience with BRT systems and their improved performance and the benefits they generate for transit systems and their communities:
Updated and more detailed data and information on BRT �
systems presented in the 2004 edition, including evalu-ations of systems in Boston, Honolulu, Oakland, Las Vegas, and Los AngelesInformation from systems that have recently begun op- �
erations in the United StatesInformation from international BRT systems, including �
the results of data collection efforts in Australia, Asia, Europe, and Latin America. While not comprehensive, this data collection effort extends the exchange of infor-mation of BRT systems across the globe, creating a fuller picture of the relationships explored in the report
Other changes in the document include:
Information on branding elements as a major element �
of BRTInformation on accessibility as a performance attribute �
New case studies (system performance profiles), research �
summaries, and data analysis of data relating BRT ele-ments and performance and benefits
For more information on the CBRT report or to download the pdf version, visit www.nbrti.org.

CUTRlines, Vol. 19, No. 2, 20094
Vehicle maintenance training is vital to the success of any transit organization. Skilled technicians contribute to the overall health of a transit agency
by way of bus on-time performance levels, customer ser-vice, and cost savings. Unfortunately, these transit-specif-ic technical skills become perishable through technologi-cal advancements and dormancy. It is this realization that propelled the Transit Maintenance Analysis and Resource Center (TMAARC), housed at CUTR, to partner with Hillsborough Community College (HCC) in creating the Certified Transit Techni-cian (CTT) curriculum.
The Florida Department of Education approved the Certified Transit Technician curriculum as a Post-Sec-ondary Adult Vocational (PSAV) program in March 2009. PSAV programs are designed to provide both education and technical skills training to prepare adult students for today’s workforce. These programs also are designed to meet the demands for trained workers in occupations that require more than a high school diploma but less than a four-year degree. The CTT curriculum comprises 15 modules that cover major systems on a transit bus, and instruction is split between classroom and hands-on training. Classroom instruction will be given at one of FDOT’s Regional Train-ing Centers located around the state; hands-on training will be conducted at the student’s workplace.
The training must align with the job requirements at transit properties for the program to be effective. The Division of
Workforce Education has revised the career and technical
From shop floor to classroom door: Partnering for excellence
education program curriculum frameworks, and a steering committee of business and educational leaders will continue to develop and revise these frameworks to reflect current technology. All PSAV curriculum frameworks are aligned to the 16 Career Clusters delineated by the U.S. Department of Education; the CTT program is part of the Transportation, Distribution and Logistics cluster.
In addition to providing training to existing workers, community colleges and vocational-technical career cen-
ters examine the industry employment projections compiled by the Agency for Workforce Innovation (AWI) and tailor their cer-tificate programs to both local labor market and com-munity need. The annual need for skilled technicians in both bus and automotive classifications within the state is illustrated in the accompanying table.
Important to note are the vacancies created by tech-nicians separating from the
workforce. Retirement is among the reasons that increase this number, draining the industry of valuable experience. The partnership recognized that a comprehensive training program must address recruitment, incumbency, and reten-tion if value was to be added to the industry as a whole. The PSAV was designed to provide a clear path toward certification for those currently employed in the workplace and young adults that may be considering a career in transit maintenance. In addressing the retention issue, the partner-ship agreed to offer an avenue for advancement to those technicians desiring management training. This training will be offered by way of an articulation agreement.
Grand opening of Votran’s Regional Training Center
continued on p.10

CUTRlines, Vol. 19, No. 2, 2009 5
As a condition of getting federal funds, transit agen-cies report the annual use of their service to the Federal Transit Administration (FTA) through its
National Transit Database in terms of both boardings and the cumulative miles their passengers travel or passenger miles. They often count every passenger who uses their service and report the resulting 100% count for boardings, but generally estimate passenger miles through random sampling. Estimating passenger miles through random sampling is costly; it includes not only the cost of develop-ing data-collection plans, but also the significantly higher cost of collecting the sample data in terms of how many passengers use their service and where they use it. Agen-cies want to minimize these data collection costs, but, at the same time, their estimates must meet the minimum accuracy requirements that FTA imposes —there should be at least a 95% chance that the errors from sampling in an estimate do not exceed 10%.
To help transit agencies minimize their costs while ensur-ing the minimum accuracy requirements, CUTR recently developed the National Transit Database Sampling Manual. For three decades, FTA has provided guidance for transit agencies in Circulars 2710.1A and 2710.2A. However, previous research by CUTR revealed that the current guid-ance would better help transit agencies if it were updated with three essential features: providing a range of options on modern sampling techniques for data-collection plans, customizing data-collection plans to agency operating conditions, and being comprehensive for wide applicability. FTA asked CUTR to develop new guidance that includes these features.
Written in non-technical language and in a question-and-answer format, the new guidance in the National Transit Database Sampling Manual is comprehensive, covers all modes, and provides information for:
directly-operated and purchased services �
existing and new services �
100% counts and sampling-based estimates �
National Transit Database Sampling Manual developed
annual and monthly data �
sampling years and non-sampling years �
users of Circular 2710.1A plans and other agencies �
In addition, all three steps of estimating annual data are included—getting a data-collection plan, collecting sample data, and estimating boardings and passenger miles—as are procedures for the development, certification, and updating of data-collection plans and for identifying and correcting potential errors in sample data.
The new guidance provides six modern sampling techniques for agencies to consider in developing data-collection plans. These techniques vary widely in their potential for agen-cies to reduce the amount of sampling while meeting the minimum accuracy requirements. This variation results from differences in both how sampling is done and how estimation must be done when applying these sampling techniques:
Sampling may be done with or without service grouping. �
Sampling without grouping involves every unit operated during a given period having the same chance of being selected at random. Sampling with grouping involves dividing an agency’s service into two or more groups and sampling each group separately. For bus services, grouping the service into short, medium, and long routes is an example. When done appropriately, grouping should reduce the amount of sampling. Estimation may be done with one of three methods. The �
basic estimation method does not require a 100% count of boardings and is used for estimating both boardings and passenger miles. For bus services, this method involves multiplying the averages from a sample collected for the National Transit Database by a known quantity to estimate annual totals. The averages are boardings and passenger miles per one-way bus trip, and the known

CUTRlines, Vol. 19, No. 2, 20096
quantity is the total number of one-way bus trips actu-ally operated in a year. Circular 2710.1A is based on this method. The other two estimation methods are expected to reduce the amount of sampling over the basic estima-tion method in most cases. Both of them requires a 100% count of boardings to estimate annual passenger miles; they differ in the level at which a 100% count of board-ings is required—systemwide or route level. Circular 2710.2A is based on the estimation method that requires systemwide boardings.
The new guidance is accompanied by an Excel template that is designed for transit agencies to develop data-collection plans that are customized to their own operating condi-tions. The template requires sample data from an agency’s service in terms of summary information for each unit in the sample. For example, if the sampling unit is one-way vehicle trips, the sample data to be entered include board-ings and passenger miles and identification items (e.g., group affiliation) for each one-way vehicle trip in the sample. Once the sample data are entered, the template automati-cally produces the minimum sample size for meeting the minimum accuracy requirements. One minimum sample size is produced for each of the six sampling techniques applicable to the case and for each of three sampling fre-quencies—quarterly, monthly, or weekly. Transit agencies may choose the minimum sample size for any combination of the applicable sampling techniques and the three sam-pling frequencies.
The accompanying table shows an exam-ple of what the Excel template would produce for a case where all six sampling techniques are applicable with three bus service groups—short, medium, and long routes. With this output, an agency can easily compare the relative capability of the applicable sampling techniques to reduce the amount of sampling for each sampling frequency.
This template was applied to the actual sample data col-lected by a range of agencies for the National Transit Database for a range of modes and services. The potential cost savings from using the six sampling techniques are proportionally very large. The actual cost savings, how-ever, are specific to individual cases. The Excel template removes the technical barrier for agencies to consider these sampling techniques and reduces the cost for exploring them. Agencies are encouraged to take advantage of this cost-effective tool in seeking the technique that reduces the amount of sampling for their mode, operating conditions, and administrative circumstances.
CUTR’s National Center for Transit Research sponsored this study with funding through a grant from the Florida Department of Transportation and the U.S. Department of Transportation. FTA has expressed interested in formally adopting a shortened version of the new guidance. The new guidance and related template can be found in “Develop-ment of Comprehensive Guidance on Obtaining Service Consumed Data for NTD” at http://www.nctr.usf.edu/publications.htm#nctrfinalreports.
For more information, contact CUTR Senior Research Asso-ciate Xuehao Chu, [email protected], (813) 974-9831.
Short
RoutesMedium Routes
Long Routes
1. Annual Frequency a) No 100% Boardings 306 306 17 151 52 220 b) Systemwide Boardings 61 61 10 29 10 49 c) Route-Level Boardings 102 102 10 32 11 53
2. Quarterly Frequency a) No 100% Boardings 77 308 5 38 13 224 b) Systemwide Boardings 16 64 3 8 3 56 c) Route-Level Boardings 26 104 3 8 3 56
3. Monthly Frequency a) No 100% Boardings 26 312 2 13 5 240 b) Systemwide Boardings 6 72 1 3 1 60 c) Route-Level Boardings 9 108 1 3 1 60
4. Weekly Frequency a) No 100% Boardings 6 312 1 3 1 260 b) Systemwide Boardings 2 104 1 1 1 156 c) Route-Level Boardings 2 104 1 1 1 156
AnnualRealizedSampleSize
SampleSize by
Frequency
Without Grouping With GroupingSample Size by Frequency
and by Group Annual
RealizedSampleSize

CUTRlines, Vol. 19, No. 2, 2009 7
The provision of cost-effective bus transit service is the basic premise upon which transit service is de-veloped and the goal that all public transportations
agencies strive to achieve. To attain this goal, public transit agencies must design their services around clear and defined principles, as well as a process to monitor the results achieved and to respond accordingly. This requires service design stan-dards, an effective performance measurement system, and a systematic and continuous service evaluation methodology.
Through the National Center for Transit Research (NCTR), CUTR was contracted by the Florida Department of Transportation to provide a blueprint around which a public transit agency could approach transit service planning. This included pro-viding a structured approach to allow transit service plan-ners to react in an objective manner to requests for new service, modifications to services, expansion of ser-vices, and reductions of ser-vice during times of budget restrictions. The focus of this research project was limited to fixed-route bus service.
The objective of this research was to identify existing best practices and develop a generic model approach that could be adapted and used by all public transit agencies for fixed-route bus transit service planning, specifically including service design standards, service performance measurements, and a standard service evaluation method-ology. The focus of the research was on short-term transit service planning, including its relationship to efficient route planning and scheduling. The results provide a summary of best practices and a “template” process tool that can be adapted and customized for use by all sizes of public transit agencies. The end product permits public transit agencies to have transit service planning reference tools and processes that can be locally customized to account for local operating environments and policies.
Best practices in transit service planningThe following provides an overview of the three general transit service planning topics used to organize the findings and recommendations of the project report: Service Design Standards, Performance Measurement and Standards and Service Evaluation Methodology.
Service Design StandardsService design standards refer to specific goals, objectives, or policies that an agency sets for itself in various areas of
service design. The stan-dards exist in many vari-eties, spanning all facets of a transit system. Based on common threads that emerged after a review of industry literature, the following six areas were explored:
Classification Systems �
or Service Types are often used in conjunction with the other five areas to provide variable standards based on the type or classification of service.
Service Availability � standards address service area char-acteristics, service coverage, route layout and design, and stop location and spacing. Travel Time and Capacity � standards address the frequen-cy, directness, span of service, and passenger loading. Service Delivery � standards address on-time performance, passenger shelters, transit amenities, customer service, and safety issues. Vehicle Standards � address the assignment of vehicles, utilization and efficiency, and reliability and condition. Service Equity � addresses FTA Title VI requirements for standards.
photo courtesy of www.seefloridago.com
CUTRlines, Vol. 19, No. 2, 20098
Performance MeasurementAgencies collect performance measures at a system and individual route level for a variety of reasons that span all departments of an agency, from finance to planning to management, and even impact outside agencies such as the local Metropolitan Planning Organization and Regional Planning Councils.
On a system level, performance measures are used to:
submit to the National Transit Database as a requirement �
to receive funding from FTAassist agencies in monitoring the various trends of the �
agency for operational and financial measures and also to compare their performance versus other peer agenciesdefine service design standards �
On an individual route level, performance measures are used to:
perform a Comprehensive Operations Analysis (COA) �
define performance standards �
monitor performance to measure against the system aver- �
age or defined standardsFor the purpose of transit service planning, tracking perfor-mance at the individual route level enables transit planners to make good decisions concerning transit service. The research report described in detail the performance measures that are commonly used in route level transit service planning.
Service Evaluation MethodologyThe final step in the process was to examine how transit agencies use performance data and service standards for
monitoring performance and for making service planning decisions. Of specific importance to service planners are performance measures that track the productivity and effi-ciencies of individual routes in the system.
A strong performance monitoring program ensures that ser-vice quality will be as high as possible. Service quality and quantity by route/service should be evaluated on a regular basis. Larger systems may evaluate their performance on a quarterly or even monthly basis, but smaller systems may find a semi-annual or annual report adequate.
In addition to full-scale service evaluation, it is common practice for agencies to track performance data on a monthly basis, especially ridership data. This aids in the discovery of poorly performing services as well as the identification of services that are performing well. The former may be candidates for service revision or elimination, while the latter may benefit from service improvements. Continuous monitoring of ridership data will provide the agency with the capability to track long-term changes in the system’s performance and identify trends, which will lead to better service planning decisions.
Finally, based on the data collection and service evaluation, transit agencies can then develop some specific service evaluation policies to address substandard performance (also known as remedial analysis).
For further information on this study, contact CUTR Research Associate Mark Mistretta, [email protected], (813) 974-9758. To view or download the project report, “Best Practices in Transit Service Planning,” visit the NCTR publications web page at www.nctr.cutr.usf.edu/publications.htm.
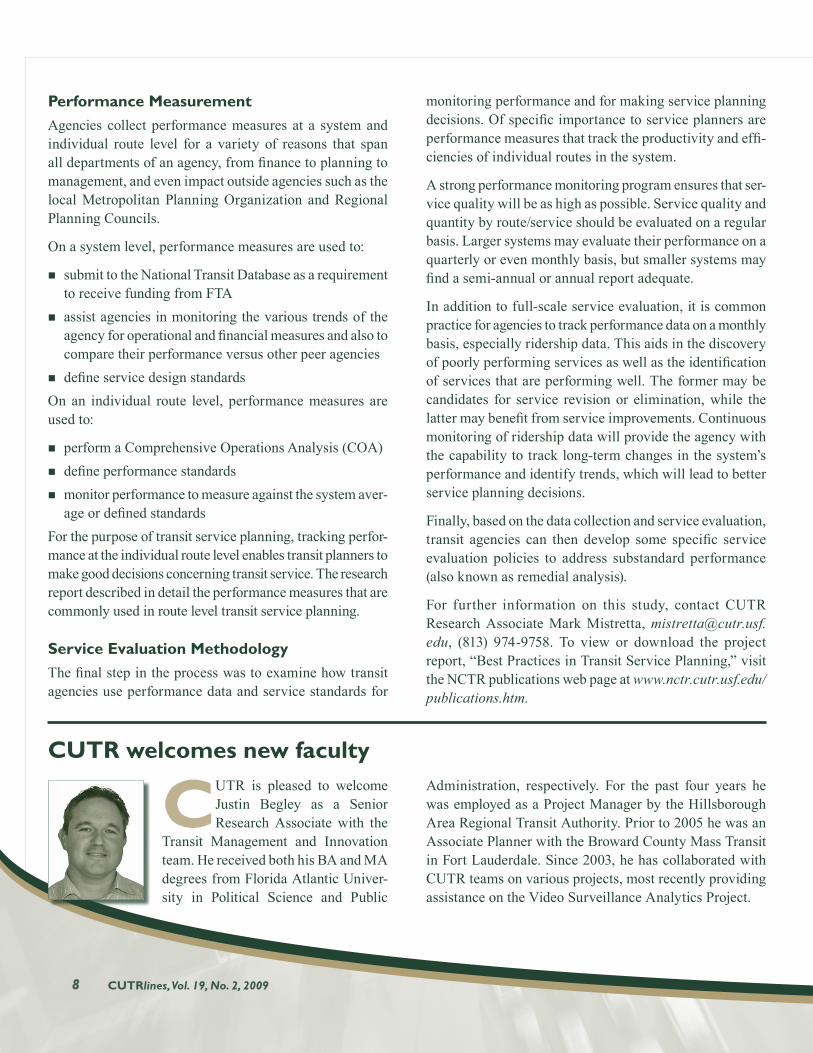
CUTR is pleased to welcome Justin Begley as a Senior Research Associate with the
Transit Management and Innovation team. He received both his BA and MA degrees from Florida Atlantic Univer-sity in Political Science and Public
Administration, respectively. For the past four years he was employed as a Project Manager by the Hillsborough Area Regional Transit Authority. Prior to 2005 he was an Associate Planner with the Broward County Mass Transit in Fort Lauderdale. Since 2003, he has collaborated with CUTR teams on various projects, most recently providing assistance on the Video Surveillance Analytics Project.
CUTR welcomes new faculty

CUTRlines, Vol. 19, No. 2, 2009 9
Faced with limited transportation resources and in-creasing attention to the linkage of transportation to climate and energy concerns, more attention is being
placed on changing transportation policy to be more perfor-mance-driven. For example, the Federal Highway Admin-istration’s Congestion Mitigation and Air Quality (CMAQ) Improvement Program provides explicit guidelines for program effectiveness assessment and benchmarking. The program calls for quantitative analysis of benefits and dis-benefits resulting from emission reduction strategies. In a partial attempt to quantify the net social benefits of con-gestion reduction strategies, an increasing number of state, regional, and local agencies are attempting to measure the costs and benefits of transportation demand management (TDM) initiatives. TDM strategies seek to influence travel behavior by mode, cost, route, and time, and include, but are not limited to, ridematching for carpools and vanpools, tele-work, employer-provided transit discounts, guaranteed ride home programs, and parking management. The transporta-tion community needs new tools to help these programs and strategies to work.
With funding from the Florida Department of Trans-portation and the U.S. Department of Transporta-tion, CUTR’s National Center for Transit Research recently developed the TRIMMS© (Trip Reduction Impacts for Mobility Management Strategies) model. TRIMMS© is a Visual Basic application spreadsheet model that estimates the impacts of a broad range of TDM initiatives and provides program cost-effec-tiveness measures such as net program benefits and benefit-to-cost ratio analysis. TRIMMS© calculates the reduction in miles driven and air pollution from changes in travel behavior. For example, TRIMMS© evaluates strategies that change the cost of travel, such as bus passes paid by employers and employee parking costs. The model also assesses how changes in travel times and working from home affect travel behavior.
Guidance for customizing the TRIMMS© Model
This project expanded the initial model’s capabilities and improved its ease of implementation. It provided the research and documentation necessary to help professionals use the model by selecting the appropriate cost parameters, providing referenced sources where such parameters can be obtained, and offering general guidance on how to incor-porate data already at their disposal.
The project’s primary objective was to help cities identify demand management programs and strategies that will provide the most benefits relative to its costs. Secondary objectives include improving the model’s predictive capa-bilities, addressing the uncertainty in forecasting changes in travel behavior, and allowing it to be used at the regional as well as employer-site level.
The model new version, TRIMMS© 2.0, makes several notable improvements over the previous version. Users now can tailor input to their city, which will help cities identify programs that will provide the most benefits relative to their costs. Recognizing that there is uncertainty in the value of inputs such as cost of accidents, the model now includes a

CUTRlines, Vol. 19, No. 2, 200910
Under these agreements, both at the state and local levels, community colleges award credit for PSAV certificates. These credit hours are then applied toward an Associate in Science (AS) or Associate in Applied Science (AAS) degree. The CTT program will be articulated at the 33 credit hour level. The remaining 27 credit hours needed to obtain an Associate in Applied Science degree in Industrial Management - Transit Technician will be offered through HCC as traditional coursework. These nine classes will include general education requirements, such as Freshman English and Introduction to Mathematics, and specific program required courses, such as Principals of Management and Introduction to Computers. Many of the courses currently are offered online, and the goal is to offer all of the courses in an online format as the program develops. This will allow technicians from around the state to complete their AAS degree from where they reside.
TMAARC’s guiding force, the Florida Transit Maintenance Consortium, has worked tirelessly over the years advocating the need for recognition of technical expertise displayed by its members’ technical workforce. Certification and credit for both classroom and on-the-job technical training were frequent topics that received considerable discussion and effort. Leveraging the resources of several State agencies and universities has turned their efforts into an educational program that will help train Florida’s transit maintenance community for many years to come.
For more information, contact CUTR Senior Research Associate Ed Bart, [email protected].
Average Annual Openings
2008 2016
Annual
Change Due To Growth
Due To Separations Total
Bus & Truck Mechanics, Diesel Engine Specialists 13,918 15,352 1.29% 179 295 474
Automotive Service Technicians & Mechanics 53,448 60,240 1.59% 849 1038 1,887
Employment
Source: AWI, Florida Jobs by Industry
Florida’s Need for Skilled Bus and Automotive Technicians
sensitivity analysis component. This feature is not present in any other currently-available spreadsheet application of this kind. Using random sampling of inputs, the user will obtain probabilities of different possible outcomes occurring. With this information, communities can estimate the likelihood that a particular mix of TDM strategies is a good value for the money. Sensitivity analysis also can help practitioners estimate the probability that program benefit-to-cost ratios will at least be greater than some predetermined benchmarking value.
The model enhancements allow a wider range of default values needed for the analysis, specifying under what condi-tions the values can be considered reliable or appropriate.
Specifically, the model provides default parameters for 85 metropolitan statistical areas. Furthermore, this research
provides sample data collection and mea-surement methods to guide agencies that want to tailor input parameters to their areas. This will improve the ability of TDM practitioners to identify and put in place TDM programs that can produce the highest estimated social benefits. Finally, the simulation module should allow com-munities conducting TDM evaluations to meet CMAQ Improvement Program requirements for program effectiveness assessment and benchmarking.
For more information on this research, contact CUTR Senior Research Associate
Sisinnio Concas, [email protected], (813) 974-7760.
From shop floor to classroom door—continued from p.4
CUTRlines, Vol. 19, No. 2, 2009 11
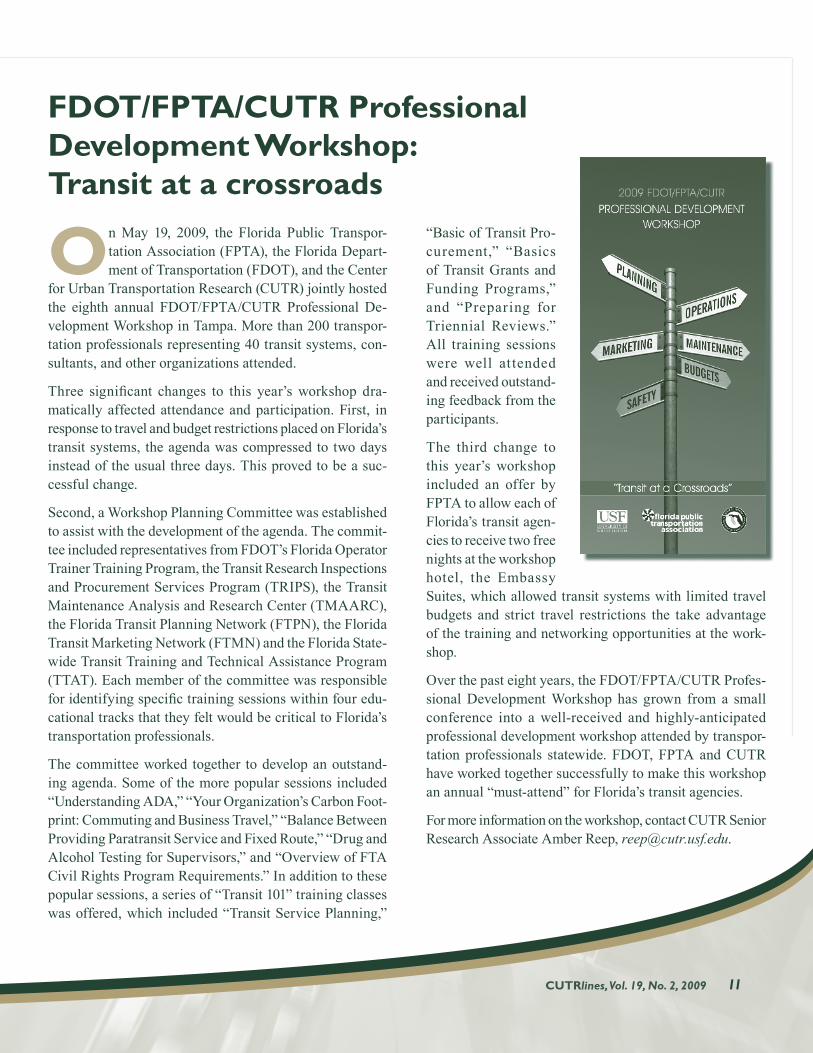
FDOT/FPTA/CUTR Professional Development Workshop: Transit at a crossroads
On May 19, 2009, the Florida Public Transpor-tation Association (FPTA), the Florida Depart-ment of Transportation (FDOT), and the Center
for Urban Transportation Research (CUTR) jointly hosted the eighth annual FDOT/FPTA/CUTR Professional De-velopment Workshop in Tampa. More than 200 transpor-tation professionals representing 40 transit systems, con-sultants, and other organizations attended.
Three significant changes to this year’s workshop dra-matically affected attendance and participation. First, in response to travel and budget restrictions placed on Florida’s transit systems, the agenda was compressed to two days instead of the usual three days. This proved to be a suc-cessful change.
Second, a Workshop Planning Committee was established to assist with the development of the agenda. The commit-tee included representatives from FDOT’s Florida Operator Trainer Training Program, the Transit Research Inspections and Procurement Services Program (TRIPS), the Transit Maintenance Analysis and Research Center (TMAARC), the Florida Transit Planning Network (FTPN), the Florida Transit Marketing Network (FTMN) and the Florida State-wide Transit Training and Technical Assistance Program (TTAT). Each member of the committee was responsible for identifying specific training sessions within four edu-cational tracks that they felt would be critical to Florida’s transportation professionals.
The committee worked together to develop an outstand-ing agenda. Some of the more popular sessions included “Understanding ADA,” “Your Organization’s Carbon Foot-print: Commuting and Business Travel,” “Balance Between Providing Paratransit Service and Fixed Route,” “Drug and Alcohol Testing for Supervisors,” and “Overview of FTA Civil Rights Program Requirements.” In addition to these popular sessions, a series of “Transit 101” training classes was offered, which included “Transit Service Planning,”
“Basic of Transit Pro-curement,” “Basics of Transit Grants and Funding Programs,” and “Preparing for Triennial Reviews.” All training sessions were well attended and received outstand-ing feedback from the participants.
The third change to this year’s workshop included an offer by FPTA to allow each of Florida’s transit agen-cies to receive two free nights at the workshop hotel, the Embassy Suites, which allowed transit systems with limited travel budgets and strict travel restrictions the take advantage of the training and networking opportunities at the work-shop.
Over the past eight years, the FDOT/FPTA/CUTR Profes-sional Development Workshop has grown from a small conference into a well-received and highly-anticipated professional development workshop attended by transpor-tation professionals statewide. FDOT, FPTA and CUTR have worked together successfully to make this workshop an annual “must-attend” for Florida’s transit agencies.
For more information on the workshop, contact CUTR Senior Research Associate Amber Reep, [email protected].

Center for Urban Transportation ResearchCollege of Engineering, University of South Florida4202 E. Fowler Avenue, CUT100Tampa, FL 33620-5375
NON-PROFIT ORGANIzATION
U.S. POSTAGE PAID
TAMPA, FL PERMIT NO. 257
In recognition of his outstanding contribution to addressing Florida’s transportation needs, CUTR is pleased to recognize James T. “Jim” Hargrett,
Jr., with the 2009 CUTR Transportation Achievement Award.
Mr. Hargrett, a native of Tampa, holds a BA from More-house College and an MBA from Atlanta University. He has served as a bank examiner for the US Comptrollers Office, as the Director of Leadership Development for the Tampa Urban League and as Chief Executive Offi-cer of a local financial institution. He is a successful businessman and is the Chairman and President of Bay Area Concessions, Inc.
Mr. Hargrett had a distinguished legislative career, hav-ing served five terms in the Florida House of Representa-tives and two terms in the Florida Senate. While in the Senate, he served as Chair of the Transportation Com-mittee and Chair of the International Trade, Economic Development & Tourism Committee. He also served as Chairman of the Florida Conference of Black State Leg-islators and the Chairman of the Hillsborough County Legislative Delegation. While in the House of Repre-sentatives, Mr. Hargrett served as the first Chairman
of the newly-created Committee on Public Transportation and was instrumental in the creation of the Florida State Inter-modal System (SIS). He is the past Chair-man of the Tampa Hillsborough County Expressway Authority and currently serves on the Board of TEAM Florida. In 2007, Mr. Hargrett was elected into the Flor-ida Public Transportation Association Hall of Fame.
He and his wife Berlyn are blessed with two wonder-ful children, Crystal and James III. It is indeed with a great deal of pleasure that CUTR recognizes Senator Hargrett with our 2009 CUTR Transportation Achieve-ment Award.
The 2009 CUTR Transportation Achievement Award Dinner will be held on October 28th, 2009, at the USF Marshall Student Center on the Tampa campus. For further information, please contact Lynn Federspiel at (813) 974-9759, [email protected].
2009 CUTR Transportation Achievement Award honors Senator James T. Hargrett, Jr.
Senator James T. Hargrett, Jr.