characteristics and pay of federal civilian employees · versity’s robert f. wagner graduate...
TRANSCRIPT

CONGRESS OF THE UNITED STATESCONGRESSIONAL BUDGET OFFICE
A
S T U D Y
MARCH 2007
Characteristics andPay of
Federal CivilianEmployees
CBO
© J
upite
rImag
es

Pub. No. 2839

CBO
Characteristics and Pay ofFederal Civilian Employees
March 2007
A
P A P E R
The Congress of th
e United States O Congressional Budget Office

Preface
Federal agencies, which are among the largest employers in the country, employ workers who have widely differing backgrounds and skills to fill a variety of governmental roles. This Congressional Budget Office (CBO) paper describes some of the characteristics of employees who currently make up the salaried full-time permanent federal civilian workforce, as well as selected attributes of such employees who enter and leave federal service. The paper also pro-vides information on the pay that those federal workers receive. The report was prepared at the request of the Ranking Member of the Subcommittee on Oversight of Government Man-agement, the Federal Workforce, and the District of Columbia of the Senate Homeland Secu-rity and Governmental Affairs Committee. In accordance with CBO’s mandate to provide impartial, objective analysis, this paper makes no recommendations.
Cary Elliott of CBO’s Microeconomic Studies Division wrote the paper under the supervision of Joseph Kile and David Moore. Rich Nelson, formerly of CBO, helped with research for the analysis. Adebayo Adedeji, Paula Burton, Molly Dahl, Arlene Holen, Donald Marron, and David Torregrosa of CBO commented on earlier drafts, as did Mark Musell of New York Uni-versity’s Robert F. Wagner Graduate School of Public Service. (The assistance of external reviewers implies no responsibility for the final product, which rests solely with CBO.)
Leah Mazade edited the paper, and Kate Kelly proofread it. Maureen Costantino designed the cover and prepared the report for publication. Lenny Skutnik printed the initial copies, Linda Schimmel coordinated the print distribution, and Simone Thomas prepared the electronic version for CBO’s Web site (www.cbo.gov).
Peter R. OrszagDirector
March 2007


Contents
Introduction and Summary 1
Characteristics of the Full-Time Permanent Federal CivilianWorkforce and Changes Over Time 3
Federal Workers in 2005 3
Trends 5
Accessions to and Separations from Federal Employment 7
The Characteristics of New Civil Servants 7
The Characteristics of Recently Separated Workers 7
The Pay of Full-Time Permanent Federal Civilian Employees 8
Pay Systems in the Federal Government 8
Comparing Pay Under GS and Non-GS Plans 9
Bonuses and Awards 10
Promotions, Quality Step Increases, and Intragovernmental Transfers 10
Appendix A: Supporting Tables 21
Appendix B: The Structure of Federal Compensation 27
Tables
1.
Characteristics of Salaried Full-Time Permanent Federal Civilian Employees, by Occupational Category, December 2005 122.
Average Pay for Full-Time Permanent Federal Civilian Employees, December 2005 133.
Awards Given to Salaried Full-Time Permanent Federal Civilian Employees, 2005 144.
Promotions Among Salaried Full-Time Permanent Federal Civilian Employees, by Occupational Category, 2005 145.
Intragovernmental Transfers Among Salaried Full-Time Permanent Federal Civilian Employees, by Occupational Category, 2001 to 2005 15
VI CHARACTERISTICS AND PAY OF FEDERAL CIVILIAN EMPLOYEES
A-1.
Total Number of Federal Civilian Employees, Selected Years, 1990 to 2005 22A-2.
Characteristics of Salaried Full-Time Permanent Federal Civilian Employees, Selected Years, 1975 to 2005 23A-3.
Selected Characteristics of New Salaried Full-Time Permanent Federal Civilian Employees Hired in 2005,by Occupational Category 24A-4.
Selected Characteristics of Salaried Full-Time Permanent Civilian Employees Who Left Federal Employment in 2005, by Occupational Category 25Figures
1.
Age Distribution and Years of Service of Salaried Full-Time Permanent Federal Civilian Employees, December 2005 162.
Number and Age Distribution of Salaried Full-Time Permanent Federal Civilian Employees, 1975 to 2005 173.
Educational Attainment of Salaried Full-Time Permanent Federal Civilian Employees, by Occupational Category, 1975 to 2005 184.
Number of Salaried Full-Time Permanent Federal Civilian Employees Newly Hired or Separated, 1990 to 2005 195.
Selected Characteristics of Salaried Full-Time Permanent Federal Civilian Employees Newly Hired or Separated, 1990 to 2005 20Boxes
1.
The Data for CBO’s Analysis 22.
Occupational Categories for Salaried Full-Time Permanent Federal Civilian Employees 43.
Comparing Federal and Private-Sector Workers 5Tables (Continued)

Characteristics and Pay ofFederal Civilian Employees
Introduction and SummaryToday, more than 100 federal agencies employ about 2.7 million civilian workers—or roughly 2 percent of the total U.S. workforce—in jobs representing more than 800 occupations.1 Those occupations generally require workers who have a broad complement of training, skills, and experience, and the federal government competes with other employers for individuals who possess the “right” mix of attributes. To better understand the char-acteristics of federal workers, the Congressional Budget Office (CBO) examined the attributes of a subset of the government’s civilian workforce: the roughly 1.4 million salaried workers—not including employees of the Postal Service—who fill full-time permanent positions in the executive branch.2 Basically the government’s white-collar employees, that group represented slightly more than one-half of all civilian workers in December 2005. (In this report, the terms “federal employees” and “civil servants” refer only to the employees in that group.) The analysis builds on CBO’s previous work on federal employment and pay.3
1. For data on the U.S. workforce, see Economic Report of the Presi-dent (February 2007), Table B-35, p. 273.
2. Besides employees of the Postal Service, the data exclude workers who hold part-time or temporary positions, employees who are not paid with appropriated funds, and workers in certain sensitive (national security) jobs. For additional details, see Box 1.
3. See, for example, Congressional Budget Office, Comparing the Pay of Federal and Nonfederal Law Enforcement Officers (August 2005), Comparing the Pay of Federal and Nonprofit Executives: An Update (July 2003), Measuring Differences Between Federal and Private Pay (November 2002), and Changes in Federal Civilian Employment: An Update (May 2001).
In this paper, three general areas are addressed. First, the report provides descriptive statistics on the age, educa-tional attainment, federal work experience, and demo-graphic characteristics of that group of federal employees and tracks changes in those attributes over time. Second, it presents data on the characteristics of such workers who have recently begun or left full-time federal employment and the trends in those characteristics over time. Third, it provides details on pay by occupational category for sala-ried full-time civil servants.
As the data and findings in this paper suggest, that por-tion of the federal workforce is characterized by diversity of people and occupations, changes over time, and com-plexity of pay structure. In particular:
B About two-thirds of the government’s salaried full-time civilian workers are employed in professional and administrative occupations, and that proportion has increased over time. On average, those employees are older, better educated, and more highly paid than fed-eral employees in those occupations in the past.
B A large proportion of current full-time permanent civilian workers have met the government’s require-ments for age and years of service and are eligible to retire.
B Recently hired full-time permanent federal workers tend to be more highly educated, on average, than either current employees or recent retirees. Similarly, full-time permanent employees who have resigned from federal service tend to be more highly educated than current employees, although not as highly edu-cated, on average, as newly hired workers.

2 CHARACTERISTICS AND PAY OF FEDERAL CIVILIAN EMPLOYEES
Box 1.
The Data for CBO’s AnalysisThis paper focuses on a subset of federal workers—salaried, full-time permanent federal employees—who numbered about 1.4 million as of December 2005. That portion of the total federal workforce (2.7 million people) basically represents the govern-ment’s white-collar employees.
Unless otherwise indicated, the statistics that this paper presents about that group of workers come from the Congressional Budget Office’s (CBO’s) tabulations of data from the Central Personnel Data Files (CPDF) maintained by the government’s Office of Personnel Management. The CPDF is the only comprehensive source of data on federal employees; it includes basic demographic information (age, race, sex, and education) and information about jobs (occupational categories, pay grades, and earnings). However, several groups of federal workers are excluded from the CPDF:
B The Postal Service’s more than 760,000 employees:
B Employees of a number of federal agencies—the Board of Governors of the Federal Reserve, the Central Intelligence and Defense Intelligence Agencies, the National Imagery and Mapping Agency, the national security agencies, the White House and Office of the Vice President, the Postal
Rate Commission, and the Tennessee Valley Authority;
B Members of the Public Health Service’s Commis-sioned Corps;
B Employees who are paid with nonappropriated funds (for example, employees of the military exchange system, whose salaries are supported by revenues from sales) and foreign nationalsoverseas; and
B The legislative and judicial branches of govern-ment (except for the Government Printing Office), the U.S. Tax Court, and some selected commissions. (See Table A-1 on page 22 for a breakdown of total federal employment.)
Two other groups of federal civilian workers—part-time and seasonal workers and trade, craft, and labor-ing employees who are paid under the Federal Wage System—are covered in the CPDF data, but the anal-ysis’s focus on salaried full-time employees led CBO to exclude them as well.1 Consequently, the findings noted in this paper do not necessarily extend to those excluded groups or to any of the groups listed above.
1. The Federal Wage System is a uniform pay-setting structure that covers such employees who are paid by the hour. For more details, see www.opm.gov/oca/wage/index.asp.
B The pay of about 80 percent of salaried full-time civil servants is determined by the federal government’s General Schedule (GS); the pay of the remaining 20 percent is governed by different systems. The aver-age pay of such workers who are not covered by the General Schedule is higher and ranges more widely, both overall and within broad occupational categories, than the pay of workers who are covered by the Gen-eral Schedule.
Systematic comparisons of full-time permanent federal employees with similar workers in the private sector are beyond the scope of this analysis. The paper presents some evidence, however, suggesting that the part of the federal workforce that is the focus of this report has a higher concentration—relative to the private sector—of jobs among management, professional, and related occu-pational categories. Correspondingly, because people in such occupations tend to be older, more experienced, and more highly educated, the average age and educational attainment of federal workers are higher than those of private-sector workers.

CHARACTERISTICS AND PAY OF FEDERAL CIVILIAN EMPLOYEES 3
Characteristics of the Full-TimePermanent Federal CivilianWorkforce and Changes Over TimeThe federal workforce has undergone substantial change in recent years. Once primarily made up of workers in clerical positions, today’s salaried full-time civil servants are more highly educated and include proportionately more professionals and administrators than in the past. (Box 1 briefly discusses the data that CBO used to ana-lyze those workers’ attributes and pay.)
Federal Workers in 2005As of 2005, permanent full-time civilian federal employ-ees were 47 years old, on average, and each had about 16 years of federal service (see Table 1 on page 12). The distribution of those federal employees’ ages suggests that more than 60 percent of them were between 40 and 59 years old in December 2005 (see the top panel of Fig-ure 1 on page 16). That finding has led some observers to warn of an impending wave of retirements in the govern-ment’s full-time permanent workforce. (As discussed later, the average worker in that group retires from federal service at age 59.) If the current pace of turnovers contin-ues, the government may face the challenge of hiring a large number of new employees (large when compared with recent trends in hiring). The federal government’s Office of Personnel Management (OPM) expects a peak in federal retirements in the full-time permanent work-force between 2008 and 2010 and has expressed concern about the institutional knowledge that will be lost with those retiring employees.4
Two peaks can be seen in the distribution of the years of service of full-time federal employees—one at less than 5 years and one at 15 to 19 years (see the bottom panel of Figure 1). Those peaks reflect the tenure of federal work-ers who continued in government service after the reduc-tions in the federal workforce during the 1990s and the increase in federal hiring after September 11, 2001. In
4. Office of Personnel Management, “OPM Director Discusses Transformation of Federal Workforce at National Press Club” (press release, March 15, 2006), available at www.opm.gov/news/opm-director-discusses-transformation-of-federal-workforce-at-national-press-club,1026.aspx; and Federal Workforce Overview: FY1994–FY2004, Special Focus Research Brief (April 2006), p. 12, available at www.opm.gov/feddata/Workforce_Overview_Brief_1994_to_2004.pdf.
2005, nearly 60 percent of federal workers had 15 or more years of federal service, but only about 10 percent of them had tenures of between 10 and 15 years (as a consequence of the relatively low rate of hiring during the early and middle 1990s). The peak in 2005 in the tenure distribution for employees who had less than five years of service represents people who were hired to address con-cerns about homeland security.
In 2005, slightly fewer than half of full-time permanent federal employees had a college degree, and 17 per-cent held some type of graduate degree (see Table 1 on page 12).5 Many of the employees who had such degrees held positions that were classified by OPM as profes-sional occupations. Nearly 90 percent of professional employees had a college degree, and nearly half of that group also had a graduate degree.
The demographic characteristics of full-time permanent civil servants varied by occupational category in the gov-ernment’s personnel system (see Table 1 and Box 2). For example, women and blacks made up substantial propor-tions (80 percent and 30 percent, respectively) of those employed in clerical occupations. Latinos held 18 percent of the jobs in the Other occupational category (despite making up only about 8 percent of the full-time perma-nent workforce); veterans of military service held 36 per-cent of the jobs in the Other category. (That category is composed primarily of protective services occupations.) Veterans accounted for smaller but still sizable fractions in the remaining occupational categories—for example, 25 percent of administrators and 14 percent of profes-sionals were veterans.
It is important to understand how the characteristics of full-time permanent federal workers compare with the characteristics of workers in similar private-sector jobs. However, the data collected in surveys of the private sec-tor—for example, the Census Bureau’s Current Popula-tion Survey (CPS)—are not directly comparable with the
5. Information on education in OPM’s Central Personnel Data Files, the main source of data for this report, reflects the educational attainment of an employee at the time he or she was hired. The files are not systematically updated when employees obtain more education but only when they switch jobs or are promoted because they have received a degree or certificate of training.

4 CHARACTERISTICS AND PAY OF FEDERAL CIVILIAN EMPLOYEES
Box 2.
Occupational Categories for Salaried Full-Time Permanent Federal Civilian EmployeesIn the 1970s, the Civil Service Commission (now the Office of Personnel Management, or OPM) created a system of occupational categories for all white-collar employees of the federal government. The five cate-gories—Professional, Administrative, Technical, Clerical, and Other—are distinguished by their edu-cation requirements, the level of responsibility that employees must assume, and the nature of the work.
Positions that require an advanced degree or, in the case of a scientific field, significant experience are classified as Professional. More than 89 percent of workers in such occupations have a bachelor’s or more advanced degree, by far the highest percentage of degree holders in any category. Examples of occu-pations that OPM designates as professional include accounting, nursing, physical therapy, architecture, engineering, law, library sciences, and economics. In December 2005, almost 450,000 federal employees were classified as professionals.
Although the positions in the Administrative category do not necessarily require higher education, many of the duties of administrators involve skills that are most often gained through undergraduate or post-graduate studies. In fact, more than 50 percent of employees in the administrative category hold a bach-elor’s or higher degree. Such workers are often required to perform research and exercise judgment in their work and must possess good analytical and writing skills. Physician’s assistants, paralegal special-ists, air traffic controllers, technical writers and edi-tors, financial analysts, and information technology managers are jobs that OPM classifies as administra-tive. The largest occupational category in December 2005, it comprised roughly 640,000 employees.
Employees whose occupations place them in the Technical category often provide support for col-leagues in the Professional and Administrative catego-ries. The duties of technical employees require broad
knowledge that is often gained through practical experience. Fewer than 15 percent of employees in this category have a bachelor’s degree. Among techni-cal workers are medical technicians, dental assistants, safety technicians, photographers, cartographic tech-nicians, and food inspectors. In December 2005, about 370,000 employees were classified as technical workers.
Support work essential for the functioning of offices and operations is performed by employees in the Clerical category. The skills required of such workers are gained primarily through experience, although slightly more than 11 percent of those employees have a bachelor’s degree. Occupations in this cate-gory include those of typist, data transcriber, dis-patcher, correspondence clerk, sales store clerk, and intelligence aid. In December 2005, the federal gov-ernment employed 130,000 clerical workers.
Positions that cannot be assigned to any of the other four groups fall into the Other category. More than 90 percent of the occupations so classified are related to law enforcement or protective services; the cate-gory also includes trainees for various occupations. Sixteen percent of employees in the Other category hold a bachelor’s degree. Occupations under this heading include customs patrol officer, firefighter, police officer, security guard, border patrol agent, correctional officer, and U.S. marshal. This occupa-tional category was the smallest in December 2005 with about 60,000 employees.
In most cases, occupations fall into a single category, but sometimes an occupation’s classification depends on the General Schedule (GS) pay grade of an employee. For example, the position of park ranger is categorized as technical if the employee’s pay grade is from GS-1 to GS-4. But if the grade is between GS-5 and GS-15, then the position is classified as administrative.

CHARACTERISTICS AND PAY OF FEDERAL CIVILIAN EMPLOYEES 5
6
Box 3.
Comparing Federal and Private-Sector WorkersSystematic comparisons of the characteristics of fed-eral and private-sector workers are beyond the scope of this analysis. However, simple comparisons can be made by using the Current Population Survey (CPS), a nationally representative survey that provides con-sistent data (gathered through the same methods and from the same source) on federal and nonfederal employees.1
In 2005, according to the CPS, 44 percent of federal workers were in management, professional, and related occupations, compared with 32 percent of private-sector workers. In the same year, the average age for federal workers was 45 in the CPS data, and the average age for private-sector employees was 40. Among management, professional, and related occu-pations, the average ages of federal and private-sector workers were 46 and 42, respectively. Among all fed-eral workers, 43 percent held bachelor’s degrees com-pared with 28 percent for all private-sector workers,
and 46 percent of federal workers versus 42 per-cent of private-sector workers in management, pro-fessional, and related occupations were college graduates.
Additionally, the CPS data show that workers in the two sectors differ by demographic background. Most notably, the federal sector has a higher proportion of black workers than does the private sector—18 per-cent versus 11 percent for all occupations and 14 per-cent versus 8 percent for management, professional, and related occupations. In contrast, the federal sec-tor employs proportionately fewer women (39 per-cent) than does the private sector (42 percent) in all occupations, with the difference being more pro-nounced in management, professional, and related occupations (42 percent among federal employees and 47 percent among private-sector workers). There are fewer Hispanics in all occupations in the federal sector as compared with the private sector (8 percent versus 15 percent), but the proportions in the two sectors are similar for management, professional, and related occupations (6 percent and 7 percent, respectively).
1. Miriam King and others, Integrated Public Use Microdata Series—Current Population Survey, version 2.0 (Minneapolis, Minn.: Minnesota Population Center, 2004), available at www.ipums.org/cps.
personnel data on which CBO’s analysis is based. Box 3 describes some limited findings about worker characteris-tics based on the CPS data alone.
6. A number of factors may lead to differences between the OPM data used throughout this paper and the CPS’s nationally repre-sentative survey data. The CPS data cover all federal workers, whereas the federal personnel data do not, omitting, for example, occupations that OPM designates as blue-collar. Also, the federal government’s occupational categories may not directly match cate-gories used in the private sector. (For instance, the category of the CPS titled Management, Professional, and Related Occupations is much more inclusive than the government’s Administrative and Professional categories.) Another point of difference involves data about pay: OPM’s information covers only federal pay, whereas in the CPS, wages and salaries may come from multiple jobs. In addition, the CPS data are subject to errors related to sampling.
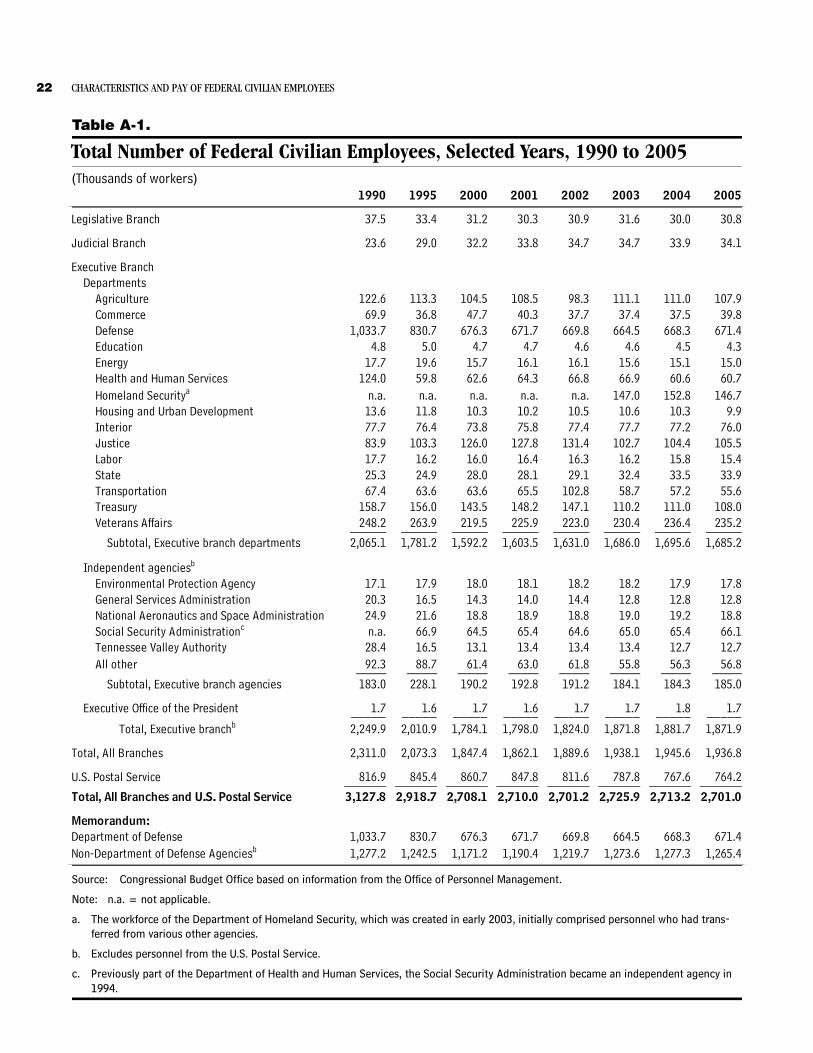
TrendsSignificant changes in the federal workforce over the past several decades have reduced the total number of federal employees, including part-time, temporary, and blue-collar workers, from 3.2 million in 1990 to 2.7 million in 2005—or just a little smaller than the size of the federal workforce in the mid-1970s. In addition to changes in the number of people employed, the distribution of occu-pations in the total federal workforce has shifted over the past 30 years to encompass more professional and admin-istrative positions and fewer clerical positions. Since 1975, the average age, tenure, and educational attain-ment of federal employees have all increased.
The number of salaried full-time permanent federal employees rose slightly over the 1975–2005 period,

6 CHARACTERISTICS AND PAY OF FEDERAL CIVILIAN EMPLOYEES
climbing from 1.22 million to 1.44 million;7 however, that relatively small overall increase masks fluctuations during that time (see the top panel of Figure 2 on page 17 and Table A-1 on page 22).8 During the period, the aver-age age of those full-time civil servants climbed from 42 to 47, with the bulk of that increase occurring since the 1990s (see the bottom panel of Figure 2). Moreover, the boost in the average age was mirrored by an increase in the average length of service. As of December 2005, about one-quarter of the government’s salaried full-time permanent employees were at or above the minimum retirement age of 55, and about 10 percent of them were eligible to retire immediately with an unreduced pension.9
The proportion of full-time federal employees who hold a bachelor’s degree also grew to a significant extent from 1975 to 2005, rising from about 30 percent to 49 percent (see the top panel of Figure 3 on page 18). All occupa-tional categories experienced an increase in the propor-
7. In contrast, the number of trade, craft, and laboring workers employed by the federal government decreased from more than 400,000 in 1975 to just over 200,000 in 1995.
8. Contractors are effectively a personnel resource for the federal government that is not included in those numbers. Researcher Paul C. Light (The True Size of Government, Washington, D.C., Brookings Institution Press, 1999) has estimated that in 1996, there were 8 million full-time-equivalent positions supported through federal contracts and grants.
9. Those statements apply to employees covered under both the older Civil Service Retirement System (CSRS) and the more recently implemented Federal Employees Retirement System (FERS). Originally, under both CSRS and FERS, employees who were at least 55 years old and had at least 30 years of service were eligible for immediate retirement with an unreduced pension. Starting in 2003, however, the FERS minimum retirement age began to rise for workers born after 1947, and it will eventually reach age 57 for employees born in 1970 or later. FERS and CSRS both provide an unreduced pension at age 60 for employees who have 20 or more years of service and at age 62 for workers who have at least 5 years of service. However, the systems offer an incentive to remain with the government beyond the minimum retirement age and years of service because the standard annuity provided to retirees increases for each additional year of service by about 1 percent of the average of an individual’s three highest con-secutive years of pay (an average that is generally rising as a result of annual pay increases). In addition, at age 60, the standard rate of accrual increases from 1 percent to 1.1 percent for all years of service. Retirees also receive annual cost-of-living adjustments (COLAs); however, retirees under FERS do not begin to receive COLAs until they reach age 62. For more information about the government’s retirement systems, see Appendix B.
tion of college degree holders over the period. The exten-sive formal training generally required for professional occupations has meant that the proportion of people in that category who have degrees has always been sizable. But the proportion in the administrative category has grown—from 39 percent in 1975 to 50 percent by 1990—and it has remained at that level in the years since. In addition to substantial numbers of bachelor’s degree holders, the Professional and Administrative occupational categories are also the two that can claim any significant proportion of graduate degrees (see the bottom panel of Figure 3).10 For professionals, those percentages rose from more than 26 percent of workers who had such degrees in 1975 to more than 40 percent in 2005; for administrators, the proportion of graduate degree holders nearly doubled over the period, growing from about 7 percent to almost 14 percent.
The number of bachelor’s degree holders increased in the other occupational categories as well. The proportion of full-time technical employees who have a college degree rose from 11 percent in 1975 to about 15 percent in 1990 and then remained at that level through 2005. The proportion of employees in the Clerical category who have a bachelor’s degree saw an upturn over the period, from about 4 percent to 11 percent. And the proportion of degree holders in occupations in the Other category rose dramatically, from just 4 percent in 1975 to about 16 percent in 2005.
The diversity of the full-time permanent federal work-force has increased over the past several decades. The per-centage of women civil servants rose from 42 percent in 1975 to 47 percent in 1985, a share that has remained fairly steady (see Table A-2 on page 23). The percentage of federal employees who are Hispanic has risen from about 4 percent during the 1980s to about 8 percent in 2005. The representation of other minority groups in the full-time workforce has also been increasing over time. The proportion of black civil servants grew modestly from 1975 to 1990 and has changed little since then, whereas the proportions of Asians and Pacific Islanders in the workforce have been expanding in recent years more rapidly than in the past. The proportion of American Indians and Alaskan natives who are employed by the
10. For the Technical, Clerical, and Other occupational categories, the proportion of employees who had graduate degrees during the 1975–2005 period was never greater than 2 percent.

CHARACTERISTICS AND PAY OF FEDERAL CIVILIAN EMPLOYEES 7
federal government is so small that a trend can hardly be detected.
Federal employees who are retired from the military ser-vices make up about 6 percent of the full-time permanent workforce, a share that has remained roughly stable since 1980.
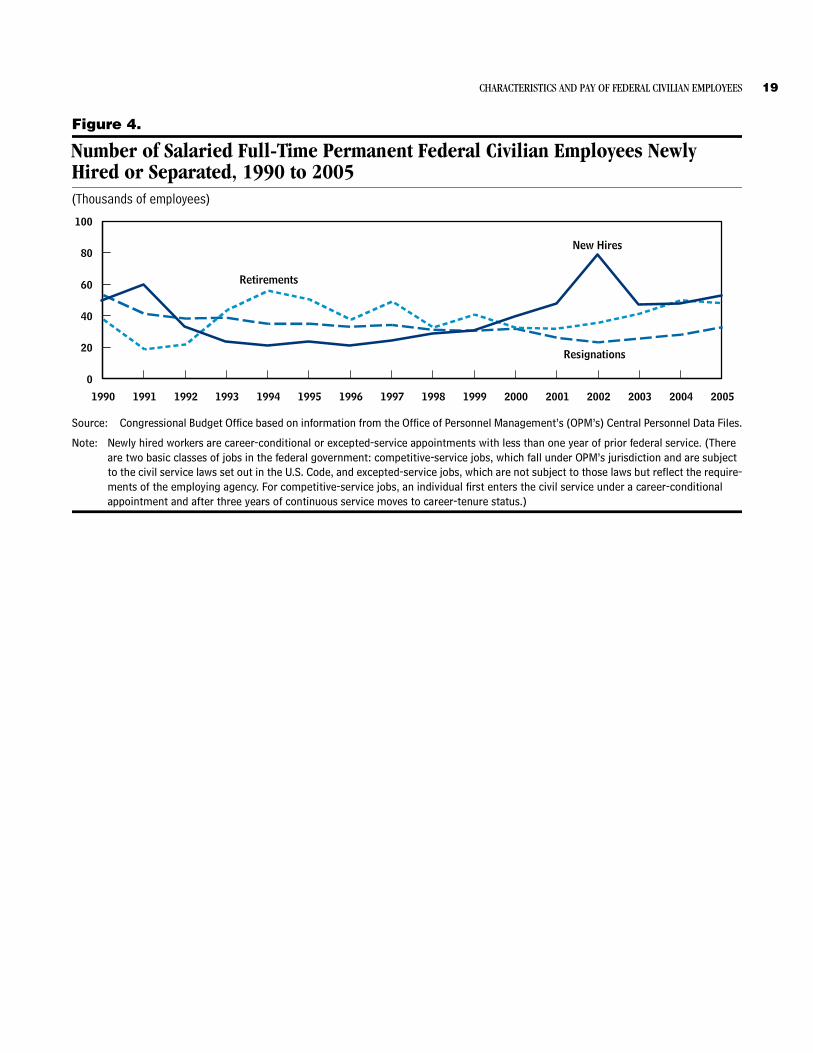
Accessions to and Separations from Federal EmploymentThe characteristics of those entering or leaving the civil service are suggestive of the shift that has occurred in the full-time permanent federal workforce toward a larger proportion of highly skilled employees. From the mid-1990s until 2001, the size of that subset of federal civilian workers declined, as the number of people who resigned or retired from full-time permanent federal employment exceeded the number of people who were hired (see Fig-ure 4 on page 19). But in 2002, the pace of new hiring increased, spiking above the rate of total separations (retirements, resignations, and involuntary terminations) because of hiring after September 11, 2001, for positions associated with homeland security. Since 2002, the num-ber of people leaving the federal workforce has outpaced the number of people being hired.
The Characteristics of New Civil ServantsThe average age of newly hired full-time permanent fed-eral employees has been increasing steadily over time, ris-ing from about 32 years in 1990 to more than 36 years in 2005 (see the top panel of Figure 5 on page 20). Those older and probably more experienced workers have entered federal employment in progressively higher-level jobs; as a consequence, the average General Schedule and related pay grade of those new employees has increased by more than a full grade over the period.11 New employees are also more highly educated: The pro-portion who have college degrees has risen from 51 per-cent to 55 percent, and the proportion who have gradu-ate degrees has grown from 15 percent to 20 percent.12 Overall, the educational attainment of those new workers
11. The GS and related grade level refers to the rankings of federal jobs by grade under the General Schedule pay system. Where appropriate, OPM maps pay grades for non-General Schedule pay plans to correspond to GS pay grades. Appendix B provides more details on the structure of federal pay.
is higher than that of current full-time federal civil ser-vants: 55 percent of new employees had a bachelor’s degree compared with 49 percent of all full-time civil servants.
In 2005, new full-time permanent employees were about 10 years younger than the civil service’s average age of 47 (see Table A-3 on page 24). The youngest new workers fell under the Other occupational category; their average age was 29 years. (A large percentage of those employees were hired for positions related to protective services.) In each of the other four occupational categories, the aver-age age of new employees was between 36 and 38 years.
Several occupational categories saw a rise in the educa-tional attainment of new workers. (The Professional cate-gory did not, probably because many of the occupations it comprises have always required extensive formal aca-demic preparation.) Administrative workers hired in 2005 were likely to be more highly educated than people already employed in that occupational category: About 63 percent of new administrators held a college degree and 22 percent held a graduate degree, compared with 50 percent and 14 percent, respectively, for existing administrators. In addition, in 2005, new employees in the three other occupational categories (Technical, Cleri-cal, and Other) were much more likely than current employees to have a bachelor’s degree.
The Characteristics of Recently Separated WorkersOne way to gauge how the full-time permanent federal civilian workforce is changing is to look at the attrib-utes of workers who have recently left federal service—either voluntarily (because they retired or resigned) orinvoluntarily.
Employees Who Retired. Since 1990, there has been no discernible trend in the retirement age of full-time civil servants (see the top panel of Figure 5 on page 20). The years of service of retiring employees, however, have fluc-tuated between 25 and 29 years and recently displayed an upward trend (see the middle panel of Figure 5). In 2005, retirement tended to occur, on average, at age 59 with
12. A dip in the average level of educational attainment for those new employees in 2002 reflects the hiring (or federalization) of security screeners after the September 11 terrorist attacks.
8 CHARACTERISTICS AND PAY OF FEDERAL CIVILIAN EMPLOYEES
28 years of service (see Table A-4 on page 25).13 Employ-ees in professional and administrative occupations had the longest service at retirement—on average, about 30 years. Employees in the Other occupational category, who are mainly in protective services occupations, tended to retire earlier, at age 55, with 25 years of service.
Among recent retirees from the full-time permanent fed-eral workforce, the percentage holding a bachelor’s degree has risen steadily over the past 15 years (see the bottom panel of Figure 5). Such retirees, however, are less edu-cated—by that measure—than the average current full-time employee. Similar to the full-time federal workforce overall, the educational attainment of retirees from pro-fessional and administrative occupations has been steadily increasing over time. However, there is little difference between retirees and remaining workers in the percentage who hold graduate degrees.
On average, full-time permanent civil servants who retired in 2005 were paid at GS grades 10 to 11; those in professional and administrative occupations were paid at grades 12 to 13.
Workers Who Resigned or Left Government Service Involuntarily. Full-time permanent employees in all occu-pational categories who resigned rather than retired from federal service in 2005 did so after about eight years of service and were 40 years old, on average (see Table A-4). Employees in professional and administrative occupa-tions who resigned did so after an average of 11 years of federal service—much longer than the average length of service of resigning workers in the other three occupa-tional categories, who stayed for 5 to 7 years. Employees who resigned were more likely than the average full-time permanent federal employee to hold a graduate degree.
Overall, employees who left a federal job involuntarily (usually because they were fired or let go) did so after an average of eight years of service. For workers in adminis-trative occupations, that period was as much as 16 years; for workers employed in jobs classified under the Other occupational category, the period was as few as 4 years. In
13. The minimum retirement age for federal workers is between 55 and 57 with 30 years of service. Law enforcement officers under FERS have a minimum retirement age of 50. For more details, see, for example, Office of Personnel Management, Federal Law Enforcement Pay and Benefits: Report to the Congress (July 2004),p. 11.
contrast to employees who resigned, those who separated involuntarily from government service were less likely than the average full-time federal employee to hold a col-lege degree.
The Pay of Full-Time Permanent Federal Civilian EmployeesThe pay of about 80 percent of salaried full-time perma-nent federal employees is determined by the General Schedule; the pay of the remaining employees is deter-mined by other systems that have been created adminis-tratively or by statute. The pay of full-time civil servants who are not covered by the General Schedule is higher, on average, and more widely distributed than the pay of workers who are not under the GS pay structure. In addi-tion to their salary, federal employees under both kinds of pay systems receive benefits such as health care and deferred retirement compensation. (Appendix B provides additional information on pay and benefits.)
Pay Systems in the Federal GovernmentThere is a common view that the federal government is a monolithic employer with a standard pay schedule and hiring rules. However, the current laws, executive orders, and regulations that govern federal employment grant federal agencies considerable latitude in hiring and set-ting pay.
OPM provides rules for agencies to implement the basic civil service principle of equal pay for substantially equal work by assigning federal jobs to specific grades and steps on the General Schedule and then determining the annual rate of basic pay assigned to each respective grade and step.14 However, the proportion of salaried full-time permanent employees covered under pay plans other than the General Schedule—now about 20 percent—has been increasing over time. The alternatives to the General Schedule currently in effect all allow agencies more flexi-bility in addressing the special needs of some occupa-tions. Those approaches include demonstration projects and alternative personnel systems for GS employees that have more discretion in setting pay and purport to tie pay
14. For GS law enforcement officers at grades GS-3 through GS-10, a special base rate was established under section 403 of the Federal Employees Pay Comparability Act of 1990 (section 529 of Public Law 101-509, November 5, 1990, as amended), which is used in lieu of a GS rate.

CHARACTERISTICS AND PAY OF FEDERAL CIVILIAN EMPLOYEES 9
more closely to measurable performance.15 A number of proposals have been offered to overhaul the entire Gen-eral Schedule, especially in terms of linking pay with performance.
Federal jobs are also classified in another way that indi-cates the level of centralization in their pay structure. So-called competitive-service jobs are under OPM’s jurisdic-tion and are subject to the rules for appointments, pay, and classification that are set out in title 5 of the U.S. Code. By contrast, the qualifications and rules for excepted-service jobs are set by the employing agency.16 (Positions may be classified in the excepted service by law, by executive order, or by action of OPM.) Some federal agencies have only excepted-service positions (for exam-ple, the Federal Bureau of Investigation), whereas other agencies may have some divisions or even specific jobs that are not subject to OPM’s oversight. About 23 per-cent of the full-time permanent federal employees that CBO studied are in the excepted service, and 57 percent of that group are in non-GS pay plans.
Comparing Pay Under GS and Non-GS Plans In December 2005, General Schedule employees received average total pay of about $63,000, which comprised scheduled annual basic pay ($56,000), a locality payment ($8,000), and some additional payments (see Table 2 on page 13).17 (Locality payments, which vary across 32 geographic areas, are meant to adjust federal pay for dif-ferences in local costs of living.) Salaries of employees in the various non-GS pay plans were generally higher than those of GS pay plan workers, a fact that may in part reflect the flexibility that those non-GS plans allow agen-cies in setting pay.18 In December 2005, average annual total pay of non-GS workers was about $82,000.
15. For a list of those systems, see Office of Personnel Management, Alternative Personnel Systems in Practice and A Guide to the Future (October 2005), available at www.opm.gov/publications/AlternativePersonnelSystemsOct2005.pdf, Table 1, p. 2.
16. However, veterans still receive preference in hiring for excepted-service jobs.
17. Total pay, which takes into account all applicable pay caps, excludes one-time cash awards. The additional payments men-tioned above include premium pay, such as overtime allowances for criminal investigators, for a small number of employees. (Among all full-time employees covered by the General Schedule, premium pay in 2005 averaged about $30 per person.)
Occupational Categories. Among employees covered by the General Schedule, professional and administrative workers were the highest paid (see Table 2). The average professional employee earned about $80,000 in total pay, and the average administrator earned about $72,000. Employees in the Technical and Other occupational cate-gories on average received $44,000 and $45,000, respec-tively. Clerical employees were the lowest-paid group, earning an average of about $35,000 annually.
By comparison, non-GS employees in all occupational categories except the Technical category earned more than the average GS employee. For example, non-GS professionals and administrators earned an average of about $94,000. Among technical employees, the average non-GS worker’s salary ($39,000) was well below the average GS worker’s ($44,000). However, only 15 percent of non-GS technical jobs can be mapped to an equivalent GS grade.
Senior Executive Service (SES) employees are government executives who complete additional training in order to fill leadership roles across federal agencies (see Table 2). In 2005, SES members on average received $147,000 in basic pay.19
Salary Dispersion. The dispersion of salaries is an indica-tor of the flexibility that employing agencies may have in their pay-setting structure. One measure of the dispersion of total pay among the various occupational categories is the interquartile range, which shows the difference between the 75th percentile of the pay distribution (the dollar amount below which 75 percent of workers’ salaries lie) and the 25th percentile—in other words, the difference between the highest- and lowest-paid employees.20
18. Alternatively, those higher pay levels may reflect the differences between GS and non-GS pay systems in the mix of jobs that each covers. However, another reason for the higher pay of non-GS workers may be that such employers, unlike those governed by the GS pay system, need not seek approval from OPM for enhanced pay when critical personnel are in short supply.
19. SES performance awards, which are given in addition to total pay, are reported in Table 3 on page 14.
20. The results discussed here are similar if other measures of disper-sion are used—for example, the standard deviation, the difference between the 90th and 10th percentiles, or the overall salary range.

10 CHARACTERISTICS AND PAY OF FEDERAL CIVILIAN EMPLOYEES
For full-time workers covered under all pay plans, the interquartile range for total pay is about $40,000 (see Table 2 on page 13). Pay is distributed more widely for non-GS workers (the interquartile range is $52,000) than for GS workers (an interquartile range of $36,000). In addition, among both GS and non-GS workers, those in the Professional occupational category have the largest spread in salaries, but administrators’ pay has almost as great an interquartile range. For GS workers, pay for technical occupations is more widely spread than that for clerical occupations, but for non-GS workers, the inter-quartile range in pay for those two categories is similar. Pay in the Other occupational category is more widely distributed than pay in either technical or clerical occupa-tions, but for both GS and non-GS workers, the spreads in the Other category are well below those for the pay of professional and administrative employees.
Pay among SES employees is not as widely dispersed as is pay for other types of federal employees. The pay range in the Senior Executive Service may be more restricted because unlike pay plans for other federal workers, the SES pay structure is more incentive based, and much of those workers’ pay comes as bonuses that are not accounted for in calculations of total pay.
Competitive-Service and Excepted-Service Pay. The aver-age total pay of excepted-service employees is higher than that of competitive-service workers, and the pay of excepted-service workers is distributed more broadly (see Table 2). Among competitive-service workers, non-GS employees have the highest average salaries. CBO’s analy-sis shows that jobs that have more-centralized control of pay have higher salaries but smaller distributions, whereas agencies that have more “local” control over salaries tend to pay their top employees relatively more.
Bonuses and AwardsIn addition to their total pay, full-time permanent federal employees may receive a variety of one-time payments—for example, performance-based cash bonuses or time-off awards, or bonuses for recruitment or relocation. Among the highest-paid federal workers (basically, those in the Senior Executive Service), performance bonuses and indi-vidual retention allowances are common and significantly increase the compensation of recipients. Such payments, when granted to employees covered by the GS pay struc-ture, are one approach to providing additional incentives within the confines of that pay plan to encourage employees to perform better in their jobs.
One-time cash or time-off awards may be given to employees to recognize exceptional performance. In 2005, a substantial proportion (800,000, or about 56 percent) of full-time civilian federal employees received cash awards for individual accomplishments (see Table 3 on page 14). Those awards averaged more than $1,300 per recipient. In addition, more than 195,000 such employees received time-off awards that year, which averaged about 26 hours per individual. (The federal gov-ernment also provides other incentives, such as awards for inventions or innovations and the use of foreign-language skills.)
About 111,000 employees in 2005 received cash awards (of about $700 each, on average) for exceptional perfor-mance as part of a group. (An individual may receive multiple group awards.) Approximately 81,000 individu-als received group time-off awards that averaged about 14 hours per person.
Members of the Senior Executive Service received the largest performance-based awards. In 2005, more than 4,000 people received the SES Performance Award, which averaged $13,900 per recipient. A smaller group of more than 200 SES members received Presidential rank awards averaging over $32,000 each. Those awards, which designate individuals as Distinguished or Meri-torious Executives, are given each year to a small group of career SES members for exceptional long-term accomplishments.
Promotions, Quality Step Increases, and Intragovernmental TransfersFor GS employees, the growth of basic pay is generally determined by annual across-the-board pay increases and periodic salary increases within a grade step. But promo-tions and performance-based quality step increases allow a faster rate of pay growth.21 In addition, the federal gov-ernment allows employees who reach so-called competi-tive status (that is, after 90 days of service) to seek other jobs within the government. A small group of employees switch from one agency to another in a given year, for which, on average, they receive a small increase in basic
21. A promotion is a movement from one grade level to another. Pro-motions may occur without competition within an occupation that spans multiple grade levels. Alternatively, employees may compete for jobs at higher grade levels through an agency’s merit promotion program.

CHARACTERISTICS AND PAY OF FEDERAL CIVILIAN EMPLOYEES 11
pay. Sixty percent of them also switch to a different occu-pation when they transfer agencies.
Promotions. CBO estimates that in 2005, there were about 178,000 promotions among full-time permanent federal civilian employees (see Table 4 on page 14).22 For all occupational categories, those promotions increased the recipient’s basic pay, on average, by about $4,000. For professional employees and administrators, promotions boosted pay by an average of about $5,000; for workers in the Other occupational category, the average raise was just over $3,000. Technical and clerical employees who were promoted received average increases of about $2,500 and $2,000, respectively.
Quality Step Increases. In addition to cash awards, Gen-eral Schedule employees who perform exceptionally well may receive a quality step increase, which accelerates pay increases that they would have received as they progressed within a pay grade. In 2005, agencies awarded about 49,000 quality step increases that, on average, raised an employee’s basic pay by about $1,800. (A handful of civil-ian employees in the Department of Defense received a so-called exemplary performance award, which increased
22. The government also used about 40,000 temporary promotions to fill essential vacancies until a suitable candidate was found to fill the position permanently. Those promotions tended to occur at higher GS grades than did regular promotions and added about $4,500, on average, to the basic pay of the employees so promoted.
their basic pay by two steps, or by a total of about $4,000, on average.)
Intragovernmental Transfers. Federal agencies compete with one another for talent. From 2001 to 2005, more than 50,000 employees transferred from one agency to another (see Table 5 on page 15).23 (That figure works out to about 20 percent of the number of new hires over the same period.) Those employees saw their basic pay rise by about $1,800, on average. Administrative employ-ees gained the most by transferring—about $2,500; pro-fessionals gained more than $2,300. Workers among the other three categories who transferred saw more-modest gains: Clerical workers received an additional $300, on average; technical workers received $700; and workers in the Other occupational category received $1,000. In addition to an initial boost in basic pay, employees who transfer to another agency may be increasing their oppor-tunity for future pay growth, as suggested by the signifi-cant portion—30 percent—of such employees who also changed occupational families (groups of related white-collar occupations).
23. The rates of intragovernmental transfers reported by the Bureau of Labor Statistics and OPM do not include many of those shifts. Instead, workers who move from one type of government appointment to another—from the competitive service to the SES, for example—are counted as new hires. In its analysis, CBO considered a transfer to be a move between two independent agen-cies and not a shift from one subordinate agency to another within a larger independent agency (such as the Department of Defense).

12 CHARACTERISTICS AND PAY OF FEDERAL CIVILIAN EMPLOYEES
Table 1.
Characteristics of Salaried Full-Time Permanent Federal Civilian Employees, by Occupational Category, December 2005(Percent)
Source: Congressional Budget Office based on information from the Office of Personnel Management’s Central Personnel Data Files.
a. Mostly employees in protective services occupations, such as uniformed police officers and customs and border patrol officers.
46.9 47.3 47.5 46.8 47.5 38.416.5 16.0 18.4 14.8 15.3 10.9
48.9 89.1 50.3 14.6 11.3 16.317.4 42.2 13.9 1.6 1.0 1.0
47.1 39.8 44.5 57.8 79.9 11.752.9 60.2 55.5 42.2 20.1 88.3
17.5 9.7 16.9 24.7 30.0 16.57.5 4.9 7.3 8.9 8.0 18.16.0 4.8 5.5 7.6 11.2 2.8
21.5 13.3 25.1 22.6 19.5 36.0
Average Age Average Years of Service Educational Attainment
Bachelor's degree
Disabled
Graduate degreeSex
FemaleMale
All Categories Clerical Othera
Veteran
Professional Administrative Technical
Selected Ethnic GroupsBlackHispanic

CHARACTERISTICS AND PAY OF FEDERAL CIVILIAN EMPLOYEES 13
Table 2.
Average Pay for Full-Time Permanent Federal Civilian Employees, December 2005
Source: Congressional Budget Office based on information from the Office of Personnel Management’s (OPM’s) Central Personnel Data Files.
Notes: The competitive service, one of two basic classes of federal jobs, falls under OPM’s jurisdiction and is subject to the civil service laws set out in the U.S. Code. Jobs in the other class, the excepted service, are not subject to those laws and reflect the requirements of the employing agency.
GS = General Schedule; n.a. = not applicable.
a. Total pay excludes bonuses and cash awards but includes—in addition to basic pay and the locality adjustment—retention allowances, supervisor differentials, law enforcement availability pay, and differentials for administratively uncontrollable overtime.
b. A measure of the range, or spread, of salaries in a category, it is the difference between the 75th percentile in the salary distribution (the dollar amount below which 75 percent of workers’ salaries lie) and the 25th percentile (the dollar amount below which 25 percent of sal-aries fall).
c. OPM maps a fraction (40 percent overall) of non-General Schedule pay plans to the grade levels under the General Schedule.
d. Includes mostly employees in protective services occupations, such as uniformed police officers and customs and border patrol officers.
1,444,940 59,402 8,161 13.7 67,186 40,232 10.35
268,086 70,102 9,555 13.6 79,802 31,374 12.16495,520 62,975 9,008 14.3 71,920 28,141 11.66268,356 38,578 5,146 13.3 43,811 11,475 7.30
83,380 31,015 4,364 14.1 35,405 8,429 5.3454,473 40,120 4,924 12.3 45,177 15,800 7.72_________
All General Schedule Employees 1,169,815 55,672 7,724 13.9 63,431 36,156 10.14
112,186 86,239 13,242 15.4 93,630 46,735 13.4494,764 82,954 12,257 14.8 93,859 41,654 12.6252,052 33,962 5,174 15.2 38,823 14,681 9.44
6,022 37,402 5,621 15.0 41,245 14,072 7.083,113 51,962 8,721 16.8 60,338 20,882 5.51_______
All Non-GeneralSchedule Employees 268,137 73,431 10,631 14.5 81,502 52,398 12.58
6,888 146,560 n.a. n.a. 146,848 9,024 n.a.
1,028,906 55,945 7,836 14.0 63,812 35,126 10.2084,236 79,980 11,984 15.0 90,836 38,729 12.49________
All Competitive- Service Employees 1,113,142 57,764 8,131 14.1 65,858 37,157 10.34
140,909 53,677 6,905 12.9 60,650 40,516 9.67183,901 70,433 9,803 13.9 77,230 58,902 12.72_______
All Excepted-Service Employees 324,810 63,166 8,283 13.1 70,041 52,036 10.40
As a Rangeb
Average GSand Related
InterquartilePayaPercentage of
Otherd
All Pay Plans
General Schedule Pay Plan
Locality Adjustment
Number of
ProfessionalAdministrativeTechnicalClerical
Total
Excepted ServiceGeneral ScheduleNon-General Schedule
ProfessionalAdministrative
All GradesCompetitive Service
General ScheduleNon-General Schedule
EmployeesBasic Pay
In Dollars (Dollars)
TechnicalClericalOtherd
Senior Executive Service
Non-General Schedule Pay Plans
Gradec(Dollars) (Dollars)Basic Pay

14 CHARACTERISTICS AND PAY OF FEDERAL CIVILIAN EMPLOYEES
Table 3.
Awards Given to Salaried Full-Time Permanent Federal Civilian Employees, 2005
Source: Congressional Budget Office based on information from the Office of Personnel Management’s Central Personnel Data Files.
Note: n.a. = not applicable.
a. Excludes Senior Executive Service personnel.
b. This award, which has two categories, recognizes career senior executives for exceptional long-term accomplishments. Distinguished Rank recipients receive a lump-sum award equal to 35 percent of their basic pay, and Meritorious Rank recipients receive an award equal to 20 percent of their basic pay.
Cash 802,545 55.8 $1,340 2.2Time-Off 195,075 13.6 26.2 hours n.a.
Cash 110,974 7.7 $706 1.2Time-Off 80,817 5.6 14.2 hours n.a.
Presidential Rank Awardb 242 3.5 $32,634 21.5Performance Award 4,011 58.2 $13,911 9.4
Individual Awardsa
Group Awardsa
Senior Executive Service
Award RecipientsPercentage of
Full-Time WorkforcePercentage of
Basic PayAverage
Number Award
Table 4.
Promotions Among Salaried Full-Time Permanent Federal Civilian Employees, by Occupational Category, 2005
Source: Congressional Budget Office based on information from the Office of Personnel Management’s (OPM’s) Central Personnel Data Files.
Note: The data cover all items coded as 702 for “Nature of Action” on OPM Form SF-50.
a. Includes mostly employees in protective services occupations, such as uniformed police officers and customs and border patrol officers.
b. OPM maps a fraction (40 percent overall) of non-General Schedule pay plans to the grade levels under the General Schedule.
177,824 39,514 81,998 35,711 7,615 12,986
Change in Average Basic Pay (Dollars)46,354 56,578 50,542 33,336 28,924 34,82450,536 61,619 55,403 35,848 30,962 37,954
4,182 5,040 4,861 2,512 2,038 3,130Percentage increase 9.0 8.9 9.6 7.5 7.0 9.0
1.2 1.2 1.3 1.0 0.9 1.3
OtheraProfessional Administrative Technical ClericalAll Categories
Change in GS and Related Gradeb
Number of Promotions
Pay in previous positionPay in new positionDifference in pay
Dollars

CHARACTERISTICS AND PAY OF FEDERAL CIVILIAN EMPLOYEES 15
Table 5.
Intragovernmental Transfers Among Salaried Full-Time Permanent Federal Civilian Employees, by Occupational Category, 2001 to 2005
Source: Congressional Budget Office based on information from the Office of Personnel Management’s (OPM’s) Central Personnel Data Files.
Note: The data cover all items coded as 130 (transfers into an agency) for “Nature of Action” on OPM Form SF-50.
a. Includes mostly employees in protective services occupations, such as uniformed police officers and customs and border patrol officers.
b. White-collar jobs are grouped into families of related occupations. These figures are based on information from personnel records for the previous quarter.
50,506 12,542 22,382 8,078 6,012 1,492
30 13 33 40 43 17
56,903 66,632 66,042 36,117 31,778 35,95055,063 64,279 63,561 35,380 31,507 34,925
Dollars 1,840 2,353 2,481 737 271 1,026Percentage increase 3.3 3.7 3.9 2.1 0.9 2.9
OtheraProfessional Administrative Technical Clerical
Difference in pay
Number of Transfers
Percentage of Employees Who Changed Occupational Familiesb
Change in Average Basic Pay
All Categories
(2005 dollars)Pay in new positionPay in previous position

16 CHARACTERISTICS AND PAY OF FEDERAL CIVILIAN EMPLOYEES
Figure 1.
Age Distribution and Years of Service of Salaried Full-Time Permanent Federal Civilian Employees, December 2005(Percentage of employees)
Source: Congressional Budget Office based on information from the Office of Personnel Management’s Central Personnel Data Files.
Under 25 25 to 29 30 to 34 35 to 39 40 to 44 45 to 49 50 to 54 55 to 59 60 to 64 65 to 69 Over 70
0
5
10
15
20
25Age Distribution
Fewer Than 5 5 to 9 10 to 14 15 to 19 20 to 24 25 to 29 More Than 30
0
5
10
15
20
25Years of Service

CHARACTERISTICS AND PAY OF FEDERAL CIVILIAN EMPLOYEES 17
Figure 2.
Number and Age Distribution of Salaried Full-Time Permanent Federal Civilian Employees, 1975 to 2005
Source: Congressional Budget Office based on information from the Office of Personnel Management’s Central Personnel Data Files.
Note: Data coverage has changed over time but should not significantly affect the trends that CBO observed.
a. Includes mostly employees in protective services occupations, such as uniformed police officers and customs and border patrol officers.
All Categories Professional Administrative Technical Clerical Othera
0.0
0.5
1.0
1.5
2.0
1975
1990
2005
Number of Employees by Occupational Category
Age Distribution
Under 25 25 to 29 30 to 34 35 to 39 40 to 44 45 to 49 50 to 54 55 to 59 60 to 64 65 to 69 Over 70
0
5
10
15
20
25
(Millions of employees)
(Percentage of employees)
0

18 CHARACTERISTICS AND PAY OF FEDERAL CIVILIAN EMPLOYEES
Figure 3.
Educational Attainment of Salaried Full-Time Permanent Federal Civilian Employees, by Occupational Category, 1975 to 2005(Percent)
Source: Congressional Budget Office based on information from the Office of Personnel Management’s Central Personnel Data Files.
Note: Data coverage has changed over time but should not significantly affect the trends that CBO observed.
a. Includes mostly employees in protective services occupations, such as uniformed police officers and customs and border patrol officers.
b. The percentage of employees in the Technical, Clerical, and Other occupational categories who held graduate degrees was 2 percent or less during the 1975–2005 period.
All Categories Professional Administrative Technical Clerical Othera0
20
40
60
80
100
1975
1990
2005
Employees Who Have a College Degree
Employees Who Have a Graduate Degree b
All Categories Professional Administrative
0
20
40
60
80
100
CHARACTERISTICS AND PAY OF FEDERAL CIVILIAN EMPLOYEES 19
Figure 4.
Number of Salaried Full-Time Permanent Federal Civilian Employees Newly Hired or Separated, 1990 to 2005(Thousands of employees)
Source: Congressional Budget Office based on information from the Office of Personnel Management’s (OPM’s) Central Personnel Data Files.
Note: Newly hired workers are career-conditional or excepted-service appointments with less than one year of prior federal service. (There are two basic classes of jobs in the federal government: competitive-service jobs, which fall under OPM’s jurisdiction and are subject to the civil service laws set out in the U.S. Code, and excepted-service jobs, which are not subject to those laws but reflect the require-ments of the employing agency. For competitive-service jobs, an individual first enters the civil service under a career-conditional appointment and after three years of continuous service moves to career-tenure status.)
1990 1991 1992 1993 1994 1995 1996 1997 1998 1999 2000 2001 2002 2003 2004 2005
0
20
40
60
80
100
New Hires
Resignations
Retirements

20 CHARACTERISTICS AND PAY OF FEDERAL CIVILIAN EMPLOYEES
Figure 5.
Selected Characteristics of Salaried Full-Time Permanent Federal Civilian Employees Newly Hired or Separated, 1990 to 2005
Source: Congressional Budget Office based on information from the Office of Personnel Management’s (OPM’s) Central Personnel Data Files.
Note: Newly hired workers are career-conditional or excepted-service appointments with less than one year of prior federal service. (There are two basic classes of jobs in the federal government: competitive-service jobs, which fall under OPM’s jurisdiction and are subject to the civil service laws set out in the U.S. Code, and excepted-service jobs, which are not subject to those laws but reflect the require-ments of the employing agency. For competitive-service jobs, an individual first enters the civil service under a career-conditional appointment and after three years of continuous service moves to career-tenure status.)
1990 1991 1992 1993 1994 1995 1996 1997 1998 1999 2000 2001 2002 2003 2004 2005
0
10
20
30
40
1990 1991 1992 1993 1994 1995 1996 1997 1998 1999 2000 2001 2002 2003 2004 2005
0
10
20
30
40
50
60
70
New Hires
Resignations
Retirements
Average Age
1990 1991 1992 1993 1994 1995 1996 1997 1998 1999 2000 2001 2002 2003 2004 2005
0
10
20
30
40
50
60
70
Employees Who Have a College Degree
New Hires
Retirements
Resignations
(Years)
(Percent)
Years of Service(Percentage of employees)
Resignations
Retirements

A PP E N D IX
ASupporting Tables
This appendix provides supplementary information about total federal employment and about the salaried full-time permanent federal workforce. Table A-1 shows total federal civilian employment by branch of govern-ment and agency for selected years from 1990 through
2005. It also compares employment levels at the Depart-ment of Defense and at non-Department of Defense agencies and employment with and without the U.S. Postal Service. Tables A-2, A-3, and A-4 summarize data discussed earlier in the paper.
22 CHARACTERISTICS AND PAY OF FEDERAL CIVILIAN EMPLOYEES
Table A-1.
Total Number of Federal Civilian Employees, Selected Years, 1990 to 2005(Thousands of workers)
Source: Congressional Budget Office based on information from the Office of Personnel Management.
Note: n.a. = not applicable.
a. The workforce of the Department of Homeland Security, which was created in early 2003, initially comprised personnel who had trans-ferred from various other agencies.
b. Excludes personnel from the U.S. Postal Service.
c. Previously part of the Department of Health and Human Services, the Social Security Administration became an independent agency in 1994.
1990 1995 2000 2001 2002 2003 2004 2005
37.5 33.4 31.2 30.3 30.9 31.6 30.0 30.8
23.6 29.0 32.2 33.8 34.7 34.7 33.9 34.1
122.6 113.3 104.5 108.5 98.3 111.1 111.0 107.969.9 36.8 47.7 40.3 37.7 37.4 37.5 39.8
1,033.7 830.7 676.3 671.7 669.8 664.5 668.3 671.44.8 5.0 4.7 4.7 4.6 4.6 4.5 4.3
17.7 19.6 15.7 16.1 16.1 15.6 15.1 15.0124.0 59.8 62.6 64.3 66.8 66.9 60.6 60.7
n.a. n.a. n.a. n.a. n.a. 147.0 152.8 146.713.6 11.8 10.3 10.2 10.5 10.6 10.3 9.977.7 76.4 73.8 75.8 77.4 77.7 77.2 76.083.9 103.3 126.0 127.8 131.4 102.7 104.4 105.517.7 16.2 16.0 16.4 16.3 16.2 15.8 15.425.3 24.9 28.0 28.1 29.1 32.4 33.5 33.967.4 63.6 63.6 65.5 102.8 58.7 57.2 55.6
158.7 156.0 143.5 148.2 147.1 110.2 111.0 108.0248.2 263.9 219.5 225.9 223.0 230.4 236.4 235.2______ ______ ______ ______ ______ ______ ______ ______
2,065.1 1,781.2 1,592.2 1,603.5 1,631.0 1,686.0 1,695.6 1,685.2
17.1 17.9 18.0 18.1 18.2 18.2 17.9 17.820.3 16.5 14.3 14.0 14.4 12.8 12.8 12.824.9 21.6 18.8 18.9 18.8 19.0 19.2 18.8n.a. 66.9 64.5 65.4 64.6 65.0 65.4 66.1
28.4 16.5 13.1 13.4 13.4 13.4 12.7 12.792.3 88.7 61.4 63.0 61.8 55.8 56.3 56.8_____ _____ _____ _____ _____ _____ _____ _____
183.0 228.1 190.2 192.8 191.2 184.1 184.3 185.0
1.7 1.6 1.7 1.6 1.7 1.7 1.8 1.7_____ _____ _____ _____ _____ _____ _____ _____Total, Executive branchb 2,249.9 2,010.9 1,784.1 1,798.0 1,824.0 1,871.8 1,881.7 1,871.9
2,311.0 2,073.3 1,847.4 1,862.1 1,889.6 1,938.1 1,945.6 1,936.8
816.9 845.4 860.7 847.8 811.6 787.8 767.6 764.2_______ _______ _______ _______ _______ _______ _______ _______3,127.8 2,918.7 2,708.1 2,710.0 2,701.2 2,725.9 2,713.2 2,701.0
1,033.7 830.7 676.3 671.7 669.8 664.5 668.3 671.41,277.2 1,242.5 1,171.2 1,190.4 1,219.7 1,273.6 1,277.3 1,265.4
Total, All Branches and U.S. Postal Service
Memorandum:Department of DefenseNon-Department of Defense Agenciesb
Subtotal, Executive branch agencies
Total, All Branches
U.S. Postal Service
National Aeronautics and Space AdministrationSocial Security Administrationc
Tennessee Valley AuthorityAll other
Executive Office of the President
Subtotal, Executive branch departments
Independent agenciesb
Environmental Protection AgencyGeneral Services Administration
StateTransportationTreasuryVeterans Affairs
Housing and Urban DevelopmentInteriorJusticeLabor
EducationEnergyHealth and Human ServicesHomeland Securitya
DepartmentsAgricultureCommerceDefense
Legislative Branch
Judicial Branch
Executive Branch

SUPPORTING TABLES 23
Table A-2.
Characteristics of Salaried Full-Time Permanent Federal Civilian Employees, Selected Years, 1975 to 2005
Source: Congressional Budget Office based on information from the Office of Personnel Management’s Central Personnel Data Files.
Note: n.a. = not applicable.
a. Mostly employees in protective services occupations, such as uniformed police officers and customs and border patrol officers.
b. For the Technical, Clerical, and Other occupational categories, the percentage of employees who had graduate degrees during the 1975–2005 period was never greater than 2 percent and is not shown.
1975 1980 1985 1990 1995 2000 2005
Average Age 41.7 41.8 42.1 42.5 44.2 46.3 46.9
Average Years of Service 14.1 13.9 13.7 13.7 15.4 17.2 16.5
Educational Attainment (Percent) 29.5 33.0 38.8 42.8 46.1 47.5 48.9
Professional 85.9 86.6 88.5 87.5 87.8 87.7 89.1Administrative 39.3 43.2 46.7 49.8 50.9 49.7 50.3Technical 11.2 12.2 12.8 14.4 14.7 15.3 14.6Clerical 3.9 4.7 7.0 7.3 8.1 8.8 11.3Othera 4.0 8.2 10.0 11.2 14.0 17.0 16.3
7.1 8.6 11.6 12.9 14.8 16.1 17.4Professional 26.7 29.5 34.7 34.1 37.3 40.3 42.2Administrative 7.3 9.2 11.0 12.0 12.5 12.8 13.9
Gender (Percent)42.0 44.4 46.4 48.1 48.6 48.3 47.158.0 55.6 53.6 51.9 51.4 51.7 52.9
Race and National Origin (Percent)n.a. 14.9 15.4 16.2 16.7 17.2 17.5n.a. 3.6 4.3 4.9 5.6 6.4 7.5n.a. 1.4 2.0 2.7 3.3 3.7 4.4n.a. 0.6 1.1 1.4 1.7 1.8 1.8
Disabled (Percent) 2.1 6.3 6.1 6.2 6.5 6.2 6.0
General Schedule or Related n.a. n.a. 98.1 98.4 95.6 93.0 88.6
Median grade level n.a. n.a. 9.0 9.0 11.0 11.0 11.0Average grade level n.a. n.a. 8.7 9.2 9.7 10.1 10.3
Bachelor's degree
Graduate degreeb
WomenMen
BlackHispanicAsian/Pacific IslanderAmerican Indian
Pay Plan (Percent)

24 CHARACTERISTICS AND PAY OF FEDERAL CIVILIAN EMPLOYEES
Table A-3.
Selected Characteristics of New Salaried Full-Time Permanent Federal Civilian Employees Hired in 2005, by Occupational Category
Source: Congressional Budget Office based on information from the Office of Personnel Management’s (OPM’s) Central Personnel Data Files.
Note: GS = General Schedule.
a. Mostly employees in protective services occupations, such as uniformed police officers and customs and border patrol officers.
b. The number of employees in career-conditional or excepted-service appointments who have fewer than three months of prior federal ser-vice. (There are two basic classes of jobs in the federal government: competitive-service jobs, which fall under OPM’s jurisdiction and are subject to the civil service laws set out in the U.S. Code, and excepted-service jobs, which are not subject to those laws but reflect the requirements of the employing agency. For competitive-service jobs, an individual first enters the civil service under a career-conditional appointment and after three years of continuous service moves to career-tenure status.)
52,349 14,448 17,584 11,526 4,062 4,729
36.5 36.2 38.1 36.9 37.9 29.0
GS and related plans (Percent) 83.7 79.0 87.3 76.3 92.3 95.18.2 9.8 9.6 6.2 4.9 5.2
54.6 89.2 63.1 21.7 22.2 24.920.3 42.5 21.7 3.7 2.7 2.3
Technical Clerical OtheraAdministrative
Number of New Employeesb
Average Age
Pay Structure
ProfessionalAll Categories
Graduate degree
Average grade
Educational Attainment (Percent)Bachelor's degree

SUPPORTING TABLES 25
Table A-4.
Selected Characteristics of Salaried Full-Time Permanent Civilian Employees Who Left Federal Employment in 2005, by Occupational Category
Source: Congressional Budget Office based on information from the Office of Personnel Management’s Central Personnel Data Files.
a. Mostly employees in protective services occupations, such as uniformed police officers and customs and border patrol officers.
b. Includes reductions in force, removals, and resignations that were coded as being in lieu of involuntary action.
48,443 10,743 23,132 10,082 3,415 1,071
59.2 60.5 58.5 59.3 59.9 54.9
28.3 28.9 29.6 26.1 24.7 25.0
42.9 85.3 43.0 12.7 8.4 12.015.4 41.9 11.8 1.8 0.7 1.0
33,156 8,716 7,127 11,579 2,935 2,799
39.1 39.6 40.6 39.3 39.8 31.8
6.6 6.3 8.5 5.9 7.9 4.4
42.9 84.9 59.5 13.8 15.8 18.516.7 42.2 21.2 2.1 2.0 1.5
8,589 758 2,273 4,064 936 558
42.7 47.1 46.7 40.7 43.2 34.1
10.4 11.0 17.3 7.0 10.6 6.0
23.3 80.6 40.8 6.8 10.9 15.25.8 35.6 8.1 0.8 0.5 2.2
Othera
Number of Employees
Professional Administrative Technical ClericalAll Categories
Workers Who Retired
Average Age
Average Years of Service
Number of Employees
Educational Attainment (Percent) Bachelor's degreeGraduate degree
Graduate degree
Average Age
Average Years of Service
Graduate degree
Average Age
Average Years of Service
Workers Who Resigned
Workers Who Were Terminatedb
Educational Attainment (Percent) Bachelor's degree
Number of Employees
Educational Attainment (Percent) Bachelor's degree


A PP E N D IX
BThe Structure of Federal Compensation
The total compensation of salaried full-time perma-nent federal civilian employees comprises cash compensa-tion (basic and premium pay, differentials such as locality pay, and one-time awards) and benefits, including retire-ment coverage, health and life insurance, and deferred compensation. In general, federal benefits are consistent among agencies.1 (The Office of Personnel Management, for instance, negotiates health insurance rates with local carriers for the entire government.) Most federal employ-ees are covered by one of two retirement plans: the Civil Service Retirement System, or CSRS (a defined-benefit retirement plan), or the Federal Employees Retirement System, or FERS (a hybrid plan with defined-benefit and defined-contribution components, which covers almost all workers hired since December 31, 1983).2
Basic PayThe General Schedule (GS) determines basic pay for most federal employees, although some workers are cov-ered by alternative federal pay schedules. The General Schedule has 15 grade levels, with 10 salary steps in each grade. Positions are classified by using governmentwide standards to determine their proper occupational series, title, and grade within the GS pay tables.3 Each grade represents a defined range of difficulty and responsibility that is the same for different occupations. For instance, the work of a GS-9 park ranger in the Department of the Interior and that of a GS-9 accountant in the Depart-
1. However, law enforcement officers receive enhanced retirement benefits, and some branches of government calculate retirement benefits by using different formulae.
2. Various other retirement systems cover certain federal civilian employees; for example, Foreign Service workers, U.S. Tax Court judges, and employees of the Central Intelligence Agency all have separate retirement systems.
3. See Office of Personnel Management, “Federal Classification and Job Grading Systems” (various dates), available at www.opm.gov/fedclass/html/gsclass.asp.
ment of Defense are considered to be at the same level. General Schedule employees who perform satisfactorily receive regular step increases within their grade—that is, they move up the steps within a grade—according to the following timeline: every year for steps 1 to 3, every two years for steps 4 to 6, and every three years for steps 7to 9.4 The pay range of some jobs spans several grades.
Employees covered by the General Schedule have a num-ber of opportunities to boost their pay more quickly than the usual within-grade-step increases would allow. Those opportunities include so-called quality step increases, promotions (to a higher grade), job changes, and—at the discretion of an employee’s manager—retention allow-ances. A quality step increase is a within-grade boost used to reward employees in all GS grades who perform at a high level. Quality step increases are given in addition to regular within-grade increases and generally do not affect the timing of an employee’s regular within-grade pay raise.5 Federal employees’ pay may also rise because of promotions or transfers to jobs in other agencies, and their total compensation may increase because of one-time cash bonuses and time-off awards for exceptional performance.
The federal government has experimented with different ways of determining pay and hiring workers.6 In some cases, it has set up demonstration programs that have included pay banding. Under that pay-setting approach, large ranges of pay are assigned to a job or class of jobs,
4. Just over 400 federal employees were denied a within-grade increase in 2005.
5. If a quality step increase places the employee in step 4 or step 7 of his or her grade, then additional time is added before the employee is eligible for the next regular within-step increase. For more information, see www.opm.gov/perform/articles/1999/apr99-7.asp.
6. A list of current and past demonstration programs and alternative personnel systems may be found at www.opm.gov/demos/.

28 CHARACTERISTICS AND PAY OF FEDERAL CIVILIAN EMPLOYEES
which gives managers greater latitude than would other-wise be allowed under the General Schedule for deter-mining levels of pay and timed step increases. Another approach that has been included in various demonstra-tion projects is a pay-for-performance system, under which more of the employee’s salary is explicitly tied to measures of performance. Other demonstration programs have included more-streamlined approaches to hiring and removing personnel. Some of those programs have been made permanent; the approaches they use are most prominent in the new personnel systems developed for the Departments of Homeland Security and Defense, which cover more than 40 percent of the full-time perma-nent federal civilian employees on which this paper focuses.
BenefitsThe benefits that federal employees receive make up a substantial proportion of their total compensation. In an August 1998 analysis, the Congressional Budget Office (CBO) found that, depending on an employee’s age, sal-ary, length of service, and retirement plan, benefits ranged from 26 percent to 50 percent of pay. CBO also found that in most cases, the value of the employee bene-fits package offered by the federal government exceeded the value of comparable benefits offered by private firms by as much as 7.2 percent of pay. 7
The largest components of federal benefits are the retire-ment plans. The Civil Service Retirement System, created in 1921, was the original retirement plan for all federal employees. After extending Social Security benefits to the federal workforce, policymakers created the Federal Employees Retirement System, which went into effect on January 1, 1987. Between 1987 and 1998, employees who fell under CSRS were allowed to switch to FERS.
The Federal Employees Retirement SystemFERS comprises three elements: the Basic Benefit Plan, the Thrift Savings Plan, and Social Security benefits. Employees who are enrolled in FERS thus receive bene-fits in retirement from three different sources. In Decem-ber 2005, more than 72 percent of federal employees were covered by FERS.
7. See Congressional Budget Office, Comparing Federal Employee Benefits with Those in the Private Sector (August 1998), pp. vi and 1.
Under the Basic Benefit Plan, most employees contribute 0.8 percent of their pay and are eligible to receive a cer-tain percentage of their salary upon retirement—once they have completed five years of service, or are “vested.” For most federal employees, the benefit they receive when they retire is calculated as 1 percent of their highest three-year average salary multiplied by the number of years of service. (That figure is 1.1 percent if they retire at age 60 with 20 years of service.) But certain groups of federal employees—including firefighters, law enforcement offic-ers, air traffic controllers, and Members of Congress—receive an enhanced retirement benefit: 1.7 percent of their highest three-year average salary multiplied by the number of years of service up to 20 plus 1 percent of their highest three-year average salary multiplied by the num-ber of years of service beyond 20.8 The Basic Benefit Plan also provides benefits to the families of deceased employ-ees as well as to employees who have become disabled.
Under the basic plan, benefits receive some protection from inflation because they typically include annual cost-of-living adjustments (COLAs) equivalent to the increase in the consumer price index for urban wage earners and clerical workers (CPI-W)—provided that the increase is 2 percent or less. If the percentage increase in the CPI-W is between 2 percent and 3 percent, FERS annuitants receive a COLA of 2 percent. If the CPI-W increase exceeds 3 percent, annuitants’ COLA is the percentage increase in the CPI-W minus 1 percentage point. FERS annuitants do not begin to receive COLAs until they reach age 62.
The Thrift Savings Plan (TSP) is similar to 401(k) plans offered in the private sector. Under FERS, federal agen-cies automatically contribute an amount equal to 1 per-cent of an employee’s salary to the TSP. Agencies also match, dollar for dollar, the first 3 percent of workers’ voluntary contributions to the plan; they match the next 2 percent of workers’ contributions at 50 cents to the dol-lar. Employees may invest in a government securities fund, three stock index funds, a fixed-income index fund, and a choice of life-cycle funds.
As part of FERS, employees are eligible to receive benefits from Social Security’s Old-Age, Survivors, and Disability Insurance programs as well as from Medicare. To be
8. Those employees contribute more toward their retirement benefits than other groups do; however, their benefits are also more costly to the federal government.
THE STRUCTURE OF FEDERAL COMPENSATION 29
eligible for those payments, employees must have paid payroll taxes for at least 40 quarters.
The Civil Service Retirement SystemComparison of CSRS and FERS shows several differences between the two systems. Unlike FERS, CSRS has only a defined-benefit plan, which is similar to the FERS Basic Benefit Plan. As is the case with the latter, CSRS-covered employees are vested in the system after five years of ser-vice; however, the benefits they receive under CSRS make up a larger percentage of their former salary than is the case under the FERS Basic Benefit Plan because CSRS
retirees generally do not receive Social Security benefits. Benefits under CSRS receive some inflation protection through annual COLAs that fully match the rise in the CPI-W (in contrast to the partial inflation protection that FERS retirees may receive). Benefits under CSRS are calculated as follows: 1.5 percent of an employee’s highest three-year annual average salary for the first five years of service, 1.75 percent of the highest three-year annual average salary for the second five, and 2 percent of the highest three-year annual average salary for each year after that. In December 2005, 22 percent of federal employees were covered by CSRS.