characterisation of nitrogen-treated srf cavity...
TRANSCRIPT

George Lewis Fermilab Helen-Edwards Intern Report August 2017
Characterisation of Nitrogen-Treated
SRF Cavity Materials
Fermi National Accelerator Facility
Helen-Edwards Summer Internship Final Report
Supervisor: Yulia Trenikhina Intern: George Lewis
Recent breakthroughs in superconducting cavity performance resulting from nitrogen
treatment signals the potential for huge impact on particle accelerator use in society.
This internship has focused on investigating these cavities using SIMS and SEM,
three experiments were performed. Firstly, to find the formation temperature of non-
superconducting nitrides; data suggests onset of the 𝛽-phase between 600 and 700 °C.
Secondly to explore the optimal parameters for nitrogen infusion recipes; finding that
timing and temperature can be tailored to produce cavities with specific properties.
Thirdly, in-situ analysis of infused samples was performed at each stage of synthesis;
on exposure to oxygen, nitrogen at the surface appears to be displaced. Additionally, a
user interface for creating SIMS depth profiles has been created and made available.

George Lewis Fermilab Helen-Edwards Intern Report August 2017
2
Contents
1. Introduction ................................................................................................................................. 3
1.1 Background and motivation .................................................................................................. 3
1.2 Theory and concept overview ............................................................................................... 4
1.2.1 SRF cavities ................................................................................................................... 4
1.2.2 RF cavity as an LC circuit ............................................................................................. 5
1.2.3 Quality factors and accelerating fields ........................................................................... 6
1.2.4 Q vs E and degradation phenomena............................................................................... 7
1.2.5 Cooper pairs and superconductivity............................................................................... 8
1.2.6 Surface resistance in SRF cavities ................................................................................. 9
1.2.7 Magnetic vortices and dirty surfaces ............................................................................. 9
1.2.8 Secondary Ion Mass Spectrometry (SIMS) ................................................................. 11
1.2.9 Primary ion sources for SIMS...................................................................................... 12
1.2.10 Fick’s laws of diffusion ............................................................................................. 13
1.2.11 Niobium nitride phases .............................................................................................. 13
1.2.12 SEM and niobium nitride ........................................................................................... 14
2. Experimental details.................................................................................................................. 15
3. Results and discussion .............................................................................................................. 16
3.1 Development of SIMS analysis interface ............................................................................ 16
3.2 Temperature series .............................................................................................................. 17
3.3 Infusion recipe variations .................................................................................................... 19
3.4 In-situ baking....................................................................................................................... 21
4. Conclusion ................................................................................................................................ 22
5. References ................................................................................................................................. 23

George Lewis Fermilab Helen-Edwards Intern Report August 2017
3
1. Introduction
1.1 Background and motivation
Particle accelerators are used widely across science, industry, medicine and security, producing
products with a net worth in excess of $500 billion [1]. Research is currently underway to produce
Superconducting Radio Frequency (SRF) cavities which will enable the production of a new class
of compact and efficient accelerators that will find broad application throughout society [2].
The breakthrough discovery of nitrogen doping the niobium surface of SRF cavities has allowed
for an unprecedented increase in performance. The merit of an SRF cavity is measured by its
average accelerating gradient 𝐸𝑎𝑐𝑐 and its quality factor 𝑄0 which is a measure of the number of
oscillations before the stored energy is dissipated. Typically, at medium 𝐸𝑎𝑐𝑐 fields, it is found that
𝑄0 can drop a factor of two between 5 and 25 MV m−1 [3]. However, with nitrogen doped cavities,
a so-called anti Q-slope is observed, whereby 𝑄0 is actually increased above the theoretical
prediction for pure niobium over this range [4]. Research into optimising the doping process to
produce high 𝑄0 for medium fields has been successful and a recipe for building cavities has been
developed which depends upon the presence of low levels of interstitial nitrogen introduced by
injection of nitrogen for 2 minutes and 6 minutes of annealing all at 800 °C, followed by removal
of 5 µm by Electro-Polishing (EP) to remove poorly superconducting niobium nitride phases [5].
However, research into SRF cavities which perform well at high 𝐸𝑎𝑐𝑐 is still underway. A
promising avenue is the process of nitrogen infusion; distinct from doping in that nitrogen is
introduced at much lower temperatures [6]. This process has produced accelerating gradients up
to 45 MV m-1.
This report is concerned with surface analyses pertaining to N-infusion, specifically three
experiments are detailed: a low temperature study of niobium-nitrogen phases, an exploration of
different conditions for 120 °C infused samples, and an investigation into in-situ baking and
analysis of nitrogen infused samples. Each experiment is described below in further detail.

George Lewis Fermilab Helen-Edwards Intern Report August 2017
4
Firstly, detailed knowledge of the phase space for the niobium-nitrogen system is necessary to
understand more about the infusion process. Detailed literature describing phase diagrams and
nitrogen diffusion into niobium at higher temperatures already exists [7] [8], but the present work
will further explore lower temperatures with an aim of discovering the temperature corresponding
to the formation of poorly super-conducting niobium nitride phases.
Secondly, there are several synthesis conditions that can be modified during fabrication of N-
infused niobium. For example, previous research suggests that the effects of nitrogen infusion
increase as temperature is increased from 120 to 160 °C [6]. Furthermore, surfaces which have
been fabricated at high pressure, for longer times, and with different baking procedures will also
be discussed.
Thirdly, state of the art facilities at Fermilab offer the opportunity to carry out the nitrogen infusion
process in the same machine that analysis will occur. This possibility allows questions to be asked
which pertain to the way that the sample surface changes throughout the synthesis process. For
example, it will be possible to compare surfaces before and after the sample is exposed to oxygen,
thereby seeing exactly what modifications are caused by oxidation.
This work describes three experiments performed during a summer internship which ultimately
aims to find an optimal nitrogen infusion process and contribute towards a general understanding
of the phenomenon.
1.2 Theory and concept overview
Here, a brief summary of some of the fundamental science learned over the internship will be
presented for reference.
1.2.1 SRF cavities
Superconducting Radio Frequency (SRF) cavities are extremely efficient particle accelerators. By
building up a standing electromagnetic wave inside the cavity, a large amount of energy can be
stored in the field inside. Particles are sent through the cavity and timings are regulated such that
the bunch always experience an accelerating Lorentz force despite the rapid fluctuations of the
field.
Compared to previous electrostatic accelerators such as Van der Graaff accelerators, they have a
much lower chance of voltage breakdown. They are also a significant improvement on standard
George Lewis Fermilab Helen-Edwards Intern Report August 2017
5
RF cavities since, the amount of power dissipated at the surface of the cavity is significantly
reduced. This dissipation comes from the time varying magnetic field which induces a current in
the surface in accordance with Faraday’s law and consequently there is energy loss associated with
resistance; the extremely low resistance of superconductors minimises this loss.
A great advantage of SRF cavities is also that they can be combined together so that bunches pass
through multiple cavities, accelerating particles ever faster. This can be done to varying degrees
depending on requirements, for example the FAST facility at Fermilab is designed to use 27 cavity
cells, but the future International Linear Collider (ILC) will have over 144 000 of these cells [3].
One of the major issues with SRF cavities is that their cost per unit length is very high due to the
extensive processing and cryogenic costs associated with their production and maintenance. In
addition, power is still dissipated in the cavity walls for a variety of reasons. Therefore research to
reduce this energy loss will essentially enable a smaller number of optimized SRF cavities to be
capable of doing the same work as a greater number of standard cavities, thereby reducing costs.
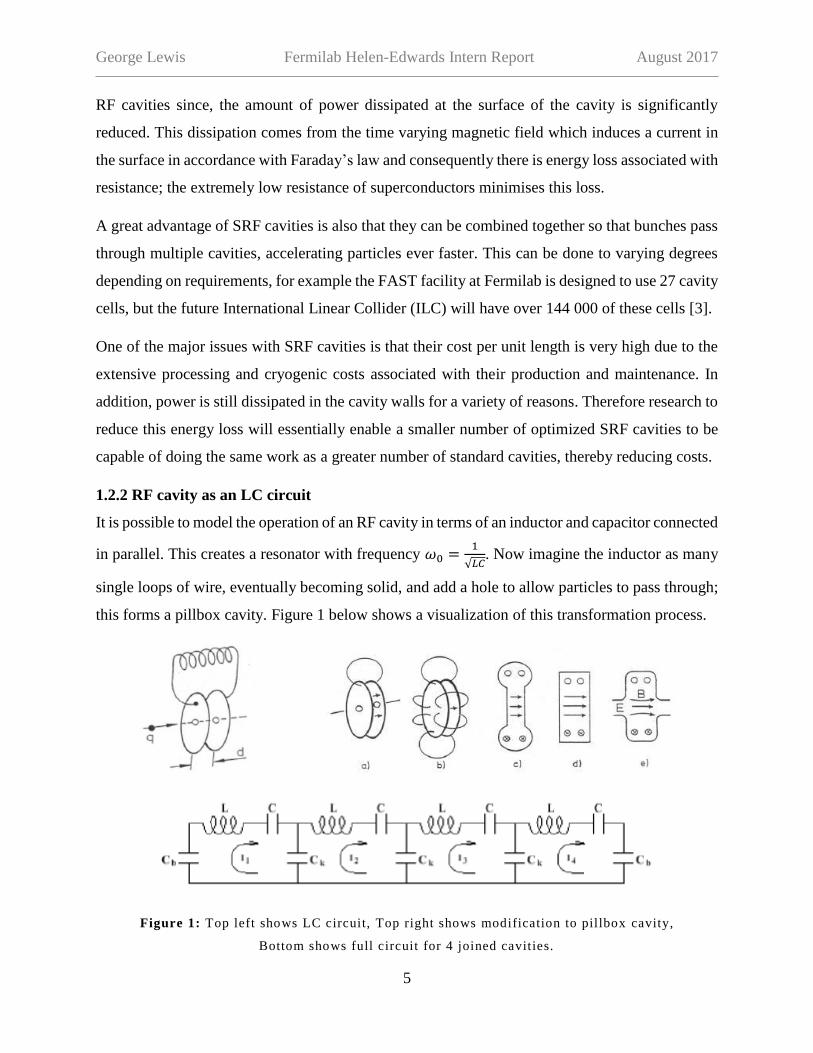
1.2.2 RF cavity as an LC circuit
It is possible to model the operation of an RF cavity in terms of an inductor and capacitor connected
in parallel. This creates a resonator with frequency 𝜔0 =1
√𝐿𝐶. Now imagine the inductor as many
single loops of wire, eventually becoming solid, and add a hole to allow particles to pass through;
this forms a pillbox cavity. Figure 1 below shows a visualization of this transformation process.
Figure 1: Top left shows LC circuit, Top right shows modification to pillbox cavity,
Bottom shows full circuit for 4 joined cavities.

George Lewis Fermilab Helen-Edwards Intern Report August 2017
6
1.2.3 Quality factors and accelerating fields
SRF cavities are described by two key figures of merit, the quality factor 𝑄0 and the accelerating
gradient 𝐸𝑎𝑐𝑐. The accelerating field is simply the maximum accelerating field that can be obtained
by the cavity.
Quality factors are widely used in physics to describe the selectivity of a signal and can generally
be defined in terms of bandwidth Δ𝑓 and response frequency 𝑓𝑅 as in equation 1, or in terms of the
angular frequency of the system 𝜔, the energy stored 𝑈 and energy dissipated 𝑃𝑑 as in equation 2.
𝑄0 =𝑓𝑅𝛥𝑓
, [1]
𝑄0 = 2𝜋Energy stored
Energy dissipated per cycle =
𝜔𝑈
𝑃𝑑 [2]
In general, a high 𝑄0 indicates that oscillations take longer to die out, essentially meaning the
device is more efficient. However, for SRF cavities, we can define the quality factor in another
way, see a brief derivation below:
- Using the definition of power, P =𝑑𝑈
𝑑𝑡= 𝑉𝐼 and of an inductor V = −𝐿
𝑑𝐼
𝑑𝑡, it can be
shown that 𝑈 = ∫𝑑𝑈
𝑑𝑡
∞
0𝑑𝑡 = ∫ 𝐿𝐼
𝑑𝐼
𝑑𝑡
𝑖𝑓0
𝑑𝑡 =1
2𝐿𝑖𝑓
2.
- Using the equation for inductance of a coil 𝐿 = 𝜇0𝑛2𝑙𝐴 and also for magnetic induction
𝐵 = 𝜇0𝑛𝐼 = 𝜇0𝐻, comparing, we see that energy stored is U =1
2𝜇0 ∫ |𝐻|2
𝑉𝑑𝑉
- Similar manipulations yield Pd =Rs
2∫ |𝐻|2
𝑆𝑑𝑆
- Combining 𝑈 and 𝑃𝑑 with our definition from equation 2, we arrive at
𝑄0 =𝜔𝜇0 ∫ |𝐻|2
𝑉𝑑𝑉
𝑅𝑠 ∫ |𝐻|2
𝑆𝑑𝑆
=𝐺
𝑅𝑆 [3]
Where G is the geometry factor that depends strongly on cavity shape (but not size) and RS is the
surface resistance of the cavity.

George Lewis Fermilab Helen-Edwards Intern Report August 2017
7
1.2.4 Q vs E and degradation phenomena
A common way of displaying the performance of an SRF cavity is to plot quality factor against
accelerating gradient. Typically the trend will be to start with fairly high 𝑄0 at low fields and see
it deteriorate and eventually drop off at higher fields. There are many phenomena that can affect
the performance and a few of these are displayed in the figure below.
Figure 2: Typical 𝑸𝟎 degradation caused by various phenomena, modified from Padamsee [3] .
The origin of these phenomena which historically limited the performance of SRF cavities are
briefly discussed here:
- Hydrogen disease: Hydrogen dissolved in Nb can precipitate as a lossy hydride. De-
gassing by baking at 800 °C and formation of protective oxide solves the issue.
- Multipacting: Localised, resonant process where an electron avalanche occurs.
Requires the time between electron impacts to be an integer number of half RF periods
and occur above a threshold energy – this happens at specific Eacc.
- Thermal breakdown: Small defects (scratches, welding beads etc.) give local non-
superconducting regions which heat up, this eventually warms the surrounding Nb
above Tc and the defect grows unstably, quenching the cavity. This can be avoided
through taking great care in preparation and by increasing Tc.

George Lewis Fermilab Helen-Edwards Intern Report August 2017
8
- Field emission: Micron sized particles lead to exponentially increasing electron
currents which cause a rise in temperature and a sharp decrease in quality factor.
Advanced cleaning techniques such as High Pressure Rinsing (HPR) and the use of
class 10 clean rooms provides a way of avoiding this complication. (It is also possible
to destroy particulates through RF manipulation as reported in [3]).
- High Field Q Slope: Q reduction around 25 MV m-1, caused by nanohydrides at
penetration depth, EP followed by baking at 120 °C provides an empirical solution [9].
We see that comparatively, nitrogen treatment causes significant improvement compared to
traditional cavities and actually enhances performance above the theoretical limit for niobium.
1.2.5 Cooper pairs and superconductivity
In a normal conductor, electrons exist as fermions which rest in comparatively high energy states
and dissipate energy through constant collisions with the ionic lattice.
In a superconductor, electrons exist as Cooper pairs due to a favorable exchange of phonons,
intuitively the process can be explained as follows:
- Electrons repel one another and attract positive ions which form the lattice due to their
negative charge
- This attraction of ions distorts the lattice as the ions move slightly towards the electron
which increases the positive charge density in the vicinity.
- This increased positive charge density attracts other nearby electrons. At long distance,
this attraction between electrons can overcome their repulsion and cause electrons to
pair up, see diagram below.
Figure 3: Left shows lattice distortion by electrons, Right shows electron energy levels

George Lewis Fermilab Helen-Edwards Intern Report August 2017
9
Since in a Cooper pair there are two electrons, they exist as bosons which can occupy the same
ground state. In full BCS theory, one finds that the pairing opens a gap in the continuous spectrum
of allowed energy states of the electrons, see right half of figure 3. This means that all excitations
of the system must possess some minimum amount of energy. This energy gap is what leads to
superconductivity, since small excitations such as scattering (which are the major source of energy
loss in normal conducting states) are forbidden.
Note that one consequence of superconductivity is the Meissner effect where all magnetic flux is
expelled from the material and the superconductor becomes a perfect diamagnet in theory.
1.2.6 Surface resistance in SRF cavities
Although resistance in superconducting materials is extremely low, it is nevertheless non-zero.
The surface resistance has two components, Mattis-Bardeen surface resistance (often referred to
as BCS resistance 𝑅𝐵𝐶𝑆, as it is derived from the Bardeen-Cooper-Schrieffer theory of
superconductivity), and residual resistance 𝑅𝑟𝑒𝑠.
𝑅𝑠(𝑇, 𝐵) = 𝑅𝐵𝐶𝑆(𝑇) + 𝑅𝑟𝑒𝑠(𝐵) [4]
𝑅𝐵𝐶𝑆 arises from induced oscillations of electrons that are not bound by Cooper pairs caused by
the high frequency magnetic field. The motion of these electrons dissipates power, it is possible to
show that 𝑅𝐵𝐶𝑆 ∝ 𝜆𝑙3𝜔2𝑙𝑒
−Δ(𝑇)
𝑘𝐵𝑇, indicating that the resistance increases with both frequency (hence
the use of low frequency radio waves in SRF cavities) and temperature.
Meanwhile, the residual resistance can be cause by several different things, including impurities,
trapped magnetic flux and lattice distortions.
1.2.7 Magnetic vortices and dirty surfaces
Research has been done which presents a theoretical description to describe how a ‘dirty layer’
such as that introduced by nitrogen treatment can result in the improved performance of SRF
cavities [10]. In particular it was shown that a superficial nitrogen-enriched layer can delay vortex
penetration, increasing the cavity quench field, and also increasing the Q-factor of the resonator.
A magnetic vortex can be thought of as a normal conducting column in the material with
superconducting currents encircling it which screens the magnetic flux confined within from the
Meissner state around it, see the left figure below.

George Lewis Fermilab Helen-Edwards Intern Report August 2017
10
Figure 4: Left shows diagram of magnetic vortices, Middle shows Gibbs free energy plot for a
normal surface, Right shows the same plot with a dirty layer (graphs from [10]).
These vortices experience an attractive Lorentz force towards the surface of the superconductor
that can be calculated as the interaction between the vortex and its image outside the material..
They also experience a repulsive Lorentz force from interaction with the applied field which tries
to push them into the bulk. Integrating these forces leads to an expression for the Gibbs free energy
density as a function of depth, see the middle figure above. This shows that in the absence of any
nucleation points, there is a small energy barrier which tries to stop vortices residing in the bulk.
It is useful to define 𝜅 =𝜆
𝜉 the Ginzburg-Landau parameter (where 𝜆 is London penetration depth
and 𝜉 is coherence length) which can be viewed as a measure of the surface cleanliness (higher
values correspond to a dirty surface, due to a shorter mean free electron path), so considering the
case where it varies with depth allows one to analyse the effect of a dirty layer at the surface.
This can be seen in the right figure above, where the black line corresponds to the red line in the
middle figure (with no dirty layer), and the other curves show the Gibbs free energy when a dirty
layer of varying thickness is present. It was shown that a dirty layer pushes the Meissner state up
to the bulk lower critical field, meaning that higher magnetic fields can be used whilst retaining
superconductivity, and moreover it was observed that a thin dirty layer greatly increases the barrier
for vortex nucleation.
Since vortex motion in the superconductor is affected by drag viscosity, preventing vortex
nucleation by means of a dirty layer relaxes the cavity limitation due to vortex penetration, and the
quench field is increased. In addition, the quality factor of the resonator is also enhanced due to
the doping effect of the interstitial nitrogen in the superficial dirty layer.

George Lewis Fermilab Helen-Edwards Intern Report August 2017
11
1.2.8 Secondary Ion Mass Spectrometry (SIMS)
SIMS is one of the most sensitive surface analysis techniques available and can detect impurities
at less than 1 ppm [11].
SIMS works by firing a primary ion beam at the sample surface which breaks the surface apart and
produces ion fragments which can then be detected. The basic information provided is a very
detailed mass spectrum (intensity vs mass/charge ratio) but by scanning the primary ion beam over
the sample surface it is possible to produce surface maps (fragment intensity as a coordinate on
the sample surface) and manipulation of properties of the primary ion beam allow for depth profiles
(concentration vs depth into sample) to be obtained too. See the figure below for an example of
the data that can be gathered using SIMS.
Figure 5: SIMS data example: Left – mass spectrum, Middle – depth profile, Right – surface map
SIMS is thus well suited for studies into nitrogen treated niobium where the nitrogen is present in
very small amounts and only at the surface, since it provides a method sensitive enough to be able
to detect this small amounts and is well suited for obtaining surface information.
It does however provide data which can be difficult to interpret and cannot easily be made
quantitative. The complexity arises from the huge variety of processes that can happen when the
primary ion beam impinges on the sample surface: Ionisation of different species happens at
different rates depending on ionisation energies; the energy provided can also cause the formation
or destruction of certain molecular complexes; there is the possibility of embedding the primary
ions within the sample which can further complicate results, amongst other processes. See the
figure below for a simple schematic of what happens in SIMS.

George Lewis Fermilab Helen-Edwards Intern Report August 2017
12
Figure 6: Diagram of primary ion beam hitting sample surface; producing various fragments.
The detector on the SIMS machine used was a Time Of Flight (TOF) detector, which separates
particles of different mass simply by observing that small ions will move faster than big ions. Thus
each burst of the analysis gun produces a full mass spectrum for the spot that was analysed, hence
one can appreciate that the amount of data collected when taking a SIMS profile is vast.
1.2.9 Primary ion sources for SIMS
The fine control of the primary ion beam is largely responsible for the high sensitivity and utility
of SIMS analysis. The primary ion beam can be chosen for a variety of different purposes.
The SIMS machine that was used for this project has two separate ion guns:
- The analysis gun is a Liquid Metal Ion Gun (LMIG) which uses a tungsten needle to
heat a reservoir of bismuth (traditionally gallium but Bi offers a lower melting point)
to produce short, focused beams which do not break the sample apart much past the
first monolayer. This produces the fragments which are collected for analysis.
- The sputtering gun is a Dual Source Column (DSC) capable of firing both cesium and
oxygen ions at the sample which enhances the yield of electropositive and
electronegative atoms respectively. The purpose of the DSC is to sputter away the
surface of the sample layer at a time in order to dig deeper and allow for the
construction of depth profiles.
Thus the typical running of the SIMS machine would be to run the analysis gun for some time,
then switch to the sputtering gun until a new depth is reached and then swap back to the analysis
gun and repeat this switching process until a depth profile is created.

George Lewis Fermilab Helen-Edwards Intern Report August 2017
13
1.2.10 Fick’s laws of diffusion
There are two laws derived by Adolf Fick in 1855 which can be used to describe diffusion of one
substance in another. They are pertinent to describing the flux of nitrogen in a niobium lattice.
The first law (equation 5) says particles spread away from regions of high concentration and
applies in a steady state regime (concentration is constant in time). The second law (equation 6)
says steep changes in concentration gradient cause the concentration to change faster over time.
𝐽 = −𝐷𝛻𝜑 [5]
𝜕𝜑
𝜕𝑡= 𝐷∇2𝜑 [6]
Where 𝐽 is diffusion flux, 𝐷 is the diffusion coefficient (or diffusivity), 𝜑 is the concentration, and
𝑡 is time. Furthermore, in solids 𝐷 is found to obey an Arrhenius style equation.
𝐷 = 𝐷0𝑒−𝐸𝐴𝑘𝑇 [7]
Where 𝐷0 is the maximum diffusivity (at infinite temperature), 𝐸𝐴 is the activation energy of
diffusion per atom and 𝑘𝑇 is the thermal energy of each atom.
1.2.11 Niobium nitride phases
There are several phases of niobium nitride which depend on the relative concentrations of
niobium and nitrogen as well as the temperature of formation, see the figure below.
Figure 7: Left shows binary phase diagram, Right shows lattices of niobium and nitrogen [7] [12] .
𝛼 𝛽
𝛾 𝛿 𝛿′
휀
George Lewis Fermilab Helen-Edwards Intern Report August 2017
14
There are in fact six phases of niobium nitride that can be formed, with cubic crystal lattices having
higher critical temperatures than hexagonal, making them the useful superconductors.
In previous doping experiments, it has been found that after nitrogen treatment, there are several
different niobium nitride phases present on the material surface, such as non-superconducting 𝛽-
phase niobium nitride. However, after surface material removal by electro polishing (EP), no
stoichiometric niobium nitride phases are found, and it appears to be this interstitial, non-
stoichiometric nitrogen present within the niobium lattice which produces beneficial performance
in doped cavities [13] [14].
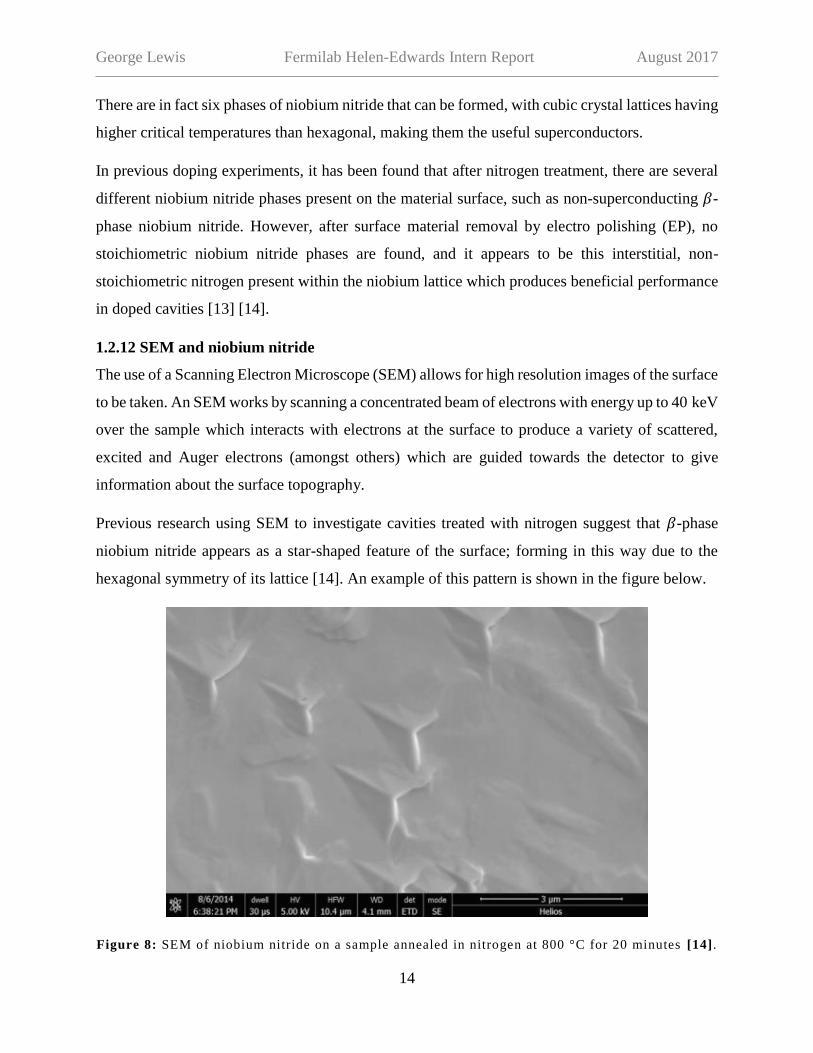
1.2.12 SEM and niobium nitride
The use of a Scanning Electron Microscope (SEM) allows for high resolution images of the surface
to be taken. An SEM works by scanning a concentrated beam of electrons with energy up to 40 keV
over the sample which interacts with electrons at the surface to produce a variety of scattered,
excited and Auger electrons (amongst others) which are guided towards the detector to give
information about the surface topography.
Previous research using SEM to investigate cavities treated with nitrogen suggest that 𝛽-phase
niobium nitride appears as a star-shaped feature of the surface; forming in this way due to the
hexagonal symmetry of its lattice [14]. An example of this pattern is shown in the figure below.
Figure 8: SEM of niobium nitride on a sample annealed in nitrogen at 800 °C for 20 minutes [14] .

George Lewis Fermilab Helen-Edwards Intern Report August 2017
15
2. Experimental details
Surface analysis was performed using an IONTOF dual beam secondary ion mass spectrometer,
in some cases accompanied also by the use of a scanning electron microscope.
For the investigation into niobium-nitrogen phase space at lower temperature, eight samples were
prepared. Each was subjected to a 3 hour bake at 800 °C followed by 30 minutes nitrogen infusion
at 25 mTorr with temperatures ranging from 200 to 800 °C. SIMS and SEM analysis was
subsequently performed on the samples.
Next, in order to investigate the effect of changing various infusion recipe parameters, several
modifications were made to the standard infusion recipe. One regular sample (3 hour bake at
800 °C followed by 48 hours of nitrogen infusion at 25 mTorr and 120°C) was compared with four
variants: one infused at 160 °C, one infused for a longer time of 96 hours, one infused at a higher
pressure of 760 Torr, and one which had not been baked at 800 °C before infusion.
Finally, a niobium infused sample was prepared in the sample preparation chamber of our SIMS
machine using the standard 160 bake recipe: 3 hour bake at 800 °C followed by 48 hours of
nitrogen infusion at 25 mTorr and 160 °C. The sample was analysed at every point during
synthesis: before treatment, after the initial bake, after nitrogen infusion, and after subsequent
oxidation.
Note that the nitrogen signal of the SIMS machine was enhanced by profiling in negative polarity
and using the Cs sputtering column which has been shown to improve the yield of electronegative
ions [15]. The NbN signal was chosen as an indication of nitrogen levels as it had a higher yield
than other nitrogen containing species while Nb2O5 was used as an indicator of oxygen levels. The
majority of runs also used an analysis area of 300×300 𝜇m which was determined to be suitably
representative of the surface since at this size, many individual grains are measured. The crater
sputtered had an area of 800×800 𝜇m to avoid any complications from edge effects.

George Lewis Fermilab Helen-Edwards Intern Report August 2017
16
3. Results and discussion
The data from each experiment is presented below along with analysis and discussion of the results.
3.1 Development of SIMS analysis interface
As discussed in section 1.2.8, the amount of data produced during a SIMS depth profile analysis
is enormous; in order to obtain depth profiles that are easy to read and that can be compared
between samples, the raw SIMS data had some processing. All data analysis features were
designed and built-in to a graphical user interface (GUI) which can now be accessed online [16].
The figure below shows the appearance and various features of the GUI.
Figure 9: Final appearance of GUI developed for depth profile analysis.
George Lewis Fermilab Helen-Edwards Intern Report August 2017
17
It is necessary to normalise results to account for variations in the data acquisition that may not
relate to actual surface chemical differences, such as variations in primary ion or detector currents,
and there are several possible methods [17]. In most cases, the normalisation procedure used was
to divide by the Nb signal; the Nb signal for each sample remains at an approximately constant
value since it is the major component of the matrix and this allows us to see the amount of nitrogen
relative to niobium. However, in some cases, normalisation by total count has also been used.
In most cases, a Savitzky-Golay filter has also been applied to the SIMS data in order to increase
the signal-to-noise ratio without greatly changing the signal shape. This works by fitting successive
sets of adjacent data points to a low-degree polynomial by linear least squares [18], this method
produced superior results to other smoothing procedures that were tried. However, in a few cases,
this method appears to artificially ‘over smooth’ data and so another smoothing method was also
used which simply works by convoluting the data with a box that encompasses a number of
adjacent data points specified by the user.
Additionally, in some cases sputtering time has been converted into depth. This was done assuming
a uniform sputtering rate, with a scalar multiplication constant determined using IONTOF
software. It is acknowledged that while this may provide a useful comparison in some cases, the
feature should be used with caution as it does not account for additional complexities which may
cause the real depth to be significantly different.
Furthermore, some time was spent on trying to make the GUI as user-friendly as possible and so
it also has some extra features such as: the ability to resize the window and have the components
inside change dynamically; hovering over any button in the window will display some help text
telling you the exact function of the button; and an error display bar was included at the bottom of
the window which informs the user in case for some reason the program is unable to perform a
task and specifies the cause of the issue.
3.2 Temperature series
This is the experiment which aimed to find the temperature at which poorly superconducting
nitride phases form by carrying out the infusion recipe at a variety of different temperatures. The
top part of the figure below shows the NbN depth profiles obtained using SIMS and the bottom
part displays corresponding SEM images of the sample surfaces.

George Lewis Fermilab Helen-Edwards Intern Report August 2017
18
Figure 10: Top shows SIMS depth profiles for the NbN signal,
Bottom shows SEM photos, both for samples infused with ni trogen at different temperatures .
800 °C 700 °C
600 °C 500 °C
400 °C 300 °C

George Lewis Fermilab Helen-Edwards Intern Report August 2017
19
It is observed that the amount of nitrogen in the sample increases as the temperature increases.
This is in agreement with Fick’s law which is discussed in section 1.2.10. Of more interest is the
change in the shape of NbN depth profile between 600 and 700 °C, when viewed in conjunction
with the change in nitride appearance of the SEM images from ‘star-shaped’ to a ‘scaly’ pattern
over the same temperatures, it suggests that this could be the temperature region for the phase
change.
However, it is important to be aware that a single SEM photo of the surface is of course not
representative of the entire sample. Indeed, most samples showed variation over the surface, with
some grains showing nitrides and other grains showing different nitrides or none at all.
Future XRD studies on these samples will be able to provide more data which will either
corroborate these claims or provide basis for further research into the area.
3.3 Infusion recipe variations
This experiment aimed to explore the best parameters for nitrogen infusion. The variations in
question were previously constructed as full cavities and so in addition to the depth profiles and
SEM images, Q vs E curves are also presented for this experiment.
Figure 11: Left shows SIMS depth profile for variations, Right shows Q vs E performance curve
for regular (green), 96 hr infused cavity (red) and 160 °C (orange) cavities [6] .

George Lewis Fermilab Helen-Edwards Intern Report August 2017
20
Figure 12: SEM images of different variations on the regular diffusion recipe .
The immediate difference between these samples is the large amount of nitride present in the 96 hr
sample compared to all others. This sample exhibits unprecedentedly high Q at mid-field but a
premature onset of Q slope compared to regular treatment. This makes it clear how infusion time
is just as important as the temperature in regulating the diffusion of nitrogen and growth of nitride
phases. It also suggests that while 𝛽-phase nitride may not be conducive to high fields, it can still
produce cavities with extremely high 𝑄 at lower fields.
The ‘No 800C bake’ sample also provides some useful insight. The reason that an 800 °C bake is
part of the recipe is to ‘reset’ the niobium surface and destroy any oxides that have formed. By
removing this step, it is possible to see what happens if an oxide layer shields the bulk niobium
below from nitrogen. We see from the SIMS profile that it has the lowest levels of nitrogen,
especially at the surface. This is in agreement with the theory that the oxide is blocking the
niobium. Therefore it shows that in order to have good penetration of nitrogen into the niobium, it
is important to begin with a clean surface.
We also see that the performance of the cavity baked at 160 °C is somewhere between that of the
regular and the 96 hr cavity, performing with high Q at mid field. It also exhibits a much lower
Regular 760 Torr
96 hr No 800 °C bake

George Lewis Fermilab Helen-Edwards Intern Report August 2017
21
nitrogen count than the 96 hr cavity, and while SEM images have not yet been taken, it suggests
that we would likely find some mix of the surface features found in the regular and 96 hour cavity.
This experiment has essentially shown that the response of the cavity can be tailored to perform
with extremely high quality factor over a range of accelerating fields and that this performance is
closely linked to the amount and type of nitride present at the surface.
3.4 In-situ baking
This experiment was partly performed as a trial into in-situ baking and SIMS analysis since the
process has not been attempted before, but also with an aim to looking at how oxidation changes
the nitrogen depth profile for infused samples. The SIMS results are shown below.
Figure 13: SIMS depth profiles of a 160 °C infused sample at various stages of synthesis,
Left shows NbN signal while Right shows Nb 2O5.
The results in this experiment are normalized to the total count rather than the niobium signal;
nonsensical results were obtained when normalizing to niobium which is likely due to issues with
SIMS performance, these issues are effectively removed though by normalizing to the total count.
One can be confident in the general trend of these signals as it is found for example that there is
more nitrogen present after infusion than compared to the untouched surface, and similarly the
oxygen intensity increases after exposure to atmosphere when compared to the untouched surface
which is to be expected.
It is interesting to note that the level of nitrogen at the surface appears to decrease after exposure
to oxygen (difference between red and green curves in figure). This suggests that oxygen disrupts

George Lewis Fermilab Helen-Edwards Intern Report August 2017
22
or alters the positioning of nitrogen in the sample. Perhaps in order to get optimal performance the
first ⁓150 nm of surface should be removed since this is the approximate depth at which the
nitrogen signal recovers in the oxidized sample, however, this is likely to result in re-oxidation.
4. Conclusion
The aim of this internship was to investigate nitrogen treated SRF cavities; in particular looking at
the temperature at which poorly superconducting nitrides form during infusion, the optimal
infusion recipe and the results of in-situ analysis.
It can be concluded that there is a visible change in the surface nitrides between 600 °C and 700 °C
which possibly corresponds to a change of phase but future XRD studies will be required to
confirm this.
It was also observed that doubling the infusion time from the standard recipe produces significantly
more nitrides at the surface and this corresponds to a cavity with high performance at low field.
Using a slightly higher temperature was seen to perform somewhere between the regular and
increased time cavities, with high Q at medium fields. Meanwhile the cavity with no high
temperature bake beforehand showed that oxygen at the surface prevents effective diffusion of
nitrogen into the sample.
The in-situ analysis showed exposure to oxygen after the infusion process displaces the nitrogen
which had formed previously and suggests that the region most affected is the first ⁓150 nm. It has
also resulted in a process being established for performing future in-situ studies.
Furthermore, performing these experiments, has led to: the creation of a user interface for the
processing of SIMS data to produce depth profiles; and the creation of a summary of useful pre-
requisite theories and background information for anybody wishing to begin studying this area.

George Lewis Fermilab Helen-Edwards Intern Report August 2017
23
5. References
[1] U.S. Department of Energy, "Accelerators
for America's Future," 2010.
[2] R. Kephart et al, "SRF, Compact
Accelerators for Industry & Society," in
SRF2015, Whistler, Canada, 2015.
[3] H. Padamsee, "50 years of success for SRF
accelerators — a review," Superconductor
science and technology, vol. 30, p. 05003
(23 pp), 2017.
[4] A. Grassellino et al, "Nitrogen and argon
doping of niobium for superconducting
radio frequency cavities: a pathway to
highly efficient accelerating structures,"
Superconductor science and technology,
vol. 26, pp. 102001 - 102007, 2013.
[5] A. Grassellino et al, "N doping: Progress in
development and understanding," in
SRF2015, Whistler, Canada, 2015.
[6] A. Grassellino et al, "Unprecedented
Quality Factors at Accelerating Gradients
up to 45 MV/m in Niobium
Superconducting Resonators via Low
Temperature Nitrogen Infusion,"
Superconducting science and technology,
2017.
[7] G. Brauer and R. Esselborn, "Nitridphasen
des Niobs," Zeitschrift fur anorganische
und allgemeine chemie, vol. 309, no. 3-4,
pp. 151-170, 1961.
[8] J. Keinonen, J. Raisanen and A. Anttila,
"Diffusion of Nitrogen in Vanadium and
Niobium," Applied Physics A, vol. 34, pp.
49-56, 1984.
[9] Y. Trenikhina, R. A, J. Kwon, J.-M. Zuo
and Z. J. F, "Nanostructural features
degrading the performance of
superconducting radio frequency niobium
cavities revealed by transmission electron
microscopy and electron energy loss
spectroscopy," Journal of Applied Physics,
vol. 117, p. 154507, 2015.
[10] M. Checchin, M. Martinello, A.
Romanenko, A. Grassellino and S. Posen,
"Enhancement of the accelerating gradient
in superconducting microwave resonators,"
in Linear Accelerator Conference, East
Lansing, MI, 2016.
[11] F. A. Stevie, Secondary Ion Mass
Spectrometry: Applications for Depth
Profiling and Surface Characterization, C.
R. Brundle, Ed., New York: Momentum
Press, 2016.
[12] M. Hilbig, "Calculation of diffusion
profiles of Nitrogen in Niobium to
investigate the surface concentration after
nitrogen treatment experiments," DESY,
Hamburg, 2014.
[13] Y. Trenikhina, A. Grassellino, A.
Romanenko, J. Kwon, J.-M. Zuo, M.
Sardela and R. Haasch, "Extended
characterization of nitrogen doping recipe
for Nb superconducting radio frequency
cavities," Unpublished manuscript, 2017.
[14] Y. Trenikhina, A. Grassellino, O.
Melnychuk and R. A, "Characterization of
nitrogen doping recipes for the Nb SRF
cavities," in SRF2015, Whistler, Canada,
2015.
[15] H. Storms, K. Brown and J. Steln,
"Evaluation of a Cesium Positive Ion
Source for Secondary Ion Mass
Spectrometry," Analytical Chemistry, vol.
49, no. 13, pp. 2023-2030, 1977.
[16] G. Lewis, "SIMS Analysis GUI," 29
August 2017. [Online]. Available:
https://github.com/grlewis333/SIMS-
Analysis-GUI.
[17] D. J. Grahama, M. S. Wagner and D. G.
Castner, "Information from Complexity:
Challenges of TOF-SIMS Data
Interpretation," Applied Surface Science,
vol. 252, no. 19, pp. 6860-6868, 2006.
[18] A. Savitzky and M. Golay, "Smoothing and
Differentiation of Data by Simplified Least
Squares Procedures," Analytical chemistry,
vol. 36, no. 8, pp. 1627-1639, 1964.