characterisation of greywater estimation of design values characterisation of greywater estimation...
TRANSCRIPT
Jan Christian Sievers1, Martin Oldenburg2, Andrea Albold3,
Jörg Londong1
EWA 17th International Symposium, IFAT 2014,
Munich, Germany 5. - 9. May 2014
Characterisation of Greywater
Estimation of Design Values
1Bauhaus-Universität Weimar, Coudraystraße 7, 99423 Weimar, Germany
2University of Applied Science Ostwestfalen-Lippe, An der Wilhelmshöhe 44, 37671 Höxter, Germany
3 OtterWasser GmbH, Travemünder Allee 79, 23568 Lübeck, Germany
Introduction
Material and Methods
Results
Literature study
Sampling campaigns
Conclusion and outlook
Content
Jan Christian Sievers EWA 17th International Symposium , IFAT
2014 Munich, Germany 5. - 9. May 2014 2
introduction
Jan Christian Sievers EWA 17th International Symposium , IFAT
2014 Munich, Germany 5. - 9. May 2014
flo
w
urine
~ 500 L/(c*a) feces
~ 50 L/(c*a)
greywater
25.000 -100.000
L/(c*a)
N ~ 4-5 kg/(c*a) ~ 3 % ~ 87 % ~ 10 %
~ 34 % K ~ 1,8 kg/(c*a) ~ 54 % ~ 12 %
P ~ 0,75 kg/(c*a) ~50 % ~ 40 % ~ 10 %
COD ~ 30 kg/(c*a) ~ 41 % ~ 12 % ~ 47 %
Greywater is defined as household wastewater,
excluding wastewater from toilets
Greywater is a multi component mixture
Largest domestic wastewater flow
About 50 – 75 % of the total wastewater flow
In Germany about 60 – 90 l/(c•d) of greywater
For the design of treatment units and the knowledge
of loads and concentrations is fundamental
Germany: no design values for greywater treatment
units are avaiable
3
Greywater
material and methods
Jan Christian Sievers EWA 17th International Symposium , IFAT
2014 Munich, Germany 5. - 9. May 2014
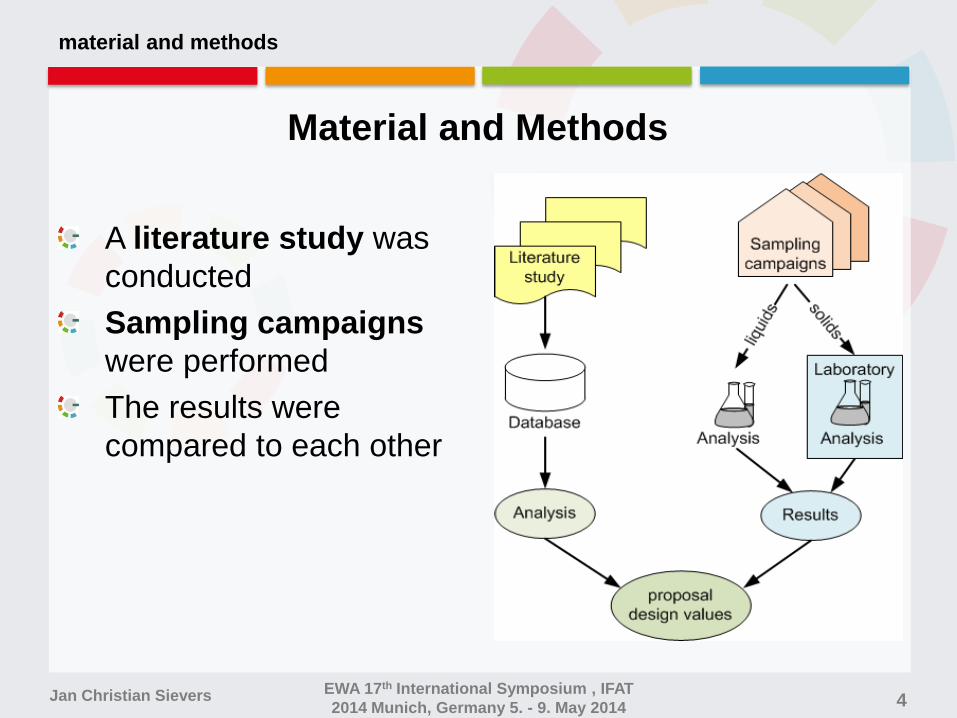
Material and Methods
A literature study was
conducted
Sampling campaigns
were performed
The results were
compared to each other
4
material and methods (2)
Jan Christian Sievers EWA 17th International Symposium , IFAT
2014 Munich, Germany 5. - 9. May 2014
Literature study
Literature study with more than 130 references was
performed with a focus on european data
60% of the European data are from Germany, 20%
from Sweden, 10% from Netherlands and the
remaining from other countries
45 % of the references are dealing with light greywater
Statistical analyses of the literature data
Inconsistent data quality
Lack of information about number of samples, analytical
procedures
5
material and methods (3)
Jan Christian Sievers EWA 17th International Symposium , IFAT
2014 Munich, Germany 5. - 9. May 2014
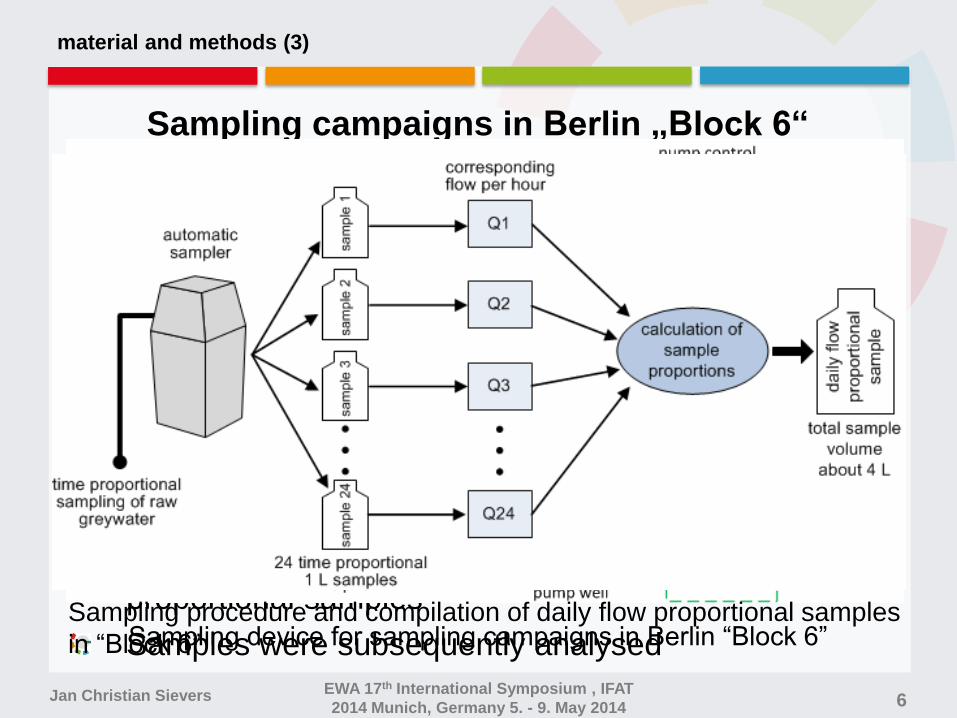
Sampling campaigns in Berlin „Block 6“
Two sampling campaigns were carried out in Berlin
„Block 6“
7 days in November 2012
10 days in April 2013
Multi-storey building with 20 apartements and 51
inhabitants
samples taken from the collection pipe inside the
building
Time proportional sampling was performed
Raw greywater samples were mixes into daily flow-
proportional samples
Samples were subsequently analysed
6
Sampling device for sampling campaigns in Berlin “Block 6” Sampling procedure and compilation of daily flow proportional samples
in “Block 6”
material and methods (4)
Jan Christian Sievers EWA 17th International Symposium , IFAT
2014 Munich, Germany 5. - 9. May 2014
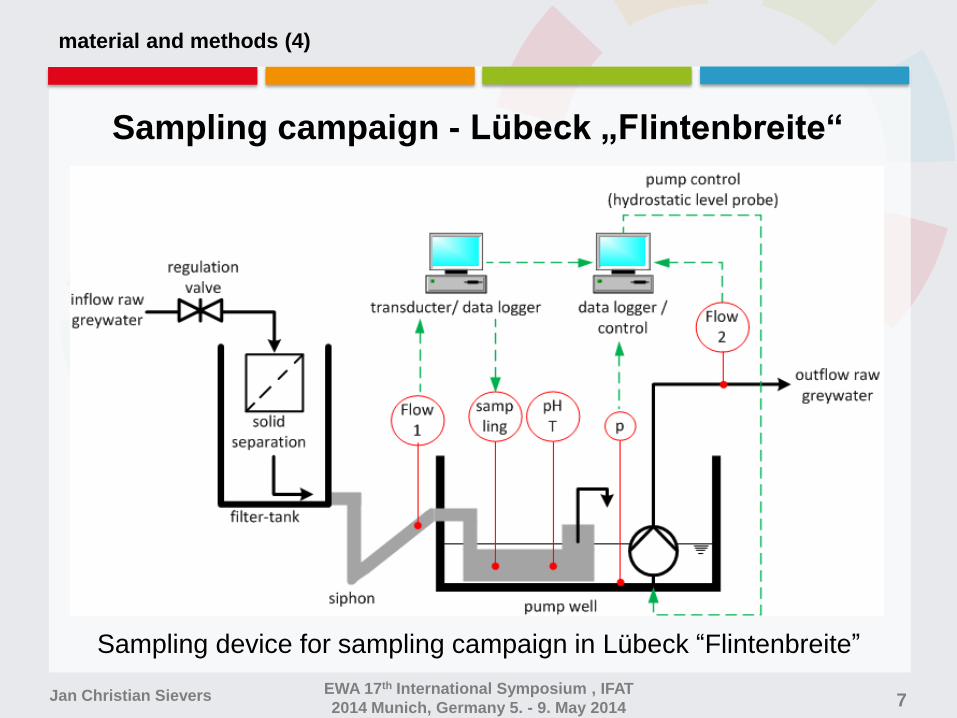
Sampling campaign - Lübeck „Flintenbreite“
Sampling campaign was carried out in Lübeck
“Flintenbreite” for 12 days in Nov./Dec. 2013
12 semi detached houses with 46 inhabitants
Samples taken in the first sedimentation tank of the
treatment unit
Flow proportional sampling was performed
The flow proportional samples were mixes into daily
flow-proportional samples
Samples were subsequently analysed
7
Sampling device for sampling campaign in Lübeck “Flintenbreite”
results (1)
Jan Christian Sievers EWA 17th International Symposium , IFAT
2014 Munich, Germany 5. - 9. May 2014
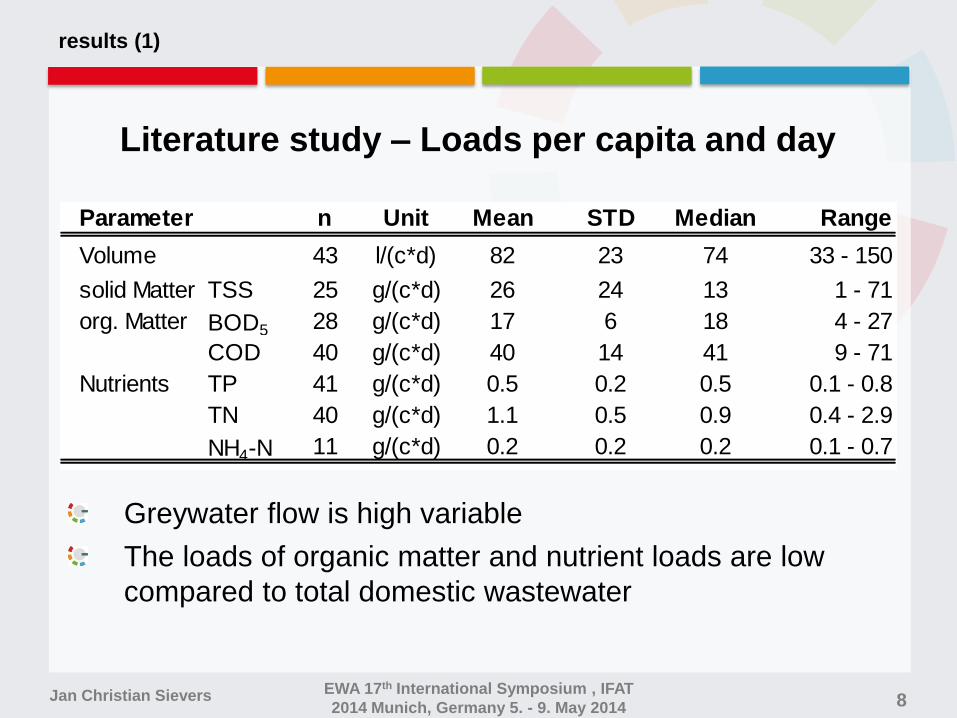
Literature study – Loads per capita and day
8
Greywater flow is high variable
The loads of organic matter and nutrient loads are low
compared to total domestic wastewater
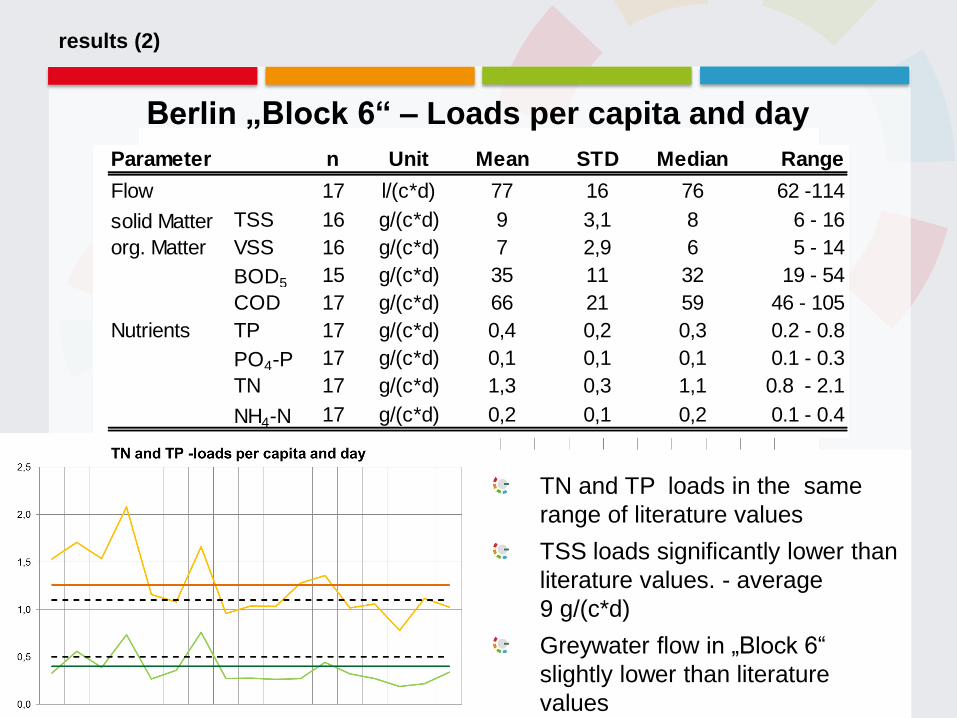
Parameter n Unit Mean STD Median Range
Volume 43 l/(c*d) 82 23 74 33 - 150
solid Matter TSS 25 g/(c*d) 26 24 13 1 - 71
org. Matter BOD5 28 g/(c*d) 17 6 18 4 - 27
COD 40 g/(c*d) 40 14 41 9 - 71
Nutrients TP 41 g/(c*d) 0.5 0.2 0.5 0.1 - 0.8
TN 40 g/(c*d) 1.1 0.5 0.9 0.4 - 2.9
NH4-N 11 g/(c*d) 0.2 0.2 0.2 0.1 - 0.7
9 9
results (2)
Parameter n Unit Mean STD Median Range
Flow 17 l/(c*d) 77 16 76 62 -114
solid Matter TSS 16 g/(c*d) 9 3,1 8 6 - 16
org. Matter VSS 16 g/(c*d) 7 2,9 6 5 - 14
BOD5 15 g/(c*d) 35 11 32 19 - 54
COD 17 g/(c*d) 66 21 59 46 - 105
Nutrients TP 17 g/(c*d) 0,4 0,2 0,3 0.2 - 0.8
PO4-P 17 g/(c*d) 0,1 0,1 0,1 0.1 - 0.3
TN 17 g/(c*d) 1,3 0,3 1,1 0.8 - 2.1
NH4-N 17 g/(c*d) 0,2 0,1 0,2 0.1 - 0.4
Jan Christian Sievers
Berlin „Block 6“ – Loads per capita and day
COD loads range between 46 g/c*d and 105 g/c*d
BOD5 loads between 19 g/c*d and 54 g/c*d
Average COD and BOD5 loads are 66 g/c*d and 35 g /c*d and
significantly higher than literature values
TN and TP loads in the same
range of literature values
TSS loads significantly lower than
literature values. - average
9 g/(c*d)
Greywater flow in „Block 6“
slightly lower than literature
values
results (3)
10 Jan Christian Sievers EWA 17th International Symposium , IFAT
2014 Munich, Germany 5. - 9. May 2014
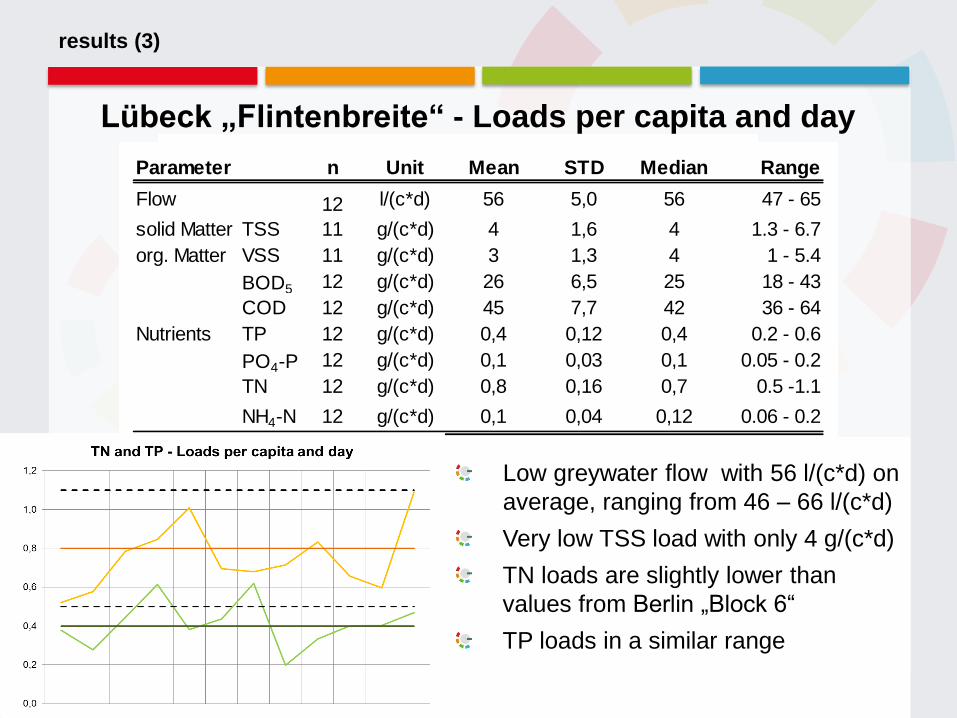
Lübeck „Flintenbreite“ - Loads per capita and day
COD and BOD5 loads significantls lower than the results from Berlin and
slightly higher than literature values
Average COD and BOD5 loads are 45 g/(c*d) and 26 g/(c*d)
Parameter n Unit Mean STD Median Range
Flow 12 l/(c*d) 56 5,0 56 47 - 65
solid Matter TSS 11 g/(c*d) 4 1,6 4 1.3 - 6.7
org. Matter VSS 11 g/(c*d) 3 1,3 4 1 - 5.4
BOD5 12 g/(c*d) 26 6,5 25 18 - 43
COD 12 g/(c*d) 45 7,7 42 36 - 64
Nutrients TP 12 g/(c*d) 0,4 0,12 0,4 0.2 - 0.6
PO4-P 12 g/(c*d) 0,1 0,03 0,1 0.05 - 0.2
TN 12 g/(c*d) 0,8 0,16 0,7 0.5 -1.1
NH4-N 12 g/(c*d) 0,1 0,04 0,12 0.06 - 0.2
Low greywater flow with 56 l/(c*d) on
average, ranging from 46 – 66 l/(c*d)
Very low TSS load with only 4 g/(c*d)
TN loads are slightly lower than
values from Berlin „Block 6“
TP loads in a similar range

conclusion and outlook (1)
Conclusion
11 Jan Christian Sievers EWA 17th International Symposium , IFAT
2014 Munich, Germany 5. - 9. May 2014
Major problem in the evaluation of literature data is the inconsistent
data quality
Greywater volumes are highly variable,
Depending on living habits and the equipment of the houses
(e.g. dishwashers, water saving devices)
COD and BOD5, the concentrations and load per capita and day
observed during the sampling campaigns were notably higher
compared to literature values.
TSS concentrations and loads found during sampling campaigns
are significantly lower compared to literature values
Literature values of TN- and TP- content and the results of
sampling campaigns are in a similar range
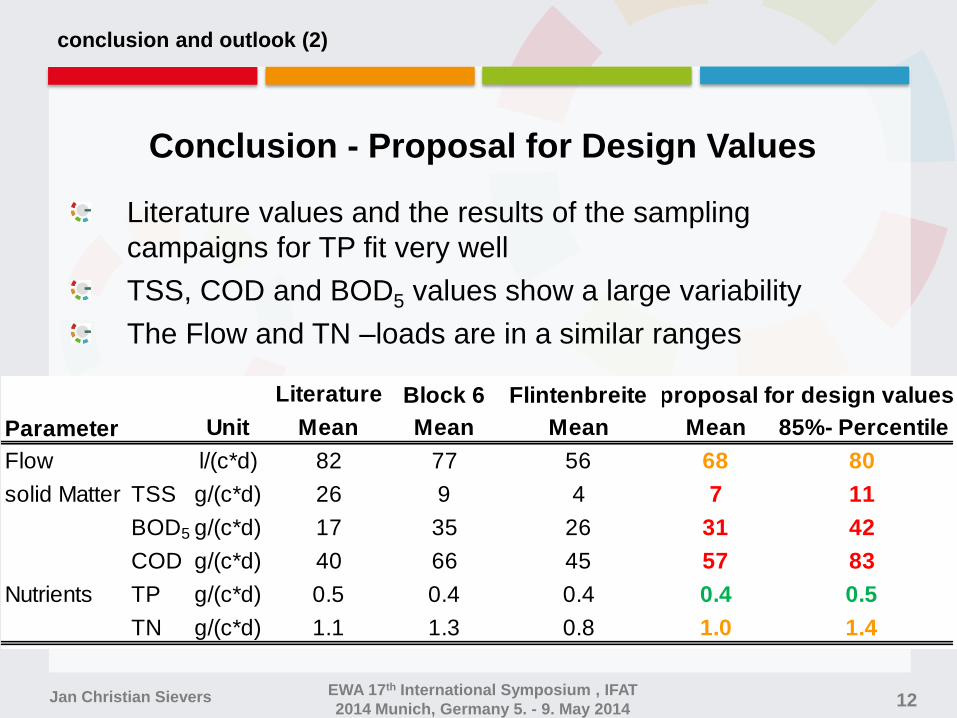
Literature values and the results of the sampling
campaigns for TP fit very well
TSS, COD and BOD5 values show a large variability
The Flow and TN –loads are in a similar ranges
conclusion and outlook (2)
Conclusion - Proposal for Design Values
Jan Christian Sievers EWA 17th International Symposium , IFAT
2014 Munich, Germany 5. - 9. May 2014 12
Literature Block 6 Flintenbreite
Parameter Unit Mean Mean Mean Mean 85%- Percentile
Flow l/(c*d) 82 77 56 68 80
solid Matter TSS g/(c*d) 26 9 4 7 11
BOD5 g/(c*d) 17 35 26 31 42
COD g/(c*d) 40 66 45 57 83
Nutrients TP g/(c*d) 0.5 0.4 0.4 0.4 0.5
TN g/(c*d) 1.1 1.3 0.8 1.0 1.4
proposal for design values
Jan Christian Sievers
Bauhaus.institute for infrastructure solutions
Bauhaus-Universität Weimar, Germany
Jan Christian Sievers EWA 17th International Symposium , IFAT
2014 Munich, Germany 5. - 9. May 2014
Thank you for your kind attention
Thanks to the BMBF for the promotion of the project KREIS
13