characterisation of direct 3d sand printing process...
TRANSCRIPT

Characterisation of Direct 3D Sand Printing Process for the Production of Sand Cast Mould Tools
Abstract
The Metal casting industry is in recovery phase after the economic crisis in 2008, customer demand continues to increase, with 98.6 million metric tons cast in 2011. Traditional ferrous and non-ferrous casting techniques require one shot or permanent moulds which require tooling to be produced. Tooling particularly for developmental projects can be costly and take valuable time to produce. Additive manufacturing has been used to manufacture complex sand patterns for metal sand casting using laser sintering and sand bonding techniques. This research focuses on characterising the sand bonded process developed by ExOne GmbH Germany.
The approach taken in this research is to evaluate characteristics of parts built in the build volume for dimensional accuracy, tensile and compressive crush strength, density, impact strength and high temperature resistance. These properties are required to compare the sand bonding 3D Sand Printing (3DSP) process to Direct Laser Sand Sintering (DLSS) and traditional Furan based casting sand mixtures. The samples were taken from a production machine over a period of 20 days to ensure consistency and reliable results.
The 3DSP process has the capability to manufacture sand patterns to an accuracy of ±0.5 mm or error less than 0.3%, it has also demonstrated the best build position to achieve accurate parts. The research has demonstrated the 3DSP patterns are comparable to traditional methods for important casting material characteristics such as tensile, compression and impact strength.
It has been shown that the 3DSP process is capable of manufacturing significantly larger parts, with build production rates up to 30 times higher compared to similar parts manufactured via the DLSS process.
They has been very few 3DSP machines sold in Europe, also there has been little published research into this new technique and therefore there is a reliance on machine manufactures’ data for assessment. This research into 3DSP has increased the knowledge of this process significantly.
This research would be of interest to designers and manufacturing engineers wishing to take advantage of the implications of having new design freedom, tool-less manufacturing with short lead times in a wide range of materials, using fundamentally tried and tested centuries old casting techniques.
The research for this paper revealed very little published academic research in this area, therefore this work will increase the body of knowledge for this niche Additive Manufacturing process.
Keywords – Sand Printing, Sand Moulding, Sand Casting, Characterisation, Materials, Dimensional Accuracy, 3D Sand Printing

1. Introduction
Today’s mass production techniques drive down product cost at the expense of product choice and flexibility. Additive Manufacturing (AM) systems are at the heart of reversing this trend for viable niche products, for instance companies have already utilised AM polymer deposition systems for hearing aid production, typically using photo reactive polymer AM systems 1. The production of direct metal parts predominately utilising exotic hard to machine materials, has so far been limited to highly complex and high value relatively small components (50 mm cube), which are difficult to manufacture economically by any other process.
Components produced using Direct Metal Laser Sintering (DMLS) have relatively low deposition rates compared to billet/subtractive machining or more traditional casting processes2.
Traditional casting techniques for high temperature melting alloys are normally always manufactured by a disposable one off ceramic or silica mould capable of withstanding the high temperatures and other casting requirements. Once the mould is produced, the pouring/deposition and solidification is accomplished in seconds or minutes, with carefully controlled mould production, casting and cooling techniques giving dimensional accurate, reliable and predictable component quality can be achieved.
Direct Laser Sand Sintering (DLSS) use similar techniques as direct metal laser melting (DMLM), which has the same inherent process characteristics, long warm up and cool down stages and limited sintering zone3. The sinter production time is a function of the small laser spot size, laser travel speed at 50-100 mm/s, laser power, conductivity of bed and process settings such as step over (1/2 beam width), heat and cool down periods. Therefore sand mould pattern production by DLSS has a relatively low deposition rate 2,500 cm3/h compared to traditional techniques, however it requires no tools to produce the mould.4 It can provide design freedom for the engineer, negating the requirement to limit undercuts and inclusion of draft angle, a requirement to extract patterns and cores during mould manufacture. Therefore DLSS has the ability to achieve accurate casting capable of fitting the mass customisation model, however due to the low relative speed and high machine price can only be viable for high value, highly complex small one off castings.
The 3D Sand Print (3DSP) Process by comparison is a cold process requiring only a post-production off machine de-powdering and curing/drying process. The deposition head uses a 150 mm wide multi-jet print head travelling at 60-80 mm/s to deposit a binder to the sand in 0.28 to 0.5 mm layers, the sand has already been premixed on a large scale with the activator. The process utilises traditional sand casting materials of sand activator and furan binder to bond the silica sand grains, each layer taking 40-60 seconds to produce the sand mould tool.
The build deposition rate of 60-85,000 cm3/hr or 96 kg/hr is achieved in a near skip size (1.8 * 1.0 * 0.7 metres) build chamber; the industrial scale sand build chamber has been developed on rails to incorporate automation in production and enable quick change over of the build box and allow ease of transportation to the off-line de-powdering station.
Post processing requires a period of curing (2-4 hours) then manual vacuuming and recycling of the un-bonded sand, the patterns are then ready for dispatch to the casting process by traditional techniques in the foundry.

2. Why the Need?
The Metal casting industry is in recovery phase after the crisis in 2008, as the customer demand continues to increase, the sales of all cast metal are increasing too. According to AFS Metal Casting Forecast & Trends, in 2011, world casting production has surpassed its 2007 peak (94.9 metric tons) by reaching 98.6 million metric tons5. The US alone are forecasting an increase in sales and go up to $35.12 billion by the end of 20156. Furthermore, the global Powder Metallurgy (PM) industry has also risen since the economic crisis. According to Bernard Williams, European PM has shown sustained growth in 2013 and predicts to be better in 2014, according to the 20% increase in the first quarter compare to the same period in 2013. Increase in automotive market in Europe give boost to the increase in PM7. Direct 3D Powder Binding (D3DPB) is another area that the original MIT developed technology can be applied to achieving similar productivity results to PM as to D3DSP has to the casting industry8.
3. Design Opportunities?
Additive Manufacturing (AM) is the new breath into the Industrial sector of the global market 9, a step change in the opportunities for new design and production methods can be achieved by adopting AM technologies. The basic method of manufacturing using AM is very simple, each 2D slice or layer individual created. Design created using computer-aided design (CAD) and analysed with computer-aided engineering analysis packages allows complete design freedom, rather than limiting designs to traditional production constraints. So far, AM has been successfully applied in many industry sectors such as: Aerospace, Automotive, Medical, Defence and Consumer.
Additive manufacturing use a layer-wise manufacturing method, which gives an advantage over traditional manufacturing method in some aspects for instance each layer can create he inside and outside of a component. For that reason the traditional principals of Design for Manufacture (DFM) will no longer be required however they bring their own manufacturing process DFM, rules such as layer orientation and build characteristics. All the products can be manufactured without split lines, or it can be produced with complex internal and re-entrant features. It therefore allows reducing cost on manufacturing, assembling and inspection. Also, it helps to remove many secondary manufacturing steps, the Design for Manufacture can now become Manufacture for Design.
4. Problem Statement
The Metal Additive Manufacturing (MAM) is the new type manufacturing technology that has the ability to revolutionize the global manufacturing and logistics system compared on traditional mass production with long lead time tooling. The technology has many benefits such as tool-less manufacturing, production of complex geometry, cost efficiency, etc. With the global market increasing rapidly and consumers demanding more and new complex products, role of the MAM in production of these highly complex components is developing however the research and knowledge of these processes is limited. However, MAM. has its own characteristics and drawbacks that advantage traditional type of manufacturing process, one of those disadvantages being not efficient
in mass production, the economic sustainability of MAM in the future is in question for all but the most high value and difficult to manufacture parts. 3DSP offers an intermediate stage process, not creating the part directly, but the disposable mould tool without tools. To date several researchers have investigated sand sintering manufacturing (ref) methods for the mould and also production of ceramic moulds using the MIT Z-Corps 3D printing process, however there is little published data regarding the capability and characteristics of the ExOne sand printing process.
5. Process description
ExOne 3D Sand Printing Process
The ExOne 3D Direct Sand Printing Process (3DSP) can be used to create a core or mould via the Rapid Casting Technology (RCT) method. This method of printing uses selectively printed micro-droplets of foundry grade Furan based resin binder into a fine thin layer of permeable casting activator coated silca sand. Utilising 3DSP the manufacture of complex shapes of sand casting moulds and cores can be directly manufactured directly from CAD data, eliminating the thousands of years old conventional methods of casting requiring physical patterns to create the necessary moulds and cores. The 3DSP process is capable of producing extremely accurate sand tools with relatively high build rates compared to tradition AM processes.
The method is fast compared to Sand Sintering with a multi-jet nozzle traversing across the build in strips of 150 mm or more, therefore the production of single complex casting can be achieved in a relatively short period of time directly from the 3D design data10.
Figure 1 – Sand printing machine ExOne S-Max11
The traditional method to manufacture a single or production casting is typically illustrated in figure 2, which can take between 2- 6 weeks to achieve a cast part to evaluate depending upon the complexity and therefore the number of mould tool components to manufacture. The cost of
production of traditional patterns via CNC machining for example is low (£1-10k), however it is slow to convert digital tool deign to physical reality (1-3 weeks), once manufactured a tool may produce several 100’s of sand mould tools. DMLS and 3DSP allows full tool sets to manufactured together in a single build (18 hours) with a further 8 hours of clean and assembly operations, each tool set is individual and non-reusable. The materials are the same as for traditional sand moulding, hence therefore material costs, the DMLS and 3DSP machines (£200-400k) are twice the cost of a 5 axis CNC miller, and both processes are capable of 24-7 operation. Mould costs for DMLS/3DSP are higher than for traditional processes counter-balanced by reduced lead times and increased design/production flexibility.
6. Traditional and Sand Printed Materials
Furan binder systems account for approximately 38% of the UK chemical binder market. Furan is a popular binder system due to ease to control reaction times and strength, having generally the low material costs, excellent strength, permeability and a high mechanically reclaimed sand re-use12.
The disadvantages of Furan are that it has significant raw material price swings, the gas generation during the curing reaction, the generation of hazardous sulphur dioxide fumes on casting and most significantly the pending reclassification of furfuryl alcohol as a toxic substance9.
The change to the COSHH hazard classification, mean most furan resins move classification from a harmful to a toxic material. Moving from a group B to a group D substance, as prescribed by COSHH, with a corresponding 90% reduction in ppm exposure level for furfuryl alcohol.
New Furan technology solves several of the issues, by an up to 80% reduction in furfuryl alcohol levels, allowing the material to remain COSHH categorised as harmful. A higher reactivity has led to the reduction of between 10 and 25% in sulphur levels in the catalyst, with the corresponding benefits of lower sulphur dioxide and less sulphur effect implications for ductile irons or embrittlement in steel castings as well as much lower furfuryl alcohol exposures for foundary workers13.
The resultant new Furan bonded sand system is faster curing with only a small reduction in working time to cure time, allowing similar levels of sand reclamation on existing equipment14.
Figure 2 – Casting production method

7. Experimentation
The investigation focused upon the material and the manufactured component characteristics, to understand the build characterisation of a “standard” build in relation to part build position of the bed.
The sample sand patterns were analysed for their geometric and material properties in relation to build orientation and build platform position.
Tests were carried out to investigate Dimensional accuracy of the tensile test dumb bells, cylinders and geometric features Material properties
Tensile tests of the tensile test dumb bars Compression tests of cylinders Burn out test to establish rigidity at elevated temperatures
This accuracy investigated the error and percentage error was related to build position on the bed, orientation and part density.
These material properties investigated the tensile, compression and build density related to build position on the bed, orientation and part density.
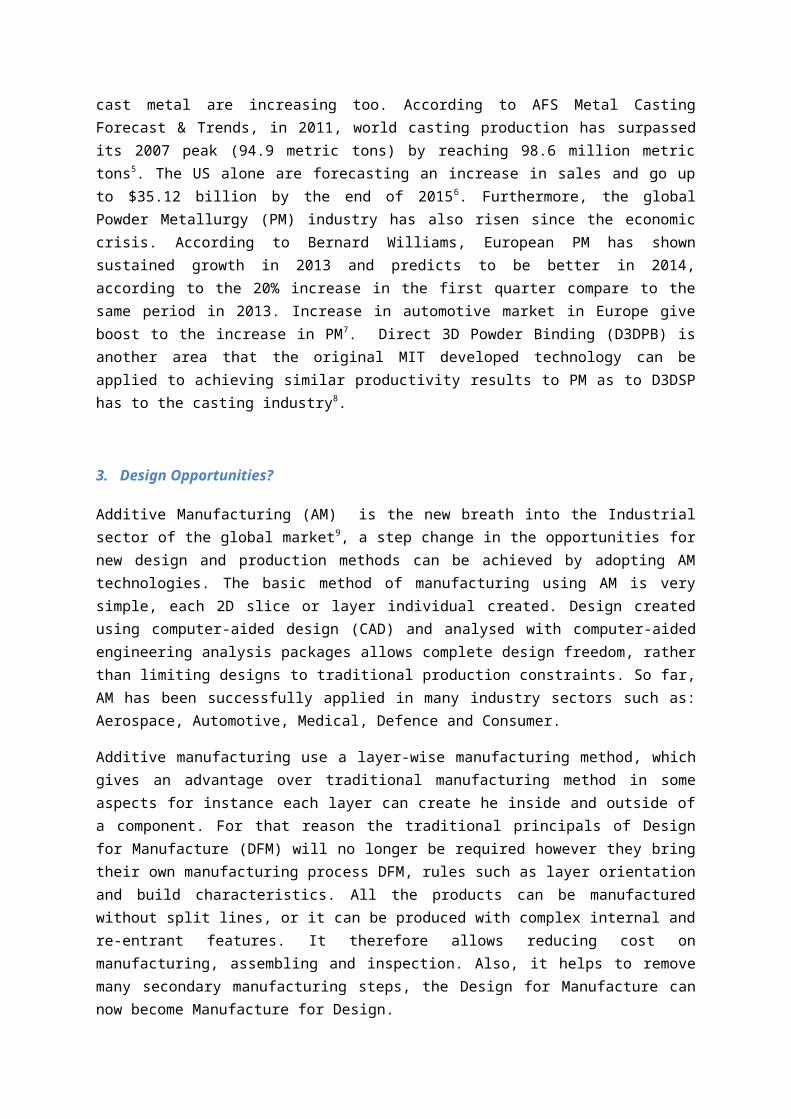
The bed was set up as a series of 3 rows and 6 columns creating 18 identical cells to build test coupons in X, Y and Z directions for the above tests.
The sand print bed layout was defined as shown in Figure 3.
Figure 3 - Bed layout for stage 1 and 2 trials
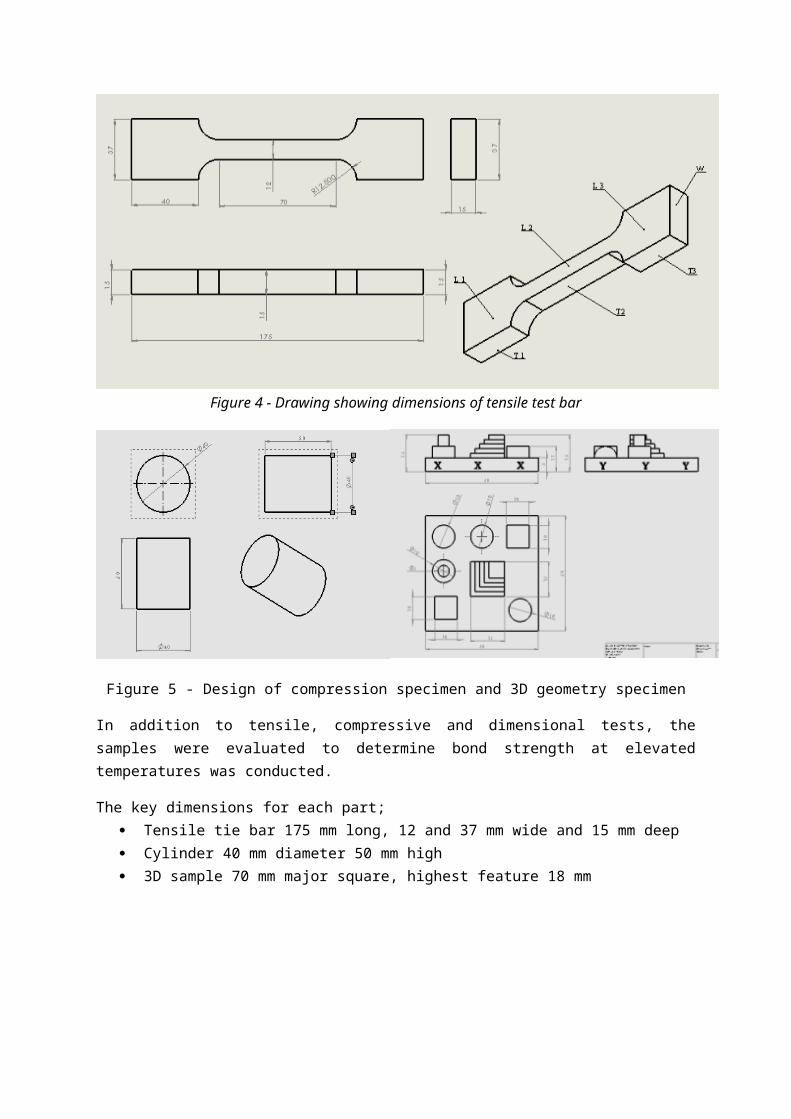
The build comprised three test pieces, the ISO standard ISO/CD 6892-1 tensile test bars shown in Figure 4, positioned in X and Y directions. A compression and permeability test cylinder Φ40 mm by 50 mm deep and a detailed test piece shown in figure 4, built over a period of 20 days.
The test components shown in figures 3-5 were used for measurement of box settings. This will be achieved through co-ordinate measurement accuracy ±2 µm and INSTRON 4485 tensile/compressive test machine.
Figure 4 - Drawing showing dimensions of tensile test bar
Figure 5 - Design of compression specimen and 3D geometry specimen
In addition to tensile, compressive and dimensional tests, the samples were evaluated to determine bond strength at elevated temperatures was conducted.
The key dimensions for each part; Tensile tie bar 175 mm long, 12 and 37 mm wide and 15 mm deep Cylinder 40 mm diameter 50 mm high

3D sample 70 mm major square, highest feature 18 mm
8. Results
8.1 Experiment No: 1 - Default build base line accuracy
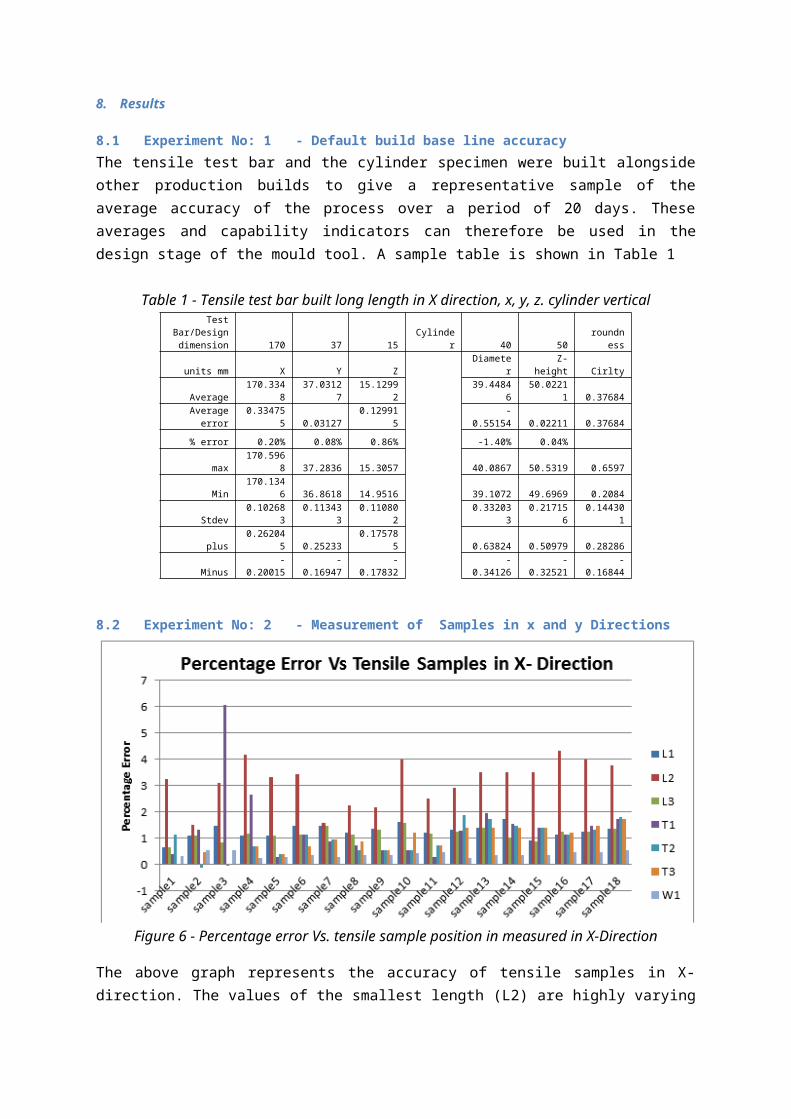
The tensile test bar and the cylinder specimen were built alongside other production builds to give a representative sample of the average accuracy of the process over a period of 20 days. These averages and capability indicators can therefore be used in the design stage of the mould tool. A sample table is shown in Table 1
Table 1 - Tensile test bar built long length in X direction, x, y, z. cylinder verticalTest Bar/Design
dimension 170 37 15 Cylinder 40 50 roundness
units mm X Y Z Diameter Z- height Cirlty
Average 170.3348 37.03127 15.12992 39.44846 50.02211 0.37684
Average error 0.334755 0.03127 0.129915 -0.55154 0.02211 0.37684
% error 0.20% 0.08% 0.86% -1.40% 0.04%
max 170.5968 37.2836 15.3057 40.0867 50.5319 0.6597
Min 170.1346 36.8618 14.9516 39.1072 49.6969 0.2084
Stdev 0.102683 0.113433 0.110802 0.332033 0.217156 0.144301
plus 0.262045 0.25233 0.175785 0.63824 0.50979 0.28286
Minus -0.20015 -0.16947 -0.17832 -0.34126 -0.32521 -0.16844
8.2 Experiment No: 2 - Measurement of Samples in x and y Directions
Figure 6 - Percentage error Vs. tensile sample position in measured in X-Direction
The above graph represents the accuracy of tensile samples in X-direction. The values of the smallest length (L2) are highly varying from sample 1 to sample 18. Graph clearly represents that T1 (thickness) range is significant in sample 3 and sample 4 compared to other samples. The other parameters such as length (L1 &L3) and thickness (T2 & T3) show constant range on the build platform.
sample1
sample2
sample3
sample4
sample5
sample6
sample7
sample8
sample9
sample1
0
sample1
1
sample1
2
sample1
3
sample1
4
sample1
5
sample1
6
sample1
7
sample1
80
0.51
1.52
2.53
3.54
4.5Percentage Error Vs Tensile Samples in Y- Direction
L1L2L3T1T2T3W1Pe
rcen
tage
Err
or
Figure 7 - Percentage error Vs. tensile sample measured in Y-direction
8.3 Experiment No: 3
a) Cylinder samples All the values of upper and lower diameter have the similar graph lines throughout the samples 1-18 but thickness is not uniform which varies from sample to sample but remains constant at the bottom of the bed position.
Averaging the grid values by rows to know the bed position and dimension accuracy of the built parts of cylinder samples.
Upper Dia (UD1)
Upper Dia (UD2)
Lower Dia (LD1)
Lower Dia (LD2)
Thickness (t)
-1 -0.8 -0.6 -0.4 -0.2 0 0.2 0.4 0.6 0.8
Percentage Error Vs Cylinder samples by Row
Grids 13-18Grids 7-12Grids 1-6
Percentage Error of cylinder samples
Sam
ples
in R
ow w
ise d
irecti
o
Figure 8 - Percentage Error Vs. Cylinder samples by row
The above graph represents the bed position of the cylinder samples, which are arranged in rows. From the graph the values of grids 1-6 have positive values and from grid 13-18 which are negative values, the mid position of the bed is uniform.
b) Averaging the grid values by columns to know the bed position and dimension accuracy of the built parts of cylinder samples.
The above graph represents the bed position of the cylinder samples, which are arranged by column wise. The values of the 1 & 2 columns are in positive direction and remaining all other values are in negative direction
column 1 column 2 column 3 column 4 column 5 column 6
-0.8
-0.6
-0.4
-0.2
0
0.2
0.4
Percentage Error Vs Cylinder samples by Column
Upper Dia (UD1)Upper Dia (UD2)Lower Dia (LD1)Lower Dia (LD2)Thickness (t)
Cylinder Samples in column Direction
Perc
enta
ge E
rror
of c
ylin
der
Figure 9 - Percentage Error Vs. Cylinder samples by column
8.4 Experiment No: 4
a) 3D Geometry
Figure 10 – Error of 3D geometry sample
In the above graph the values of internal dimension have negative values and the thickness T1 and T3 are significant in the positive direction. However the thickness T3 at the sample 10 shows 4 % higher than the original dimensional value.
8.5 Experiment No: 5
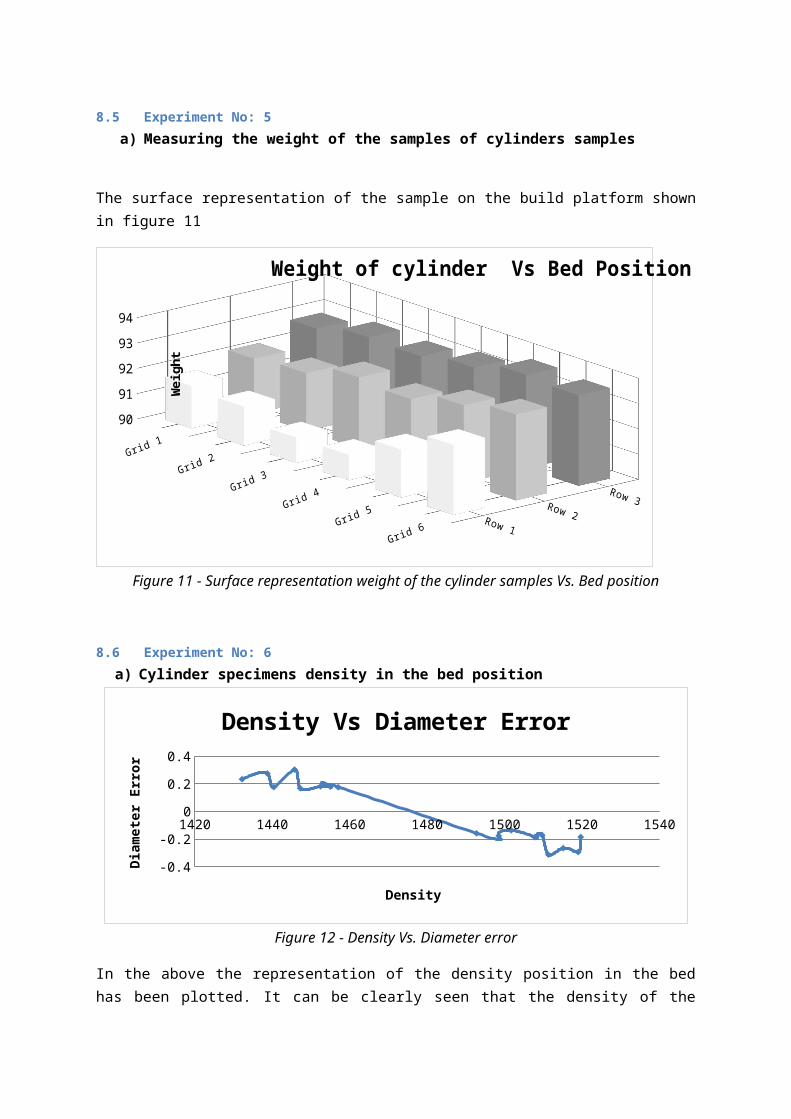
a) Measuring the weight of the samples of cylinders samples
The surface representation of the sample on the build platform shown in figure 11
Grid 1
Grid 2
Grid 3
Grid 4
Grid 5
Grid 6
90
91
92
93
94
Row 1
Row 2
Row 3
Weight of cylinder Vs Bed Position
Bed position
Wei
ght
Figure 11 - Surface representation weight of the cylinder samples Vs. Bed position
8.6 Experiment No: 6
a) Cylinder specimens density in the bed position
1420 1440 1460 1480 1500 1520 1540
-0.4-0.3-0.2-0.1
00.10.20.30.4
Density Vs Diameter Error
Density
Diam
eter
Err
or
Figure 12 - Density Vs. Diameter error
In the above the representation of the density position in the bed has been plotted. It can be clearly seen that the density of the sample part of cylinder are constant in the centre position of the bed.

b) Impact strength graph for yield stress.
Figure 13 shows the density of samples on the x-axis and yield strength of the tensile samples of X and Y as taken in Y-axis. Thus the density graph of the tensile samples has been plotted and shows no collation between them.
1.43 1.44 1.45 1.46 1.47 1.48 1.49 1.50
0.5
1
1.5
2
2.5
3
Density Vs Yield strength of X & Y direction
Yeild strength XYield strength y
Density of 3D Geometry samples
Yeild
Str
engt
h of
tens
ile sa
mpl
es in
X
and
Y Di
recti
on
Figure 13 - Density of Vs. Yield strength of X & Y direction
8.7 Experiment No: 7 - Tensile Testing
Tensile testing is carried out on 3 samples specimens from each batch.
1 1.2 1.4 1.6 1.8 2 2.20
2
4
6
8
10
12
Tensile Test results
Sample 1Sample 2Sample 3
Displacement mm
Forc
e kN
Figure 14 - Tensile and compression test graph
Typical brittle failure load extension curves as shown in Figure 14.
8.8 Experiment No: 8 - Compression Testing
In the graph below the sample test of compression testing has been carried out to know the load acting on the sample specimen. The break occurs at 1.835 mm and the load it canwith stand at 10.43 to 12.33 kN.
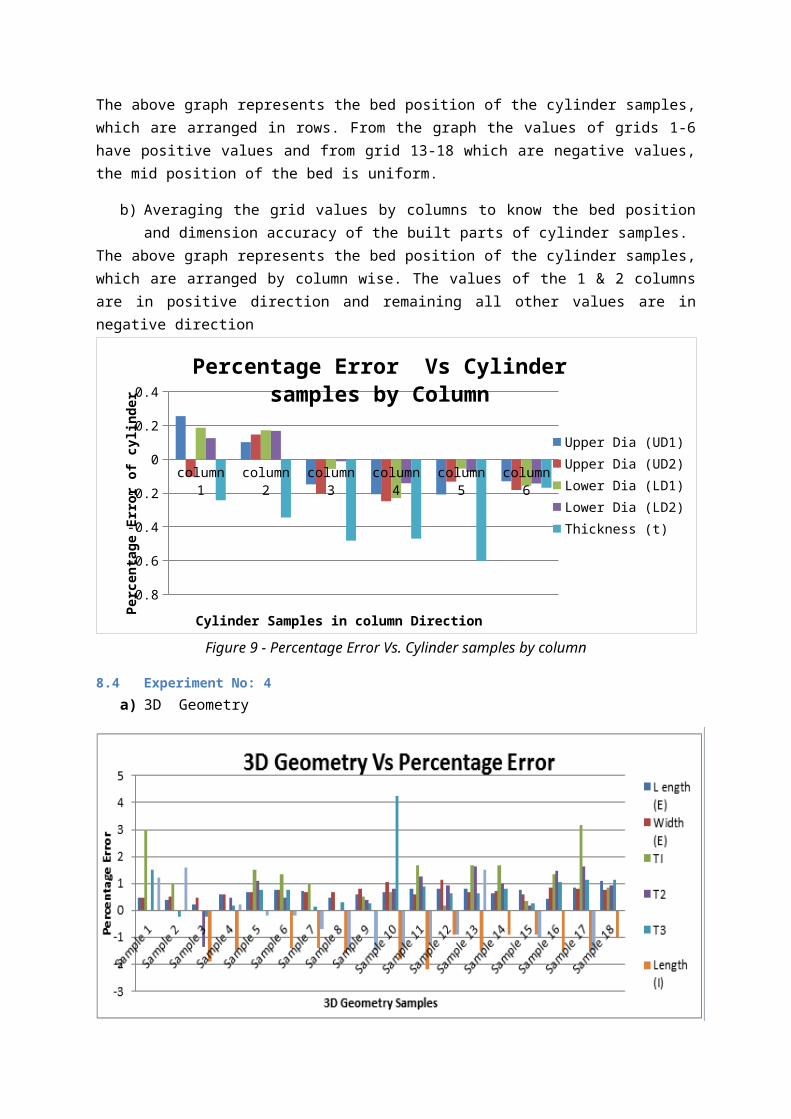
Figure 15 - Compression sample cylinders after testing
8.9 Experiment No: 9 – Impact Testing
The impact tests carried out provided the relative strength property of samples taken from an X and Y build direction. A sample of the results are shown in Table 2
Table 2 – Impact test results
Impact stress kPax y
Average 1.738 2.027 17%St dev 0.224 0.275 23%min 1.440 1.520max 2.120 2.432
As can be seen from the results the parts built in the Y direction are 17% on average stronger than the X direction parts
8.10 Experiment No: 10
Heat tests were carried out on the samples to establish the temperature the samples de-bonding, this was found to be between 180 and 450oC,
8.11 Experiment No: 11
A Scanning Electron microscope (SEM) was used to magnify the as built grain structures as shown in Figure 16 and to analyse the proportion of porosity of the structure. Porosity allows the gases generated during the casting process and any moisture in the sand which turns to steam to escape the mould rather than forming casting defects within the production component. The SEM Figure 16 left shows the contact/bond points of the sand grains and the lower magnification figure 16 right shows the bulk surface even grain distribution.

The bond and grain structure had no measurable variation across the bed and the porosity was found to be between 63 and 69%
Figure 16 – SEM Picture of inter grain bonding and void analysis
9. Discussion
9.1 Experiment 1 and 2 – Dimensional accuracy tensile specimens in X-Y directions
For the benchmark test of the test bars built across the bed the results are consistent with parts built in the Y direction having the best accuracy, followed by Z and then X direction. The accuracy is within 0.5 mm or less than 0.3% of desired dimensions, parts are consistently built slightly larger than desired in all planes. The cylinder samples provided better results for the Z height due the size of that dimension, however the cylinders also had noticeable flat on the top x dimension, this was assumed to be part abrasion during transport and therefore impressing the need for careful packaging during transport of components. The test demonstrated great consistency of build accuracy over the 20 day test period with little variation, showing the process is consistent and repeatable.
For individual bed positions, the error relating to bed position figure 6, shows the sample 3 had the largest error in the x direction but there was no detectable variation across the y direction figure 7. The top row - row 3 are less accurate than the rows below. Therefore the most accurate build position is at the front of the bed in grid positions 1 to 6, there was no similar column in consistency.
9.2 Experiment No: 3 - Cylinder specimens
In this experiment the measured values of the samples upper diameter, lower diameter and thickness are plotted to know the accuracy of the samples. From Figure 8, it can be clearly seen that the values of first half parts of samples are in positive direction and the remaining values are in negative direction. The building positions of the samples are uniform in the centre of the bed platform. It may be because of the printing the sand from the right side to left side of the built area of the platform. The minor error can be corrected by adjusting the printing speed of the printer. This
at first sight counters the benchmark results, but as the parts for that came from random position dependent upon the build of the day they may have been positioned at the front of the bed.
9.3 Experiment No: 4 - 3D Geometry
The geometry created is complex in shape and showed the external dimensions to be oversize and the internal dimensions to be undersized, this is an indication of bleed of the binder after deposition into the surrounding sand. This can be compensated for in software by offsetting the print region inwards by a bleed compensation distance.
9.4 Experiment No: 5 – Sample mass vs. build position
Density and size are related as shown in Figures 11 and 12, the more dense the larger the build part; this is dependent upon bed position as shown in Figures 6 and 7
Sand distribution is front to back and the sand feed hopper is filled left to right. During observation of the process it can be seen that a wave of sand builds as the spreader moves forward, therefore the feed of the hopper needs to be reduced to ensure only enough sand is fed and not over feeding as currently occurring providing the row density and size inconsistencies.
9.5 Experiment No: 6 – Density Evaluation
In this experiment the values of the density is to co-relate the values with respect to dimension accuracy such that graph representation show the density position in the bed. Density and size are related, but the tensile strength is not related to density figure 13.
9.6 Experiment No: 7 - Tensile testing
A 0.35 kN force is the threshold for the bonded sand samples, the bond yield stress of the Phenol-formaldehyde binders is 1.75 MPa. The failure mode was by brittle fracture in all cases.
9.7 Experiment No: 8 - Compression testing
The 40 mm diameter samples are crushing at 11.5 kN to 12.5 kN providing a minimum crush stress of 5.86 MPa, this is comparable to traditional manufactured sand sample characteristics.
9.8 Experiment No 9 – Impact testing
The test showed the impact strength of 1.74 kPa the parts built in the Y direction are 17% on average stronger than the X direction parts.
9.8 Experiment No: 10 – De-bonding at elevated temperatures
The burn out test is carried out to establish rigidity at elevated temperatures, thus from the results, various parameters are clearly explained. Tests in the oven as the samples are partially de-bonded at 450°C and completely de-bonded at 850°C, due to Pyrolysis effect while at elevated temperature. In reality the sand only needs to be strongly bonded for a short period of time until the casting begins to solidify from the outside inwards. The bond strength of the Furan binder starts to degrade above 180°C, which is a requirement of the casting process to allow the casting to contract during cooling, otherwise hot tearing of the castings particularly at sharp corners can occur.

10. Conclusions
This paper has reviewed the unique characteristics of 3DSP process in relation to the more established relatively low build volume production rate of the DLSS process. The characteristics of this process has been independently established so that designers of sand mould tools can utilise the advantages 3DSP provides in terms of speed of production of prototype tooling can provide. The build characteristics of the 3DSP have been evaluated against traditional manufacturing techniques.
The 3D sand printing process has the capability to provide a production route for tool-less flexible manufacturing of sand cores and moulds for sand casting of non ferrous and ferrous metals. The 3DSP system has the ability to manufacture significantly larger sized parts in 1/30 th of the time compared to the DLSS process.
11. Future work
The sand patterns produced need to be evaluated for castability to establish if the best build parameters for part strength and accuracy correlate to the optimum casting features such as permeability for degassing and crush stress to prevent hot tears. Further research needs to be undertaken to evaluate financial and commercial implications of utilising 3DSP in a foundary environment with respect with time to market and the ability to produce one off and small batch production of complex casting without the DFM design considerations currently required for traditional sand casting techniques.

12. References

1 B. Wiedemann, H.-A. Jantzen, Strategies and applications for rapid product and process development in Daimler-Benz AG, Computers in Industry, Volume 39, Issue 1, June 1999, Pages 11-25.
2 Hackney, P. M., and Ainsley, C. (2011), "RAPID MANUFACTURING–STATE OF THE ART, ANALYSIS AND FUTURE PERSPECTIVES." ICAM2011 Malaysia Invited Conference Paper
3 Y. Tang, J.Y.H. Fuh, H.T. Loh, Y.S. Wong, L. Lu, Direct laser sintering of a silica sand, Materials & Design, Volume 24, Issue 8, December 2003, Pages 623-629.
4 P. Mognol, M. Rivette, L. Jégou, T. Lesprier, (2007) "A first approach to choose between HSM, EDM and DMLS processes in hybrid rapid tooling", Rapid Prototyping Journal, Vol. 13 Iss: 1, pp.7 - 16
5 http://www.jade-trading.com/index.php?mact=CGBlog,cntnt01,detail,0&cntnt01articleid=11&cntnt01returnid=86 – metal casting stats - accessed 20/7/14
6 http://www.afsinc.org/about/content.cfm?ItemNumber=13450 metal casting Data – accessed 20/7/14
7 http://www.ipmd.net/articles/002767.html – accessed 20/7/14
8 http://www.ipmd.net/shop/Powder_Metallurgy_A_Global_Market_Review – accessed 20/7/14
9 Christian Weller, Robin Kleer, Frank T. Piller, Economic implications of 3D printing: Market structure models in light of additive manufacturing revisited, International Journal of Production Economics, Volume 164, June 2015, Pages 43-56, ISSN 0925-5273,
10 Wang, X.H., Fuh, J.Y.H., Wong, Y.S. & Tang, Y.X. (2003) "Laser Sintering of Silica Sand – Mechanism and Application to Sand Casting Mould", International Journal of Advanced Manufacturing Technology, vol. 21, no. 12, pp. 1015-1020.
11 http://www.exone.com/en/materialization/what-is-digital-part-materialization/sand - Accessed : 20/7/2014
12 No-Bake Binder Developments, Andrew Busby, ICME West Midlands, Coventry and Birmingham Branch Technical Meeting, 4 October 2010. http://www.icme.org.uk/news.asp?ID=354
13 Mechanical Properties and Loss on Ignition of Phenolic and Furan Resin Bonded Sand Casting, N. I. S. Hussein, M. N. Ayof, and N. I. Mohamed Sokri, International Journal of Mining, Metallurgy & Mechanical Engineering (IJMMME) Volume 1, Issue 3 (2013)
14 John R. Brown, Chapter 12 - Sands and sand bonding systems, In Foseco Non-Ferrous Foundryman's Handbook, edited by John R. Brown, Butterworth-Heinemann, Oxford, 1999, Pages 149-166.