characterisation of combustion related acoustic emission ... · david patrick lowe . a thesis...
TRANSCRIPT

Characterisation of Combustion
Related Acoustic Emission Sources for Diesel Engine
Condition Monitoring
David Patrick Lowe
A thesis submitted in total fulfillment for the requirements of the degree
of Doctor of Philosophy upon completion of research undertaken at the
School of Chemistry, Physics and Mechanical Engineering in the Faculty
of Science and Engineering at Queensland University of Technology
May 2013


i
Abstract
As is widely known, condition based maintenance (CBM) practices have generally
led to reduced waste, improved machine availability and decreased maintenance
costs however these practices remain underutilised in the maintenance management
of Diesel engines. A major factor in this situation has been the inherently limited
amount of information regarding incipient faults provided by commonly used Diesel
engine monitoring techniques such as those based on oil analysis, cylinder pressure
measurements and vibration analysis. Previous investigations have however shown
that acoustic emission (AE) based methods can provide effective fault diagnosis in
Diesel engines in some cases, although some challenges remain preventing their
widespread adoption. Foremost amongst these is the challenge of identifying and
discriminating between a number of AE events that originate as a consequence of
the operation of various engine components and phenomena related to the
combustion process.
The research presented throughout this thesis addresses this challenge using the
premise where it is thought that by integrating detailed information concerning
engine function, knowledge of relevant failure mechanisms and established
modelling techniques, it is possible to specifically identify and monitor a range of
incipient combustion related Diesel engine faults using AE signals. An approach to
AE signal interpretation and characterisation using engine function information,
knowledge of relevant failure mechanisms and established modelling techniques was
applied to AE signals recorded during the course of four investigations which
featured the inducement of injector nozzle faults in the two commonly used nozzle
types; excessive dual-fuel Diesel knock; abnormal valve-train dynamics and
excessive piston-slap.
In characterising AE activity from the injector nozzle fault tests with respect to the
nozzle type it was found that AE activity could be identified as being related to
faulty operation of the hole or pintle-type nozzles. Use of the AE signal
interpretation and characterisation approach during the induced dual-fuel Diesel

ii
knock investigation demonstrated the use of AE measurements in the detection and
characterisation of dual-fuel Diesel knock in Diesel engines whilst during the
abnormal valve-train dynamics investigation a dynamic model of an engine valve-
train was used to characterise valve related AE activity. These results showed that
valve related AE activity could be effectively identified and monitored using
modeled valve motion information with progressive increases in AE activity being
consistent with the valve impact velocity increases predicted by the dynamic valve-
train model. During the final investigation a piston side-force modelling method was
used to identify the crank-angle positions associated with six potential piston slap
impacts. Results from this investigation showed that piston-slap related AE activity
was generally of low amplitude however measurable piston slap related AE activity
was identified at mid-stroke piston positions. Together, these findings show that in
the case of each of the investigations undertaken the use of detailed information
concerning engine function, knowledge of relevant fault mechanisms and established
modelling techniques, was able to provide an AE signal interpretation and
characterisation architecture that allowed a range of combustion related faults caused
by both degradation of combustion related components and by abnormal combustion
to be identified and monitored.

iii
Acknowledgements
First of all, I would like to thank my principal supervisor Prof. Andy C. C. Tan and
my associate supervisors Assoc. Prof. Richard J. Brown and Prof. Joe Mathew for
their support, encouragement and guidance throughout the duration of my
candidature at Queensland University of Technology. I am also indebted to Dr. Tian
Ran Lin for his guidance and invaluable help in all things technical as well as Dr.
Eric Kim for his assistance in getting started with data acquisition, AE signals and
Matlab®.
Thanks are also due to Mr. Jon James and the “O” block technical staff, particularly
Mr. Noel Hartnett, Mr. Scott Abbett, Mr. Mike Johnston, Mr. Tony Morris and Mr.
Glenn Geary for their assistance in bringing planned test campaigns to fruition. I
would also like to thank all of my fellow research students, particularly Mr.
Weiliang Wu for their help and friendship during my time as a research student.
I also gratefully acknowledge the financial support provided by Queensland
University of Technology and by the Cooperative Research Centre for Integrated
Engineering Asset Management (CIEAM) under the Australian Government’s
Cooperative Research Centre program
Finally, I would like to thank my parents Ron and Jeanie for their support in
everything I have attempted; my fiancée Vanessa for putting up with some rather
one sided conversations about engines and my brother Chris for his endless supply
of tea and biscuits!

iv
Statement of Original Authorship
In accordance with the appropriate regulations I, David Lowe hereby declare that:
The work contained in this thesis has not been previously submitted to meet
requirements for an award at this or any other higher education institution. To the
best of my knowledge and belief, the thesis contains no material previously
published or written by another person except where due reference is made.
Candidate Signature:
Date:

v
Table of Contents
Abstract ......................................................................................................................... i
Acknowledgements ..................................................................................................... iii
Statement of Original Authorship ............................................................................ iv
Table of Contents ........................................................................................................ v
List of Figures ............................................................................................................. ix
List of Tables ............................................................................................................ xiv
Abbreviations ............................................................................................................ xv
Chapter 1: Introduction ............................................................................................ 1
1.1 Research Background.................................................................................. 3
1.2 Problem Statement ...................................................................................... 3
1.3 Research Aim and Objectives ..................................................................... 4
1.4 Scope of Research ....................................................................................... 5
1.5 Originality of Contribution ......................................................................... 6
1.6 List of Publications from This Thesis ......................................................... 7
1.7 Thesis Outline ............................................................................................. 8
Chapter 2: A Review of Methods Used for Diesel Engine Condition
Monitoring ............................................................................................... 11
2.1 Diesel Engine Monitoring Methods .......................................................... 12
2.1.1 Cylinder Pressure Based Methods ......................................... 13
2.1.2 Crank-Angle Measurement Based Methods .......................... 14
2.1.3 Methods Based on Exhaust Gas Measurements..................... 16
2.1.4 Tribological Methods ............................................................. 17
2.1.5 Air-Borne Acoustics Based Methods ..................................... 19
2.1.6 Vibration Based Methods ....................................................... 20
2.1.7 Acoustic Emission Based Methods ........................................ 23
2.1.8 Other Engine Monitoring Methods ........................................ 28
2.2 Comparisons Pertaining to Acoustic Emission Based Engine
Monitoring ................................................................................................ 29

vi
2.3 The Acoustic Emission Phenomenon ........................................................ 32
2.3.1 Sources of Acoustic Emission ................................................ 32
2.3.2 Acoustic Emission Signals ..................................................... 33
2.3.3 Other Acoustic Emission Based Monitoring Applications .... 35
2.4 Chapter Summary ...................................................................................... 36
Chapter 3: Combustion Related Diesel Engine Components, Faults and their
Acoustic Emission Signal Features ........................................................ 37
3.1 Propagation of Acoustic Emission in Diesel Engines ............................... 38
3.2 Interpreting Engine Related Acoustic Emission Signals........................... 39
3.3 Combustion Related Sources of Acoustic Emission Activity ................... 43
3.3.1 Fuel Injector Operation Related Acoustic Emission .............. 43
3.3.2 Engine Valve and Valve-Train Related Acoustic Emission .. 47
3.3.3 Piston-Cylinder Interface Related Acoustic Emission ........... 51
3.3.4 Diesel Engine Combustion Related Acoustic Emission ........ 55
3.4 Chapter Summary ...................................................................................... 58
Chapter 4: Experimental Approach and Methodology ......................................... 61
4.1 Research Facilities ..................................................................................... 62
4.2 Experiments ............................................................................................... 64
4.3 Data Acquisition ........................................................................................ 66
4.4 Sensor Setup and Positioning .................................................................... 67
4.5 Acoustic Emission Signal Processing ....................................................... 69
4.6 Chapter Summary ...................................................................................... 71
Chapter 5: Acoustic Emission Signal Features Associated with the Two Main
Types of Diesel Engine Fuel Injector Nozzles ....................................... 73
5.1 Induced Injector Nozzle Faults ................................................................. 74
5.1.1 Hole-Type Nozzle Faults ....................................................... 74
5.1.2 Pintle-Type Nozzle Faults ...................................................... 75
5.2 Qualification of Induced Nozzle Faults Using Pressure Signals ............... 76
5.3 Initial Injector Related Acoustic Emission Signal Observations .............. 78
5.3.1 Misfire Related Signal Observations ...................................... 79
5.3.2 Time-Frequency Observations ............................................... 81

vii
5.4 Characterisation of Injector Nozzle Fault Related Acoustic Emission ..... 83
5.4.1 Hole-Type Nozzle Fault Related Acoustic Emission............. 83
5.4.2 Pintle-Type Nozzle Fault Related Acoustic Emission ........... 88
5.5 Chapter Summary...................................................................................... 91
Chapter 6: Detection of Knock Related Acoustic Emission from a Dual-Fuel
Diesel Engine Operating With Diesel Fuel and Ethanol ..................... 93
6.1 Dual-Fuel Diesel Knock ............................................................................ 94
6.2 Induced Dual-Fuel Diesel Knock .............................................................. 94
6.3 Combustion Chamber Resonance ............................................................. 95
6.4 Knock Severity Measurement ................................................................... 97
6.5 Detection of Induced Dual-Fuel Diesel Knock ....................................... 100
6.5.1 Acoustic Emission Sensor Position Comparisons ............... 100
6.5.2 Acoustic Emission Based Knock Indication ........................ 101
6.6 Chapter Summary.................................................................................... 102
Chapter 7: Characterisation of Acoustic Emission Associated With
Abnormal Valve-Train Dynamics in a Small Pushrod-Type
Diesel Engine ......................................................................................... 105
7.1 Valve Motion and Valve-Train Dynamics .............................................. 106
7.2 Qualification of Valve Lash Induced Valve Motion ............................... 108
7.3 Development of the Perkins Dynamic Valve-Train Model .................... 111
7.4 Characterisation of Valve Lash Related Acoustic Emission................... 118
7.4.1 Valve Lash Setting Related Combustion Effects ................. 120
7.4.2 Characteristics Associated with Valve Closure ................... 121
7.5 Chapter Summary.................................................................................... 124
Chapter 8: Detection and Characterisation of Acoustic Emission Activity
Associated with Piston Slap in a Small Diesel Engine ....................... 127
8.1 The Occurrence of Piston Slap ................................................................ 128
8.2 Inducing Piston Slap ............................................................................... 132
8.3 Induced Piston Slap Related Combustion Effects ................................... 132
8.4 Identification of Piston Slap Related Acoustic Emission ....................... 133
8.5 Window Energy Based Piston Slap Characterisation ............................. 136

viii
8.6 Chapter Summary .................................................................................... 139
Chapter 9: Conclusions and Future Work ........................................................... 141
9.1 Results Summary and Conclusions ......................................................... 142
9.2 Applications for Diesel Engine Monitoring ............................................ 146
9.3 Future Research Directions ..................................................................... 147
References ............................................................................................................... 149
Appendix A: Calculation of the Perkins Valve-Train Dynamic Model
Parameters .......................................................................................... 171
Appendix B: Derivation and Solution of the Perkins Valve-Train
Equations of Motion ........................................................................... 175

ix
List of Figures
Figure 1.1: The Volvo D16G heavy duty truck engine ................................................. 2
Figure 2.1: Schematic showing typical AE sensor construction [115] ....................... 34
Figure 2.2: Diagram showing the propagation and detection of AE waves [114] ...... 34
Figure 3.1: Burst, continuous and mixed AE signals (a); and (b) AE recorded
from an engine [21] ................................................................................... 40
Figure 3.2: Plot showing AE time-series data with a synchronously recorded
TDC reference signal ................................................................................ 40
Figure 3.3: Plot of AE RMS from a large marine Diesel engine incorporating
timing values for fuel injection and valve operation [80] ......................... 42
Figure 3.4: Sketches showing basic Diesel fuel injector nozzle designs for (a) a
pintle-type nozzle and (b) a hole-type nozzle ........................................... 44
Figure 3.5: AE RMS and fuel line pressure with the fuel injection related AE
events of interest labeled A to D [21] ....................................................... 47
Figure 3.6: An example of valve burn [150] ............................................................... 49
Figure 3.7: Identification of AE RMS signal features associated with the
operation of a large two-stroke marine Diesel engine [79] ....................... 50
Figure 3.8: A piston-ring assembly [143] ................................................................... 52
Figure 3.9: Plot showing AE signals in terms of crank-angle from two separate
sensor positions on a motored engine [101] .............................................. 53
Figure 3.10: Plot showing raw AE with burst-type events at TDC and BDC [21] ..... 54
Figure 3.11: Cylinder pressure verses crank-angle plots for (a) normal spark-
ignition combustion (b) light knock and (c) intense knock [173] ............. 57
Figure 4.1: The Cummins ISBe220 31 test engine ..................................................... 62
Figure 4.2: The Perkins 404C-22 test engine .............................................................. 62
Figure 4.3: Schematic showing the AE data acquisition system ............................... 66
Figure 4.4: Schematic showing the second data acquisition system .......................... 67
Figure 4.5: The AE sensor positions on the front of the Cummins engine ................. 68
Figure 4.6: The pressure and AE sensor positions on the head of the Perkins
engine ........................................................................................................ 68
Figure 4.7: The piston slap test AE sensor positions on the Perkins engine block ..... 69

x
Figure 5.1: An undamaged hole-type nozzle with a ballpoint pen tip for
comparison (a) and (b) a close-up of the nozzle holes .............................. 74
Figure 5.2: A close-up photograph of damaged injector nozzle holes ........................ 75
Figure 5.3: The original undamaged pintle injector with a mechanical pencil
tip for comparison (a) and (b) a photograph showing a close-up of
the pintle .................................................................................................... 75
Figure 5.4: A close up showing the badly damaged pintle (a) and the pintle
having incorrect geometry (b) ................................................................... 76
Figure 5.5: Average cylinder pressure plots for the hole-type nozzle tests ................ 77
Figure 5.6: Average cylinder pressure plots for the pintle-type nozzle tests .............. 78
Figure 5.7: A plot showing truncated TDC and AE signals for one engine
cycle with the injector fault related region highlighted ............................. 79
Figure 5.8: A plot showing a close-up of the injector fault related portion of an
AE signal with the three regions of interest for normal operation ............ 80
Figure 5.9: A plot showing a close-up of the injector fault related portion of an
AE signal with the three regions of interest for misfire operation ............ 81
Figure 5.10: A time-frequency spectrogram plot of the AE signal from the
engine operating normally (upper plot) with corresponding crank-
domain plot ................................................................................................ 82
Figure 5.11: A time-frequency spectrogram plot of the AE signal from the
large injector fault condition (upper plot) with corresponding
crank-domain plot ..................................................................................... 82
Figure 5.12: The windowed interval used during the hole-type nozzle fault
analysis ...................................................................................................... 84
Figure 5.13: Graphs showing summed energy values for the hole-type nozzle
fault tests for (a) full load and (b) half load engine operation ................... 85
Figure 5.14: Graphs showing summed energy values from the three intervals
for the hole-type nozzle fault tests for (a) full load and (b) half load
engine operation ........................................................................................ 87
Figure 5.15: The windowed interval used during the pintle-type nozzle fault
analysis ...................................................................................................... 88
Figure 5.16: Graph showing summed energy values for the pintle nozzle fault
tests ............................................................................................................ 89

xi
Figure 5.17: Graphs showing pintle-type nozzle test summed energy for the
small intervals for (a) no load and (b) full load engine operation ............. 90
Figure 6.1: Photograph showing the ethanol injector located on the top of the
air intake pipe elbow just before the air intake manifold .......................... 95
Figure 6.2: The first four transverse modes with corresponding calculated
resonant frequencies ................................................................................. 96
Figure 6.3: Cylinder pressure traces for the three different ethanol substitution
rates (a) with (b) a close-up view highlighting an individual
pressure signal fluctuation......................................................................... 98
Figure 6.4 Plot showing average cylinder pressure fluctuation amplitudes................ 99
Figure 6.5: Combustion window AE RMS from the engine head ............................ 100
Figure 6.6: Combustion window AE RMS from the engine block ........................... 101
Figure 6.7: A trend comparison between the Diesel knock level quantification
techniques and the summed AE energy values from the engine
block ........................................................................................................ 102
Figure 7.1: Valve lift, velocity and acceleration plots [151]..................................... 106
Figure 7.2: Schematic showing a pushrod-type engine valve-train [207] ................ 107
Figure 7.3: Diagram highlighting valve lash adjustment [143] ................................ 108
Figure 7.4: Static valve lift and the four valve lash engagement lines with the
valve opening and closing regions highlighted ....................................... 109
Figure 7.5: Plots showing static valve lift and the four valve lash engagement
lines for the (a) valve opening and (b) valve closing regions ................. 110
Figure 7.6: The five DOF lumped mass model of the Perkins valve-train ............... 112
Figure 7.7: The simplified single DOF lumped mass Perkins valve-train model ..... 114
Figure 7.8: Plots showing static and dynamic valve lift for (a) the 0.10mm
valve lash setting and (b) the 0.35mm valve lash setting ....................... 116
Figure 7.9: Dynamically modelled valve timing and velocity values for the
different valve lash settings ..................................................................... 117
Figure 7.10: Plot showing the IVO and IVC related portions of an AE signal ....... 118
Figure 7.11: Plots showing the IVO AE signal windows with respect to crank-
angle from the (a) 0.10 mm (b) 0.20 mm (c) 0.28 mm and (d) 0.35
mm lash settings ...................................................................................... 119

xii
Figure 7.12: Plots showing the IVC AE signal windows with respect to crank-
angle from the (a) 0.10 mm (b) 0.20 mm (c) 0.28 mm and (d) 0.35
mm lash settings ...................................................................................... 119
Figure 7.13: Averaged pressure traces from the valve-lash tests for (a) full load
and (b) no load engine operating conditions ........................................... 120
Figure 7.14: Plots of averaged AE RMS showing a zoomed view of the
general region of interest along with the valve lash setting specific
signal portions ......................................................................................... 122
Figure 7.15: Plots of summed window energy values with respect to valve lash
setting ...................................................................................................... 123
Figure 7.16: Normalised plots showing summed AE IVC energy and modelled
IVC velocity ............................................................................................ 123
Figure 7.17: Plots of summed window energy values with respect to engine
load .......................................................................................................... 124
Figure 8.1: Diagram showing crank-piston geometry [163] ..................................... 129
Figure 8.2: Plot showing piston side-force with force reversal positions
highlighted for one complete engine cycle ............................................. 130
Figure 8.3: Plot showing predicted piston slap impact crank-angle positions
with respect to one complete engine cycle .............................................. 131
Figure 8.4: Photographs showing (a) the original piston and (b), the undersized
piston with the machined skirt ................................................................ 132
Figure 8.5: Averaged pressure traces from the excessive piston slap test for (a)
no load and (b) full load engine operating conditions ............................. 133
Figure 8.6: Plots of averaged AE RMS showing predicted piston slap positions
along with a zoomed window showing piston slap related AE
activity ..................................................................................................... 134
Figure 8.7: Plot showing excess slap averaged AE RMS for the four engine
loads ........................................................................................................ 135
Figure 8.8: Plot showing the six piston slap related signal windows ........................ 137
Figure 8.9: Normalised total window energy values for the six piston-slap
windows .................................................................................................. 137
Figure A.1: The accelerometer and adjustment screw on the Perkins valve-
train rocker arm ....................................................................................... 173
Figure A.2: Plot showing a typical Perkins valve-train vibration response .............. 173

xiii
Figure B.1: The free body diagram from the single DOF lumped mass model ........ 176
Figure B.2: The valve lift measurement set-up showing (a) the dial indicator
and (b) the graduated adaptor .................................................................. 182
Figure B.3: Plot showing measured and smoothed valve lift data ............................ 183

xiv
List of Tables
Table 2.1: Summary of sensor capabilities from Fog [79] .......................................... 30
Table 2.2: Relative merits and limitations of ECM methods regarding the detection
of combustion related component faults ................................................... 31
Table 2.3: General AE producing sources and mechanisms in metals ...................... 33
Table 4.1: Cummins ISBe 220-31 engine data ........................................................... 63
Table 4.2: Perkins 404C-22 engine specifications ...................................................... 63
Table 7.1: Predicted valve actuation data from the Perkins dynamic valve-train
model ....................................................................................................... 117
Table 8.1: Piston side-force reversal positions and descriptions .............................. 131
Table A.1: Measured valve-train component masses ................................................ 172

xv
Abbreviations
AE: Acoustic Emission
AEE: Acoustic Emission Energy
BDC: Bottom-Dead Centre
CBM: Condition Based Maintenance CM: Condition Monitoring
CWT: Continuous Wavelet Transform
DAQ: Data Acquisition
DI: Direct Injection
DFD: Dual-Fuel Diesel
DOF: Degree-of-Freedom
ECM: Engine Condition Monitoring
FFT: Fast Fourier Transform
HSDI: High Speed Direct Injection
ICAV: Instantaneous Crank-Angle Velocity
IDI: Indirect Injection
IJE: Fuel Injection End
IJS: Fuel Injection Start
IVC: Inlet Valve Closing
IVO: Inlet Valve Opening
NDT: Non-Destructive Testing
OHV: Overhead Valve
PCI: Piston-Cylinder Interface
PR: Pushrod
RIC: Reciprocating Internal Combustion
RMS: Root Mean Square
SI: Spark Ignition SNR: Signal-to-Noise Ratio
TDC: Top-Dead Centre
XVO: Exhaust Valve Opening
XVC: Exhaust Valve Closing


Chapter 1: Introduction
1
Chapter 1 Introduction
The reliability, efficiency and robustness of Diesel engines have led to their
widespread use throughout the world. They are used in myriad, sometimes critical
roles such as power generation or ship propulsion therefore efficient engine
reliability and performance are of utmost importance. Furthermore, Diesel engines
such as the Volvo D16G heavy duty truck engine shown in Figure 1.1 often
represent substantial initial and ongoing investments which in addition to obvious
reliability and performance concerns, are attended by longer term asset lifecycle
considerations such as ongoing economic, environmental and societal costs. These
factors all result in the continuing need to not only develop better Diesel engines,
but to also develop better Diesel engine monitoring technologies.

Characterisation of Combustion Related Acoustic Emission Sources for Diesel Engine Condition Monitoring
2
As is widely known, condition based maintenance (CBM) practices have, in general,
led to reduced waste, improved machine availability and decreased maintenance
costs but remain underutilised in the maintenance management of Diesel engines. A
major factor in this situation has been the inherently limited amount of information
regarding component condition provided by commonly used engine monitoring
techniques. Indeed, the development and application of CBM practices to Diesel
engines is arguably one of the most difficult ongoing technical challenges in the
condition monitoring arena and the push to apply CBM practices to Diesel engines
has led to continuing research regarding the development of more effective Diesel
engine condition monitoring methods.
Figure 1.1: The Volvo D16G heavy duty truck engine
Commonly used Diesel engine condition monitoring (CM) techniques such as oil
analysis, cylinder pressure measurements and vibration analysis are widely
recognised as being of limited use in undertaking the fault diagnosis necessary for
the implementation of CBM as these techniques measure parameters that have an
indirect or symptomatic relationship to underlying failure modes. As a consequence
these commonly used Diesel engine CM techniques provide very little direct
information concerning the development and progression of incipient faults within
the components of the engine. If combustion related faults are considered
specifically, this situation is complicated further due to the inaccessible location of
the combustion chamber and associated components.

Chapter 1: Introduction
3
1.1 Research Background
Previous investigations have demonstrated that acoustic emission (AE) based
methods can monitor phenomena associated with various combustion related fault
modes directly and are able to provide effective fault diagnosis for traditionally
difficult to monitor combustion related components. However some challenges
remain. Foremost amongst these is the challenge faced in identifying and
discriminating between various AE sources that have a close temporal association.
These AE events typically originate within the engine cycle as a consequence of
both; the operation of combustion related components, and of phenomena
specifically related to the combustion process.
Previous investigations have attempted to address the challenge of identifying AE
sources in signals recorded from engines in a number of ways, these approaches
have included an event mapping approach whereby recorded AE signal features are
related to various mechanical events within the engine cycle based upon known
event timing values. A source location approach has also been detailed in which the
geometric location of AE sources in terms of the engine structure has been
calculated using various methods.
Other approaches have included a source separation approach whereby advanced
signal processing methods are employed to differentiate between different AE
sources in signals recorded from an array of sensors and a signal characterisation
approach whereby specific signal characteristics are related to events or processes of
interest. The use of these approaches have met with varying levels of success and the
challenge of identifying and discriminating between the combustion related AE
sources continues to hinder progress in this field.
1.2 Problem Statement
Owing to the widely acknowledged ability of AE based CM methods to detect many
combustion related fault mechanisms directly, it is hypothesised that by integrating
detailed information concerning component function, knowledge of relevant fault
modes and established modelling techniques it may be possible to explicitly identify
and monitor range of combustion related Diesel engine faults using a combination of

Characterisation of Combustion Related Acoustic Emission Sources for Diesel Engine Condition Monitoring
4
event mapping and signal characterisation approaches to the AE source
identification challenge.
1.3 Research Aim and Objectives
The overall aim of the work presented in this thesis is to identify and characterise the
AE activity that originates from combustion related AE sources using an approach
that incorporates detailed component function information, knowledge of relevant
fault modes and established modelling techniques. In order to achieve this overall
aim it was necessary to identify a number of major objectives. These objectives
were:
• Understand the operation of the critical combustion related components and
the relationships between these components and the combustion process
itself
• Identify the underlying fault modes that typically lead to combustion related
Diesel engine faults
• Identify the relevant component function and fault mode information needed
to develop relevant models by which AE signals can be investigated and
characterised
• Develop a methodology for the analysis of recorded AE signals in order to
identify fault specific signal features
• Develop methods in order to realistically induce a range of broadly
applicable combustion related diesel engine faults
In addressing the overall aim and attendant objectives of the research detailed in this
thesis, four major test campaigns were undertaken, these were the injector nozzle
fault tests; the dual-fuel Diesel knock tests; the valve-train dynamics tests and the

Chapter 1: Introduction
5
piston-slap tests. The primary objectives associated with each of these test
campaigns were as follows:
• The objective of the injector nozzle fault tests was to identify and categorise
AE activity specifically associated with the operation of the two main types
of Diesel fuel injector nozzles.
• The objective of the dual-fuel Diesel knock tests was to identify and
characterise knock related activity in dual-fuel Diesel engines as an AE
source in terms of the underlying knock related phenomena.
• The objective of the valve-train dynamics tests was to characterise the AE
activity that arises as a consequence of abnormal valve-train dynamics using
relevant dynamic valve motion modelling techniques.
• The objective of the piston-slap tests was to investigate the phenomenon of
piston slap as a source of AE and identify whether any AE signal features
could be directly identified as being caused by piston slap.
1.4 Scope of Research
The research detailed within this thesis has addressed the challenge of identifying
and discriminating between AE events that originate as a consequence of the
operation of combustion related components and of the combustion process itself.
The work presented has been predominantly based on four investigations featuring
fuel injector nozzle faults in the two commonly used nozzle types; induced dual-fuel
Diesel knock; abnormal valve-train dynamics and excessive piston-slap. Whilst the
experimental campaigns with these faults have been demonstrated using small,
multi-cylinder four-stroke Diesel engines it is thought that the broad applicability of
the fault modes examined makes the adopted approach equally applicable to Diesel
engines of all types and sizes.
It is acknowledged however that whilst the general approach used is believed to be
broadly applicable, the incorporation of engine specific information and the use of

Characterisation of Combustion Related Acoustic Emission Sources for Diesel Engine Condition Monitoring
6
engine specific models throughout this work suggest that care should be taken in
directly ascribing the findings presented throughout this work to other engine types
or sizes. It is also acknowledged that the models used in the characterisation of AE
signals during the abnormal valve-train dynamics and excessive piston-slap test
campaigns were not validated experimentally as this added experimental work was
outside the scope of the work within this thesis.
1.5 Originality of Contribution
It is believed that the overall methodology used within this thesis whereby a range of
broadly applicable combustion related fault modes have been defined using detailed
functional and theoretical means and subsequently used to investigate AE signals
represents a novel approach in addressing the previously mentioned issues. More
specifically, original contributions are claimed for:
• The demonstration of a systematic approach incorporating detailed fault
mode information into the simulation and inducement of a range of realistic
combustion related faults featuring pintle and hole-type Diesel fuel injectors;
dual-fuel Diesel knock; an engine valve-train and the piston-cylinder
interface
• The investigation and differentiation of AE activity in terms of the specific
functional characteristics associated with the two main Diesel engine injector
nozzle types.
• The demonstration of previously unreported AE based Diesel knock
detection in a dual-fuel Diesel engine and the recognition of the relationship
between the large knock-related cylinder pressure fluctuations and recorded
AE signals.
• The characterisation of engine valve related AE activity in terms of dynamic
valve motion predicted using established dynamic engine valve-train
modelling techniques.

Chapter 1: Introduction
7
• The previously unreported identification of piston slap related AE activity at
mid-stroke crank-angle positions using an established piston side-force
modelling method and piston slap theory.
1.6 List of Publications from this Thesis
1) D. P. Lowe, Weiliang Wu and Andy C. C. Tan, (2012), Detection of Excessive
Diesel Engine Piston Slap Using Acoustic Emission Signals, 7th World
Congress on Engineering Asset Management, 8-9th October 2012, Daejeon,
South Korea.
2) David P. Lowe, Tian Ran Lin, Weiliang Wu and Andy C. C. Tan (2011), Diesel
Knock Combustion and its Detection Using Acoustic Emission. Journal of
Acoustic Emission, Volume 29, December, 2011.
3) D. P. Lowe, Weiliang Wu and Andy C. C. Tan, (2011), Experimentally Induced
Diesel Engine Injector Faults and Some Preliminary Acoustic Emission
Signal Observations, 6th World Congress on Engineering Asset Management, 2-
5th October 2011, Cincinnati, Ohio, USA.
4) Weiliang Wu, David P. Lowe, and Andy C. C. Tan, (2011), A Study on Acoustic
Emission Signal Propagation of a Small Size Multi-Cylinder Diesel Engine, 6th
World Congress on Engineering Asset Management, 2-5th October 2011,
Cincinnati, Ohio, USA.
5) David P. Lowe, Weiliang Wu, and Andy C. C. Tan, (2011), Acoustic Emission
Based Diesel Engine Condition Monitoring Research at Queensland
University of Technology – Part 1: Experimentally Simulated Fault Testing,
WCAE 2011: World Conference on Acoustic Emission, 24-26th August 2011,
Beijing, China.
6) Weiliang Wu, David P. Lowe, and Andy C. C. Tan (2011), Acoustic Emission
Based Diesel Engine Condition Monitoring Research at Queensland
University of Technology – Part 2: AE Source Location and Separation,
WCAE 2011: World Conference on Acoustic Emission, 24-26th August 2011,
Beijing, China.

Characterisation of Combustion Related Acoustic Emission Sources for Diesel Engine Condition Monitoring
8
7) D. P. Lowe, Andy C. C. Tan and Richard J. Brown (2010), Diesel Engine
Condition Monitoring and Simulated Diesel Knock. 6th Australasian Congress
on Applied Mechanics, 12-15 December 2010, Perth, Australia.
8) D. P. Lowe, Weiliang Wu, Andy C. C. Tan and Richard J. Brown (2010), Diesel
Engine Problems, Acoustic Emission Signals and Simulated Misfire Faults. 5th
World Congress on Engineering Asset Management, Brisbane Queensland,
Australia. 25-27th October 2010.
1.7 Thesis Outline
This thesis has been structured so as to contain nine chapters, the contents of which
are outlined in the following paragraphs.
Chapter 1: Introduction
Chapter 1 commences by briefly introducing and outlining the general background
issues that have provided the impetus for research regarding Diesel engine condition
monitoring. The specific research problem and how the work detailed in this thesis
is able to addresses this issue is also defined. Subsequent sections identify the
overall aim and objectives of the research and document the publications that have
arisen from this work. Chapter 1 closes by detailing the original contribution to
knowledge that the research presented in this thesis represents.
Chapter 2: A Review of Methods Used for Diesel Engine Condition Monitoring
The second Chapter begins by providing an overview regarding the “state of the art”
of both established and emerging Diesel engine condition monitoring technologies.
The chapter then proceeds by summarising the main advantages and disadvantages
associated with various engine monitoring technologies whereby certain key
constraints associated with the continued development of advanced ECM
technologies are identified. Comparisons are drawn between AE based monitoring
methods and other techniques whilst latter sections of Chapter 2 go on to provide an
overview regarding sources of AE, the typical attributes associated with recorded
AE signals, and the established uses of AE measurements within other testing and
monitoring fields.

Chapter 1: Introduction
9
Chapter 3: Combustion Related Diesel Engine Components, Faults and their
Acoustic Emission Signal Features
Chapter 3 starts by briefly detailing the phenomenon of AE propagation in engine
structures as well as the previously established steps used to record, interpret and use
AE signals recorded from Diesel engines. Subsequent sections of Chapter 3 then
combine descriptions of common combustion related fault modes with reviews that
detail previously identified fault mode related AE signal features.
Chapter 4: Experimental Approach and Methodology
Chapter 4 firstly describes the two different Diesel test engines that were used
during the experimental phase of the documented research. Subsequent sections
within Chapter 4 go on to detail the aims specifically associated with each test
campaign as well as the data acquisition systems and setups used whilst undertaking
the required tests. The final sections of Chapter 4 then go on to document the basic
signal processing methods that were used in the preparation of AE signals for further
analysis.
Chapter 5: Acoustic Emission Signal Features Associated with the Two Main Types
of Diesel Engine Fuel Injector Nozzles
Initial sections of Chapter 5 begin by detailing the methods used in inducing the
injector nozzle faults and continue by qualifying the combustion related effects that
arose. Following sections go on to detail a range of initial time-series and time-
frequency AE signal observations made regarding faulty hole-type injector
operation. Subsequent sections of Chapter 5 then present the results of the injector
fault investigation whereby AE activity from both pintle, and hole-type nozzle faults
was compared and categorised in terms of the operational features associated with
the two types of Diesel fuel injector nozzles.
Chapter 6: Detection of Knock Related Acoustic Emission from a Dual-Fuel Diesel
Engine Operating with Diesel Fuel and Ethanol
Chapter 6 commences by introducing the phenomenon of dual-fuel Diesel knock and
the method used to induce dual-fuel Diesel knock in the test engine. Chapter 6 then
details the phenomenon of combustion chamber resonance. Subsequent parts of
Chapter 6 then detail the two methods used to quantify the three different dual-fuel

Characterisation of Combustion Related Acoustic Emission Sources for Diesel Engine Condition Monitoring
10
Diesel knock levels induced throughout the test and present the results of the
investigation whereby AE signals were compared and characterised in terms of the
induced dual-fuel Diesel knock levels.
Chapter 7: Characterisation of Acoustic Emission Associated with Abnormal Valve-
Train Dynamics in a Small Pushrod-Type Diesel Engine
Chapter 7 begins by highlighting the importance of correctly controlled valve
motion and the role played by dynamic modelling in addressing valve motion.
Subsequent sections detail the process whereby a dynamic valve-train model specific
to the engine used during the test campaign was developed. Subsequent sections
then detail the investigation in which the predicted dynamic valve-train behavior
was used to characterise recorded AE signals in terms of the underlying valve
related AE generating events.
Chapter 8 Detection and Characterisation of Acoustic Emission Activity Associated
with Piston Slap in a Small Diesel Engine
Chapter 8 begins by detailing the method used in inducing the excess piston slap and
continues by describing the modelling process used to identify the crank-angle
positions where six potential piston slap impacts could occur during the engine
cycle. Subsequent sections of Chapter 8 then present the results of the investigation
in which averaged AE RMS signals were examined for piston slap related AE
activity using previously established model specific information.
Chapter 9: Conclusions and Future Work
The initial section of the closing chapter firstly summarises and details the
conclusions drawn from the research presented throughout the thesis. Following this
Chapter 9 then suggests in broad terms how the approach taken throughout this
thesis may be implemented in the further development of Diesel engine condition
monitoring systems. Chapter 9 finally concludes by highlighting those parts of the
research which could be extended, complimented and built upon.

Chapter 2: A Review of Methods Used for Diesel Engine Condition Monitoring
11
Chapter 2 A Review of Methods Used for Diesel Engine Condition Monitoring
The continuing push to develop Diesel engine monitoring systems that can both
monitor operating performance, and provide effective fault diagnostics and
prognostics has led to continuing research interest regarding the development of
monitoring technologies. This interest has resulted in the continued development of
engine monitoring methods using both established and emerging engine monitoring
technologies. As an example, recent studies have investigated the automation, and
improvement of the fault diagnosis task using tribology [1-3], cylinder pressure [4,
5], and vibration data [6-10] as well as thermodynamic modelling [11], acoustic
recordings [12-14], instantaneous crank-angle velocity measurements [15] and
acoustic emission data [16]. The initial portion of Chapter 2 elaborates on this

Characterisation of Combustion Related Acoustic Emission Sources for Diesel Engine Condition Monitoring
12
engine monitoring theme by providing an overview regarding the research and
application of the broad range of engine monitoring methods. This opening portion
of Chapter 2 is then followed by a summary highlighting the main advantages and
disadvantages associated with AE based engine condition monitoring methods when
compared against the other methods outlined during the initial part of the chapter.
The final sections of Chapter 2 then go on to provide concise descriptions of the
phenomena that generate AE; how AE measurements are made; and the varied
applications of AE based methods in non-destructive testing (NDT) and condition
monitoring (CM).
2.1 Diesel Engine Monitoring Methods
As Diesel engines feature complex interactions between multiple sub-systems, it is
of no surprise that many parameters are needed to monitor the state of the engine
and its auxiliary systems. Many engine parameters such as fluid stream pressures
and temperatures, exhaust emissions, and ignition timing are monitored in order to
provide information concerning the operational state of the engine, however, most
of these measurands provide very little insight regarding the future mechanical state
or “health” of the engine and its components. Many recent investigations have
attempted to address this issue and consequently, have demonstrated or proposed a
variety of different Diesel engine condition monitoring (ECM) methods based on:
• Cylinder pressure
• Crank-angle measurements
• Exhaust gas measurements
• Tribological methods
• Air-borne acoustics
• Vibration
• Acoustic Emissions
The fundamental goal of these CM methods is to provide a means for the early
detection of faults, and to track the progression and severity of the detected,
developing faults. The obvious benefits of this and the adoption of condition based

Chapter 2: A Review of Methods Used for Diesel Engine Condition Monitoring
13
maintenance management practices would include higher asset reliability; reduced
maintenance related costs and reduced pollution and running costs.
2.1.1 Cylinder Pressure Based Methods
Combustion is the fundamental element of engine operation as all the other aspects
associated with engine operation are in some way linked to combustion related
characteristics. For example, performance orientated factors such as generated
power, fuel efficiency and exhaust emissions are all determined by combustion
process characteristics. Engine reliability is also directly linked to the combustion
process as combustion directly affects the thermal and mechanical stresses,
corrosion and wear experienced by engine components.
Cylinder pressure measurements provide the most direct means of analysing the
combustion process and indeed, have been a key tool in engine research and
development for many decades [17-18]. Early cylinder pressure measurement
techniques involved the use of mechanical indicators which plotted the pressure-
volume curve on paper [18]. Modern cylinder pressure measurement techniques
typically involve the use of piezoelectric sensors as they are small, light and have a
high frequency response [19]. Parameters such as compression pressure, maximum
firing pressure, indicated mean effective pressure, pumping mean effective pressure,
maximum pressure rise rate and other more complex thermodynamic properties are
all given by cylinder pressure measurements [20, 21]. Studies such as that detailed
by Lapuerta et al. [22] highlight the use of thermodynamic parameters and cylinder
pressure measurements for combustion diagnosis.
In a CM context, cylinder and injection pressure measurements were used by
Hountalas and Kouremenos [4] as input parameters that were used in a detailed
thermodynamics based engine model to evaluate engine condition. In applying the
method to a large two-stroke marine Diesel engine, the authors [4] were able to
diagnose a series of causes responsible for poor engine performance that could not
be detected using conventional instrumentation. Hountalas et al. [5] also propose a
methodology for evaluating the compression condition and identifying compression
related faults in Diesel engines based on cylinder compression pressure
measurements taken during motored operation.

Characterisation of Combustion Related Acoustic Emission Sources for Diesel Engine Condition Monitoring
14
Although indispensable in research related fields, cylinder pressure measurements
have been considered intrusive and often impractical in industrial or production
settings due to the limitations or concerns associated with the required installation
space, harsh operating conditions, reliability of installed sensors and instrumentation
costs [17, 21]. Piezoelectric cylinder pressure sensors have however, recently been
integrated into Diesel engine glow plugs and have been used in engine control
systems for the regulation and control of combustion, fuel injection timing, exhaust
gas recirculation and turbo-charger operation [23].
2.1.2 Crank-Angle Measurement Based Methods
Techniques involving measurements of angular speed have been used across a broad
range of control and CM applications [24] however a great deal of research interest
has previously been generated regarding the use of these techniques in ECM
applications. ECM techniques utilising crank-angle measurements are based on the
measurement of the small variations in angular speed and acceleration experienced
by the crankshaft due to the rapid variations in cylinder pressure occurring in the
individual cylinders during engine operation. The direct relationship between crank-
angle speed fluctuations experienced by the crankshaft and the variations in cylinder
pressure has been used to indirectly measure engine torque [25-27] and cylinder
pressure [28-30].
As an example, in an investigation featuring the use of a Diesel engine, Brown and
Neill [28] demonstrated a technique to indirectly measure individual cylinder
pressures based on crank-angle speed fluctuations. The analysis of crank-angle
speed data was categorised by Brown and Neill [28] as being either model based or
library based. Brown and Neill [28] describe model based approaches as using a
mathematical model of the engine, drive-train and load to provide a detailed insight
into the “physical mechanisms responsible for crankshaft angular velocity
fluctuations”. The library based approach was described by Brown and Neill [28] as
involving the collection of measured crank-angle speed fluctuation data that
corresponds to known engine conditions to form a “knowledge base”. In the
investigation by Brown and Neill [28], a library based approach was adopted
whereby a pattern recognition technique was used to predict an “under-fuelling”
fault induced into a six cylinder, two-stroke Diesel engine. The use of a model based

Chapter 2: A Review of Methods Used for Diesel Engine Condition Monitoring
15
approach has been demonstrated by Citron et al. [31]. In this work a four degree-of-
freedom dynamic model of the engine and drive-train was developed and the
measured crank-angle speed data used as input to calculate total torque and pressure
torque fluctuation waveforms as well as the pressure torque, and cylinder pressure
waveforms.
In more recent investigations pertaining specifically to Diesel ECM and fault
detection, Yang et al. [32] present a dynamic model which was used to generate
instantaneous angular speed fluctuation ratio and instantaneous angular speed
waveforms. During the experimental phase of the investigation a fault diagnosis
method using the IASFR was used to detect a fuel leak in one of the high pressure
fuel lines in a small four cylinder engine. As described by Yang et al. [32], the fault
diagnosis method used was sensitive to Diesel engine faults that affect the gas
pressure in the cylinders. A model based approach for detecting combustion related
faults in large Diesel engines has also been demonstrated by Desbazeille et al. [15].
In this study, a large 20 cylinder 200 litre Diesel engine was dynamically modelled
and an automated fault diagnosis system was then proposed based on the use of
neural networks.
The detection of misfire using instantaneous crank-angle velocity (ICAV)
measurements has also been demonstrated. For example, Tinaut et al. [33] point out
that there are two main approaches used for crank-angle based detection of misfire.
The first of these is categorised by Tinaut et al. [33] as being “based on the
evaluation of the instantaneous angular velocity signal without using an engine
model”. Tinaut et al. [33] mention that many of the proposed methods give good
results at low engine speeds however due to the lack of an engine model fail to take
inertia effects into consideration at higher speeds. The second main misfire detection
approach is also described by Tinaut et al. [33] as being “the model based
techniques, which use a dynamic engine model to estimate indicated torque or in-
cylinder pressure”. With respect to these techniques, Tinaut et al. [33] point out that
many of these methods are “complex and require high calculation capacity”. Tinaut
et al. [33] go on to propose a misfire detection algorithm that utilises an energy
based engine model. Two dimensionless energy indexes were extracted and used to
evaluate changes in kinetic energy during the compression and expansion strokes in

Characterisation of Combustion Related Acoustic Emission Sources for Diesel Engine Condition Monitoring
16
each cylinder. This approach is described by Tinaut et al. [33] as being able to
correctly diagnose faults in engines operating under transient conditions and at
higher engine speeds whilst requiring less calculation capacity compared to other
model-based methods.
As highlighted in the studies discussed above, crank-angle measurement based
monitoring techniques possess many advantages. General advantages listed by
various Authors include; using existing crankshaft and camshaft sensors and not
requiring extra instrumentation [33, 34]; being non-intrusive and reliable [32]; being
easily installed and in-expensive [35] and being easily implemented for production
[35]. Another major advantage of this technique is the ability to monitor torque
contributions from individual cylinders as well as the overall power balance of the
engine [31].
The main disadvantage associated with engine monitoring techniques utilising
crank-angle measurements is that these techniques are limited to the detection of
faults that are either directly related, or are severe enough to affect the torque
contributions of individual cylinders. This point is highlighted by Brown and Neill
[28] when they state that “the condition to be quantified must have a measurable
effect on the observed angular velocity fluctuations”. It is also pointed out that
although combustion condition can be monitored directly, crank-angle based
methods are not able to identify specific component related faults [35].
2.1.3 Methods Based on Exhaust Gas Measurements
Monitoring methods relying on exhaust gas measurements can be divided into those
that measure exhaust gas constituents; those that use temperature readings; and
those that measure exhaust gas pressure. Exhaust gas monitoring has been a critical
aspect of engine related research and development for a number a decades and has
to a large degree, been driven by the need to control exhaust gas emissions. As a
consequence exhaust gas monitoring sensors, particularly Nitrogen oxide sensors,
are widely used for closed-loop three way catalytic-converter emissions control [36]
and have been investigated and described by Authors such as Satake et al. [37] and
Riegel et al. [38]. Engine monitoring methods based on measurements of exhaust
gas temperature are also well established and have been investigated for the

Chapter 2: A Review of Methods Used for Diesel Engine Condition Monitoring
17
detection of knock [39] and the detection of combustion and fuel system related
faults with particular monitoring applications including; cylinder power balance,
timing, air/fuel ratios and fuel quality [21]. Exhaust gas temperature monitoring
techniques can however, be susceptible to various instrumentation problems due to
carbon build up on sensors and the influence of manifold dynamics [21].
Monitoring methods relying on exhaust gas pressure measurements have also been
successfully applied in combustion monitoring roles with a particular focus on the
detection of misfire in spark-ignition (SI) engines. This focus on misfire in SI
engines stemmed from the introduction of catalytic converters and the associated
need to comply with various legal requirements [40, 41]. Examples of proposed
diagnosis methods include one detailed by Chiavola and Conforto [42] for a four
cylinder SI engine based on both time and frequency domain processing, and those
by both Ceccarani et al. [43] and Willimowski and Isermann [44] for SI engines
having V12 engine designs.
In a more recent study, Jiang et al. [14] summarised exhaust based monitoring
methods such as those mentioned above as having shown “very promising results
for (the) combustion diagnosis in regards to misfire detection”, however Jiang et al.
[14] point out that some concerns exist regarding data reliability and the effects
from acoustic reflections and standing waves within the exhaust system. In
addressing these concerns, Jiang et al. [14] detailed the development of an acoustic
model for the exhaust system which was in turn, used in the development of a
combustion monitoring method. This approach was tested experimentally using a
small four cylinder direct injection (DI) Diesel engine operated under normal and
faulty conditions. The induced faults included both, incorrect injector discharge
pressures, and increased exhaust valve lash. The experimental results were reported
by Jiang et al. [14] as showing that the two induced faults could be “accurately
detected, localised and differentiated by using the local deviations in the
waveforms”.
2.1.4 Trbological Methods
As mentioned by Johnson and Spurlock [45-49] in their overview, tribological
condition monitoring techniques, commonly referred to as oil analysis, were first

Characterisation of Combustion Related Acoustic Emission Sources for Diesel Engine Condition Monitoring
18
used for condition monitoring in a systematic fashion by the railroad industry in the
U.S.A. soon after the Second World War. Oil analysis techniques then developed
rapidly and by the mid 1950’s oil analysis methods were being used by the U.S.
Navy to monitor jet engines [45]. Oil analysis methods are now widely used to
monitor hydraulic plant, gas turbines, reciprocating engines, gearboxes and a host of
other plant and are generally considered to be a mature technology with proven
condition monitoring and fault diagnosis abilities. Jiang and Yan [50] highlight the
wide acceptance of oil analysis methods for engine monitoring specifically, by
mentioning that oil analysis is the most widely used condition monitoring method
for Diesel engines.
Oil analysis methods were classified by Jiang and Yan [50] as belonging to one of
three categories; concentration analysis, debris analysis methods or lubricant health
analysis methods. Concentration analysis and debris analysis methods aim to
characterise the location and type of wear occurring, based on debris present in the
lubricant with the most important parameters being quantity, size distribution,
morphology and composition [51]. Lubricant health analysis aims to ascertain the
condition of the lubricant itself by assessing lubricant qualities such as viscosity,
neutralisation number, contaminant levels and the degree of oxidization. Specific,
commonly used methods include magnetic plug inspection, blotter spot test,
spectrographic analysis, ferrography, X-ray fluorescence and thin-layer
chromatography [51].
Although Oil analysis methods are considered to be a mature technology, a number
of recent investigations have been undertaken regarding their use in automated fault
detection systems. As examples, Macian et al. [2] proposed a prototype fuzzy expert
system for oil analysis based Diesel engine fault diagnosis whilst Morgan et al. [3]
utilised a combination of the self organising map and the K means algorithm to
classify potential faults. Morgan et al. [3] also point out that the development of
computer hardware and compact spectrometry equipment has “allowed on-line and
‘pseudo on-line’ oil analysis to be carried out on-board ships with a change in
perspective from purely expert systems to more data-centric approaches”.

Chapter 2: A Review of Methods Used for Diesel Engine Condition Monitoring
19
Although Authors such as Liu et al. [52] have demonstrated online oil analysis
based monitoring for large marine Diesel engines, the major limitations associated
with the use of oil analysis based techniques continue to be the predominant off-line
nature of the analysis, time and expense associated with the collection and
examination of samples, and the inability to monitor components or regions of the
engine that are not subject to lubricant flow.
2.1.5 Air-Borne Acoustics Based Methods
Investigations pertaining to the examination of noise emitted by Diesel engines can
be traced back for a number of decades. As examples, Fielding and Skorecki [53]
studied the contribution to Diesel engine noise made by piston slap whilst Priede
[54] identified combustion related pressure rise as the main cause for emitted engine
noise. The investigation of acoustic measurements in a Diesel ECM context
however, is relatively recent with Gu, et al. [55] listing the progress and
development of acoustic instrumentation and signal processing techniques as the
impetus for the recent research interest.
Gu and co-workers [55-56] undertook an investigation which involved both;
simulation of the sound generated by a Diesel engine using a model based on the
combustion process; and the inducement of injector faults into a small four-cylinder
Diesel engine. The simulation showed that although sound from a multi-cylinder
engine is “dominated by the firing frequency and its harmonics” it also contains
high frequency impulses near the top-dead centre positions. Gu and co-workers [55-
56] also found that lower frequency sound (below 10 kHz) was distorted by the
acoustic characteristics of the environment but sound above 10 kHz gave a good
representation of the combustion process. Gu and co-workers [55-56] summarise
their findings by mentioning that the experimental testing showed that when using
the continuous wavelet transform, the “location of different faults, their influences
upon combustion and the ability to distinguish between them” could be obtained.
In more recent work, Li et al. [12] applied independent component analysis to
acoustic signals and found it to be an effective tool in the identification of
combustion and valve related noise sources. In a subsequent study Li et al. [57] used
a self organising map neural network to perform the feature extraction task from a

Characterisation of Combustion Related Acoustic Emission Sources for Diesel Engine Condition Monitoring
20
Diesel engine operated under normal conditions, and with increased inlet and
exhaust valve-lash clearances. Li et al. [57] used statistical and spectral methods to
process the extracted feature information and the results showed that the technique
detailed was able to reveal the operating condition of the engine. Albarbar et al. [13]
also used independent component analysis to decompose signals recorded from
three microphones located near one of the fuel injectors of a small Diesel engine. In
this work, it was reported that the approach detailed “decomposes the air-borne
acoustic signals into their sources such as combustion, piston slap, valve motion and
fuel injection processes”.
Albarbar et al. [13] briefly lists the general obstacles that have been encountered
with the use of air-borne acoustic engine monitoring techniques. The obstacles listed
were; background noise contamination, number engine related sources, overlap and
interference of engine related sources, and the lower energy level associated with
events like fuel injection being buried or corrupted by higher energy events and/or
background noise. In addition, Li et al. [57] points out that minor (or incipient)
faults often have little impact on the overall engine structure and are unlikely to
contribute significantly to overall noise levels. Li et al. [57] also points out that
Diesel engines are particularly affected by random noise sources which exist in most
machinery.
2.1.6 Vibration Based Methods
The detection and control of engine knock in SI engines is probably the most widely
recognised application of vibration based engine monitoring. Numerous investigations
have detailed the detection and control of knock using vibration based methods such
as; pattern recognition techniques [58-59], parametric models [60] and wavelet
analysis [61]. Although widely adopted for SI knock detection, vibration based
monitoring methods remain under utilised in Diesel engine condition monitoring
roles. The background to this situation is highlighted by Goldman [62] when he
details that although CM methods based on vibration measurements have been
instrumental in the wide adoption of predictive maintenance regimes, application of
these CM methods to engines however is complicated by added signal complexity.
This added signal complexity is due to factors such as; impact excitations, time
varying transfer properties and the non-stationary nature of the recorded vibration

Chapter 2: A Review of Methods Used for Diesel Engine Condition Monitoring
21
signals [63]. As a consequence, the use of classic spectral analysis based rotating
machinery monitoring methods have been widely viewed by researchers such as
Antoni and co-workers [10, 64] and Liu and Randall [65] as ineffective or limited
when applied to reciprocating internal combustion (RIC) engines.
The sources of vibrations in Diesel engines have been attributed to combustion, piston
slap, fuel injection and valve operation [7, 63]. In addition, Antoni et al. [10] also lists
the “rocking and twisting of the engine block on its supports due to the action of
inertial forces” and the impacts due to clearances associated with the crankshaft and
piston (gudgeon) pin bearings as other sources of vibration in engines. Many of these
sources of vibration are associated with events that occur within a small crank-angle
window near piston top-dead centre (TDC) and Antoni et al. [10] indeed point out
that the overlapping vibration signatures from these events presents a major difficulty
in the analysis of engine related vibration signals. This is emphasised by Antoni et al.
[10] when they point out that the impulse response for a typical engine structure lasts
for a few milliseconds, which for an engine operating at 1500rpm, translates to a
crank-angle window that is greater than 10˚ in length.
The obstacles posed by the source separation issue have led to a considerable
number of investigations that focus on the development and application of source
separation techniques. As an example, Badawi et al. [7] investigated the use of a
technique whereby vibration signals recorded from a single accelerometer on a
small single-cylinder Diesel engine were separated using segmentation independent
component analysis and vibration due to valve operation, fuel injection, combustion
and piston slap were identified. Badawi et al. [7] also identified gas dynamics as
contributing to engine vibration.
Other recent studies to address the source separation issue include those by Liu and
co-workers [65, 66] who applied blind source separation techniques to vibration data
recorded from a small four-cylinder Diesel engine operating under both normal and
faulty conditions. Liu and Randall [65] concluded that “reasonable results were
obtained for fuel injection, piston slap and combustion pressure variations” whilst in
a subsequent investigation, Liu et al. [66] reported that three sources; interpreted as
piston slap, cylinder pressure change due to piston motion and cylinder pressure

Characterisation of Combustion Related Acoustic Emission Sources for Diesel Engine Condition Monitoring
22
oscillation due to combustion, were obtained. Liu and co-workers [65, 66] also
reported that recovered pressure could be considered as two distinct sources; a low
frequency component associated with piston movement and a high frequency
component associated with combustion.
Numerous investigations have also been undertaken where a variety of Diesel
engine faults have been diagnosed using a combination of methods. For example,
qualitative comparisons of crank domain plots of vibration, ultrasonic and pressure
data were undertaken by Long and Boutin [67] in a case study showing the signal
characteristics of a range of Diesel engine faults, while Chandroth et al. [68, 69]
detail the development of an artificial neural network based Diesel engine fault
diagnosis system. Long and Boutin [67], highlight the appearance of various signal
features using a combination of measurands that relate to a broad range of Diesel
engine faults such as cylinder liner scuffing, piston slap, injection related faults,
valve related faults, worn piston rings, collapsed lifter and incorrect valve-lash.
Chandroth et al. [68] used three different feature extraction techniques to develop
artificial neural network based Diesel engine fault diagnosis system. The three
feature extraction techniques; domain expertise, wavelet analysis and principal
components analysis were used to detect injector related faults and leaking valves.
Chandroth et al. [68] described the three feature extraction techniques as “exhibiting
a high degree of accuracy” however; the wavelet technique was reported as yielding
the best results. Various other researchers have also investigated advanced Diesel
engine fault detection and diagnosis using techniques such as; rough sets theory [8,
70], non-linear analysis [71], Fourier and time-frequency analysis [72], empirical
mode decomposition [73], Hillbert spectrum analysis [74], Wigner-Ville
distributions [6, 63, 75] and the Kullback-Leibler distance approach [76]. These
studies have to varying degrees of success, demonstrated the detection of incorrectly
adjusted valve-lash, misfire, piston slap, injector faults and worn piston rings.
Cylinder pressure reconstruction using vibration signals has also been detailed by
authors such as Gao and Randall [77]. In this work, Gao and Randall [77] developed
and applied a time-domain smoothing technique to reconstruct cylinder pressure

Chapter 2: A Review of Methods Used for Diesel Engine Condition Monitoring
23
traces from a single cylinder four-stroke Diesel engine. In other work pertaining to
cylinder pressure trace reconstruction from vibration signals, Antoni et al. [64]
address and discuss the feasibility of using vibration signals for cylinder pressure
trace reconstruction by means of inverse filtering. In their remarks on the
“observability of the pressure trace”, Antoni et al. [64] mention that, as most
vibration measurements taken from engines are taken using measurements of
acceleration, “it is theoretically not possible to recover the actual magnitude of the
pressure trace”. As pointed out though, this issue can be easily corrected for [64]. As
part of their conclusions, Antoni et al. [64] highlight the two major difficulties
associated with their work.
The first major difficulty mentioned was the poor conveyance of the low frequency
energy associated with the pressure signal, to the vibration signal. This was
explained by Antoni et al. [64], as being due to the majority of the pressure trace
energy being contained below a few hundred Hertz whilst vibration signals
generally contain very little energy in this frequency range due to the rigidity of the
engine structure. The second major difficulty mentioned by Antoni et al. [64] was
the corruption of the vibration signals by “non-negligible additive noise such as
piston slap and inertial forces”. Antoni et al. [64] however, showed that the
difficulties mentioned above could be negated using the proposed cylinder pressure
reconstruction method. Although vibration based Diesel engine fault detection and
pressure trace reconstruction techniques have been successfully demonstrated, a
number of general difficulties continue to be identified with their use. In addition to
the previously outlined issues related to event overlap and the non-stationary signal
nature, researchers such as Steel and Reuben [16], Kim [17] and Douglas [21] have
identified vibration signals as having lower signal-to-noise ratios (SNR) when
compared to AE signals.
2.1.7 Acoustic Emission Based Methods
It is generally recognised that AE methods have been successfully used for many
years for non destructive testing applications however the field of research regarding
the use of AE for engine monitoring is relatively new. The earliest investigation
regarding the viability of AE based ECM was probably undertaken by Gill et al.
[78] in the late 1990’s. In this study, a preliminary investigation highlighted the

Characterisation of Combustion Related Acoustic Emission Sources for Diesel Engine Condition Monitoring
24
potential use of AE in ECM roles by demonstrating the detection of misfire and
reduced injector discharge pressure using recorded AE signals. The study by Gill et
al. [78] was soon followed by a comprehensive study undertaken by Fog et al. [79-
81]. Results detailed by Fog et al. [79-81] demonstrate a successful AE based
method for detecting exhaust valve leakage and cylinder misfire in a large two-
stroke marine Diesel engine. It was found that the measured AE root mean square
(RMS) signals contained more information concerning valve and injector operation
than either pressure, temperature or vibration data.
A key aspect of the investigations undertaken by Fog and co-workers [79-81]
involved the automation of the fault diagnosis process. Fog et al. [79-81] employed
principal components analysis for dimensionality reduction and feature extraction,
and faults were classified with a feed forward neural network. Many other
subsequent investigations involving the use of AE signals in automatic classification
of Diesel engine faults have been undertaken and indeed automated fault
classification can be considered a major Diesel engine monitoring research theme.
Other major themes to have emerged in addition to the automated fault classification
theme are; signal mapping, source location and reconstruction, and signal
characterisation.
Other examples highlighting the automated fault classification theme include
Sharkey et al. [82, 83] who combined artificial neural network to form a multi-net
fault diagnosis system using cylinder pressure, vibration and AE sensor data to
classify valve and injector faults. It was reported that benefits of using multiple
measurands in a multi-net fault diagnosis framework included sensor failure
tolerance and an improvement in performance over the best performing single sensor
artificial neural network [82, 83]. In a similar vein, other researchers such as Frances
et al. [84] have investigated the use of AE in the detection of injector faults as well
as exhaust manifold gasket leaks using wavelets analysis and statistical features
whilst Pontoppidan and co-workers [85, 88] investigated the use of AE signals for
the unsupervised detection of lubrication regime changes between the ring-pack and
cylinder liner in large Diesel engines using both principal components analysis and
independent component analysis. A classifier that incorporated a physical model of a

Chapter 2: A Review of Methods Used for Diesel Engine Condition Monitoring
25
crank-slider mechanism has also been used for the detection of exhaust valve and
misfire faults in a large two-stroke marine Diesel engine [89].
Although earlier researchers such as Fog [79] had identified the need to include a
priori knowledge concerning the operation of the engine into timing maps to
correlate or “map” AE signals to mechanical events, it was the study by El-Ghamry
et al. [90] - in which the mapping task on AE signals from three different types of
reciprocating machinery was automated - that resulted in the emergence of the
second major Diesel engine monitoring research theme. El-Ghamry et al. [90]
pointed out that the approach of using automatically isolated portions of the
measured AE signals associated with specific mechanical events “relaxed the
numerical intensity of the signal processing required for fault diagnosis”. It was also
pointed out that when mapped, it is possible to monitor different mechanical events
in the signal at the same time given that the effects from the monitored events are
localised in the signal [90].
The third research theme - source location and reconstruction - emerged when
Nivesrangsan and co-workers [91- 95] approached the identification and location of
AE sources in both small and large Diesel engines from a wave propagation
perspective. Nivesrangsan et al. [91- 93] developed “spatial reconstitution methods”
whereby a simplified wave attenuation model was developed and used along with
AE signal mapping techniques to reconstitute decomposed multi-source signals
recorded using an array of AE sensors. In addition, Nivesrangsan et al. [91- 94] also
detail AE source location using established velocity-based source location
techniques as well as an AE energy-based method. The velocity-based technique
was found to be successful for single source signals, while an energy-based method
was found useful for multiple source signals.
The body of research by Nivesrangsan et al. [91- 94] probably represents the first
detailed application of AE source location techniques to RIC engines and highlights
the complexity of AE wave propagation in engine structures. Further investigations
by El-Ghamry et al. [96], detail the indirect reconstruction and measurement of
cylinder pressure from both small and large Diesel engines whilst Douglas et al.
[97] investigated non-invasive cylinder-by-cylinder performance monitoring using

Characterisation of Combustion Related Acoustic Emission Sources for Diesel Engine Condition Monitoring
26
AE and ICAV measurements. These studies suggest that in addition to CM roles,
AE based methods could also be applied in a performance or combustion monitoring
context.
As an example of the fourth major research theme - signal characterisation - Elamin
and co-workers [98, 99] investigated AE signal characteristics from faulty Diesel
fuel injectors [98] and incorrect valve-clearance [99] whilst Frances et al. [100]
undertook a study that sought to analyse the statistical variation of recorded AE
signals. In another example, Douglas and co-workers [21, 101] undertook extensive
studies on both small and large Diesel engines regarding the generation of AE from
the interface between the piston ring-pack and the cylinder wall. Douglas and co-
workers [21, 101] found that the AE measured from small high speed direct injection
(HSDI) engines was proportional to piston speed but varied little with load. It was
suggested that boundary friction acting on the oil control ring was the most likely
source for this AE activity. Based on tests using large two-stroke Diesel engines
Douglas and co-workers [21, 101] found that the continuous AE activity observed
around TDC, paralleled the cylinder pressure. Because of this, the AE activity was
attributed to asperity contact and blow-by occurring in the interface between the ring
pack and cylinder wall. It was also stated that the cyclically varying force exerted by
the in-cylinder pressure influenced the resultant AE [101].
Other researchers that have also investigated various aspects of AE generation from
the piston ring-cylinder wall interface include Kim and Lee [102], Singh et al. [103]
and, Haq and Tamizharasan [104]. The study presented by Kim and Lee [102]
focused on the development of a real-time diagnostic system for monitoring cylinder
liner wear in large two-stroke Diesel engines using an artificial neural network. Kim
and Lee [102] point out that scuffing is extremely difficult to predict as it is the
result of a number of factors. Presumably, the factors referred to include the
combined effects of friction and wear related mechanisms such as asperity
deformation, wear particle abrasion, ploughing, adhesion, and micro-welding.
Singh et al. [103] examined the effect that engine lubricant viscosity has on engine
friction. Comparisons were undertaken between traditionally calculated parameters
such as indicated power, brake power and friction power, and recorded AE signals.

Chapter 2: A Review of Methods Used for Diesel Engine Condition Monitoring
27
Preliminary results rather tentatively showed that recorded AE was sensitive to the
increased asperity contact associated with the use of lower viscosity engine oil.
However, Singh et al. [103] acknowledged that further signal processing and
analysis was needed. In their investigation, Haq and Tamizharasan [104] sought to
apply AE based monitoring techniques to quantify piston ring wear rates by
comparing measured piston ring wear with recorded AE. It was found that AE signal
count correlated well with the measured piston ring wear.
Many of the researchers referred to in the preceding paragraphs have reported that
AE based engine monitoring methods have substantial advantages over other
monitoring techniques. These advantages have been succinctly described by Steel
and Reuben [16] and, in general terms, these AE related advantages include; high
spatial and temporal fidelity; immunity to mechanical noise; being non-intrusive and
having a direct association with operating and fault causing processes. Although AE
based engine monitoring methods and the advantages mentioned represent
substantial improvements regarding fault detection and condition monitoring ability
over most of the other monitoring methods, there remain some key challenges that
have so far prevented the wider adoption of AE based engine monitoring methods
throughout industry.
As stated by Sikorska and Mba [105], AE based machine monitoring technology has
been “poorly adopted by industry despite a significant volume of work having been
published over the last twenty years describing success in detecting numerous
rotating and reciprocating machinery faults”. In addressing this situation further
Sikorska and Mba [105] discuss both generic and application specific challenges
associated with the adoption of AE based CM methods for rotating and
reciprocating machines. The generic problems identified by Sikorska and Mba
[105], were the inherently un-calibrated nature of AE measurements; the design of
AE hardware and software favouring established NDT roles; the data volumes
associated with recording raw AE signals; the computational power needed for real-
time data processing; the non-stationary nature of discrete and continuous machine
related AE signals; variability in machine operating conditions and background
noise.

Characterisation of Combustion Related Acoustic Emission Sources for Diesel Engine Condition Monitoring
28
The most concerning issue identified by Sikorska and Mba [105] related to AE
based engine monitoring involved the discrimination of the various sources of AE.
Other challenges identified by Sikorska and Mba [105] were signal smearing; high
background signal levels and signal attenuation and mixing.
2.1.8 Other Engine Monitoring Methods
Due to the important role played by engine monitoring, it is not surprising that along
with the methods detailed in the preceding sections, many other engine monitoring
methods have been investigated, proposed, and detailed. Other engine monitoring
methods used in a combustion or condition monitoring context have included; ion-
current based combustion monitoring and knock detection in SI engines [106] and
indirect cylinder pressure measurement using strain gauge measurements from the
cylinder head bolts or from sensors incorporated with the spark-plug [25]. As
examples, non-intrusive cylinder pressure measurement using a “Spark-Plug-Boss”
cylinder pressure sensor was detailed by Sellnau et al. [107] whilst Miyamoto et al.
[108] undertook an investigation whereby the strain of the cylinder head bolts and
displacements of the inlet valve stem and crankshaft end were measured due their
close relationships with cylinder pressure. Miyamoto et al. [108] found that of the
three different sets of measurements, accurate pressure indicator diagrams could be
calculated using the strain variations recorded from the cylinder head bolts.
Ion-current methods are based on the use of the spark plug as an ionisation probe to
detect the increase in ionisation associated with abnormal combustion [106]. Millo
and Ferraro [106] report that the amount of ignition system modification required
and concerns regarding the correlation of ion-current and cylinder pressure have
prevented this method from being widely adopted and, in-fact Fleming [36], lists the
production status of these sensors as being either limited or in the research and
development stage depending on the intended function. A variety of torque
measurement methods have also been proposed for engine monitoring and control
applications. In his overview, Fleming [25] describes a number of these different
torque measurement methods. The methods described include; measurements of
torsional twist using strain gauge torquemeters; torsional twist measurements;
torque-related permeability change detection using magneto-resistive sensors; load-
cell measurement of engine mount reaction forces; automatic transmission slip
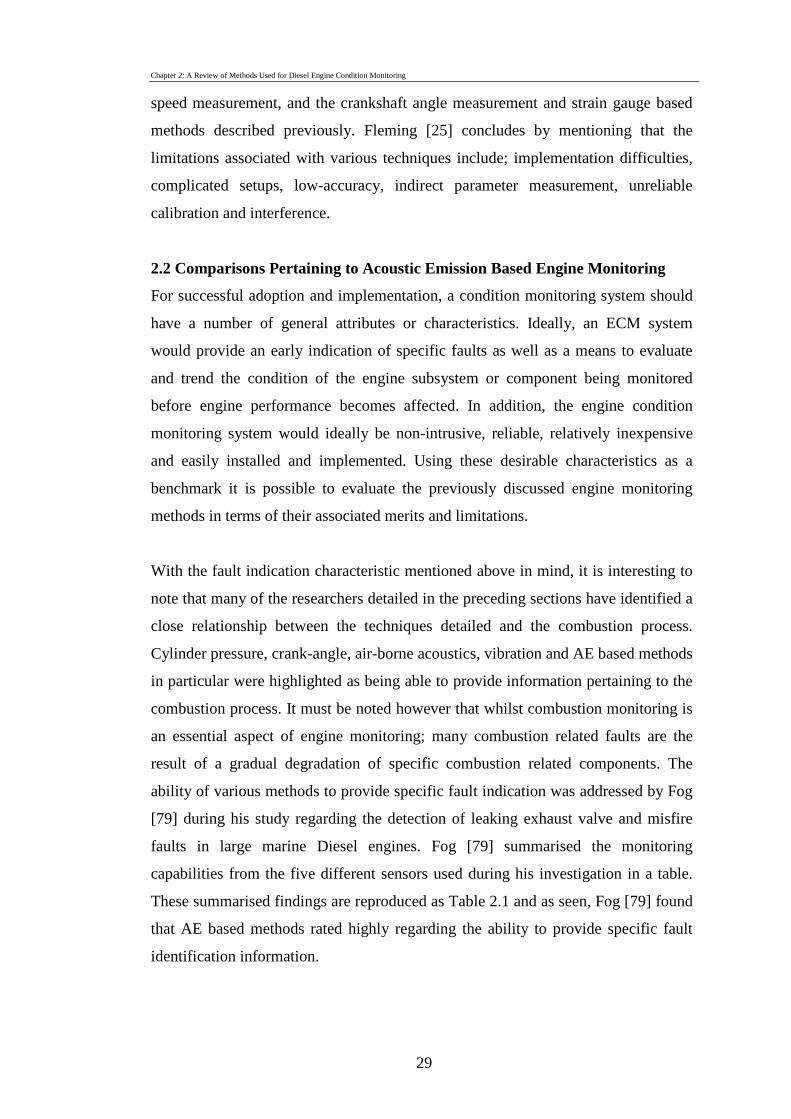
Chapter 2: A Review of Methods Used for Diesel Engine Condition Monitoring
29
speed measurement, and the crankshaft angle measurement and strain gauge based
methods described previously. Fleming [25] concludes by mentioning that the
limitations associated with various techniques include; implementation difficulties,
complicated setups, low-accuracy, indirect parameter measurement, unreliable
calibration and interference.
2.2 Comparisons Pertaining to Acoustic Emission Based Engine Monitoring
For successful adoption and implementation, a condition monitoring system should
have a number of general attributes or characteristics. Ideally, an ECM system
would provide an early indication of specific faults as well as a means to evaluate
and trend the condition of the engine subsystem or component being monitored
before engine performance becomes affected. In addition, the engine condition
monitoring system would ideally be non-intrusive, reliable, relatively inexpensive
and easily installed and implemented. Using these desirable characteristics as a
benchmark it is possible to evaluate the previously discussed engine monitoring
methods in terms of their associated merits and limitations.
With the fault indication characteristic mentioned above in mind, it is interesting to
note that many of the researchers detailed in the preceding sections have identified a
close relationship between the techniques detailed and the combustion process.
Cylinder pressure, crank-angle, air-borne acoustics, vibration and AE based methods
in particular were highlighted as being able to provide information pertaining to the
combustion process. It must be noted however that whilst combustion monitoring is
an essential aspect of engine monitoring; many combustion related faults are the
result of a gradual degradation of specific combustion related components. The
ability of various methods to provide specific fault indication was addressed by Fog
[79] during his study regarding the detection of leaking exhaust valve and misfire
faults in large marine Diesel engines. Fog [79] summarised the monitoring
capabilities from the five different sensors used during his investigation in a table.
These summarised findings are reproduced as Table 2.1 and as seen, Fog [79] found
that AE based methods rated highly regarding the ability to provide specific fault
identification information.

Characterisation of Combustion Related Acoustic Emission Sources for Diesel Engine Condition Monitoring
30
In another comparison featuring AE, vibration and air-borne acoustics based
methods, Douglas [21] points out that although AE, vibration and air-borne
acoustics waves are generally produced by the same mechanisms, AE based
methods are widely recognised as having a significantly higher SNR than either
vibration or air-borne acoustics methods. This high SNR and the high damping
characteristics associated with AE based methods are further highlighted by Douglas
[21] as being responsible for the ability of AE based methods to “detect the
degradative processes that lead to failure rather than the consequences”.
The intrusiveness of monitoring techniques is also frequently mentioned by
researchers as a major limiting factor in the widespread up-take of a given
monitoring method. As was pointed out in Section 2.1.1, cylinder pressure
measurements in particular have been widely classified as intrusive due to the extra
combustion chamber access holes required for installation. Cylinder pressure
measurements have also often been classified as lacking reliability due to the harsh
operating conditions within the combustion chamber.
Table 2.1: Summary of sensor capabilities from Fog [79]
Sensor Capability
Crank-angle encoder
Crank shaft position
Engine speed
Accelerometer
Limited valve condition information
Monitoring of valve opening and closing
Cylinder pressure
Indication of combustion efficiency
Engine power measurement
AE RMS
Monitoring of fuel injection Monitoring valve activity Valve leakage monitoring
Monitoring load dependant features Misfire detection
Exhaust gas temperature
Limited engine condition information
Misfire detection

Chapter 2: A Review of Methods Used for Diesel Engine Condition Monitoring
31
As was detailed in Section 2.1.2, various researchers categorised crank-angle
measurement based monitoring techniques as possessing significant advantages in
terms of method reliability, ease of installation, and associated costs. Indeed, these
merits remain valid when comparisons are made against other engine monitoring
methods including the air-borne acoustics, vibration and AE based methods. This is
due to the simplicity and robustness of encoder related hardware and the well
developed state of the art in terms of its application. When comparisons of method
reliability, ease of installation, and associated costs are made between the air-borne
acoustics, vibration and AE based methods, AE methods compare unfavourably due
to the number of sensors needed, particularly for monitoring large engines, and the
increased costs associated with AE data acquisition (DAQ) equipment. The relative
merits and limitations of the various ECM methods detailed in the preceding
sections are summarised below in Table 2.2 in terms of the ability of the ECM
method to monitor developing faults in combustion related components.
Table 2.2: Relative merits and limitations of ECM methods regarding the
detection of combustion related component faults
Engine Monitoring
Method
ECM System Attribute
(H = high; M = medium; L = low) Component
Related Specificity
Early Fault
Detection
System Reliability
Intrusiveness Level
Overall System
Cost
Level of Industrial
Acceptance
Cylinder Pressure
L
L
L
H
M
H
Crank –angle Measurements
L
L
H
L
L
H
Exhaust Gas
Measurements
M
L
H
L
L
H
Tribological
Methods
M
M
H
M
H
H
Airborne Acoustics
M
M
M
L
L
L
Vibration
Measurements
M
M
H
L
L
H
Acoustic
Emissions
H
H
M
L
M
L

Characterisation of Combustion Related Acoustic Emission Sources for Diesel Engine Condition Monitoring
32
As Table 2.2 shows, established techniques using cylinder pressure, exhaust gas and
crank-angle measurements are constrained in terms of their applicability in
monitoring combustion related component faults as these techniques monitor fault
related symptoms and are lacking with regards to component specific fault
identification. In addition Table 2.2 highlights the limitations associated with
tribological techniques, these being the off-line nature, the limited ability to monitor
components or regions of the engine that are not subject to lubricant flow and the
time and expense associated with sample collection and examination. Table 2.2 also
shows that ECM methods based on AE measurements are capable of detecting a
range of combustion related component faults and that AE ECM methods have
substantial advantages with respect to being non-intrusive and having the ability to
directly monitor fault causing processes.
2.3 The Acoustic Emission Phenomenon
Acoustic emissions, sometimes referred to as stress waves, have been defined by the
International Standard; ISO 22096 [109] as: “structure-borne and fluid-borne (liquid,
gas) propagating waves due to the rapid release of energy from localised sources
within and/or on the surface of a material”. ISO 22096 [109] further describes the AE
phenomenon as a spontaneous release of elastic energy in the form of transient elastic
waves which manifest as waves on the surface of a material. Dr. J Kaiser is widely
credited with having released the first comprehensive study of AE in 1950 [110]
although the term “tin cry” was used during the 19th century to describe the acoustic
emissions produced by working and deforming metal [110].
2.3.1 Sources of Acoustic Emission
Acoustic emissions are produced by almost all physical phenomena affecting solid
materials [110]. These phenomena include both micro, and macro-scale processes.
Micro-scale, AE producing phenomena include crack nucleation, dislocation slip and
grain boundary sliding whilst macro-scale phenomena include friction, impact, crack
propagation and component deformation. Table 2.3, adapted from [110-113]
summarises the general sources of AE in metals and lists some typical mechanisms.
Other sources of AE include de-lamination, breakage or separation of components in
composite materials [112], realignment or growth of magnetic domains, phase
transformations and fluid flows [110].

Chapter 2: A Review of Methods Used for Diesel Engine Condition Monitoring
33
Table 2.3: General AE producing sources and mechanisms in metals
AE Sources Mechanism Details
Deformation
Dislocation generation Dislocation migration
Dislocation relief Twinning
Grain boundary slip
Phase
transformations
Polymorphic transformations
Precipitate formation in solid solutions Magneto-mechanical phenomena
Cracking and Fatigue
Accumulation of micro-defects
Plastic strain Crack propagation
Material creep Corrosion cracking
Friction
Impacts Elastic interactions
Plastic deformation of surface asperities Surface layer damage
Spalling Interaction of wear particles and surfaces
Localised stress-strain changes Fatigue pit formation
Dr Kaiser is also credited as the discoverer of the now commonly recognised
irreversibility associated with AE phenomena [114]. This irreversibility, named the
Kaiser effect, recognises that once an initial load has produced AE, a subsequent load
must be larger if it is to generate another AE event even if the previous load was
removed. The Kaiser effect however, has been found to vary between metals and may
not even exist in some metals [111].
2.3.2 Acoustic Emission Signals
The measurement of AE is normally undertaken using resonant piezoelectric-type
sensors that generate a voltage which is proportional to the stress applied to the
piezoelectric element due to the surface displacements experienced by the sensor. In
addition to AE systems employing resonant piezoelectric sensors, AE measurement
systems have also been developed using laser and optical fibre technologies [114].
The schematic in Figure 2.1 shows the construction of a typical resonant

Characterisation of Combustion Related Acoustic Emission Sources for Diesel Engine Condition Monitoring
34
piezoelectric-type sensor whilst the detection of AE using a piezoelectric-type
sensor is shown conceptually in Figure 2.2
Figure 2.1: Schematic showing typical AE sensor construction [115]
As seen in Figure 2.2 elastic energy released during an AE producing event
generates elastic waves which propagate from the source throughout the material.
These waves then travel on the surface of the material where they are measured by
an AE sensor.
Figure 2.2: Diagram showing the propagation and detection of AE waves [114]

Chapter 2: A Review of Methods Used for Diesel Engine Condition Monitoring
35
Signals recorded by AE sensors can be broadly classed as being either discrete or
continuous. Discrete or burst type AE signals are transient in nature and are
distinguished by their short duration and increased amplitude over the threshold
level of the signal. Continuous signals on the other hand, continue for extended
periods and are the result of continuously occurring discrete AE producing events.
The overall classification of AE as discrete or continuous is largely relative as it is
dependant on the ability of the data recording equipment to capture individual AE
events [110]. Individual energy releasing events such as those accompanying crack
length changes during ductile fracture are typical AE burst signals whilst the
ongoing signals recorded during the stable plastic strain period of ductile crack
growth produces continuous AE signals [110]. AE signals recorded from machinery
however, typically consist of a combination of both burst, and continuous AE [115].
2.3.3 Other Acoustic Emission Based Monitoring Applications
AE based NDT methods are considered to be a mature technology and have been
extensively used in a wide range of applications. For example, International
Standard ISO 16148:2006 [116] provides a guideline for testing seamless gas
cylinders whilst other Standards outline AE based NDT for the detection of
corrosion [117] and for evaluating the structural integrity of fiberglass-insulated
reinforced plastic booms used on elevating work platforms [118]. In addition AE
based monitoring methods have been used to monitor other structures and processes
such as; metal cutting and machining processes[119-122], bridge monitoring [123,
124], and various manufacturing processes such as grinding, forming and welding
processes [125, 126].
AE based monitoring methods have also been applied to many types of rotating and
reciprocating machinery. For example, AE based methods have been used to
monitor the operating parameters of small turbine units [127], and incipient
cavitation in centrifugal pumps [128]. AE based methods have also been
documented in a condition monitoring or fault diagnosis context for the detection of
faults in rotating machines, gearboxes and other plant [129] as well as rolling
element bearing defects at normal speeds [130, 131], and at low speeds [132, 135].
Additionally, in one of the earliest applications of AE techniques to reciprocating
machinery, Gill et al. [136] demonstrated the use AE signals to detect valve related

Characterisation of Combustion Related Acoustic Emission Sources for Diesel Engine Condition Monitoring
36
faults in a large reciprocating compressor having poppet-type valves similar to those
used in internal combustion engines.
2.4 Chapter Summary
Chapter 2 elaborated on the continuing interest in ECM research mentioned in the
opening chapter by providing an overview regarding the major established and
emerging engine monitoring technologies. The main advantages and limitations
associated with these engine monitoring technologies were described and a number
of fundamental attributes were highlighted as being key constraints in terms of
achieving the fault diagnosis capability necessary for the implementation of CBM.
Utmost among these constraints were; monitoring the symptoms of faults rather than
the fault causing mechanisms; a lack of specific fault identification capacity; sensor
intrusiveness; prohibitive cost and a lack of sensor reliability.
In addition, as part of the overview in Chapter 2, ECM methods utilising AE
measurements were identified as a relatively recent development that has evolved
from the well established AE based NDT field. Authors mentioned within Chapter 2
have reported the successful detection of a broad range of combustion related faults
and comparisons have suggested that many of the key constraints identified could be
successfully addressed using AE based ECM techniques. Indeed, as pointed out
within Chapter 2, many researchers have reported that AE ECM methods have
substantial advantages over other more established ECM methods with respect to
the ability to directly monitor fault causing mechanisms, signal fidelity, noise
immunity and being non-intrusive.
Whilst the advantages mentioned possibly represent substantial improvements in
fault detection potential over other monitoring methods, it was also recognised
within the overview that major challenges remain in the development of AE based
ECM methods. In terms of monitoring engines, these obstacles were the difficulty
in identifying AE from multiple combustion related sources; the non-stationary
nature and variability of engine related AE signals; the large AE data volumes and
computational power needed for real-time monitoring and the un-calibrated nature
of AE measurements.

Chapter 3: Combustion Related Diesel Engine Components, Faults and their Acoustic Emission Signal Features
37
Chapter 3
Combustion Related Diesel Engine Components, Faults and their Acoustic Emission Signal Features
Chapter 3 begins by providing an overview regarding the propagation of AE waves
within engines. Chapter 3 continues by reviewing and briefly detailing the various
steps needed for the interpretation of engine related acoustic emission signals.
Subsequent sections of Chapter 3 then highlight the operation of combustion related
components as sources of AE by presenting an overview in which the individual
combustion related component groups – namely fuel injectors, inlet and exhaust
valves, and the piston/cylinder wall interface – are described in terms of function
and underlying fault mechanisms and are also reviewed as sources of AE activity.
The final part of Chapter 3 then presents an overview regarding abnormal
combustion and the ability of the combustion process itself to generate AE activity.

Characterisation of Combustion Related Acoustic Emission Sources for Diesel Engine Condition Monitoring
38
3.1 Propagation of Acoustic Emission in Diesel Engines
As was detailed in Chapter 2 acoustic emissions are produced by physical phenomena
such as friction, impacts, crack propagation, component deformation and fluid flows,
all of which are associated with normal engine operation. These AE generating
phenomena result in the propagation of AE waves that radiate from the source in all
directions as compression, shear and Lamb waves which combine and propagate on
the surface of the material as Rayleigh surface waves [21, 105]. As an AE wave
propagates from its source, the amplitude associated with the wave decreases as the
distance traveled increases. This AE wave attenuation has been attributed to four
mechanisms [91]; geometric spreading of the wave-front, internal friction, attenuation
from scattering and diffraction, and attenuation from wave dispersion.
The attenuation attributed to the geometric spreading of the AE wave-front occurs as
the fixed energy of the AE wave is distributed over the expanding wave-front
geometry. Assuming the law of conservation of energy holds true and the energy
associated with the wave remains constant it has been shown that the wave amplitude
will decrease inversely with distance in three-dimensional solids and inversely as the
square root of the distance in two-dimensional structures [91]. Attenuation attributed
to the geometric spreading of the AE wave-front has been described as being
dominant close to the AE wave source [21].
The attenuation due to internal friction occurs as a consequence of the mechanical AE
wave energy being converted into thermal energy due to particle motion within the
material [91]. This internal friction attenuation results in the AE wave amplitude being
attenuated exponentially with distance and becomes the dominant attenuation
mechanism at greater distances from the source [21]. Attenuation from scattering and
diffraction results when AE waves propagate through structures that have intricate or
complex geometries and contain features such as slots, holes and internal cavities [21,
91]. Scattering and diffraction effects result in a decrease in wave amplitude with
distance although localised constructive or destructive interference effects can exist
[21, 91]. The attenuation due to wave dispersion occurs when the different frequency
components of the wave propagate through material at different velocities thus even if
the wave energy remains constant, there is a reduction in amplitude [91].

Chapter 3: Combustion Related Diesel Engine Components, Faults and their Acoustic Emission Signal Features
39
AE that originates in, and propagates through engines is typically very complex as
engines are composed of numerous individual components each of which may feature
intricate or complex geometries containing a multitude of features such as slots, holes,
discontinuities and liquid filled internal cavities. These features result in AE wave
propagation that is affected by reflection, refraction, mode conversion and attenuation,
all of which combine to distort propagating AE as it travels from its sources to the AE
sensors positioned on the external surface of the engine.
In addition, engine operation typically generates numerous, sometimes overlapping
sources of AE. These include impacts occurring from exhaust and inlet valve
operation; piston slap; the impacts occurring as a consequence of injector and fuel
system operation; the friction between the piston, piston rings and the cylinder wall;
shock loading from combustion; the fluid flows associated with both the gas exchange
processes and high velocity fuel flow through injector nozzles; and the operation of
numerous ancillary components attached to the structure of the engine. As a result, AE
signals from engines can be categorised and described as a representation of the
original source excitation which still contains significant information of interest
regarding different sources of AE activity [21].
The complex mix of overlapping AE sources, and the distorted propagating AE waves
in engine related AE signals typically results in signals that are a combination of both
burst, and continuous AE. This mix of burst and continuous AE as occurs in engine
related signals is highlighted by Figure 3.1. As seen, Figure 3.1 (a) shows a mixed AE
signal resulting from the combination of discrete and continuous AE while Figure 3.1
(b) shows a small portion of a mixed AE signal showing numerous burst and
continuous AE events recorded from an engine.
3.2 Interpreting Engine Related Acoustic Emission Signals
The AE signals recorded from Diesel engines are typically classified as time-series
data that is highly non-stationary [21, 79] with the non-stationary nature of the
recorded AE signals being due to the combination of variations in rotational engine
speed, and the crankshaft torque variations that result from the individual torque
contributions of each engine cylinder. A typical example of “raw” AE time-series
data is shown in Figure 3.2. As can be seen the AE signal has been acquired with a

Characterisation of Combustion Related Acoustic Emission Sources for Diesel Engine Condition Monitoring
40
synchronously recorded TDC reference signal which in this case indicates the points
at which the piston in cylinder 1 reaches the top of its stroke.
(a) (b)
Figure 3.1: Burst, continuous and mixed AE signals (a); and (b) AE recorded
from an engine [21]
Figure 3.2: Plot showing AE time-series data with a synchronously recorded
TDC reference signal recorded using a 1 MHz sampling rate
The zoomed window in Figure 3.2 highlights a portion of the recorded signals that
corresponds to one individual complete engine cycle. As shown, the TDC pulse
labeled TDC 1 denotes the commencement of the engine cycle which in this instance
is defined as the commencement of the intake stroke. As the signals shown in Figure

Chapter 3: Combustion Related Diesel Engine Components, Faults and their Acoustic Emission Signal Features
41
3.2 were recorded from a four-stroke engine, the four parts of the engine cycle
require two complete revolutions of the crankshaft to complete. Therefore, as shown
in Figure 3.2, the intake and compression strokes occur during the first rotation of the
crank-shaft between the TDC pulses labeled TDC1 and TDC 2 whilst the power and
exhaust strokes occur during the second crank-shaft rotation between the TDC pulses
labeled TDC 2 and TDC 3.
Other signals such as cylinder pressure and crank-angle encoder signals are also
often recorded with AE signals for comparison or reference purposes. Whilst TDC
signals are used to provide an indication of when a reference piston reaches the top
of its stroke, encoder signals are acquired to provide an angular measure of the
rotational position of the crankshaft. Cylinder pressure signals can also be recorded
in conjunction with AE signals during experimental investigations as they are often
useful as combustion indicators and for the interpretation and identification of other
engine cycle features [79]. Reference signals such as TDC, encoder and pressure
signals are widely used to interpret and further process the measured AE signals.
Interpretation of AE signals typically includes the truncation of AE signals in terms
of individual engine cycles in order to present the AE signals in terms of crank-angle.
This signal processing step allows AE signals to be analysed with regards to the
events that are known to occur at fixed points within the engine cycle.
A data processing step whereby encoder signals are used to re-sample recorded time-
series AE data in terms of crank-angle has been previously detailed [21, 79, 87].
Essentially, the technique documented used those signal values that corresponded to
individual encoder pulses to produce AE signals that had the same number of data
points in each engine cycle regardless of the operational settings of the engine. Fog
[79] mentions that this signal processing approach results in signals which are
stationary, however as Pontoppidan [87] points out, this is only applicable when the
management system of the engine does not automatically adjust the timing of events
such as fuel injection or valve actuation. In order to reduce data size and enable AE
data to be recorded using lower sampling rates, AE signals are often converted into
AE RMS signals before being digitised and recorded. The resultant AE RMS or AE
energy (AEE) signals, as they are sometimes called, preserve signal energy however,
much of the time and frequency information is lost [85].

Characterisation of Combustion Related Acoustic Emission Sources for Diesel Engine Condition Monitoring
42
Once presented in terms of crank-angle, a priori knowledge concerning the timing of
events associated with engine operation can be included by way of the previously
mentioned timing maps. The data incorporated in this way most often includes the
timing of the opening and closing of the inlet and exhaust valves and the operation of
the fuel injectors. As an example, Figure 3.3 from Fog et al. [80] shows AE RMS
recorded from a large two-stroke marine Diesel engine plotted with respect to crank-
angle. As seen, the crank-angle timing values for the opening (XVO) and closing
(XVC) of the exhaust valve and the start (IJS) and end (IJE) of fuel injection have
also been included.
Figure 3.3: Plot of AE RMS from a large marine Diesel engine incorporating timing
values for fuel injection and valve operation [80]
AE signals from a wide variety of Diesel engines have been presented by numerous
researchers. The engines featured in these studies have operated using both two-stroke,
and four-stroke cycles and have ranged in displacement from a few litres, up to many
thousands of litres. Perhaps not surprisingly, it has been widely acknowledged that
various features and characteristics of recorded AE signals can vary substantially due
to the size and design of the engine from which the AE signals were recorded.

Chapter 3: Combustion Related Diesel Engine Components, Faults and their Acoustic Emission Signal Features
43
For example, uunlike the individual, easily distinguished features seen in Figure 3.3,
Gill et al. [78, 139] point out that AE signals recorded from four-cylinder high speed
Diesel engines show “four distinct series of events” that were identified as
corresponding to the injection and combustion processes and mechanical events
occurring in each of the four cylinders. It is worth noting that this ccomparison
between AE from a large two-stroke and small high-speed four-stroke engines
emphasises the previously mentioned event separation challenge detailed by Sikorska
and Mba [105].
3.3 Combustion Related Sources of Acoustic Emission Activity
Diesel engine problems such as, overheating, misfiring, loss of power, low oil
pressure, excessive wear, changes in exhaust emissions and abnormal vibration or
noise, can be regarded as the observable symptoms that may result from a large
range of underlying faults. This is due to the close interaction and interdependency
of the components and sub-systems that together form an engine and the often
complex root cause to observable problem progression. This complex relationship
between observed engine symptoms and the range of possible underlying faults has
been widely recognised by authors such as Jones and Li [137] and Abbey [138].
With respect to combustion in Diesel engines, it is possible to identify and attribute
many underlying combustion related faults to the three main groups of combustion
related components. These are; the fuel injectors; the inlet and exhaust valves and
valve-train; and the piston-cylinder interface. In addition to these combustion related
component groups, another category of underlying combustion related faults can
also be attributed to abnormal combustion. The following sections describe
combustion related faults that originate as a consequence of both component related
and combustion process mechanisms. In addition, the following sections also
summarise the previously documented AE signal features associated with the
specific classes of combustion related fault.
3.3.1 Fuel Injector Operation Related Acoustic Emission Activity
Although many different Diesel engine fuel injector designs exist, these various
injector designs all utilise nozzles which can be classified as being of a pintle or
hole-type design. Pintle-type injector nozzles are commonly used in Diesel engines

Characterisation of Combustion Related Acoustic Emission Sources for Diesel Engine Condition Monitoring
44
having indirect injection (IDI) combustion chamber designs whilst hole-type nozzles
are used in engines having DI combustion chamber designs. Typical designs for both
pintle and hole-type nozzles are shown schematically in Figure 3.4(a) and (b)
respectively.
Figure 3.4: Sketches showing basic Diesel fuel injector nozzle designs for (a) a
pintle-type nozzle and (b) a hole-type nozzle
Pintle injector nozzles all have the same basic design [140] and, as can be seen in
Figure 3.4(a), during injector operation, fuel flowing via the inlet port into the
pressure chamber acts upon the pressure shoulder and forces the needle off the seat
thereby allowing fuel to flow out through the nozzle orifice and over the pintle, the
function of which is to form the fuel spray into a cone shape [141]. Instead of a
single orifice, hole-type nozzles employ a number of holes in the nozzle tip to
produce multiple fuel sprays within the combustion chamber.
Hole-type nozzle needles are actuated in a similar fashion to the pintle-type nozzle
needles however hole-type nozzles used in common-rail systems differ as they are
actuated electronically through the use of solenoid or piezoelectric actuators. Hole-
type nozzle needles operated in this fashion are referred to as being lift-controlled
[142] whilst nozzles actuated by the pressure within the pressure chamber are
commonly referred to as being pressure-controlled. The use of common-rail fuel

Chapter 3: Combustion Related Diesel Engine Components, Faults and their Acoustic Emission Signal Features
45
systems and lift-controlled injector nozzles has been widely adopted due to the high
level of control given by these systems over the injection process.
Owing to the wide range of different injection systems, attempting to list specific
injector faults would be impractical. It is possible however, to provide a general
description of injector related faults based upon the standardised tests used to evaluate
injector function. According to standardised pintle injector test procedure [143], pintle-
type fuel injectors are considered functional if three specific test criteria are met. These
criteria are; amount of fuel leakage and drip; injector cracking (opening) pressure; and
the spray pattern of the ensuing spray. With respect to testing hole-type nozzles and
modern injection systems, Egler et al. [144] list flow measurement, injected fuel
quantity measurement and the measurement of the injection characteristics as the chief
parameters of interest. Failure to meet required test criteria is typically caused by
damaged and worn nozzle components, broken or fatigued springs [138], build-up of
deposits on internal injector components due to fuel additives [145], formation of
nozzle hole and tip deposits [146] and erosion damage occurring near nozzle orifices
[147].
In an early investigation that sought to use AE signals to investigate injector faults in
a small HSDI Diesel engine, Gill et al. [139] examined the effects that three different
injector discharge pressures had on raw AE signals. The increase in AE activity seen
to commence just prior to TDC was believed to be caused by the build-up of pressure
in the high pressure fuel lines. Gill et al. [139] pointed out that the earlier initial rise
in AE is due to the advancement in fuel injection timing from the reduction in fuel
injection pressure. Gill et al. [139] also believed that the reduced fuel injection
pressure condition produced an extended lower amplitude response. This response
was thought to be a result of less efficient air-fuel mixing and subsequently more
erratic and longer combustion.
A subsequent investigation by Frances et al. [84] also sought to investigate injector
faults in a small, four cylinder, HSDI Diesel engine using AE signals. The recorded
AE signals were converted into the crank-angle domain using simultaneously
recorded encoder signals and windowed around the combustion event. This window
was used to both, calculate signal energy and, perform a time-frequency analysis

Characterisation of Combustion Related Acoustic Emission Sources for Diesel Engine Condition Monitoring
46
using a continuous wavelet transform (CWT) technique. Frances et al. [84] found
that under normal running conditions, combustion occurred with a number of
ignition points. It was found that this made the task of accurately identifying ignition
difficult as there were “a number of smaller combustion events or combustion
pulses” all generating wideband AE. With reduced injector discharge pressure
however, it was found that the start of ignition was increasingly easy to identify. This
was identified by Frances et al. [84] as being due to the injection of fuel before ideal
temperatures and pressures have been reached in the combustion chamber. These
factors were described by Frances et al. [84] as leading to greater amounts of fuel
igniting spontaneously and, in turn, generating large principal combustion pulse.
Frances et al. [84] further report that this was exacerbated at higher engine speeds
“as there is less time available for ideal combustion conditions to be met”.
A more recent investigation by Elamin et al. [98] also investigated Diesel engine
injector faults and AE in a small, four cylinder, HSDI Diesel engine. Based upon
observational interpretations of crank-angle domain plots it was reported that
frequency analysis, using the fast Fourier transform (FFT), gave an indication of the
faulty operating condition of the engine but did not provide any information
regarding the location or type of fault. A joint angle-frequency domain analysis was
also presented based upon the application of the CWT using a Morlet wavelet.
Elamin et al. [98] identified events just prior and after TDC (approximately 355˚ and
365˚) as being related to injector operation and combustion respectively. These
findings appear consistent with the findings by Gill et al. [139] however it seems that
some ambiguity remains between the needle opening, high pressure fuel line and
combustion pulse mechanisms proposed by Elamin et al. [98], Gill et al. [139] and
Frances et al. [84] respectively.
The characteristics of AE arising from the injection process in large two-stroke
Diesel engines used for power generation was also investigated as part of a broader
study by Douglas [21]. Using the functional characteristics of the fuel injector, it was
possible for Douglas [21], to determine the exact causes for the series of AE events
recorded during the injection period. Figure 3.5, from Douglas [21] shows AE RMS
and fuel line pressure along with AE events of interest labeled A to D.

Chapter 3: Combustion Related Diesel Engine Components, Faults and their Acoustic Emission Signal Features
47
Figure 3.5: AE RMS and fuel line pressure with the fuel injection related AE
events of interest labeled A to D [21]
Douglas [21] recognises rising fuel line pressure and the impact of internal injector
components as the source of the AE event labeled A and B in Figure 3.5. Douglas
[21] notes that as event B is generally broader than other impact events, it is possible
that added AE activity due to the initial rush of fuel through the nozzle and the
subsequent rapid combustion could contribute to event B. AE event C is described as
being caused by the re-seating of the valve spindle at the end of fuel injection. The
AE activity between B and C in Figure 3.5 is identified by Douglas [21] as being
continuous with amplitude higher than the background level and is attributed to the
continuous injection of fuel into the combustion chamber and/or the combustion of
fuel. AE event D, recognised as being highly variable, was thought to be due to
either fluid disturbances, pressure waves in the fuel lines or residual pressure in the
injector itself however it was noted by Douglas [21] that the explanations regarding
event D are tenuous and that further investigation is needed.
3.3.2 Engine Valve and Valve-Train Related Acoustic Emission Activity
Engine valve fault flowcharts presented in early works by Hannum [148] and, Kelly
and Musil [149] highlight the complex interaction of factors that can eventually lead
to engine valve failure. It is evident that interactions between the initiating or root
problems, subsequent failure modes, and the final valve failure cause can be
complex. In fact Johnson and Galen [150] point out that it is often extremely
difficult to determine the specific initiator, or root cause for a given valve failure. In
tabulating valve failure modes and associated possible causes, Wang [151] shows

Characterisation of Combustion Related Acoustic Emission Sources for Diesel Engine Condition Monitoring
48
that although many possible root causes of valve failure exist, these causes result in
four main failure modes namely; wear; fracture; burning; and corrosion, that act in
combination with each other. The wear mode includes adhesive, abrasive and
corrosive wear mechanisms. These occur in contact areas such as the valve tip and
stem, the keeper grooves and the valve seat. Wear modes at the valve seat can also
include deformation (shear strain or radial flow) and contact fatigue wear modes
[151, 152]. The valve head-seat impact wear mechanism has been associated with
the formation of a series of circumferential ridges and valleys [153, 154].
The valve fracture mode includes both fatigue and impact fracture mechanisms with
the stem -fillet transition, stem and keeper groove regions all being prone to fracture
[151]. Valve stem breakage can occur as a consequence of both fatigue and impact
fracture mechanisms. Valve head cracks can develop in both radial and
circumferential directions. Radial cracks are considered to be a thermal fatigue
phenomenon and are generated from the valve seat or hard-facing bond [151]. These
cracks often propagate into the fillet region where it becomes a circumferential
crack. This leads to chordal fractures [151]. Radial cracks can also become a leakage
path for exhaust gases in which case they eventually lead to valve burn. Likely
causes or contributing factors of valve fracture include engine over-speeding, and
excessive valve impact velocity from incorrectly adjusted valve lash.
Elamin et al. [99] investigated the effect of incorrectly set valve lash. In this work
two separate valve fault conditions were induced by increasing the valve lash
clearance by 0.5 mm and 0.8 mm respectively. Using observations based on raw
time-series data, Elamin et al. [99] reported that no significant change was observed
for the 0.5 mm lash clearance increase whilst the 0.8mm lash clearance increase was
reported as producing AE signals having decreased amplitudes. It was thought by
Elamin et al. [99] that the decrease in signal amplitude resulted from reduced engine
efficiency due to the later valve opening and earlier valve closing times associated
with the increased lash clearance. However no attempt was made to quantify the
likely effect of these valve lash settings in terms of other underlying valve lash
related AE producing mechanisms.

Chapter 3: Combustion Related Diesel Engine Components, Faults and their Acoustic Emission Signal Features
49
The previously mentioned burning mode refers to the damage caused to the valve by
hot exhaust gases. Valve burn is the term widely used to broadly describe this type
of valve seat damage although other terms such as guttering, channeling and
torching are also often used. It should be noted that although these terms are often
used interchangeably, they have also been defined to describe specific valve burn
mechanisms. For example, Arnold et al. [155] classify the term valve burn as a
generic term that describes the more specific mechanisms of guttering and torching.
Arnold et al. [155] go on to define guttering as a corrosion phenomenon that occurs
across the valve seat face whereas torching is defined as the rapid melting of valve
material due to the hot exhaust gas flow.
Nicholls [156] succinctly describes a typical valve burn failure as including a number
of steps which can occur either sequentially, or in combination. These steps are;
formation of deposits on the valve seat; compaction of deposits by valve impacts;
cracking and flaking of deposits; the formation of low melting point salts and hard
particles leading to seat corrosion and hard particle beat-in. Gas channels eventually
form across the valve seat leading to eventual engine failure. Figure 3.6 shows two
examples of valve burn. As guttering can be distinguished by a “cobble stone”
appearance [152, 156], it is therefore possible to more specifically classify the valves
shown in Figure 3.6 as having failed due to guttering.
Figure 3.6: An example of valve burn [150]
Even though the studies by Fog and co-workers [79, 80, 81] focused on the
automatic detection and classification of faults, they nevertheless identified and
described AE signal features related to both normal and leaking exhaust valve

Characterisation of Combustion Related Acoustic Emission Sources for Diesel Engine Condition Monitoring
50
operation in large two-stroke marine Diesel engines. Referring to Figure 3.7
reproduced from Fog [79], it can be seen that the portion of the AE signal relating to
valve opening and closing consists of burst-type AE having relatively high amplitude
whilst the valve leak related feature was categorised by Fog et al. [80], as a “very
visible broadband event in the AE RMS signal” that occurs during the compression
and expansion parts of the engine cycle. The valve leak related feature was further
described by Fog et al. [80], as “leak noise” that is “superimposed on the normal
ignition signature” having energy levels that are associated with the leak size.
Figure 3.7: Identification of AE RMS signal features associated with the
operation of a large two-stroke marine Diesel engine [79]
Other corrosion related valve failure modes typically affect the valve face or fillet
regions as these surfaces are exposed to the heat and corrosive constituents of
combustion. In addition, when corrosive compounds exist in the lubricating oil,
corrosion can also occur in the stem/guide contact [151]. Corrosion also often occurs
as a result of component wear, leakage, poor valve materials selection or
manufacturing techniques, poor fuels and deposit build-up and poor valve-train
dynamics [151].

Chapter 3: Combustion Related Diesel Engine Components, Faults and their Acoustic Emission Signal Features
51
Although the specific root causes or initiating factors of valve faults can be difficult
to identify, they often cause a change in engine operating characteristics which can
in turn trigger the eventual valve failure modes. These operational characteristics
include; high combustion or valve temperatures or temperature gradients; poor
valve-train dynamics and high valve seating velocities; abnormal component stress
levels; and erosion or corrosion of the seating surfaces [151]. Of these, three causes
in particular have been considered particularly noteworthy in terms of detrimental
effects, these are; excessive temperature peaks or gradients, misaligned valve seating
and perhaps most critically, high seating velocities [149].
3.3.3 Piston-Cylinder Interface Related Acoustic Emission Activity
The piston-cylinder interface (PCI) includes those components that enable the
relative movement between the piston and cylinder. These components are; the
piston itself, the piston rings, and the cylinder wall surface. The compression rings
need to effectively seal the combustion chamber whilst oil rings prevent the flow of
excess lubricant into the combustion region. The PCI is also required to have low
friction in order to minimise frictional power losses and wear and have good
resistance against hot erosion, chemical attack and mechano-thermal fatigue under
highly transient lubrication conditions [157]. Figure 3.8 shows an exploded view of
a piston and associated rings from a small Diesel engine. As seen, like most modern
Diesel engines with swept volumes less than three litres per cylinder, this particular
design utilises two compression rings and one oil control ring [158].
The PCI has been identified as one of the critical component contacts, the wear of
which is a major factor in determining engine life [158, 159]. Wear in the PCI
occurs on the contacting faces of the cylinder bore, piston rings and piston skirt. The
majority of cylinder bore wear occurs at the top, ring reversal zone [158, 160] where
the piston rings are subjected to the highest combustion pressures and temperatures
and where ring-bore lubrication can include elasto-hydrodynamic, mixed and
boundary lubrication regimes [161]. Wear occurring in the PCI leads to worn
cylinder bores, piston skirts, rings, polished bores and consequently, the general
condition known as blow-by whereby excessive leakage of gas occurs past the piston
rings and excessive piston slap.

Characterisation of Combustion Related Acoustic Emission Sources for Diesel Engine Condition Monitoring
52
Figure 3.8: A piston-ring assembly [143]
Fog [79] lists PCI wear and the accumulation of deposits as being the main causes of
blow-by with this condition being typically associated with reduced compression,
loss of performance and hot gas erosion of pistons, rings and cylinder bore. Piston
slap occurs when the piston undergoes transverse motion within the piston-cylinder
bore clearance causing it to impact on the cylinder wall and whilst this phenomenon
is a normal consequence of crank-piston dynamics, increased piston-bore clearances
lead to excessive piston slap.
The mechanical impacts generated by piston slap are widely acknowledged as being
a major source of noise in Diesel engines, and indeed this has been one of the major
motivating factors that have driven research into both the mechanics of piston slap,
and the methods by which the vibration and noise generated by piston slap may be
reduced. Earlier examples of this research include studies by Fielding and Skorecki
[53] and Haddad and Pullen [162] with more recent studies by Haddad and Tjan

Chapter 3: Combustion Related Diesel Engine Components, Faults and their Acoustic Emission Signal Features
53
[164], Okubo et al. [165] and Nakashima et al. [166]. All of these studies highlight
the strong influence that the piston-cylinder bore clearance has on the severity of the
resulting piston slap whilst studies [164 – 167] have also shown that gudgeon pin
eccentricity has a major influence on the overall severity and nature of the piston
slap. In addition to unwanted noise and accelerated wear, excessive piston slap has
been identified as being a major cause of cavitation erosion damage of both Diesel
engine cylinder liners and cylinder blocks [168-170].
The potential use of AE measurements in monitoring both blow-by and piston slap
has also been recognised. Fog [79] highlights the possible use of AE in a “cylinder
condition” monitoring role and suggests that “AE would prove useful for
(monitoring) excessive wear, micro-seizure and blow-by”. This suggestion was
presumably based on the previously recognised AE generating ability of mechanical
and fluid-mechanical events. Douglas and co-workers [21, 101] indeed went on to
show that the ring-bore interface was an important source of AE activity. Initial
investigations featuring AE signals recorded from a small motored HSDI Diesel
engine with the cylinder head removed showed that the piston ring-bore interface
related AE occurred as four pulses that had a continuous nature. The ring-bore
interface related AE recorded from two different AE sensors on the motored engine
is shown in Figure 3.9.
Figure 3.9: Plot showing AE signals in terms of crank-angle from two
separate sensor positions on the motored engine [101]

Characterisation of Combustion Related Acoustic Emission Sources for Diesel Engine Condition Monitoring
54
The difference in signal amplitudes seen from the two sensor positions in Figure 3.9
was noted by Douglas and co-workers [21, 101] as being due to differing AE
transmission paths whilst the four pulses of ring-bore interface related AE were
characterised as being proportional to the piston speed. In further tests detailed by
Douglas [21], similar analyses using AE signals recorded from a different motored
engine showed similar results regarding the mid-stroke AE activity however, as
shown in Figure 3.10 relatively large burst-type AE events were seen to occur at the
TDC and BDC positions. These burst-type events were identified by Douglas [21] as
being due to piston slap. Douglas [21] also noted that similar burst-type AE events
were also seen in recorded AE signals from other motored engine tests however,
these were of far lower amplitude. The relative differences in amplitudes were
considered by Douglas [21] to be indicative of increased piston-cylinder interface
clearances.
Figure 3.10: Plot showing raw AE with burst-type events at TDC and BDC [21]
Douglas and co-workers [21, 101] also sought to establish whether the ring-bore
interface AE identified during the motored engine tests was evident under normal
engine running conditions. The results reported indicate that the continuous ring-bore
interface AE was indeed recorded at the piston mid-stroke positions under normal
engine running conditions. Douglas et al. [101] considered it unlikely that asperity
contact between the compression rings and cylinder wall was the source of the
continuous mid-stroke AE owing to the elasto-hydrodynamic lubrication regime
present during mid-stroke piston travel. Instead, Douglas et al. [101] identify the

Chapter 3: Combustion Related Diesel Engine Components, Faults and their Acoustic Emission Signal Features
55
most likely source of mid-stroke AE as being the asperity contact between the oil
control ring and the cylinder wall due to the boundary lubrication regime associated
with oil control ring operation.
Douglas and co-workers [21, 101] also attempted to characterise piston ring-cylinder
wall interface related AE in large two-stroke Diesel engines and found that
continuous ring pack-cylinder wall interface AE was also generated. In the case of
large two-stroke Diesel engines Douglas [21] reported that very little continuous
piston ring-cylinder wall interface related AE was observed in the mid-stroke
regions. Instead, the continuous AE was observed around the TDC position. It was
thought that the absence of mid-stroke AE activity was due to the absence of oil
control rings in the ring-packs of these particular types of engines. It was also
thought that possible sources for the continuous AE activity in this case were asperity
contact and/or blow-by.
Other authors have also identified piston-cylinder interface related phenomena as
possible sources of AE. As recent examples, Elamin et al. [98] and Steel and Reuben
[16] both mention piston slap as being a possible AE source however few authors
have specifically characterised or analysed blow-by or piston slap related features in
recorded AE signals. In fact in the majority of studies, piston slap and blow-by
appear to contribute very little to recorded AE signals. It is likely that this situation
stems from the wear related nature of both blow-by and piston slap, and the
variability represented in the literature is caused by factors related to engine type and
age (wear state) and associated piston-bore clearance, variations in engine design
(such as gudgeon pin offset), and the engine specific source-to-sensor AE
transmission characteristics.
3.3.4 Diesel Engine Combustion Related Acoustic Emission Activity
AE based monitoring methods have also been investigated and applied in a
combustion monitoring context. In this context AE measurements are used to
monitor the combustion process itself with the aim of detecting abnormal combustion
conditions. These abnormal conditions include; the total lack of combustion
(misfire), reduced combustion (soft-fire) and unbalanced combustion contributions in
multi-cylinder engines. Owing to the sensitivity of the combustion process to both

Characterisation of Combustion Related Acoustic Emission Sources for Diesel Engine Condition Monitoring
56
internal and external parameters, misfire, soft-fire and unbalanced combustion in
multi-cylinder engines can result from a plethora of underlying problems which
would be impractical to list.
The detection of misfire in small four cylinder Diesel engines was successfully
demonstrated using plots of time series data as part of the early study undertaken by
Gill et al. [78]. In this preliminary investigation, misfire was induced by
disconnecting one of the injector fuel lines. Gill et al. [78] reported that the
combustion related portion of the AE signal for a particular cylinder completely
disappeared under misfire conditions. Fog [79] also undertook similar tests using a
large, two-stroke marine Diesel engine and reported that “the most apparent
difference is seen at the start of the combustion process, where during misfire there is
an absence of the two AE bursts (between injection start and exhaust valve opening)
which appears during normal running”. Fog [79] interprets these two AE bursts as
being related to the start and end of fuel injection. In addition to misfire, the
detection and the AE signal features associated with the rather ambiguous soft-fire
combustion condition have also been extensively demonstrated in investigations
regarding injector related faults such as those detailed in Section 3.2. As was
detailed, whilst there was some disagreement in the literature regarding the exact
source or level of contribution of AE; researchers generally acknowledged
contributions from both mechanical and fluid-mechanical injection related events and
combustion related processes.
Unlike the somewhat ambiguous cases of misfire, soft-fire and unbalanced
combustion conditions, another common abnormal combustion condition
encountered in Diesel engines occurs as a specific phenomenon associated with the
high pressure rise rates that are produced during the premixed combustion stage.
These high pressure rise rates are responsible for the characteristic “knocking” noise
often referred to as Diesel knock [141] that is widely associated with Diesel engines.
Whilst premixed combustion is a normal part of Diesel engine operation, various
circumstances can lead to excess quantities of fuel combusting in a premixed fashion
and when excessive this phenomenon can, in a similar manner to SI knock, be
extremely detrimental to engine life [171, 172]. The high pressure rise rates
associated with excess Diesel knock result in the propagation of high amplitude

Chapter 3: Combustion Related Diesel Engine Components, Faults and their Acoustic Emission Signal Features
57
pressure waves at frequencies governed by combustion chamber resonance. The
effect of these high amplitude pressure waves upon a typical SI cylinder pressure
trace is shown in Figure 3.11. As Figure 3.11 shows, the high frequency pressure
fluctuations are evident in the pressure trace. It is also seen that the amplitude of the
high frequency pressure fluctuations increases as the severity of the knock increases
[173].
Figure 3.11: Cylinder pressure verses crank-angle plots for (a) normal spark-ignition
combustion (b) light knock and (c) intense knock [173]
Many researchers have investigated and described the specific mechanisms
responsible for knock and knock damage. For example, Nates and co-workers [174 -
177] have described how knock in SI engines leads to a local pressure-temperature
pulse mechanism as well as a gross thermal damage mechanism. These mechanisms
lead to the two main damage pathways namely, increased heat flux and erosion. The
erosion damage pathway leads to the erosion of the crown and top land areas of the
piston, the cylinder head and the head gasket whilst the heat flux damage pathway
leads to jammed rings, piston land fracture, piston seizure and a different ring
fracture mode. Although the study by Nates and co-workers [174 -177] pertained to
SI knock, Diesel knock has also been specifically recognised as detrimental to engine
life [79, 138] as well as a considerable problem associated with the use of alternative
fuels in dual-fuel Diesel engines [178-180].
In identifying a “combustion pulse” AE generating mechanism, Frances et al. [84]
and Douglas [21] highlighted premixed combustion as a potential source of AE

Characterisation of Combustion Related Acoustic Emission Sources for Diesel Engine Condition Monitoring
58
however El-Ghamry and co-workers [90, 181] are the only researchers to have
specifically identified AE features in terms of engine knock phenomena. In research
pertaining to SI engines El-Ghamry and co-workers [90, 181] recorded AE data from
an engine operating with fuel to air ratios likely to induce both occasional misfire
and SI knock. It was reported that both rich and lean running conditions could be
detected using recorded AE RMS signals. In addition, El-Ghamry et al. [181] also
highlighted the effect of SI knock upon raw SI AE signals, El-Ghamry et al. [181]
suggest that the multiple bursts of AE seen in the knock related portion of the plotted
signals are the result of reflections of the knock related pressure wave.
3.5 Chapter Summary
Chapter 3 began by providing an overview of AE wave propagation within engines.
This section highlighted engine related AE signals as typically consisting of a
combination of both burst and continuous AE that originates as a complex mix of
overlapping AE sources and distorted propagating AE waves. Chapter 3 continued
by reviewing and detailing the various steps needed for the interpretation of engine
related acoustic emission signals and how AE signals have been processed in order
to include a priori information concerning the timing of events associated with
engine operation. The subsequent sections of Chapter 3 then provided overviews in
which fuel injector operation, the inlet and exhaust valves, and the piston/cylinder
wall interface were described in terms of function and underlying fault mechanisms
and also reviewed as sources of AE activity.
The injector related sources of AE activity were discussed in Section 3.3.1 whereby
the common use of two main types of fuel injector nozzle was highlighted. These
two main types of fuel injector nozzle were identified as pintle and hole-type
nozzles. Subsequent paragraphs pointed out that injector related AE activity has
previously been recognised as being caused by mechanisms related to the build-up of
pressure in the high pressure fuel lines, fuel flow through injector nozzles, injector
needle related opening and closing impacts, less efficient air-fuel mixing and large
combustion pulses. The close association between fuel injector operation and
combustion was also highlighted along with the ambiguity that remains with regards
to the previously identified AE generating mechanisms.

Chapter 3: Combustion Related Diesel Engine Components, Faults and their Acoustic Emission Signal Features
59
Valve related sources of AE activity were then discussed in Section 3.3.2 along with
the main failure modes. Within Section 3.3.2 it was pointed out that although the
interactions between the initiating or root causes, subsequent failure modes and the
final valve fault could be complex, excessively forceful valve impacts from
incorrectly adjusted valve lash and poor valve-train dynamics were commonly
associated with eventual valve failure. Valve related sources of AE activity were
also reviewed with valve impacts and leakage being highlighted as previously
recognised valve related AE sources. It was also highlighted that no previous
attempt has been made in quantifying valve lash settings in terms of the valve impact
related AE producing mechanisms.
In Section 3.3.3, the functional role of the PCI was discussed and a number of
previous studies were highlighted in which the PCI was outlined as providing a
number of specific combustion related sources of AE. These previously recognised
AE sources were friction between the piston rings and the cylinder wall, blow-by
and piston slap. Section 3.3.3 also highlighted that whilst piston slap is often
mentioned as a source of AE in Diesel engines, few attempts have been made to
identify and categorise AE activity arising specifically from piston slap or indeed
blow-by. It was further pointed out that in the majority of studies, piston slap
contributed very little to documented AE signals and that this was due to the close
association between piston-bore clearance and the severity of the piston slap AE
generating impacts.
Chapter 3 closes with Section 3.3.4 within which is given an overview regarding AE
activity that originates from the combustion process itself. Section 3.3.4 highlighted
the previous use of AE based misfire, soft-fire and unbalanced combustion detection
however it was pointed out that these fault classifications are somewhat ambiguous.
Section 3.3.4 also described the occurrence of Diesel knock as a specific
phenomenon associated with high pressure rise rates produced during premixed
combustion whilst previous studies discussed within Section 3.3.4 identified
premixed combustion in Diesel engines and knock in spark ignition engines as
potential AE sources. However Section 3.3.4 also demonstrated that the
investigation of Diesel knock as an AE source had not been previously undertaken.

Characterisation of Combustion Related Acoustic Emission Sources for Diesel Engine Condition Monitoring
60
In summary, within Chapter 3 it was shown that whilst operation of the combustion
related engine component groups has been shown to generate AE few attempts have
been made to characterise recorded AE signals with regards to component function
or underlying fault modes. Furthermore, it appears that no attempts have yet been
made to investigate and characterise the phenomenon of Diesel knock as a source of
AE activity.

Chapter 4: Experimental Approach and Methodology
61
Chapter 4 Experimental Approach and Methodology
The opening portion of Chapter 4 begins by describing and listing the general
specifications associated with the two different Diesel test engines used to undertake
the four major test campaigns that together constitute the experimental phase of this
research. Initial sections of Chapter 4 go on to introduce the aims and conceptual
background associated with the four test campaigns. Subsequent sections of Chapter
4 then describe the sensors, sensor positions, data acquisition systems and sensor
setups used whilst undertaking the required tests. The closing sections of Chapter 4
then provide descriptions regarding the AE signal processing techniques used in
preparing signals for the analytical stages of the research featured in this thesis.

Characterisation of Combustion Related Acoustic Emission Sources for Diesel Engine Condition Monitoring
62
4.1 The Engine Research Facilities
The first engine test-bed used during the course of the research consisted of a
Cummins ISBe220 31 turbo-charged Diesel engine having a displacement of 5.9 litres.
This engine is coupled to a Froude water dynamometer and both engine and
dynamometer are controlled electronically by a Dynalog control system. The Cummins
engine has a DI combustion chamber design with an electronically controlled
common-rail fuel system. The Cummins engine, part of the Bio-fuels Engine Research
Facility at Queensland University of Technology, is shown in Figure 4.1.
Figure 4.1: The Cummins ISBe220 31 test engine
The second engine test-bed used consisted of a naturally aspirated 4 cylinder, 2.216
litre, Perkins 404C-22 Diesel engine coupled to an Olympian 415 Volt, three-phase
alternator. Load is applied to the Perkins engine by way of a three-phase industrial fan
heater using nominal load settings of 0 kW, 5 kW, 10 kW and 15 kW. The Perkins test
bed, also located at Queensland University of Technology, is shown in Figure 4.2
Figure 4.2: The Perkins 404C-22 test engine

Chapter 4: Experimental Approach and Methodology
63
The Perkins engine has an IDI combustion chamber design with a mechanically
operated fuel injection system. Additional Cummins and Perkins engine specifications
are listed in Tables 4.1 and 4.2 respectively.
Table 4.1: Cummins ISBe 220-31 engine data [182]
Engine Cycle Four Stroke, turbocharged
Engine Layout Inline, 6 cylinder
Advertised Power
Advertised Peak Torque
162 kW @ 2500 rpm
820 Nm@ 1500 rpm
Firing Sequence 1, 5, 3, 6, 2, 4
Bore 102 mm
Stroke 120 mm
Displacement 5.9 Litres
Compression Ratio 17.3:1
Injection Timing – Start Electronically Controlled
Exhaust valve timing – open 138˚ after combustion TDC
Exhaust valve timing – close 370˚ after combustion TDC
Inlet valve timing – open 347.5˚ after combustion TDC
Inlet valve timing – close 555˚ after combustion TDC
Combustion System DI
Table 4.2: Perkins 404C-22 engine specifications [143]
Engine Cycle Four Stroke, naturally aspirated
Engine Layout Inline, 4 cylinder
Advertised Power Standby: 18 kW, Prime:16.2 kW @ 1500 RPM (governed)
Firing Sequence 1, 3, 4, 2
Bore 84.0 mm
Stroke 100 mm
Displacement 2.216 Litres
Compression Ratio 23.3:1
Injection Timing – Start 15˚ before TDC
Exhaust valve timing - open 143˚ after combustion TDC
Exhaust valve timing – close 370˚ after combustion TDC
Inlet valve timing– open 354˚ after combustion TDC
Inlet valve timing - close 584 ˚ after combustion TDC
Combustion System Pre-combustion chamber IDI

Characterisation of Combustion Related Acoustic Emission Sources for Diesel Engine Condition Monitoring
64
4.2 Experiments
The experimental work undertaken consisted of four major series of tests, these tests
were:
(1) The injector nozzle fault tests
(2) The dual-fuel Diesel knock tests
(3) The valve-train dynamics tests
(4) The excess piston-slap tests
The objective of the injector nozzle fault tests was to investigate whether the two
main types of injector nozzles generate AE signal features specific to nozzle type.
The individual tests conducted involved the experimental inducement of both pintle
and hole-type nozzle faults based on commonly encountered injector nozzle failure
modes. During the hole-type nozzle fault test, nominally identical replacement
injector nozzles were damaged to various degrees and tested using standard testing
procedure in order to accurately benchmark the resulting level of nozzle damage.
The pintle-type nozzle fault tests were undertaken using a similar methodology
using two separate faulty injectors. The first of these faulty injectors had a severely
damaged pintle, whilst the second nozzle featured a pintle that had incorrect
geometry. The results of the injector fault test campaign are presented in Chapter 5
titled:
Acoustic emission signal features associated with the two main types of Diesel
engine fuel injector nozzles
The objective of the Diesel knock tests was to identify and characterise knock
related activity in dual-fuel Diesel engines as a source of AE activity. This particular
series of tests involved the inducement of three different engine running conditions
based on the rate of ethanol substitution. The ethanol was introduced into the engine
using the widely known fumigation technique whereby ethanol is introduced into the
air stream entering the engine. The three engine running conditions used were
chosen to represent three broadly applicable engine operating conditions. These
conditions were normal engine operation using straight Diesel fuel (0% ethanol);
engine operation using 30% ethanol representing acceptable dual-fuel engine

Chapter 4: Experimental Approach and Methodology
65
operation; and the 50% ethanol operating condition which represented engine
operation with unacceptable levels of dual-fuel Diesel knock. The results based upon
this test campaign are presented in Chapter 6 which is titled:
Detection of knock related acoustic emission from a dual-fuel Diesel engine
operating with Diesel fue, and ethanol
The objective of the valve-train dynamics tests was to characterise the AE activity
that arises as a consequence of changes in engine valve-train dynamics using a
dynamic valve-train model based specifically on the Perkins test engine. During the
course of the valve-train dynamics tests engine operation featuring abnormal valve-
train dynamics was induced by using a range of different valve-lash setting
adjustments. Using the dynamic valve-train model it was possible to predict the
valve actuation timing and velocities arising from the induced abnormal valve-train
dynamics. Using the information generated by the dynamic valve-train model it was
also possible to characterise AE signals in terms of valve impact related AE activity.
The investigation based upon the valve-train dynamics tests is presented in Chapter
7 and is titled:
Characterisation of acoustic emission associated with abnormal valve-train dynamics
in a small pushrod-type Diesel engine
The objective of the excess piston-slap tests was to characterise the phenomenon of
piston slap as a source of AE and identify whether any AE signal features could be
directly identified as being caused by piston slap. The piston slap test featured the
inducement of excessive piston slap into one of the four engine pistons at a level
consistent with the service limits of the engine. Established methods were used to
locate the approximate locations of potential piston slap events in terms of engine
cycle timing. Using this information it was possible to analyse recorded AE signals
with regards to piston slap related activity. The research based upon the piston slap
test is presented in Chapter 8 titled:
Detection and characterisation of acoustic emission activity associated with piston
slap in a small Diesel engine

Characterisation of Combustion Related Acoustic Emission Sources for Diesel Engine Condition Monitoring
66
4.3 Data Acquisition
Two separate data acquisition (DAQ) systems were used to record data throughout
the test campaigns. The first of these DAQ systems utilised a sampling rate of 1
MHz and was used to record AE signals whilst the second DAQ system utilised a
sampling rate of 50 kHz and was used to record comparison or reference signals
such as vibration, cylinder pressure, TDC and crank-angle encoder signals as well as
AE RMS signals. Raw AE signals were amplified using Physical Acoustics
Corporation 2/4/6 preamplifiers before being synchronously recorded along with the
TDC signals using a Physical Acoustics Corporation microDisp™ AE DAQ system
and Hewlett-Packard laptop computer running Physical Acoustics Corporation
AEwin™ software. Raw AE signals were band-pass filtered between 20 kHz and
400 kHz. The first DAQ system setup used to record AE signals is shown
schematically in Figure 4.3.
Figure 4.3: Schematic showing the AE data acquisition system
The second DAQ system, shown schematically in Figure 4.4, consisted of a Toshiba
laptop computer running National Instruments LabVIEW™ software and a
PCMCIA DAQ card which was in turn connected to a National Instruments, BNC
PAC microDisp AE system
Engine
Laptop computer
TDC and Encoder reference signals
AE signals
PAC 2/4/6 preamplifiers

Chapter 4: Experimental Approach and Methodology
67
2120 I/O connector. AE signals were amplified using PAC 2/4/6 preamplifiers and a
Physical Acoustics Corporation AE5A signal conditioner with a 50 millisecond
window was used to convert the raw AE signals into analog AE RMS signals.
Pressure and vibration signals were low pass filtered using a 20 kHz cut-off in order
to prevent aliasing with the vibration signal being amplified using a PCB signal
conditioner.
Figure 4.4: Schematic showing the second data acquisition system
4.4 Sensor Setup and Positioning
During the hole-type injector nozzle and Diesel knock tests pressure signals were
recorded from a Kistler 6053CC60 pressure sensor installed into cylinder 1 of the
Cummins engine. Pressure signals were amplified using a PCB 422D03 charge
amplifier prior to being recorded. AE signals were acquired using Physical Acoustics
National Instruments BNC-2120 Connector
Engine
Pressure signal
PAC AE5A AE Signal Conditioner
Laptop computer
PAC 2/4/6 Preamplifier
Vibration signal
PCB Signal Conditioner
Analogue band-pass filter
AE RMS signal
TDC signal
AE signal
PCMCIA DAQ card

Characterisation of Combustion Related Acoustic Emission Sources for Diesel Engine Condition Monitoring
68
Corporation 15α sensors that were positioned on the front face of the Cummins engine
using magnetic holders. One AE sensor was positioned on the engine block and the
other on the cylinder head. These sensor positions are shown in Figure 4.5.
Figure 4.5: The AE sensor positions on the front of the Cummins engine
During the pintle-type injector nozzle and valve-lash tests AE signals were recorded
from the Perkins engine using a Physical Acoustics Corporation MICRO-30D sensor
mounted to the head of the engine in close proximity to cylinder 1 whilst pressure
signals were recorded from a Kistler 6056A pressure sensor installed into cylinder 1
using a suitable glow plug adapter. These sensor positions are shown in Figure 4.6.
Figure 4.6: The pressure and AE sensor positions on the head of the Perkins engine
The same pressure sensor and positions were maintained for the piston slap test
however, an array using Physical Acoustics Corporation MICRO-30D AE sensors
AE sensor
Pressure sensor
AE sensor- head
AE sensor- block

Chapter 4: Experimental Approach and Methodology
69
was used in order to account for any possible sensor position effects arising from the
test. The first AE sensor was mounted on the cylinder head in the same position
shown previously in Figure 4.6. AE sensors 2, 3 and 4 were mounted in close
proximity to cylinder #1 on the thrust side of the cylinder block (opposite side to AE
sensor 1). These sensor positions are shown in Figure 4.7.
Figure 4.7: The piston slap test AE sensor positions on the Perkins engine block
4.5 Acoustic Emission Signal Processing
During the testing phase of the research featured in this thesis, AE signals were
recorded as both raw AE time-series data using the Physical Acoustics Corporation
microDisp™ AE DAQ system shown in Figure 4.3 and as analog AE RMS signals
recorded using the DAQ system shown in Figure 4.4. Both of these signals were
acquired with simultaneously recorded TDC reference signals. AE signals were
converted into analog AE RMS signals using the Physical Acoustics Corporation
AE5A signal conditioner according to Equation 4.1 [185].
(4.1)
AE sensor 2 AE sensor 3
AE sensor 4

Characterisation of Combustion Related Acoustic Emission Sources for Diesel Engine Condition Monitoring
70
Where f(t) is the input signal and T is the running average window. In converting the
raw AE signals into analog AE RMS signals a running average window of 50
milliseconds was used throughout the testing phase of the research. Conversion of
digitised raw AE into AE RMS was also undertaken due to the unavailability of
some of the DAQ equipment. This step was applied as a post-acquisition signal
processing step according to the equation reproduced below as Equation 5.2 [21]
where x is the data value at a discrete point in time and N is the total number of data
samples in the selected time period.
(4.2)
In converting recorded raw AE signals, a running average window of 100 data points
was used throughout the testing phase of the research with 80% overlap in order to
produce AE RMS signals that were consistent with other signals recorded in terms of
the number of data points per engine cycle.
Another widely used AE parameter is that of summed AE signal energy. However, it
must be noted that the definition in terms of specific the method used in the
calculation of the summed AE signal energy can vary. For example, Douglas [21]
mentions that the calculation of summed AE signal energy has been defined as the
area under the absolute signal, and as the area under the square of the signal.
Throughout this thesis summed AE signal energy values are used extensively with
the summed AE signal energy being calculated as the area under AE RMS signals.
Summed AE RMS energy ( ϑE ) calculated in this way is defined by Equation 4.3.
( ) θθθ
θϑ dSE ∫=2
1 (4.3)
Where S(θ) is the AE RMS signal in terms of crank-angle and the subscripts θ1 and
θ2 are the window start and end positions in crank-angle degrees.

Chapter 4: Experimental Approach and Methodology
71
4.6 Chapter Summary
Chapter 4 commenced by firstly describing the two different Diesel engine test beds
that were used to undertake the test campaigns featured in this thesis. Subsequent
sections within Chapter 4 have gone on to introduce and provide a conceptual
overview of the four major test campaigns. Latter sections then went on to describe
the data acquisition systems, sensors and sensor positions used in undertaking the
required tests. The final sections of Chapter 4 then provided a description regarding
the methods that where used to process the AE signals that were captured during the
test campaigns.

Characterisation of Combustion Related Acoustic Emission Sources for Diesel Engine Condition Monitoring
72

Chapter 5: Acoustic Emission Signal Features Associated with the Two Main Types of Diesel Engine Fuel Injector Nozzles
73
Chapter 5 Acoustic Emission Signal Features Associated with the Two Main Types of Diesel Engine Fuel Injector Nozzles
Initial sections of Chapter 5 begin by describing the methods used to induce the hole
and pintle-type nozzle faults and continue by qualifying the combustion effects that
arose during the injector nozzle fault tests using averaged cylinder pressure traces.
Subsequent sections within Chapter 5 go on to identify those AE signal portions that
hold injector fault specific information and detail some initial AE signal
observations regarding time-series and time-frequency features. Chapter 5 then
continues by presenting results specific to each of the two types of injector nozzles
used during the injector nozzle fault tests which together show that differences in
injector nozzle function produce AE signal features that that can be specifically
related to the type of injector nozzle used.

Characterisation of Combustion Related Acoustic Emission Sources for Diesel Engine Condition Monitoring
74
5.1 Induced Injector Nozzle Faults
Injector nozzle faults were induced into both pintle and hole-type nozzles based upon
failure modes detailed in Chapter 3. The fault inducement technique adopted for the
hole-type nozzle fault tests involved the careful application of a wire buffing wheel
to the nozzle tip whilst the pintle-type nozzle fault tests featured nozzles with
incorrect pintle geometry and total pintle removal. The full misfire condition was
induced using an electrical switch to isolate the injector from the engine control
module.
5.1.1 Hole-Type Nozzle Faults
It was found that the nozzle tip damage produced by the application of a wire buffing
wheel to the nozzle tip closely replicated the reduction of injected fuel flow through
the nozzle due to damage or material build-up around the nozzle holes [183]. The
damaged replacement injectors were tested commercially in order to ascertain the
resulting injector fault level. The first damaged injector had a fuel flow level
approximately 20% below the acceptable nominal valve whilst the second injector
had a fuel flow level approximately 80% below the nominal valve. Engine operation
under the induced fault conditions was therefore referred to as the small, large and
full misfire injector fault conditions. Figure 5.1 (a) shows a photograph of an original
undamaged injector nozzle with a pen tip for comparison whilst Figure 5.1 (b) shows
a close up photograph of one of the nozzle holes. Of note are the sharp, undamaged
edges and absence of build-up seen around the edges of the holes.
(a) (b)
Figure 5.1: An undamaged hole-type nozzle with a ballpoint pen tip for comparison
(a) and (b) a close-up of the nozzle holes

Chapter 5: Acoustic Emission Signal Features Associated with the Two Main Types of Diesel Engine Fuel Injector Nozzles
75
Figure 5.2 shows a close up photograph of the damaged nozzle holes. As seen the
edges of the holes shown have been severely damaged. The edges of the holes have
been severely rounded whilst the diameter of the hole has been reduced to
approximately one third of their original size. This damage drastically affects fuel
flow rate and spray development through individual holes, and the overall nozzle
spray pattern.
Figure 5.2: A close-up photograph of damaged injector nozzle holes
5.1.2 Pintle-Type Nozzle Faults
Two simulated pintle faults were induced for the pintle-type nozzle fault tests. The
first of these faults involved the removal of the nozzle pintle whilst the second pintle
injector fault was induced using a pintle having an incorrect shape. Figure 5.3 (a)
shows the original pintle nozzle tip with a mechanical pencil for comparison whilst
Figure 5.3 (b) shows a close up of the undamaged pintle. Of particular note is the
undamaged pintle geometry.
(a) (b)
Figure 5.3: The original undamaged pintle injector with a mechanical pencil tip for
comparison (a) and (b) a photograph showing a close-up of the pintle

Characterisation of Combustion Related Acoustic Emission Sources for Diesel Engine Condition Monitoring
76
Figure 5.4 (a) shows the badly damaged pintle whilst Figure 5.4 (b) shows a close up
of the pintle with incorrect geometry. The damaged injectors were tested in order to
ascertain the corresponding injector fault conditions. The first damaged pintle
injector was classified as badly damaged whilst the second injector was classified as
having incorrect pintle geometry. The corresponding pintle fault test operating
conditions were therefore referred to as the normal, worn pintle and incorrect pintle
operating conditions.
(a) (b) Figure 5.4: A close up showing the badly damaged pintle (a) and the pintle having
incorrect geometry (b)
5.2 Qualification of Induced Nozzle Faults Using Pressure Signals
In order to ascertain the effect that the different injector faults were having in terms
of combustion output, averaged pressure traces corresponding to the different nozzle
fault conditions were produced using approximately 60 engine cycles from each of
the engine operating conditions. Figure 5.5 shows the compression and power stroke
portions of averaged cylinder pressure traces from the hole-type nozzle fault test in
which the engine was operated at a nominal engine speed of 1500 rpm under full
load. As Figure 5.5 shows, the averaged pressure traces from the induced normal,
small, large and misfire conditions result in a progressive reduction in both overall
cylinder pressure amplitude, and in relative combustion output (as related to the area
under the cylinder pressure trace).
The cylinder pressure graphs plotted in Figure 5.5 are to be expected as these
pressure plots mirror the quantitative injector test results previously mentioned in
Section 4.4.1. These quantitative injector tests showed that the induced nozzle faults
resulted in a progressive reduction in the quantity of injected fuel hence producing

Chapter 5: Acoustic Emission Signal Features Associated with the Two Main Types of Diesel Engine Fuel Injector Nozzles
77
the progressive reduction in cylinder pressure amplitude and in combustion output
seen in Figure 5.5.
Figure 5.5: Average cylinder pressure plots for the hole-type nozzle tests
Similarly, Figure 5.6 shows the compression, TDC and power stroke portions of
averaged cylinder pressure traces from the pintle-type nozzle fault test in which the
engine was operated at 1500 rpm under full load. These averaged pressure traces
were produced again using approximately 60 engine cycles from the normal,
damaged pintle, and incorrect pintle fault engine operating conditions.
Unlike the progressive reduction observed in cylinder pressure amplitude and
combustion for the hole-type tests, Figure 5.6 shows that the averaged pressure traces
from the pintle-type nozzle fault test show little change in terms of both; overall
cylinder pressure amplitude, and relative combustion output with regards to the
induced pintle nozzle fault conditions. This effect can be accounted for, if pintle
injector function is considered as the induced pintle faults are expected to affect the
fuel spray characteristics but as the amount of fuel injected is governed by the
injector cracking (opening) pressure, the induced faults result in similar quantities of
fuel being injected during all three operating conditions.

Characterisation of Combustion Related Acoustic Emission Sources for Diesel Engine Condition Monitoring
78
Figure 5.6: Average cylinder pressure plots for the pintle-type nozzle tests
It is assumed therefore that the small variations in averaged pressure trace amplitude
that are seen between 360˚ (TDC) and approximately 390˚ in Figure 5.6 are the result
of a combination between the different fuel spray characteristics caused by the
induced pintle faults and the slight variations in injector cracking pressure associated
with the three different injectors used throughout the test. Hence the differing nozzle
fault related cylinder pressure effects shown in Figures 5.5 and 5.6 are categorised as
a direct consequence of the different functional characteristics associated with hole
and pintle nozzles and the induced faults used during the test campaign.
5.3 Initial Injector Related Acoustic Emission Signal Observations
A preliminary analysis of recorded AE signals from the hole-type nozzle fault tests
was undertaken in order to identify injector nozzle fault related signal features. To
begin with, randomly selected portions of raw AE signals recorded under both
normal and misfire engine operation conditions were truncated using the
simultaneously recorded TDC signal into portions corresponding to individual engine
cycles. These AE signal portions were then presented in terms of crank-angle by
calculating the crank-angle step associated with each AE signal portion thus allows
the nominal crank-angle timing values associated with engine component function to
be included as timing maps.

Chapter 5: Acoustic Emission Signal Features Associated with the Two Main Types of Diesel Engine Fuel Injector Nozzles
79
Figure 5.7 highlights the results this process by showing a truncated potion of the
raw AE signal along with the corresponding TDC signal from the six cylinder
Cummins engine operating at 1500 rpm under full load conditions. As seen the AE
signal potion corresponds to one complete engine cycle which in this case consists of
two complete revolutions of the crankshaft - or 720˚. The signal portion spanned by
the arrow in Figure 5.7 identifies in general terms, the portion of the AE signal
associated with fuel injector operation and combustion in cylinder 1.
Figure 5.7: A plot showing truncated TDC and AE signals for one engine cycle with
the injector fault related region highlighted
5.3.1 Misfire Related Signal Observations
Figure 5.8 shows a close-up view of the injector fault related portion of the AE signal
highlighted in Figure 5.7. As Figure 5.8 shows, the injector fault related portion of
the AE signal can be further categorised and divided into three regions using
knowledge concerning the operation of the Cummins engine and fuel injection
system and the interrelated combustion process. These regions are; the injector
operation region; the premixed/diffusion combustion region and the extended
response region.
As shown in Figure 5.8, the injector operation region occurs as the piston nears the
end of the compression stroke and is categorised as occurring between the
approximate crank-angle values of 335˚ and 365˚. This portion of the AE signal is
Injector Fault Related Signal Portion

Characterisation of Combustion Related Acoustic Emission Sources for Diesel Engine Condition Monitoring
80
believed to contain injector related AE activity similar to that reported by Douglas
[21], Elamin et al. [98] and Gill et al. [139] that originates as a consequence of
injector operation and build-up of pressure in fuel lines as well as the high pressure
fuel flow through the injector nozzle. The premixed/diffusion combustion region
shown Figure 5.8 is categorised as occurring between approximately 365˚ and 405˚.
This region is believed to contain both premixed and diffusion combustion related
AE activity similar to that reported by Frances et al. [84] whilst an extended response
region similar to that described by Gill et al. [139] is also identified in Figure 5.8 as
occurring between 405˚ and 480˚.
Figure 5.8: A plot showing a close-up of the injector fault related portion of an AE
signal recorded with the three regions of interest
As Figure 5.8 shows, two pulses can be seen within the premixed/diffusion
combustion region. The first pulse within the premixed and diffusion combustion
region is seen to occur at approximately 367˚. This event, based upon its timing, is
identified as an initial combustion pulse similar to those identified by Frances et al.
[84]. The second pulse seen at approximately 395˚ within the premixed and diffusion
combustion region however remains unidentified.
Figure 5.9 shows a close-up view of the injector fault related portion of an AE signal
recorded under the misfire operating condition, and as can be seen, the misfire
Injector Operation
Region
Premixed/Diffusion Combustion
Region
Extended Response Region
Unidentified Event
Combustion Pulse

Chapter 5: Acoustic Emission Signal Features Associated with the Two Main Types of Diesel Engine Fuel Injector Nozzles
81
operating condition is readily distinguishable by the general reduction in amplitude
of the AE activity within all of the previously identified regions. Although the
amplitude of the AE activity within all of the three regions is greatly reduced Figure
5.9 shows that a relatively small AE pulse occurs at approximately 382˚. Based upon
the crank-angle timing of this event, it is believed that this pulse; which is usually
disguised by combustion related AE activity, is caused by piston slap as the piston in
the misfiring cylinder proceeds through the TDC position and on its downward
stroke. It is further thought that the relatively small size of the piston slap related AE
pulse seen in Figure 5.9 is an indication of the reasonably new condition of the PCI
in the Cummins test engine.
Figure 5.9: A plot showing a close-up of the injector fault related portion of an AE
signal recorded during the misfire engine operating condition
5.3.2 Time-Frequency Observations
AE signals recorded during the hole-type nozzle fault test from the Cummins test
engine were also examined with regards to time-frequency features. Spectrograms,
generated with MATLAB® software, were used to display the time-localised power
spectral density estimate [184] of the combustion related portion of the recorded AE
signals. The time-frequency spectrogram plots for the combustion related portions of
the normal and large hole-type nozzle fault AE signals are displayed in the upper
plots of Figure 5.10 and Figure 5.11 whilst plots of the respective AE signal portions
Injector Operation
Region
Piston Slap Event
Premixed/Diffusion Combustion
Region
Extended Response Region

Characterisation of Combustion Related Acoustic Emission Sources for Diesel Engine Condition Monitoring
82
with respect to crank-angle are displayed in the lower plots. Also highlighted in
Figure 5.10 and Figure 5.11 are the three previously mentioned regions.
Figure 5.10: A time-frequency spectrogram plot of the AE signal from the engine
operating normally (upper plot) with corresponding crank-domain plot
Figure 5.11: A time-frequency spectrogram plot of the AE signal from the bad
injector fault condition (upper plot) with corresponding crank-domain plot
Injector Operation
Region
Premixed/Diffusion Combustion
Region
Extended Response Region
Injector Operation
Region
Premixed/Diffusion Combustion
Region
Extended Response Region

Chapter 5: Acoustic Emission Signal Features Associated with the Two Main Types of Diesel Engine Fuel Injector Nozzles
83
The injector operation region of the spectrogram shown in the upper plot of Figure
5.10 shows that under normal conditions, the majority of signal energy in this region
is associated with frequencies under approximately 190 kHz. Comparisons between
the injector operation region of Figure 5.10 and Figure 5.11 shows that the energy
associated with the injector operation region has diminished indicating a decrease in
AE activity from injector operation and high pressure fuel flows through the fuel
injector body and nozzle holes.
The premixed/diffusion combustion region of the spectrogram shown in Figure 5.10
shows that the initial combustion pulse seen to commence at 365˚ generates energy
throughout the entire frequency range shown. Comparisons between the initial
combustion pulses in Figure 5.10 and Figure 5.11 shows that even under the bad
fault conditions the combustion pulse and resultant shock loading continues to
generate energy throughout the entire frequency range shown. Comparisons between
the energy levels associated with the extended response regions in Figure 5.10 and
Figure 5.11 suggests that the signal energy contribution in this region is mainly
associated with frequencies less than 180 kHz.
5.4 Characterisation of Injector Nozzle Fault Related Acoustic Emission
Following the initial observations, an AE energy based analysis using recorded
injector fault test AE data was undertaken for both hole and pintle-type injector
nozzle faults using the DAQ systems, setups and procedures outlined in Chapter 4.
Recorded AE signals during the pintle-type nozzle fault tests were converted into
analog root-mean square (RMS) signals before being digitised and recorded whilst
during the hole-type nozzle fault tests raw AE signals recorded were converted into
AE RMS as a post-processing step due to the unavailability of some of the DAQ
equipment.
5.4.1 Hole-Type Nozzle Fault Related Acoustic Emission
The AE signals recorded from the Cummins engine were converted to AE RMS and
averaged using approximately 100 engine cycles. Once averaged, a windowed
portion of the signals was used to isolate injector fault related AE RMS signal
portions. The interval used to isolate these signal portions of interest was defined as
being between 350˚and 380˚ (10˚ before TDC to 20˚ after TDC). The start of the

Characterisation of Combustion Related Acoustic Emission Sources for Diesel Engine Condition Monitoring
84
interval was selected in order to capture any AE activity arising from fuel line
pressure build-up, injector operation and high velocity fuel flow through the injector
nozzle and was based upon previously recorded injector operation data that identified
fuel injection as occurring 1 to 2˚ before TDC.
The length of the interval was selected in order to ensure the capture of AE activity
arising from premixed combustion pulses. Figure 5.12 highlights the interval used in
isolating those AE RMS signal portions of interest by showing an averaged AE RMS
signal and the signal interval of interest along with comparative TDC and pressure
reference signals.
Figure 5.12: The windowed interval used during the hole-type nozzle fault analysis
Total energy for the signal interval of interest was calculated as a summation of the
windowed AE RMS signal portions according to Equation 4.3. The resultant summed
energy values for the full load and half load engine settings have been presented
graphically as Figure 5.13(a) and (b) respectively. Initial comparisons between the
engine head and block energy values in Figure 5.13(a) and (b) highlight the
attenuation related energy differences between AE signals recorded from the engine
head and block. However, as seen, the head and block mounted sensors both capture
similar overall trends in terms of the induced fault conditions.

Chapter 5: Acoustic Emission Signal Features Associated with the Two Main Types of Diesel Engine Fuel Injector Nozzles
85
Figure 5.13(a) shows that for the half load engine setting, increasing fault severity
results in progressive decreases in summed energy values. A similar progressive
decrease in summed energy values between the misfire, large fault and normal
conditions is also evident in Figure 5.13(b) for the full load case however the large
summed energy value identified as being due to a larger initial combustion pulse is
again evident for the small fault case.
(a)
(b)
Figure 5.13: Graphs showing summed energy values for the hole-type nozzle fault tests
for (a) full load and (b) half load engine operation

Characterisation of Combustion Related Acoustic Emission Sources for Diesel Engine Condition Monitoring
86
Summed energy values were also calculated for smaller signal windows in order to
analyse the energy associated with smaller signal intervals. The first of these smaller
windows encompassed the interval between 350˚ and 360˚ (TDC) and was used to
capture AE signal energy associated specifically with fuel line pressure build-up,
injector operation and high pressure fuel flow. A second window, encompassing the
interval between 360˚ (TDC) and 370˚ was used to capture information regarding the
commencement of combustion and the generation of initial combustion related
pulses whilst a third window encompassing the interval between 370˚ and 380˚ was
used to capture information regarding the subsequent progression of combustion.
The calculated small window interval AE energy values for the head mounted
sensors are presented graphically for the full load and half load engine settings as
Figure 5.14(a) and (b) respectively. Figure 5.14(a) and (b) show that for the two load
settings used, the misfire related energy values for all three windowed intervals was
consistently low indicating an absence of injector operation related AE energy in the
first interval and an absence of initial combustion pulses and combustion related AE
activity in the second and third intervals.
The elevated AE energy values displayed by Figure 5.14(a) and (b) in the first
windowed interval for the normal and small fault conditions are interpreted as
indicating increased injector operation related AE activity when compared to the
misfire and large fault condition. The elevated AE energy values seen for the second
and third intervals for the normal, small and large fault conditions are interpreted as
indicating the presence of both premixed and diffusion combustion for these fault
conditions.
Figure 5.14(a) and (b) both also show that the large fault condition summed energy
values for the first interval are comparable to the misfire values. As with the misfire
case, this is interpreted as indicating a large reduction in injector operation related
AE activity. When compared to the misfire energy values, the increased large fault
AE energy values in the second and third windowed intervals in both Figure 5.14(a)
and (b) shows that although reduced, the quantity of injected fuel still results in
premixed and diffusion combustion related AE activity.

Chapter 5: Acoustic Emission Signal Features Associated with the Two Main Types of Diesel Engine Fuel Injector Nozzles
87
(a)
(b)
Figure 5.14: Graphs showing summed energy values from the three intervals for the
hole-type nozzle fault tests for (a) full load and (b) half load engine operation
Also evident when considering the large fault energy values displayed in Figure
5.14(a) and (b) is the substantial increase in AE energy between the first and second
window intervals. This increase in AE energy is thought to be indicative of the poor
fuel spray characteristics associated with the induced nozzle fault and a consequent

Characterisation of Combustion Related Acoustic Emission Sources for Diesel Engine Condition Monitoring
88
increase in the severity of an initial premixed combustion pulse, even though the
overall mass of injected fuel is substantially reduced.
5.4.2 Pintle-Type Nozzle Fault Related Acoustic Emission
During the pintle-type nozzle fault tests, analog AE RMS signals were recorded
using the data acquisition setup detailed in Chapter 4 from an AE sensor located on
the engine head. These AE RMS signals were averaged using approximately 250
engine cycles from each test setting using a simultaneously recorded TDC signal.
Once averaged, a windowed portion of the signals was used in a similar fashion to
that described in the previous section to calculate summed energy. As injection in the
Perkins engine commences at 22˚ before TDC, the windowed interval used in the
pintle fault analysis encompassed a signal interval between 338˚and 380˚ (22˚ before
TDC to 20˚ after TDC). Figure 5.15 shows the interval used in calculating the
summed energy along with an averaged AE RMS signal and comparative plots of
pressure and TDC.
Figure 5.15: The windowed interval used during the pintle-type nozzle fault analysis
The summed AE RMS values corresponding to the various pintle nozzle fault test
settings are displayed graphically as Figure 5.16. As seen, Figure 5.16 shows that a
progressive reduction in the total windowed interval energy is evident under the full
load condition between the normal, incorrect geometry, and badly damaged pintle
fault cases however this trend is not evident for the no load case. Indeed, energy

Chapter 5: Acoustic Emission Signal Features Associated with the Two Main Types of Diesel Engine Fuel Injector Nozzles
89
values for the no load case are seen to increase marginally indicating the absence of
any consistent energy trends for the two load settings.
Figure 5.16: Graph showing summed energy values for the pintle nozzle fault tests
Summed energy values were also calculated for three smaller windowed signal
intervals in order to capture AE signal energy associated with injector operation and
combustion. The first of these encompassed an interval between 338˚ and 360˚ whilst
the second windowed interval encompassed 360˚ (TDC) to 370˚. The third interval
spanned 370˚to 380˚. The windowed energy values from the three smaller intervals
are presented graphically for the two loading conditions as Figure 5.17(a) and (b).
Figure 5.17(a) shows that the majority of summed energy values for the no load
engine load setting occurs in the 370˚ to 380˚ window for both normal and pintle
fault conditions. As the summed energy levels in the 370˚ to 380˚ window for the no
load engine setting show a substantial increase in relative amplitude over the
corresponding full load plot, it is thought that this combustion related AE activity
arises as a consequence of extended ignition delay periods and associated increases
in the amplitude of premixed combustion related pulses. These increased combustion
pulses are thought to originate as a consequence of the sub-optimal fuel injection and
air-mixing characteristics associated with unloaded engine operation. Of particular
note however is the relative similarity in the plots for the normal and pintle fault
conditions. This result indicates that whilst the sub-optimal fuel injection and air-

Characterisation of Combustion Related Acoustic Emission Sources for Diesel Engine Condition Monitoring
90
mixing characteristics associated with unloaded engine operation result in delayed
combustion pulses, the induced pintle faults themselves have little effect in terms of
overall AE activity.
(a)
(b)
Figure 5.17: Graphs showing pintle-type nozzle test summed energy values for the
small intervals for (a) no load and (b) full load engine operation
Figure 5.17(b) shows that under full load engine operation, the AE energy for all
three fault conditions is more evenly distributed between the three intervals. This
indicates a more even AE energy distribution between the injector operation and

Chapter 5: Acoustic Emission Signal Features Associated with the Two Main Types of Diesel Engine Fuel Injector Nozzles
91
combustion related AE sources when compared to Figure 5.17(a). It is thought that
this result arises as a consequence of the generally more effective injection, air-
mixing and combustion characteristics associated with full load engine operation
when compared to the no load case.
The results presented in Figure 5.17(a) and (b) show that for the induced pintle-type
nozzle faults, AE activity is primarily associated with engine load and the associated
variation in injected fuel quantity however the similarity between the normal and
fault related summed energy plots shown in Figure 5.17(a) and (b) indicates that the
induced pintle faults themselves have little effect in terms of overall AE activity. The
lack of pintle nozzle fault related AE activity highlights the added immunity to poor
fuel spray characteristics that IDI combustion chamber designs have when compared
to DI designs.
5.5 Chapter Summary
The results presented throughout Chapter 5 have shown that functional differences
between hole and pintle-type injector nozzles results in AE which can be specifically
related to the type of injector nozzle used. During the hole-type nozzle tests, the
increasingly severe induced nozzle faults resulted in a progressive reduction in the
amount of injected fuel. Results detailed within Chapter 5 showed that this
progressive reduction in the amount of injected fuel was generally mirrored by a
decline in summed AE signal energy between the small fault, large fault, and misfire
conditions. Increased combustion pulse related AE activity was however identified
for the small fault case which was identified as being indicative of an increased
combustion pulse which stemmed from the sensitivity that DI combustion systems
have to poor fuel spray characteristics. It was also shown that as with the misfire
case, the severe hole-type nozzle fault resulted in low levels of injector operation
related AE activity although combustion related AE activity was still identified.
Three different pintle-type nozzle fault conditions were also induced. It was found
that the induced pintle nozzle faults did not produce a decrease in cylinder output for
the crank-angle interval considered as these faults did not result in reduced injected
fuel quantities. Results presented showed that under the no load operating conditions,
the injector operation related AE energy could be mainly attributed to combustion

Characterisation of Combustion Related Acoustic Emission Sources for Diesel Engine Condition Monitoring
92
related AE sources whilst under full load conditions the AE sources were more
evenly distributed between injector operation and combustion related sources
however it was found that the induced pintle nozzle faults themselves have little
effect in terms of overall AE activity owing to the relative immunity that IDI
combustion chambers have to fuel spray characteristics.

Chapter 6: Detection of Knock Related Acoustic Emission from a Dual-Fuel Diesel Engine Operating with Diesel Fuel and Ethanol
93
Chapter 6
Detection of Knock Related Acoustic Emission from a Dual-Fuel Diesel Engine Operating with Diesel Fuel and Ethanol
Chapter 6 begins by briefly introducing the dual-fuel Diesel knock phenomenon and
the use of ethanol fumigation in inducing Diesel knock throughout this investigation.
The theoretical basis governing combustion chamber resonance is also detailed
owing to the fundamental role it plays in the knock phenomenon and its use in the
analytical stages of the investigation. Subsequent sections detail the results of the
experimental investigation in which AE based Diesel knock detection was
undertaken using the Cummins engine setup detailed in Chapter 4. Three different
engine running conditions were induced during the experimental investigation to
represent three different dual-fuel Diesel (DFD) knock levels. The DFD knock levels
were quantified using two techniques. The first technique involved the calculation of

Characterisation of Combustion Related Acoustic Emission Sources for Diesel Engine Condition Monitoring
94
average pressure oscillation amplitudes directly from recorded pressure signals using
pressure oscillation amplitudes whilst the second technique involved the
decomposition of the combustion window portion of the pressure signal using a three
level discrete wavelets decomposition. These two knock measures were subsequently
compared in terms of DFD knock level trends to AE signals.
6.1 Dual-Fuel Diesel Knock
DFD engines using gaseous primary fuels such as natural gas commonly operate by
either mixing the gaseous primary fuel with the incoming air to form a mixed air-fuel
charge, or by directly injecting the gaseous fuel into the combustion chamber. These
types of engines use a small amount of Diesel fuel to ignite the primary gaseous fuel
in a fashion similar to SI combustion [186, 187]. It has been stated by researchers
such as Kubesh and Brehob [188] that knock in DFD engines using gaseous primary
fuels can occur due to both Diesel Knock, and SI knock mechanisms. Saidi et al.
[178] mention that the specific contributions of each knock mechanism depends on
the type of primary fuel used, and amount of pilot fuel injected.
Nwafor [189] characterised gas fumigated DFD combustion as potentially having
three types of knock; these were Diesel knock, SI knock and erratic knock. Nwafor
[189] concluded that Diesel knock occurred due to the rapid combustion of pilot fuel,
the SI knock occurred due to the auto-ignition of the end gas and the erratic knock
was due to the secondary ignition of the primary fuel. In addition to the knock
reported in DFD engines using gaseous substitute fuels, researchers have also
associated severe engine knock with the use of other substitute fuels in Diesel
engines. For example, severe knock has often been reported as a major drawback
with the use of fumigated alcohols as a fuel substitute in Diesel engines [190, 191].
6.2 Induced Dual-Fuel Diesel Knock
The three different engine running conditions used during the dual-fuel Diesel knock
test campaign were induced by way of fumigation whereby secondary substitute fuel
- in this case ethanol - is introduced into the intake air stream. During the dual-fuel
Diesel knock test ethanol was supplied to the Cummins engine as a substitute fuel by
way of a secondary fuel system also controlled by the Dynalog control system.
Ethanol was injected into the incoming air using the low pressure, ethanol injector
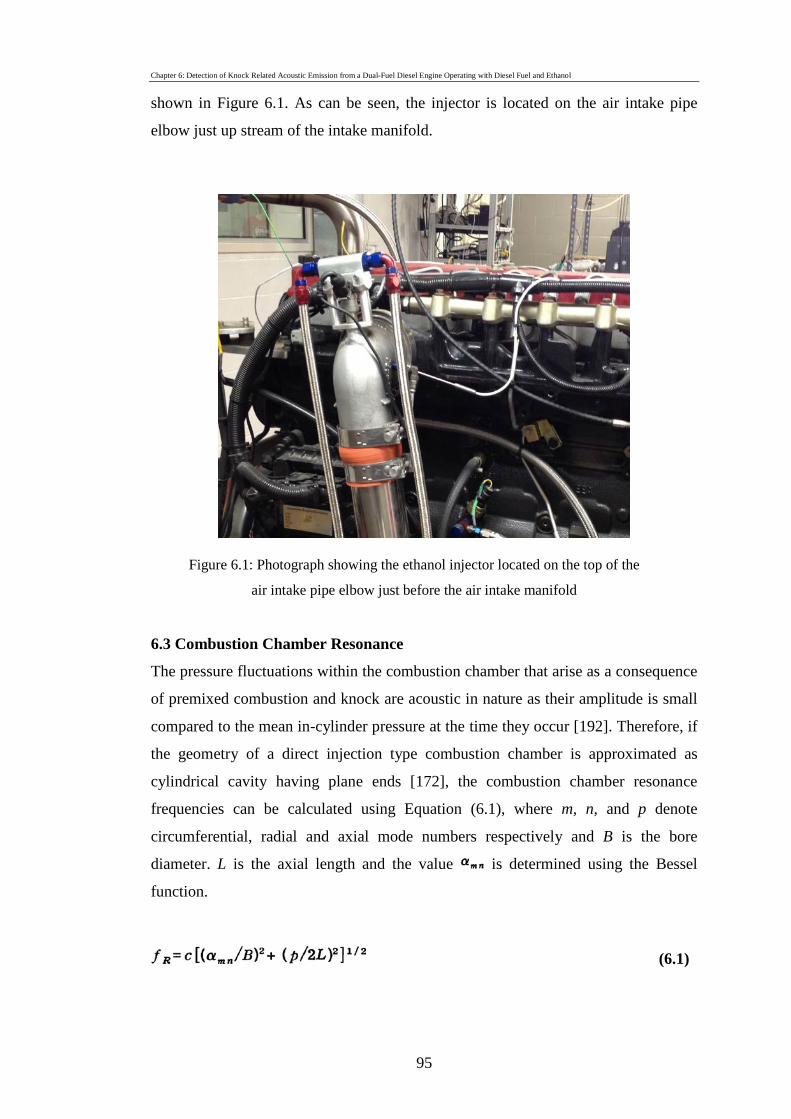
Chapter 6: Detection of Knock Related Acoustic Emission from a Dual-Fuel Diesel Engine Operating with Diesel Fuel and Ethanol
95
shown in Figure 6.1. As can be seen, the injector is located on the air intake pipe
elbow just up stream of the intake manifold.
Figure 6.1: Photograph showing the ethanol injector located on the top of the
air intake pipe elbow just before the air intake manifold
6.3 Combustion Chamber Resonance
The pressure fluctuations within the combustion chamber that arise as a consequence
of premixed combustion and knock are acoustic in nature as their amplitude is small
compared to the mean in-cylinder pressure at the time they occur [192]. Therefore, if
the geometry of a direct injection type combustion chamber is approximated as
cylindrical cavity having plane ends [172], the combustion chamber resonance
frequencies can be calculated using Equation (6.1), where m, n, and p denote
circumferential, radial and axial mode numbers respectively and B is the bore
diameter. L is the axial length and the value is determined using the Bessel
function.
(6.1)

Characterisation of Combustion Related Acoustic Emission Sources for Diesel Engine Condition Monitoring
96
The speed of sound, c, is determined using the following thermodynamic relationship
with R being the gas constant, T is the temperature and γ is the ratio of specific heats.
(6.2)
Although axial, circumferential and radial modes are associated with cylindrical
cavity resonance, the axial modes can be excluded in terms of knock intensity as the
frequencies associated this mode are generally above the audible range [193]. This is
due to the small axial dimensions when the piston is close to TDC and the high speed
of sound at combustion temperatures [194]. When the axial term in Equation (6.1) is
set to zero (p = 0), Equation (6.1) can be rewritten as Equation (6.3).
(6.3)
Equation (6.3) was used to calculate the first four transverse (radial and
circumferential) mode frequencies. Based upon other bulk gas values detailed
previously [193, 195], a bulk combustion temperature estimation of 2000 K was
used. The calculated resonant frequencies are listed in Figure 6.2 along with a
diagram adapted from Hickling et al. [192, 193] depicting the corresponding modes.
Figure 6.2: The first four transverse modes with corresponding calculated resonant frequencies
Fundamental frequency (ƒ1,0) values calculated for the test engine were validated by
spectral analysis using fast Fourier transforms from the recorded pressure signals

Chapter 6: Detection of Knock Related Acoustic Emission from a Dual-Fuel Diesel Engine Operating with Diesel Fuel and Ethanol
97
with measured fundamental frequency (ƒ1,0) values ranging between 5100 -5700 Hz.
It was also found that the majority of the signal energy associated with cylinder
resonance was contained within the lowest (ƒ1,0) mode. This finding has also been
noted by other researchers such as Eng [195]. Once a fundamental frequency range
directly relating to the level of dual-fuel Diesel knock was determined, pressure
signals were then used to quantify Diesel knock levels.
Whilst discussing Diesel knock intensity measurement, Hsu [171] mentions that
maximum pressure rise rate (MPRR) has been used to quantify knock intensity when
the frequency response of pressure measurement system is such that the system is
unable to sense the individual pressure oscillations. Hsu [171] however, points out
that MPRR measurements can be misleading when modern instrumentation is used
as peak MPRR values may not be associated with premixed combustion. Moreover,
Ren et al. [172] also showed that high pressure rise rates do not necessarily mean
that Diesel knock is occurring. Ren et al. [172] suggest that more emphasis should be
placed on the instantaneous resonant frequency due to the direct link between the in-
cylinder pressure oscillations and knock related vibration. Hsu [171] also suggests
that the best way to quantify Diesel knock is to measure the combustion pressure
wave (oscillation) energy at the characteristic frequency.
6.4 Knock Severity Measurement
Figure 6.3(a) shows cylinder pressure traces recorded from the Cummins test engine
whilst operating with the three different ethanol substitution rates. As Figure 6.3(a)
shows, these pressure traces have been plotted with respect to crank-angle with the
combustion related TDC being at 360˚. The portion of the pressure traces highlighted
as the “knock related region” has been re-plotted in greater detail as Figure 6.3(b)
whereby those portions of the three different pressure traces between 360˚ and 385˚
(from the combustion TDC to 25˚ after combustion TDC) are shown. Figure 6.3(b)
shows that for the three different ethanol substitution rates, combustion begins
between 360˚ and 370˚. Under normal operation the commencement of combustion
is followed by the presence of relatively small in-cylinder pressure oscillations.
These oscillations become excessively large under unacceptable knock conditions
and Figure 6.3(b) indeed highlights one of the large knock related pressure
fluctuations associated with the e50 ethanol substitution rate.

Characterisation of Combustion Related Acoustic Emission Sources for Diesel Engine Condition Monitoring
98
Figure 6.3: Cylinder pressure traces for the three different ethanol substitution rates (a)
with (b) a close-up view highlighting an individual pressure signal fluctuation
The first technique used in measuring the severity of the induced dual-fuel knock
involved the calculation of average pressure oscillation amplitudes directly from
recorded pressure signals by averaging the amplitudes of the first five pressure
oscillations within individual combustion cycles from each operational regime. This
process was repeated for five consecutive engine cycles. The average pressure
(b)
Pressure Signal Fluctuation
Knock Related Region
(a)

Chapter 6: Detection of Knock Related Acoustic Emission from a Dual-Fuel Diesel Engine Operating with Diesel Fuel and Ethanol
99
fluctuation amplitude values were; 187 kPa for the e0 operating regime, 139 kPa for
the e30 regime and 587 kPa for the e50 regime. The average pressure fluctuation
amplitude values for the three engine operating regimes are shown graphically in
Figure 6.4. The average pressure fluctuation amplitude for the e50 case represents a
314% increase over the normal Diesel (e0) amplitude value.
Figure 6.4 Plot showing average cylinder pressure fluctuation amplitudes
The second technique used in measuring the severity of the induced dual-fuel knock
involved performing a three level discrete wavelet decomposition of the pressure
signals performed using a Daubechies (Db2) wavelet. The results of this
decomposition were used to calculate the energy associated with combustion for
specific frequency ranges. The 3.125 to 6.25 kHz frequency range was identified as
being of particular interest as this range included the fundamental frequency
associated with combustion chamber resonance and thus, the majority of the knock
related signal energy.
The energy content increased approximately 352% for the e50 case when compared
to the e0 case. It was found that the energy content contained in the 3.125 to 6.25
kHz frequency range of the pressure signal proved as effective in measuring the
knock severity level as the average pressure fluctuation amplitude method. However,

Characterisation of Combustion Related Acoustic Emission Sources for Diesel Engine Condition Monitoring
100
as the overall knock severity trends measured were similar to that shown in Figure
6.4, plots based on the discrete wavelet decomposition of the pressure signals have
not been reproduced.
6.5 Detection of Induced Dual-Fuel Diesel Knock
Factors such as engine block geometry, cooling system galleries and gaskets all
drastically effect the transmission of AE [91]. As detailed in Chapter 4, in order to
determine the most effective sensor position in terms of knock detection two separate
AE sensors were attached to both the engine block and head in close proximity to
cylinder #1. The relevant combustion related portions of the raw AE signals were
then isolated between 360˚ and 385˚ and the resultant AE signal portions were then
converted into AE RMS signals.
6.5.1 Acoustic Emission Sensor Position Comparisons
As shown in Figure 6.5, the combustion window AE RMS signals from the engine
head for the e0, e30 and e50 cases are all of similar amplitude indicating an absence
of recorded dual-fuel knock related AE activity.
Figure 6.5: Combustion window AE RMS from the engine head

Chapter 6: Detection of Knock Related Acoustic Emission from a Dual-Fuel Diesel Engine Operating with Diesel Fuel and Ethanol
101
Figure 6.6 shows the combustion window AE RMS recorded from the engine block
and as can be seen, a sharp increase in the AE RMS level for the e50 case
commences at approximately 371˚. The increase in AE RMS energy during the e50
case correlates to the start of the high amplitude pressure fluctuations highlighted in
Figure 6.3. This increase in AE RMS from the engine block gives a clear indication
that excessive Diesel knock is occurring.
Figure 6.6: Combustion window AE RMS from the engine block
6.5.2 Acoustic Emission Based Knock Indication
Figure 6.7 shows a trend comparison between the two techniques used to quantify
the Diesel knock level and the total AE RMS values summed over the interval of
interest for the engine block AE RMS. The various values have been normalised in
terms of the normal operation (e0) case. As seen, Figure 6.7 suggests that the
summed AE RMS from the engine block sensor provides a good indication regarding
the level of Diesel knock as indicated by the two Diesel knock quantification
techniques. It is thought that the increased AE RMS detected during the e50
operational regime is directly related to the transverse (circumferential and radial)
wave propagation modes associated with Diesel knock.

Characterisation of Combustion Related Acoustic Emission Sources for Diesel Engine Condition Monitoring
102
Figure 6.7: A trend comparison between the Diesel knock level quantification techniques
and the summed AE energy values from the engine block
6.6 Chapter Summary
The opening sections of Chapter 6 began by introducing the dual-fuel Diesel knock
phenomenon and describing the experimental setup whereby ethanol fumigation was
used to induce Diesel knock. Subsequent sections of Chapter 5 detailed the results of
the experimental investigation in which AE based dual-fuel Diesel knock detection
has been demonstrated. Three different engine running conditions were induced
during the experimental investigation to represent three different dual-fuel Diesel
(DFD) knock levels which were quantified using two techniques. The first technique
involved the calculation of average pressure oscillation amplitudes directly from
recorded pressure signals using pressure oscillation amplitudes whilst the second
technique involved the decomposition of the combustion window portion of the
pressure signal using a three level discrete wavelets decomposition. These two knock
measures were subsequently compared in terms of DFD knock level trends to AE
signals.
Comparisons of the Diesel knock levels associated with the operational regimes
showed that the e0 and e30 operating regimes had acceptable levels of Diesel knock.

Chapter 6: Detection of Knock Related Acoustic Emission from a Dual-Fuel Diesel Engine Operating with Diesel Fuel and Ethanol
103
However, the excessive levels of Diesel knock induced during the e50 operational
regime was shown to have pressure fluctuations more that three times higher that the
e0 and e30 regimes. The findings presented showed that detection of the excessive
Diesel knock operational regime was possible using AE signals recorded from a
sensor located on the engine block although it was found that the AE sensor located
on the head of the engine gave no indication regarding the unacceptably high levels
of Diesel knock. In addition, further findings show that the trends in windowed AE
energy recorded from the block accurately mirrored the level of knock present for
each of the operational regimes as determined using two separate techniques.

Characterisation of Combustion Related Acoustic Emission Sources for Diesel Engine Condition Monitoring
104

Chapter 7: Characterisation of Acoustic Emission Associated with Abnormal Valve-Train Dynamics Small Pushrod-Type Diesel Engine
105
Chapter 7
Characterisation of Acoustic Emission Associated with Abnormal Valve-Train Dynamics in a Small Pushrod-Type Diesel Engine Chapter 7 presents the results of an investigation that sought to use dynamic valve-
train modelling techniques to characterise valve impact related AE activity within
signals recorded from a small, multi-cylinder Diesel engine. To this end Chapter 7
begins by reviewing the role played by engine valve-trains and highlighting the
importance of correctly controlled valve motion. Subsequent sections of Chapter 7
detail the process whereby a dynamic valve-train model specific to the engine used
during the tests was developed and used to predict the characteristics of AE signals
recorded from a test engine operating with abnormal valve-train dynamics induced
using valve lash adjustments. The latter sections of Chapter 7 go on to show that
information regarding dynamic behavior of engine valves can be used as a

Characterisation of Combustion Related Acoustic Emission Sources for Diesel Engine Condition Monitoring
106
framework to characterise recorded AE signals in terms of valve impact related AE
generating events.
7.1 Valve Motion and Valve-Train Dynamics
Correct engine valve motion is necessary in order to maintain optimum engine
reliability, efficiency and performance and indeed, as mentioned by Wang [151]
incorrectly controlled valve motion or “abusive dynamics” is often a major factor in
engine valve failure. Figure 7.1, shows an example of stylised valve displacement,
velocity and acceleration curves and some of the associated features of interest.
Figure 7.1: Valve lift, velocity and acceleration plots [151]
As Figure 7.1 shows, engine valve-train designs typically incorporate a dwell (hard-
stop) into engine valve-train designs by either including a compliant link in the
valve-train or maintaining a set valve lash clearance [196]. This ensures tight valve
closure and the maintenance of good valve-to-insert contact for heat transfer. Figure
7.1 also highlights the incorporation of a closing ramp within the lift plot. Ramps
located at both the opening and closing portions of the cam profile are designed to
maintain correct valve opening and closing velocities and minimise valve train
vibration [197].

Chapter 7: Characterisation of Acoustic Emission Associated with Abnormal Valve-Train Dynamics Small Pushrod-Type Diesel Engine
107
The importance of engine valve motion control is reflected in the extensive and long
running research that has been undertaken regarding cam design and the
development of valve-train dynamic models. For example, earlier examples of cam
and valve motion related research have been presented by Thoren et al. [198],
Dudley [199] and Barkan [200] whilst more recent investigations have been
presented by researchers such as by Jeon et al. [201], Norton et al. [197] and Qin
and He [202]. The dynamic modelling and simulation of overhead valve, push rod
(PR) type valve-trains such as the design shown in Figure 7.2 has also been
investigated by many other researchers.
Examples detailing the dynamic modelling and simulation of PR-type valve-trains
include those by Akiba et al. [203] in which studies were presented whereby both
single and double mass models were used to investigate problematic valve-train
behavior and Akiba and Kakiuchi [204] in which valve impulse force was
investigated using a five mass model. More recent examples include studies by
Mclaughlin and Haque [205] who used multi-body simulation to predict valve-train
behavior such as valve bounce in high speed race engines and Teodorescu et al [206]
whereby an integrated dynamic and tribological approach to the modelling of an
inline, four-cylinder Diesel engine valve-train was undertaken.
Figure 7.2: Schematic showing a pushrod-type engine valve-train [207]

Characterisation of Combustion Related Acoustic Emission Sources for Diesel Engine Condition Monitoring
108
Regarding the applicability and accuracy of dynamic models in modelling valve-
train behavior, Akiba et al. [203] concluded that a single mass model agreed
reasonably well with experimental data although abnormal valve-train behavior such
as spring surge and valve bounce were more effectively modeled using the detailed
two-mass model. Indeed this general observation is supported by Norton [196] as he
points out that it is generally agreed that lumped parameter single degree-of-freedom
(DOF) models adequately model most aspects of the dynamic behaviour of cam-
follower systems. It is apparent that the added complexity of the dynamic models
featured in many recent investigations has to a large degree been necessary in order
to more accurately model specific abnormal valve-train behavior rather than as a
consequence of any general inaccuracy on behalf of the lumped parameter single
DOF models.
7.2 Qualification of Valve Lash Induced Valve Motion
Changes in valve lash settings and the attendant changes in valve-train dynamics are
symptomatic of a broad range of faults on both the valve-side, and the cam-side of
the lash clearance. For example increased valve lash clearances can be symptomatic
of cam side faults such as worn cam lobes and followers whilst decreased valve lash
is indicative of valve side faults such as worn valve seats and faces. In order to
induce realistic abnormal valve-train dynamics as could be expected from faults on
both the valve-side, and the cam-side of the lash clearance, valve lash clearance
adjustments were made on the inlet valve of cylinder 1 in the Perkins engine. As
highlighted by Figure 7.3, these adjustments were made using a feeler gauge in the
recommended manner [143].
Figure 7.3: Diagram highlighting valve lash adjustment [143]

Chapter 7: Characterisation of Acoustic Emission Associated with Abnormal Valve-Train Dynamics Small Pushrod-Type Diesel Engine
109
Inlet valve-lash adjustment values were selected in order to realistically simulate the
dynamic valve-train effects associated with both valve-side, and the cam-side faults.
The dynamic valve-train effects associated with an incipient valve-side fault were
induced by decreasing the valve-lash setting from the standard 0.20 mm setting to
0.10 mm. whilst the dynamic valve-train effects associated with an incipient,
progressively increasing cam-side fault were induced by increasing the valve-lash
setting from the standard 0.20 mm setting to 0.28 mm and 0.35 mm.
Figure 7.4 shows a plot of static (engine not running) valve lift as dictated by the cam
profile in terms of crank-angle. Superimposed on the valve lift plot are the four
horizontal lines that are representative of the four valve-lash settings used during
testing. The point at which the valve-lash setting lines intersect the valve lift plot
represent the point at which the valve-lash clearance is taken up and the valve begins
to follow the valve lift plot as dictated by the cam profile. This information can be
used to predict the approximate valve actuation timing values associated with the
different valve lash settings. As examples, the valve opening and closing regions
highlighted in Figure 7.4 has been reproduced as Figure 7.5(a) and 7.5(b) in which
the approximate valve actuation positions for the different valve lash settings are
identified.
Figure 7.4: Static valve lift and the four valve lash engagement lines with the valve
opening and closing regions highlighted
Valve Opening Region
Valve Closing Region

Characterisation of Combustion Related Acoustic Emission Sources for Diesel Engine Condition Monitoring
110
(a)
(b)
Figure 7.5: Plots showing static valve lift and the four valve lash engagement lines for
the (a) valve opening and (b) valve closing regions
As Figure 7.5(a) shows, when the valve lash is set to the recommended value of 0.20
mm, valve actuation occurs on the opening ramp portion of the valve lift profile at
0.10 mm IVC
0.20 mm IVC
0.28 mm IVC
0.35 mm IVC
0.10 mm IVO
0.20 mm IVO
0.28 mm IVO
0.35 mm IVO

Chapter 7: Characterisation of Acoustic Emission Associated with Abnormal Valve-Train Dynamics Small Pushrod-Type Diesel Engine
111
approximately 350˚. For the 0.10 mm valve lash setting, Figure 7.5(a) shows that
valve actuation also occurs on the opening ramp portion of the valve lift profile
however the 0.10 mm valve lash setting results in early valve opening at
approximately 312˚. With respect to the 0.28 mm and 0.35 mm valve lash settings,
Figure 7.5(a) shows that valve actuation no longer occurs on the opening ramp
portion of the valve lift profile and that these increased lash settings result in late
valve opening. It is also evident that as the valve opening events for the 0.28 mm and
0.35 mm valve lash settings no longer occur on the opening ramp portion of the
valve lift profile, the associated velocities will be larger than the velocities associated
with the 0.10 mm and 0.20 mm lash settings.
With regards to valve closure, Figure 7.5(b) shows that a similar situation to that just
described is once again evident with the valve closing events for the 0.28 mm and
0.35 mm valve lash settings occurring before the closing ramp portion of the valve
lift profile. Figure 7.5(b) also shows that the valve closing event for the 0.20 mm and
0.10 mm valve lash settings both occur on the closing ramp portion of the valve lift
profile although the 0.10 mm lash setting results in late valve closure. At this point it
is again iterated that the plots presented in Figures 7.4 and 7.5 are based solely on
static valve lift data and thus cam profile and so do not include the dynamic effects
of engine operation. Therefore in order to effectively identify and map valve impact
related activity which, as pointed out in Chapter 2 is widely recognised as a source of
AE, it becomes necessary to develop a dynamic valve-train model in order to predict
and characterise the valve lash related changes in dynamic valve motion.
7.3 Development of the Perkins Dynamic Valve-Train Model
The first step taken in dynamically modelling the Perkins valve-train involved the
development of a multi-DOF dynamic model of the Perkins valve-train which is of
an overhead valve, push rod design similar to that previously shown in Figure 7.2.
As was mentioned, valve motion is dictated by the cam profile which acts through
the various components that make up the valve-train whilst the correct valve
actuation timing is maintained with respect to the engine cycle through the use of
toothed timing belts, chains or gears. During valve-train operation, valve motion is
initiated when the valve lash clearance has been taken up and the cam profile begins
to push the tappet (cam follower) and pushrod upwards. This upwards motion in turn

Characterisation of Combustion Related Acoustic Emission Sources for Diesel Engine Condition Monitoring
112
acts through the rocker arm to open the valve which is then closed by the valve
spring.
The Perkins valve-train and its components were modeled using similar modelling
approaches to those detailed by Barkan [200] and Norton [196] as a five-DOF model
which is shown in Figure 7.6. As shown, the camshaft and cam profile have been
modeled as being rigid and acting upon the valve-train through a mass-less “contact
shoe” [196]. The mass of the tappet has been denoted as Mtp whilst the spring rate
and damping parameters have been incorporated into the model as the spring
element Ktp and the dashpot Ctp respectively. The damping effect due to the
lubricated contact between the tappet and the engine structure has also been
incorporated into the model as dashpot Ctpg. Similarly, the mass of the pushrod has
been denoted as Mpr, whilst the spring rate and damping elements have been denoted
as t Kpr and Cpr.
Figure 7.6: The five DOF lumped mass model of the Perkins valve-train

Chapter 7: Characterisation of Acoustic Emission Associated with Abnormal Valve-Train Dynamics Small Pushrod-Type Diesel Engine
113
In modelling the rocker arm, the approach was taken whereby each side of the
rocker arm was treated as a cantilever beam therefore two separate mass elements
were used to account for those portions of the rocker arm associated with the
pushrod and valve sides. These two mass elements were denoted as Mra and Mrb.
Separate spring rates and damping parameters were also defined as being associated
with the pushrod and valve sides of the rocker arm. The spring rate and damping
parameters associated with the pushrod side of the rocker arm were denoted as Kra
and Cra respectively whilst the spring rate and damping parameter associated with
the valve side of the rocker arm were denoted as Krb and Crb.
The bearing contact between the valve stem and valve guide is also incorporated into
the model as Cvbg. The reciprocating portion of the valve spring mass and the
associated masses of the spring retainer, keepers, valve cap and the upper half of the
valve stem were lumped together as Mvs whilst the valve head and lower half of the
valve stem have also been lumped together and denoted as Mvh. The bearing contact
between the rocker arm and the engine structure has also been incorporated as
dashpot Crbg and the spring rate and damping parameter associated with the valve are
denoted as Kv and Cv.
As the Perkins valve fault tests were to be conducted under normal engine operating
conditions, it was assumed that abnormal valve-train behavior such as spring surge
and valve bounce would not occur Therefore, the dynamic model of the Perkins
overhead valve train was simplified into a single mass, singe DOF lumped parameter
dynamic model using a similar procedure to those detailed by Norton [196] and
Barkan [200].
The first step taken in simplifying the dynamic model was to combine the spring,
mass and damper elements on each side of the rocker arm to produce an equivalent
two DOF, two mass model. This model was in turn, further simplified to generate
the equivalent single DOF, lumped mass model in shown in Figure 7.7. In evaluating
valve-train component parameters, component masses were measured directly whilst
spring rates were calculated using relevant material properties. However, at this
point it is noted that whilst it was relatively simple to measure component masses
and evaluate the spring rate terms, the direct evaluation and calculation of individual

Characterisation of Combustion Related Acoustic Emission Sources for Diesel Engine Condition Monitoring
114
damping terms was not possible due to the difficulties associated with calculating
these parameters. Rather, an approach was used whereby it was assumed that the
overall damping effects could be approximated using overall external and internal
damping coefficients. The overall external damping coefficient was used to define
the damping effects occurring due to the lubricated friction between valve-train
components and the engine structure. The overall internal damping coefficient was
used to define the damping occurring between the components of the valve-train
itself. An overall external damping coefficient of 0.185 was adopted from literature
[200] whilst an overall internal damping coefficient of 0.105 was determined
experimentally. Detailed descriptions of this experiment and the determination of the
other relevant parameters are contained within Appendix A.
Figure 7.7: The simplified single DOF lumped mass Perkins valve-train model
Following the development of the single DOF model shown in Figure 7.7, it was
necessary to formulate the equations of motion using a general numerical solution as
the forcing function F(t), could only be defined using valve lift data measured
directly under static conditions from the Perkins engine. The equation to be solved
therefore is shown in general terms as Equation 7.1 with nF being the incremental

Chapter 7: Characterisation of Acoustic Emission Associated with Abnormal Valve-Train Dynamics Small Pushrod-Type Diesel Engine
115
force value, t∆ being the time step increment and τ being the time value within the
interval.
)(2 12 τωξωt
FFFxxx nnn
∆
+ −+=++ (7.1)
Solution of Equation 7.1 results in Equations 7.2 and 7.3 which define valve motion
for the Perkins valve-train. A detailed description of the method used to measure the
valve lift data along with descriptions regarding the derivation and solution of
Equations 7.1, 7.2 and 7.3 is contained within Appendix B.
)()()()( 431211 nnnnn xNxNFNFNx +++= ++ (7.2)
)()()()( 871651 nnnnn xNxNFNFNx +++= ++ (7.3)
Solution of the Perkins dynamic valve-train model enabled the dynamic behavior of
the Perkins engine inlet valve to be characterised in terms of the different valve lash
settings used during the testing phase of the work. More specifically, using the
dynamic model it was possible to predict and map the AE producing valve impact
events in terms of both position and magnitude. As an example, Figure 7.8(a) and
7.8(b) show the static valve lift and dynamic valve motion plots with respect to
crank-angle for the 0.10 mm and 0.35 mm valve lash settings. Figure 7.8(a) shows
that the abnormally small valve lash setting of 0.10mm results in early valve opening
at approximately 310˚ and in late valve closure at approximately 615˚.
Figure 7.8(b) shows that the excessive 0.35 mm valve lash setting results in late
valve opening at approximately 355˚and early valve closure at approximately 570˚.
It is also seen in Figure 7.8(a) and 7.8(b) that for the 0.10 mm lash setting the valve
opening and closing events occur on the opening and closing ramp portions of the
valve lift curve whilst for the excessive valve lash case the valve opening and
closing events occur after and before the respective opening and closing ramps. The
increased velocity and acceleration associated with this late valve actuation results in
a larger initial perturbing force which is in evidence when considering the larger

Characterisation of Combustion Related Acoustic Emission Sources for Diesel Engine Condition Monitoring
116
amplitude “ripple” that is associated with the 0.35mm dynamic valve motion plot
when compared to the 0.10mm dynamic valve motion plot.
(a)
(b)
Figure 7.8: Plots showing static and dynamic valve lift for (a) the 0.10 mm valve
lash setting and (b) the 0.35 mm valve lash setting
The valve opening and closing timing values predicted by the dynamic valve-train
model for the four different valve lash settings are listed in Table 7.1 along with the
corresponding valve opening and closing velocities associated with an engine speed
of 1500 rpm. Of particular note in Table 7.1 are the large increases in both opening

Chapter 7: Characterisation of Acoustic Emission Associated with Abnormal Valve-Train Dynamics Small Pushrod-Type Diesel Engine
117
and closing velocities seen for the 0.28 mm and 0.35 mm valve lash settings as these
valve opening and closing velocities are no longer controlled by the opening and
closing ramps. At this point it is noted that whilst the dynamically modeled valve
motion appears consistent with measurements of static valve lift, validation of the
Perkins valve-train dynamic model using experimental measurements of dynamic
valve motion was not possible given the difficulties associated with undertaking the
necessary tests.
Table 7.1 Predicted valve actuation data from the Perkins dynamic valve-train model
Parameter
Valve Lash Setting 0.10 mm 0.20 mm 0.28 mm 0.35 mm
Valve Opening (crank-angle degrees) 314.2 350.3 353.7 355.7
Valve Closing (crank-angle degrees) 617.6 590.8 573.4 570.8
Valve Opening Velocity (mm/s) 46.8 144.9 273.6 358.8
Valve Closing Velocity (mm/s) 133.9 167.4 730.9 1352.0
Figure 7.9 shows a plot of the predicted valve actuation timing and velocities from
Table 7.1. As Figure 7.9 shows, the predicted valve closing velocities are in general
higher than the respective valve opening velocities with the valve closing velocity
predicted for the 0.28 mm and 0.35 mm valve lash cases being particularly
noteworthy.
Figure 7.9: Dynamically modelled valve timing and velocity values for the different
valve lash settings
IVO Events IVC Events

Characterisation of Combustion Related Acoustic Emission Sources for Diesel Engine Condition Monitoring
118
The predicted valve actuation timing and velocities highlighted in Figure 7.9 provide
a framework with which it is possible to identify and characterise valve impact
related AE activity within signals in terms of both timing and impact related signal
energy associated with different valve-lash settings.
7.4 Characterisation of Valve Lash Related Acoustic Emission
During the abnormal valve-train dynamics series of tests raw AE and AE RMS
signals were both recorded from an AE sensor positioned in close proximity to
cylinder 1 using the sensor and DAQ setup detailed in Chapter 4. Initial observations
were made using the relevant portions of the AE signals identified using the inlet
valve opening (IVO) and closing (IVC) timing values listed in Table 7.1. Figure 7.10
highlights the identification of the relevant AE signal portions process by windowing
the appropriate IVO and IVC portions of a baseline (0.20 mm lash) AE signal from
one engine cycle recorded under full load conditions.
Figure 7.10: Plot showing the IVO and IVC related portions of an AE signal
Figures 7.11(a) to (d) show a close-up view of the four the IVO AE signal windows
that correspond to AE signals recorded under full load engine operation for the 0.10
mm, 0.20 mm, 0.28 mm and 0.35 mm valve lash settings respectively. As can be
seen, it is evident that no IVO related AE activity has been recorded for any of the
lash settings used. This finding illustrates that the AE activity generated by the IVO

Chapter 7: Characterisation of Acoustic Emission Associated with Abnormal Valve-Train Dynamics Small Pushrod-Type Diesel Engine
119
impact event occurring between the valve stem cap and the wear inset located on the
valve-side tip of the rocker arm does not result in appreciable AE activity at the AE
sensor position on the main structure (head) of the engine. Figures 7.12(a) to (d)
show a close-up view of the four the IVC AE signal windows that correspond to the
0.10 mm, 0.20 mm, 0.28 mm and 0.35 mm valve lash settings. As can be seen, in this
case the AE signal pulses associated with the excessive valve lash settings are readily
discernable owing to the direct AE transmission path between the impact event and
AE sensor.
Figure 7.11: Plots showing the IVO AE signal windows with respect to crank-angle
from the (a) 0.10 mm (b) 0.20 mm (c) 0.28 mm and (d) 0.35 mm lash settings
Figure 7.12: Plots showing the IVC AE signal windows with respect to crank-angle
from the (a) 0.10 mm (b) 0.20 mm (c) 0.28 mm and (d) 0.35 mm lash settings

Characterisation of Combustion Related Acoustic Emission Sources for Diesel Engine Condition Monitoring
120
Figure 7.12(a) suggests that the IVC event for the 0.10 mm lash setting does not
result in measurable AE pulses. This could be due to the low valve impact energy
associated with this lash setting. Figure 7.12(b) shows that the 0.20 mm lash setting
does result in an IVC event related AE pulse which is seen to commence at
approximately 590˚ as predicted by the dynamic model. It is noted however that the
particular AE event shown is of relatively small amplitude. It is also noted that the
0.20 mm IVC event closely follows another AE pulse associated with mechanical
events in one of the other cylinders which can be seen to end at approximately the
same time as the IVC event commences. Figures 7.12(c) and 7.12(d) show that the
two excessive valve lash settings resulted in large IVC related AE pulses at positions
similar to those listed in Table 7.1. Based upon these initial observations, further
investigations regarding the IVC event related AE characteristics were undertaken
using averaged AE RMS signals. Before continuing however, the severity of the
induced valve-lash faults were qualified in terms of engine performance.
7.4.1 Valve Lash Setting Related Combustion Effects
The severity of the induced valve-lash faults was quantified in terms of combustion
using averaged cylinder pressure signals. These signals were averaged using
approximately 300 individual engine cycles using simultaneously recorded TDC
signals. Figures 7.13 (a) and (b) shown below show the averaged pressure signals
from the valve lash tests for full load and no load engine operation whilst the 1/3 and
2/3 load plots are not displayed due to their similarity.
(a) (b)
Figure 7.13: Averaged pressure traces from the valve lash tests for (a) full load and
(b) no load engine operating conditions

Chapter 7: Characterisation of Acoustic Emission Associated with Abnormal Valve-Train Dynamics Small Pushrod-Type Diesel Engine
121
As Figures 7.13(a) and (b) show, the various valve lash settings used did not
significantly affect the combustion performance of the Perkins engine throughout the
valve lash tests and indeed, very little difference in terms of both overall amplitude
and pressure trace profile is seen between the various valve lash settings. These lash
setting related combustion effects were further quantified using the full load pressure
traces shown in Figure 7.13(a) whereby using maximum relative pressure values, it
was found that the most severe valve-lash related combustion effect occurred during
the 0.10 mm valve lash setting. The maximum averaged relative pressure value for
the 0.10 mm valve lash setting test was 1.8 % lower in terms of maximum amplitude
than the corresponding value recorded during the baseline (0.20 mm valve lash
setting) test.
7.4.2 Characteristics Associated With Valve Closure
In order to further investigate the AE activity associated with valve closure, AE RMS
signals recorded during the valve-lash tests were averaged using simultaneously
recorded TDC signals using approximately 640 engine cycles from each operational
setting. Those portions of the averaged AE RMS signals related to the valve closure
events were isolated using the IVC position values listed in Table 7.1. The isolated
signal portions encompassed a 15˚ window of the averaged AE RMS signals that
commenced 5˚ before the relevant IVC timing value. These signal portions were
summed over the 15˚ window of the averaged AE RMS signals in order to calculate
the total IVC related window energy.
Figure 7.14 highlights the windowing process described by firstly showing a zoomed
view of the general region between 555˚ and 630˚ where the IVC events for all of the
valve lash settings were expected to occur. Secondly, Figure 7.14 shows the
individual 15˚ signal windows specific to each valve lash setting. It is worth noting
that the signal windows for the excessive lash settings are located close to each other
in terms of crank-angle as the IVC event timing associated with these two valve-lash
settings is no longer governed by the closing ramp portion of the cam profile.
In order to further investigate and qualify whether the 0.10 mm lash related IVC
event resulted in measurable AE, summed AE energy was calculated with the 0.10
mm window being applied to the 0.20 mm valve lash data. Comparisons of these

Characterisation of Combustion Related Acoustic Emission Sources for Diesel Engine Condition Monitoring
122
energy values showed that the summed AE energy values calculated for the 0.10 mm
lash setting were 5% to 20 % larger than the AE energy due to noise alone. Whilst
this suggests that the 0.10 mm lash related IVC event does in fact contribute to the
overall energy values calculated, this contribution is small.
Figure 7.14: Plots of averaged AE RMS showing a zoomed view of the general region
of interest along with the valve lash setting specific signal portions
The summed 15˚ window energy values for each valve lash setting have been
calculated for the four different engine loads and are presented graphically as Figure
7.14. As Figure 7.15 shows these energy values increase with each successive lash
setting. The marginal increase in energy shown between the 0.10 mm and 0.20 mm
cases is consistent with the marginal modeled velocity increases that are associated
with the ramp portion of the valve motion profile.
The progressive increase in summed window energy seen between the 0.20 mm, 0.28
mm and 0.35 mm settings for all of the loads used is also consistent with the
predicted velocity increases as the IVC event moves away from the closing ramp
portion of the valve motion profile due to the increased 0.28 mm and 0.35 mm valve
lash clearances.

Chapter 7: Characterisation of Acoustic Emission Associated with Abnormal Valve-Train Dynamics Small Pushrod-Type Diesel Engine
123
Figure 7.15: Plots of summed window energy values with respect to valve lash setting
Figure 7.16 highlights the association between the summed IVC window AE energy
values and calculated valve velocity by showing a plot of the summed IVC window
energy values averaged across the different load settings along with the
corresponding dynamically modeled IVC velocities normalised using the 0.20 mm
valve lash values. It is recognised however, that further quantitative comparisons are
irrelevant due to the inability to validate the dynamic valve-train model and hence,
accuracy of the calculated IVC velocities.
Figure 7.16: Normalised plots showing summed AE IVC energy and modeled IVC velocity

Characterisation of Combustion Related Acoustic Emission Sources for Diesel Engine Condition Monitoring
124
Figure 7.17 shows the summed window energy values for the different valve lash
settings plotted in terms of the different engine loads used throughout the test. As
seen, total window energy values increase with each successive lash setting however
no consistent trend in terms of engine load is seen. This relationship is also consistent
with the modelling phase outlined as the modelling process outlined highlights
engine (camshaft) speed as the dominant engine operating parameter in terms of
valve-train dynamics.
Figure 7.17: Plots of summed window energy values with respect to engine load
7.5 Chapter Summary
Chapter 7 presented results from an investigation whereby a dynamic valve-train
model specific to the Diesel engine used during the tests was developed and used to
identify and characterise AE activity within signals recorded from a multi-cylinder
Diesel engine operating with abnormal valve-train dynamics induced by way of
incorrectly set valve-lash adjustments. The predicted dynamic valve motion
information showed that reduced valve lash settings would result in early valve
opening and late valve closing whilst it was also predicted that excessive valve lash
settings would result in late valve opening and early valve closing. The predicted
dynamic valve motion also showed that for the reduced lash setting case, the valve
opening and closing events continued to occur on the opening and closing ramp

Chapter 7: Characterisation of Acoustic Emission Associated with Abnormal Valve-Train Dynamics Small Pushrod-Type Diesel Engine
125
portions of the valve lift curve. For the excessive valve lash settings however, the
valve opening and closing events where seen to occur after the opening ramp portion
of the valve lift curve and prior to closing ramp portion of the valve lift curve
respectively. The dynamic modelling predicted that this situation would cause large
perturbing forces in the valve-train which in turn would generate excessive valve
closing velocities.
Initial investigations whereby predicted dynamic valve motion was used in the
interpretation of recorded AE signals showed that the valve opening impact events
did not produce appreciable AE activity due to the tortuous AE propagation path
associated with valve opening impacts. Valve closure however was found to
generate AE activity which was readily identifiable within recorded AE signals.
Interestingly, it was also found that the valve lash settings used did not significantly
affect the combustion performance of the Perkins engine throughout the valve lash
tests.
The final portion of Chapter 7 showed that information regarding the dynamic valve
motion behavior predicted by the dynamic model could be used to investigate the
characteristics of the AE signals recorded from the engine. These sections showed
that summed AE signal window energy values increased with each successive lash
setting. The marginal increase in windowed AE energy shown between the reduced
and normal lash settings was consistent with the predicted marginal velocity
increases associated with the ramp portion of the valve motion profile. The
progressive increase in summed window energy seen between the normal and
increased valve lash settings was found to be consistent with the velocity increases
predicted by the dynamic valve-train model.

Characterisation of Combustion Related Acoustic Emission Sources for Diesel Engine Condition Monitoring
126

Chapter 8: Detection and Characterisation of Acoustic Emission Activity Associated with Piston Slap in a Small Diesel Engine
127
Chapter 8 Detection and Characterisation of Acoustic Emission Activity Associated with Piston Slap in a Small Diesel Engine
The study featured in Chapter 8 aimed to investigate the identification of AE activity
associated specifically with the impacts that occur between the piston skirt and
cylinder wall as a consequence of piston slap. The theoretical timing values of the
piston slap events were predicted using a piston side-force modelling technique. The
theoretical timing values were then used in the interpretation of AE signals recorded
from a Diesel engine in which piston slap of a level consistent with a worn but
serviceable engine was induced by machining down the piston skirt. Analysis of AE
using a windowing technique based upon the predicted piston slap timing
demonstrated that recorded AE signals contained piston slap related activity
however the latter sections in Chapter 8 show that this activity was generally of low

Characterisation of Combustion Related Acoustic Emission Sources for Diesel Engine Condition Monitoring
128
amplitude due to indirect AE propagation paths and the attenuating effects of the
cooling water jacket.
8.1 The Occurrence of Piston Slap
Piston slap occurs when the piston undergoes transverse motion within the piston-
cylinder bore clearance causing it to impact on the cylinder wall. The transverse
motion and subsequent impacts or “slaps” are the result of a direction change in the
sideways acting force component of the overall piston force. There are two sets of
conditions that cause the piston to undergo transverse motion within the cylinder
bore [162].
The first of these conditions is when the horizontal piston force component changes
direction due to the pendular motion of the connecting rod. The second condition is
when the connecting rod undergoes force reversals from compression to tension and
vice versa. It has been found that the above mentioned conditions can produce up to
six piston slap events during one four-stroke engine cycle. These six piston slap
events were found by Fielding and Skorecki [53] to include four piston slap events at
or near the piston TDC and BDC positions and two near piston mid-stroke positions.
It is possible to predict the approximate locations at which the piston slap impacts are
likely to occur by producing a model of the piston side-force and identifying the
crank-angle values associated with reversals in the direction of the piston side-force.
As outlined by Geng and Chen [163], an expression for the piston side-force can be
derived by firstly, formulating an expression describing primary piston motion using
the crank-piston geometry shown in Figure 8.1. Where xp is the displacement of the
piston; l is the length of the connecting rod; rc is the crank radius; Pi is the piston
assembly inertia force; Py is the piston side force and ω is the crankshaft rotational
velocity which in this derivation has been assumed to be constant. Using λ = rc/l, the
displacement of the piston (xp) is derived in terms of crank angle (ωt) as Equation 8.1
(8.1)

Chapter 8: Detection and Characterisation of Acoustic Emission Activity Associated with Piston Slap in a Small Diesel Engine
129
Figure 8.1: Diagram showing crank-piston geometry [163]
Equation 8.1 can be simplified by using its first-term approximation into Equation
8.2.
(8.2)
Differentiating Equation (8.1) gives expressions for both piston velocity and
acceleration:
(8.3)
(8.4)
The inertial piston assembly force Pi is given with m1 denoting the equivalent piston
assembly mass as Equation 8.5. in addition, the changing pendular angle of the
connecting rod piston force changes periodically according to Equation 8.6
(8.5)
(8.6)

Characterisation of Combustion Related Acoustic Emission Sources for Diesel Engine Condition Monitoring
130
Deriving the expression for the piston side force (Py) using the preceding equations
gives Equation 8.7.
(8.7)
Figure 8.2 shows a plot of piston side-force for the Perkins engine as modelled using
Equation 8.7 and as shown by the numbered arrows, there are six crank-angle
positions at which piston side-force reversals take place.
Figure 8.2: Plot showing piston side-force with force reversal positions highlighted
for one complete engine cycle
The six piston side-force reversals in Figure 8.2 – identified by the piston side force
plot crossing the abscissa – indicate that there are six positions within the engine
cycle at which impacts due to piston slap could occur. As Figure 8.2 shows, four of
the piston side-force reversals; and thus potential piston slap impacts, occur at the
TDC and BDC positions. These are labeled as 1, 3, 4 and 5. The other two side-force
reversals, labeled as 2 and 6 in Figure 8.2, occur at or near the piston mid-stroke
position. The six piston side-force reversal positions identified in Figure 8.2 are

Chapter 8: Detection and Characterisation of Acoustic Emission Activity Associated with Piston Slap in a Small Diesel Engine
131
listed and described further in Table 8.1 in terms of their respective crank-angle
positions within the engine cycle.
Table 8.1: Piston side-force reversal positions and descriptions
Side-Force Reversal
Position 1 2 3 4 5 6
Crank-Angle 0˚ 86˚ 180˚ 360˚ 540˚ 642˚
Description Intake-stroke TDC
Intake mid-stroke
Compression BDC
Combustion TDC
Power-stroke BDC
Exhaust mid-stroke
The six piston side-force reversal crank-angle positions identified in Figure 8.2 and
described in Table 8.1 can be used to predict the crank-angle positions in which the
piston slap impacts are likely to occur however it is necessary to incorporate a lag to
account for the time between the piston side-force reversal taking place and the
impact occurring. A previously detailed study [53] highlighted piston slap events as
occurring approximately 15˚ to 20˚ after the crank-angle side-force reversal positions
therefore in identifying the six possible piston slap positions, a lag of 15˚ has been
included. These six piston slap positions are shown in Figure 8.3 and are numbered
in the same order as Table 8.1.
Figure 8.3: Plot showing predicted piston slap impact crank-angle positions with
respect to one complete engine cycle
1 2 4 3 5 6

Characterisation of Combustion Related Acoustic Emission Sources for Diesel Engine Condition Monitoring
132
8.2 Inducing Piston Slap
In order to induce the excess piston slap, one of the original pistons was removed and
replaced with a piston having an undersized skirt diameter. The piston skirt diameter
was machined from the initial diameter of 83.96mm to 83.70mm. This diameter is
listed as being the piston skirt diameter service limit for the engine used in this study
[143]. In qualitative terms, this experimental setup approach was adopted to simulate
a piston having skirt–cylinder wall clearance consistent with an engine reaching the
end of its service life. Figure 8.4(a) shows the original piston whilst Figure 8.4(b)
shows the undersized piston with the machined skirt.
Figure 8.4: Photographs showing (a) the original piston with the anti-friction coating
and (b), the undersized piston with the shiny machined skirt
The Perkins engine was operated with the normal and undersized pistons using four
engine load settings. These load settings were: 0 kW, 5 kW, 10 kW and 15 kW. For
the Perkins test engine these settings represent nominal no-load, 1/3, 2/3 and full-
load engine running conditions respectively.
8.3 Induced Piston Slap Related Combustion Effects
The combustion effects arising from the induced excessive piston slap were
examined using averaged cylinder pressure traces produced using approximately 250
individual engine cycles. Figures 8.5(a) and 8.5(b) show the averaged pressure

Chapter 8: Detection and Characterisation of Acoustic Emission Activity Associated with Piston Slap in a Small Diesel Engine
133
signals from the no-load and full- load engine operating conditions respectively. As
Figures 8.45(a) and 8.5(b) both show, the induced excessive piston slap did not result
in a reduction in combustion performance. Indeed, based upon both Figure 8.5(a) and
(b) it can be seen that a marginal increase in maximum pressure trace amplitude has
been recorded for the excessive piston slap conditions for both no-load and full-load
operating conditions. This marginal increase is thought to be due to the day-to-day
variations in ambient engine operating conditions whilst undertaking the tests.
(a) (b)
Figure 8.5: Averaged pressure traces from the excessive piston slap test for (a) no
load and (b) full load engine operating conditions
The absence of piston slap related combustion effects seen in Figures 8.4(a) and (b)
suggests that the self adjusting nature of the piston ring-cylinder contact maintains
effective combustion even though piston skirt-to cylinder clearances have reached
the engine service limit and become excessive.
8.4 Identification of Piston Slap Related Acoustic Emission
During the piston slap tests AE signals were recorded using the DAQ set-up
described in Chapter 4. Raw AE signals were simultaneously recorded with TDC
signals from four AE sensors positioned on the Perkins engine. Raw AE signals were
converted into AE RMS as a post-processing step whereby the conversion of
digitised raw AE into AE RMS was undertaken as described in Chapter 4. After the
RMS conversion the signals from each engine operation setting were averaged using

Characterisation of Combustion Related Acoustic Emission Sources for Diesel Engine Condition Monitoring
134
approximately 150 individual engine cycles. Figure 8.6 shows normal and excessive
piston slap averaged AE RMS signals for the no-load engine operating condition. As
Figure 8.6 shows, the predicted Perkins piston slap event crank-angle positions have
also been highlighted with the four piston-slap events associated with the TDC and
BDC stroke positions being labeled as events 1, 3, 4, and 5, whilst the two mid-
stroke related piston slap events are labeled as 2 and 6.
Figure 8.6: Plots of averaged AE RMS showing predicted piston slap positions
along with a zoomed window showing piston slap related AE activity
As the zoomed window in Figure 8.6 shows, the excessive piston slap averaged AE
RMS signal shows a readily identifiable peak close to the first predicted mid-stroke
piston slap position labeled as event number 2 however no other readily recognisable
piston slap related events are seen. Comparisons between the normal and excess
piston slap signals with respect to predicted piston slap event positions 1, 3, 4, 5 and
6 shows that no obvious indication of the excess piston slap and indeed, energy
levels in the predicted piston slap event positions are seen to decrease for the excess
slap case.
Figure 8.7(a), (b), (c), and (d) show close-up views of the averaged AE RMS peaks
from event number 2 with regards to the four different engine loads used. As can be
seen, Figure 8.7(a), (b), (c), and (d) also show the averaged AE RMS signals with

Chapter 8: Detection and Characterisation of Acoustic Emission Activity Associated with Piston Slap in a Small Diesel Engine
135
regards to the different sensor positions. It is noted here that no AE signals were
recoded from the AE sensor positioned on the head of the engine (AE sensor 1)
hence, Figure 8.7(a), (b), (c), and (d) only shows plots from AE sensors 2, 3, and 4
located on the engine block.
(a) (b)
(c) (d)
Figure 8.7: Plot showing excess slap averaged AE RMS for the four engine loads

Characterisation of Combustion Related Acoustic Emission Sources for Diesel Engine Condition Monitoring
136
As Figure 8.7(a), (b), (c), and (d) shows, mid-stroke piston slap related AE RMS
peaks are readily identifiable for all of the engine loads used, however, as shown
these piston slap related peaks are of lower amplitude than the no-load peak. The
exact cause of this is unclear however it is thought that the variations in engine
dynamics when the engine is operated in the unloaded condition produces a relative
increase in mid-stroke side-force. Figure 8.7(a), (b), (c), and (d) also shows that the
three AE sensors located on the engine block all recorded AE signals having similar
amplitude.
A detailed examination of the Perkins engine block revealed that the internal cooling
water jacket geometry presented a direct AE source-to-sensor wave propagation to
all of the AE sensors used. The presence of the cooling water jacket between the
source and sensor positions is also thought to be the reason for the absence of readily
observable piston slap activity at the TDC and BDC positions and the relatively low
amplitudes associated with all of the peaks displayed in Figure 8.7.
8.5 Window Energy Based Piston Slap Characterisation
In further examining piston slap related AE activity, six windows were defined using
the six possible piston slap positions shown in Figure 8.3 in order to isolate those
portions of recorded AE RMS signals that were likely to contain piston-slap related
AE activity. The signal windows all encompassed a crank-angle interval of 25˚ and
are displayed in Figure 8.8 along with the averaged AE RMS signals from Figure
8.6. As Figure 8.8 shows, in keeping with the piston slap event numbering detailed
previously, the four piston-slap events associated with the TDC and BDC stroke
positions have been labeled as window 1, window 3, window 4, and window 5 with
window 4 being associated with the combustion TDC whilst the two mid-stroke
piston slap windows have been labeled as windows 2 and 6.
In order to quantify piston slap related AE activity levels, comparisons were made
between the normal and excess piston-slap running conditions using summed piston
slap window energy values. These summed window energy value was calculated by
summing the AE RMS over the 25˚ window length. This procedure was performed
for the six different windows using the no load, 1/3, 2/3 and full load averaged AE
RMS signals.

Chapter 8: Detection and Characterisation of Acoustic Emission Activity Associated with Piston Slap in a Small Diesel Engine
137
Figure 8.8: Plot showing the six piston slap related signal windows
The summed window AE energy values calculated using AE RMS signals from
sensor 2 were normalised using the respective baseline energy value and are
presented graphically as Figure 8.9. As seen, Figure 8.9 shows that the non-
combustion TDC/BDC windows - windows 1, 3, and 5 - all show reductions in
normalised window energy for the piston slap running conditions for all of the
engine loads used.
Figure 8.9: Normalised total window energy values for the six piston-slap windows

Characterisation of Combustion Related Acoustic Emission Sources for Diesel Engine Condition Monitoring
138
This result indicates that the three non-combustion TDC/BDC windows do not
provide any measurable indication of the increased piston slap. The reasons for this
are believed to be the result of a combination of three main factors. The first of these
is the low overall amplitude of recorded piston slap related AE due to the attenuation
associated with the engine cooling-water jacket. The second factor is the offset
gudgeon pin piston design used in the Perkins engine – designed to minimise TDC
and BDC related slap. The third factor is the level of induced slap itself, in that if
larger piston to cylinder clearances had been used in inducing the piston slap,
detection of slap related AE would be easier to achieve.
Figure 8.9 also shows that the combustion related TDC window; window 4, shows an
increase in window energy for the full load case of 18.56% over the baseline value.
As window 4 relates specifically to the piston slap event that occurs during
combustion, this finding could indicate that the load related cylinder pressure
increase, generates an accompanying increase in slap-impact related AE energy.
Although this finding is consistent with the previously reported [53] relationship
between combustion related slap-impact energy increases, and non-combustion slap-
impact energy increases, the marginal nature of the increase and lack of additional
supporting evidence results in this postulation being tenuous.
More definitive increases in AE RMS window energy are however shown in Figure
8.6 for the two mid-stroke windows with window 2 in particular showing large
increases in slap-impact related AE energy. The window 2 slap-impact related AE
energy increases shown are 118.62%, 49.70%, 23.60% and 38.58% for the no-load,
1/3, 2/3 and full-load cases respectively.
The increases in total window energy for window 6 were somewhat smaller with the
window 6 slap-impact related AE energy increases being 23.22%, 3.60%, 0.06% and
39.53% for the no-load, 1/3, 2/3 and full-load cases respectively. It is thought that the
main reason for the mid-stroke piston slap related increases in total window energy is
the lack of other AE activity present at these crank-angle positions in contrast to the
numerous AE generating events occurring at or near the TDC/BDC positions.

Chapter 8: Detection and Characterisation of Acoustic Emission Activity Associated with Piston Slap in a Small Diesel Engine
139
8.6 Chapter Summary
During the course of the investigation into the detection and characterisation of
piston slap related AE activity, it was found that for the engine used, six potential
piston slap events could theoretically occur during a complete engine cycle. Using
information from the model specific windowed portions of averaged AE RMS
signals were analysed for piston slap related AE activity. It was found that piston-
slap related AE activity could be identified however this AE activity was generally of
low relative amplitude when compared to other AE peaks.
Results presented showed that the non-combustion TDC/BDC portions of the AE
RMS signals did not contain any indication of piston-slap related AE activity. It was
thought that this result was due to the combination of three main factors with these
factors being; the AE attenuation associated with the engine cooling-water jacket, the
minimal TDC and BDC related slap due to the offset gudgeon pin piston design used
in the Perkins engine and lastly; the level of the induced slap used during the course
of this investigation. It is recognised that larger piston-cylinder clearances would
result in more readily detected piston slap however, it is believed that inducing
piston slap consistent with the engine service limits, produces results that are more
relevant with regards to AE activity in Diesel engines that are in service. In addition,
interpretation of the results regarding the piston slap event occurring near the
combustion TDC suggests that some indication of piston slap related activity was
given in the averaged AE RMS signals although as was pointed out, these increases
were marginal.
Further results showed that definitive increases in AE RMS window energy occurred
for the two mid-stroke windows. The window 2 position located mid-stroke on the
intake-stroke in particular displayed readily recognisable increases in slap-impact
related AE energy whilst the increases for window 6 were smaller. In explaining
these results, the lack of other AE activity present at these mid-stroke crank-angle
positions was highlighted as the main reason for the readily recognisable mid-stroke
piston slap related increases in total AE RMS window energy.

Characterisation of Combustion Related Acoustic Emission Sources for Diesel Engine Condition Monitoring
140

Chapter 9; Conclusions and Future Work
141
Chapter 9 Conclusions and Future Work The work presented throughout this thesis has addressed the challenge faced in
identifying and discriminating between the different combustion related AE events
that originate as a consequence of the operation of various combustion related
engine components and the combustion process itself. The approach used in
addressing this challenge was based on the premise that integrating detailed
information concerning engine function, knowledge of relevant failure mechanisms
and established modelling techniques could be used in conjunction with AE
measurements to identify and monitor a range of incipient combustion related Diesel
engine faults. Throughout this thesis, this approach has been applied to AE signals
recorded during four major series of tests which featured the inducement of injector

Characterisation of Combustion Related Acoustic Emission Sources for Diesel Engine Condition Monitoring
142
nozzle faults, dual-fuel Diesel knock, abnormal valve-train dynamics and excessive
piston-slap. The approach used has also highlighted the use of AE in a fault
detection role in which faults were detected as a consequence of the ability of AE to
directly monitor fault related mechanisms. Chapter 9 commences by presenting a
summary of the main findings from the four main investigations presented
throughout this thesis. Subsequent sections of Chapter 9 go on to suggest how the
approach detailed throughout this thesis could be implemented as part of a condition
monitoring system whilst latter sections of Chapter 9 identify various aspects of the
research that remain to be investigated further.
9.1 Results Summary and Conclusions
The first investigation aimed to characterise faulty operation of the two common
Diesel fuel injector nozzles in terms of the resultant AE signal features using
detailed knowledge regarding the specific functional features of each nozzle type.
Individual tests involved inducing nozzle faults that would replicate two typically
encountered pintle and hole-type nozzle fault modes. During both tests, accepted
nozzle testing procedures were used to establish the resulting level of nozzle
damage. The results of this investigation showed that differences in injector function
resulted in AE signals that had features which were related to the type of injector
nozzle. More specifically, results of this investigation showed that:
• Increases in the induced hole-type nozzle fault severity resulted in a
progressive reduction in the amount of fuel injected into the combustion
chamber. This in turn generally resulted in a progressive decline in
combustion related AE activity.
• An increase in AE activity was identified during the small hole-type nozzle
fault test and it was postulated that this increase in AE energy was due to an
increased premixed combustion pulse stemming from the sensitivity that DI
combustion systems have to poor fuel spray characteristics.
• The severe hole-type nozzle fault condition resulted in low levels of injector
operation related AE energy however combustion related AE energy was still
identified.

Chapter 9; Conclusions and Future Work
143
• It was seen that the severe hole-type nozzle fault resulted in a substantial
increase in premixed combustion pulse related AE energy which was again
identified as being a consequence of the poor fuel spray characteristics.
• Increased injector operation related AE activity detected under the normal
and small fault conditions were interpreted as indicating increased injector
and fuel flow related AE activity when compared to the misfire and large
fault conditions.
• Results from the induced pintle-type nozzle fault test showed that unlike the
progressive decrease in engine output seen during the hole-type nozzle tests,
the induced pintle nozzle faults did not produce any significant decreases in
cylinder output. This was identified as being the result of the differing
operational characteristics associated with hole and pintle-type fuel injector
nozzles.
• Other results from the pintle-type nozzle fault tests showed that no definitive
AE signal trends regarding the different pintle nozzle faults were identified
however the lack of fault related AE features was pointed out as highlighting
the added immunity to the poor fuel spray characteristics associated with IDI
combustion chamber designs and pintle-type injector nozzles when compared
to DI designs.
The second investigation undertaken aimed to use AE measurements in the detection
and characterisation of dual-fuel Diesel knock in Diesel engines. These tests featured
the use of ethanol fumigation to induce three different dual-fuel Diesel engine
running conditions based on the rate of ethanol substitution. These conditions were
used in order to represent three different operational regimes; normal engine
operation, acceptable dual-fuel Diesel engine operation and engine operation with
unacceptable levels of dual-fuel Diesel knock. Results from this investigation
demonstrated that:
• The combustion pulses and attendant resonant pressure oscillations
associated with dual-fuel Diesel knock are inportant sources of AE activity.

Characterisation of Combustion Related Acoustic Emission Sources for Diesel Engine Condition Monitoring
144
• AE signals were successfully used to detect the excessive dual-fuel Diesel
knock operating condition however sensor position was found to be critical.
• The findings regarding sensor position demonstrated that AE signals from a
sensor located on the block of the engine were able to provide information
regarding the level of dual-fuel Diesel knock however the AE signals from
the head of the engine gave no indication regarding the high levels of
induced knock.
• Further findings also demonstrated that the trends in summed AE energy
recorded from the block mirrored the level of knock present for each of the
three engine operating conditions used.
The third investigation aimed to characterise the AE activity that originates as a
consequence of poor valve-train dynamics and abnormal valve motion. More
specifically, this investigation involved the development of a dynamic model of the
Perkins engine valve-train to characterise and predict valve lash related valve
motion. This predicted valve motion was subsequently used to estimate valve
closing velocities in order to characterise relevant impact related valve closing
portions of corresponding AE signals. The results of this investigation showed that:
• Dynamically modelled valve motion could be used to predict the timing
changes associated with changes in valve lash. It was shown that reduced
valve lash settings resulted in early valve opening and late closing whilst
excessive lash settings resulted in late valve opening and early valve closing.
• Valve closure that is no longer controlled by the ramp portions of the valve
lift (cam) profile results in large valve closing velocities and thus impacts
that are readily discernable within AE signals although it was found that
these engine operating conditions did not affect combustion performance.

Chapter 9; Conclusions and Future Work
145
• It was found that AE activity increased progressively with each successive
lash setting in a manner that reflected the valve closing velocity increases
predicted by the dynamic valve-train model.
• It was further found that a marginal increase in windowed AE energy
between the reduced and normal lash settings was consistent with the
marginal velocity increases associated with the ramp portion of the valve
motion profile.
The fourth investigation aimed to characterise the phenomenon of piston slap as a
source of AE and identify whether any AE signal features could be directly
identified as being caused by piston slap consistent with engine service limits.
Recorded AE signals were interpreted using an established piston side-force
modelling method which was used to identify the potential crank-angle locations of
six piston slap impact events. The timing information regarding the predicted piston
slap events was used to isolate specific portions of averaged AE RMS signals likely
to contain piston slap related AE activity. As detailed in Chapter 8 piston-slap
related AE activity was identified however this AE activity was generally of low
relative amplitude when compared to other AE peaks. In more specific terms, results
from this investigation showed that:
• Piston slap impact related AE activity was identified at the mid-stroke
position occurring during the intake-stroke with smaller increases in slap-
impact related AE activity also being identified at the mid-stroke position
occurring during the exhaust-stroke.
• The mid-stroke piston slap related increases in AE activity were found to be
identifiable as there is a lack of other AE activity present at the two mid-
stroke crank-angle positions.
• The TDC/BDC portions of the AE RMS signals did not contain any explicitly
identifiable piston-slap related AE activity. This result was found to be
mainly due to the indirect AE source to sensor propagation path and the
attenuation associated with the engine cooling-water jacket. It was also

Characterisation of Combustion Related Acoustic Emission Sources for Diesel Engine Condition Monitoring
146
recognised that the offset gudgeon pin piston design could substantially
reduce the strength of the combustion related TDC piston slap impact.
These summarised findings have shown that in the case of each of the investigations
undertaken, an approach based on the integration of detailed engine function
information, knowledge of relevant fault modes and the use of established modelling
techniques was successfully employed to categorise AE activity arising from a range
of combustion related faults.
9.2 Application for Diesel Engine Monitoring
The results presented throughout the preceding chapters have demonstrated that the
approach whereby engine function, fault mode knowledge and modelling techniques
have been used together to successfully categorise AE activity from individual
faults, may be described as an extension and combination of the event mapping and
signal characterisation approaches that have previously been used in addressing the
challenge of identifying and discriminating combustion related AE sources. With
respect to engine condition monitoring, the approach used can be more broadly
defined as a deterministic engine condition monitoring approach as this approach is
reliant on an in-depth understanding of specific underlying AE generating processes
in order to isolate and interpret the relevant fault related AE activity by using
comparisons against baseline or expected AE activity.
It is thought that the approach taken throughout the thesis and the use of AE signals
could be easily adapted and applied for fault diagnosis using preexisting reference
signals such as TDC and injector operation signals and some relatively simple time-
series based signal processing methods. Using the reference signals, relevant
portions of recorded AE signals could be isolated and analysed with regards to
baseline or expected AE activity.
It is also worth noting that this architecture could be automated and applied as an
online Diesel monitoring system either as a “stand-alone” system or as part of an
existing engine monitoring system. In further developing the approach demonstrated
into an engine monitoring system, it is possible to identify a number of key features
that could be addressed. These may include the development of a CM decision-tree

Chapter 9; Conclusions and Future Work
147
type framework or the incorporation of artificial intelligence into the fault diagnosis
process.
9.3 Future Research Directions
With regards to complementing or strengthening the experimental work featured in
this thesis it is possible to identify a number of specific opportunities. These include
the additional characterisation of knock related AE using a specifically developed
knock damage criterion and the additional investigation of AE based knock
detection in other types of engines. Other opportunities for further research include
the additional investigation of other valve related faults using the same approach and
the further development of the piston side force model and piston slap impact
prediction. It is also acknowledged that other combustion component or process
related sources of AE remain and indeed more work remains before the challenge
faced in identifying and discriminating between all possible AE events is addressed
in its entirety.

Characterisation of Combustion Related Acoustic Emission Sources for Diesel Engine Condition Monitoring
148

References
149
References
[1] V. Macian, R. Payri, B. Tormos and L. Montoro (2006). Applying Analytical
Ferrography as a Technique to Detect Failures in Diesel Engine Fuel Injection
Systems. Wear 260 (2006), 562-566.
[2] V. Macian, B. Tormos, A Sala and J. Ramirez (2006). Fuzzy Logic-Based
Expert System for Diesel Engine Oil Analysis Diagnosis. Insight Vol. 48, No
8, August 2006, 462-469.
[3] Ian Morgan, Honghai Liu, George Turnbull and David Brown (2008).
Predictive Unsupervised Organisation in Marine Engine Fault Detection.
Proceedings of the International Joint Conference on Neural Networks, IJCNN

Characterisation of Combustion Related Acoustic Emission Sources for Diesel Engine Condition Monitoring
150
2008, part of the IEEE World Congress on Computational Intelligence, WCCI
2008, Hong Kong, June 1-6, 2008.
[4] D. Watzenig, M. S. Sommer and G. Steiner (2009). Engine State Monitoring
and Fault Diagnosis of Large Marine Diesel Engines. Elektrotechnik &
Informationstechnik (2009), 126/5: 173-179.
[5] D. T. Hountalas, G. C. Mavropoulos and G. Kourbetis (2006). Experimental
Investigation to Develop a Methodology for Estimating the Compression
Condition of DI Diesel Engines. Energy Conversion and Management 47
(2006), 1-18.
[6] Wang Chengdong, Zhang Youyun and Zhong Zhenyuan (2008). Fault
Diagnosis for Diesel Valve Trains Based on Time-Frequency Images.
Mechanical Systems and Signal Processing 22 (2008), 1981-1993.
[7] B. A. Badawi, M. A. Shahin, M. Kolosy, S. A. Shedied and A. Elmaihy
(2006). Identification of Diesel Engine Cycle Events using Measured Surface
Vibration. SAE Technical Paper 2006-32-0097.
[8] Francis E. H. Tay and Lixiang Shen (2003). Fault Diagnosis Based on Rough
Set Theory. Engineering Applications of Artificial Intelligence 16 (2003), 39-
43.
[9] G. Goldwine, G. deBotton, B. Rivin and E. Sher (2004). Studying the
Relationship between the Vibration Signature and the Combustion Process in
Diesel Engines. SAE Technical Paper 2004-01-1786.
[10] J. Antoni, J. Daniere, and F. Guillet (2002). Effective Vibration analysis of IC
Engines Using Cyclostationarity. Part 1 – A Methodology for Condition
Monitoring. Journal of Sound and Vibration (2002) 257(5), 815-837.
[11] D. T. Hountalas and A. D. Kouremenos (1999). Development and Application
of a fully Automatic Troubleshooting Method for Large Marine Diesel
Engines. Applied Thermal Engineering 19 (1999), 299-324.
[12] W. Li, F. Gu, A. D. Ball, A. Y. T. Leung and C. E. Phipps (2001). A Study of
the Noise from Diesel Engines Using Independent Component Analysis.
Mechanical Systems and Signal Processing 15(6), (2001), 1165-1184.
[13] A. Albarbar, Fengshou Gu and Andrew Ball (2010). Diesel Engine Fuel
Injection Monitoring using Acoustic Measurements and Independent
Component Analysis. Measurement (2010), doi:
10.1016/j.measurement.2010.08.003

References
151
[14] J. Jiang, F. Gu, R. Gennish, D. J. Moore, G. Harris and A. D. Ball (2008).
Monitoring of Diesel Engine Combustions Based on the Acoustic Source
Characterisation of the Exhaust System. Mechanical Systems and Signal
Processing 22 (2008), 1465-1480.
[15] M. Desbazeille, R. B. Randall, F. Guillet, M. El Badaoui and C. Hoisnard
(2010). Model-Based Diagnosis of Large Diesel Engines Based on Angular
Speed Variations of the Crankshaft. Mechanical Systems and Signal
Processing 24 (2010), 1529-1541.
[16] J. A. Steel and R. L. Reuben. Recent Developments in Monitoring of Engines
using Acoustic Emission. Journal of Strain Analysis, Vol. 40, No 1, 45-57.
[17] Eric Y. Kim, Andy C. C. Tan and Bo-Suk Yang (2011). Acoustic Emission for
Diesel Engine Monitoring: A Review and Preliminary Analysis. In: Joseph
Mathew, Lin Ma, Andy Tan (Editors). Engineering Asset Management and
Infrastructure Sustainability. Proceedings of the 5th World Congress on
Engineering Asset Management (WCEAM 2010), Springer – Verlag London
Limited, 2011.
[18] Charles A. Amann (1986). Cylinder-Pressure Measurement and its Use in
Engine Research. SAE Technical Paper 852067.
[19] Andrew L. Randolph (1990). Methods of Processing Cylinder-Pressure
Transducer Signals to Maximise Data Accuracy. SAE Technical Paper
900170.
[20] F. Payri, J. M. Lujan, J. Martin and A. Abbad (2010). Digital Signal
Processing of In-Cylinder Pressure for Combustion Diagnosis of Internal
Combustion Engines. Mechanical Systems and Signal Processing 24 (2010)
1767-1784.
[21] Ryan McAllister Douglas (2007). Monitoring of the Piston Ring-Pack and
Cylinder Liner Interface in Diesel Engines Through Acoustic Emission
Measurements. PhD Thesis, Heriot-Watt University.
[22] M. Lapuerta, O. Armas and J. J. Hernandez (1999). Diagnosis of DI Diesel
Combustion from In-Cylinder Pressure Signal by Estimation of Mean
thermodynamic Properties of the Gas. Applied Thermal Engineering 19
(1999), 513-529.
[23] William J. Fleming (2008). New Automotive Sensors – A Review. IEEE
Sensors Journal, Vol. 8, No. 11, November 2008.

Characterisation of Combustion Related Acoustic Emission Sources for Diesel Engine Condition Monitoring
152
[24] Yuhua Li, Fengshou Gu, Georgina Harris, Andrew Ball, Nick Bennet and Ken
Travis (2005). The Measurement of Instantaneous Angular Speed. Mechanical
Systems and Signal Processing 19 (2005), 786-805.
[25] William J. Fleming (1982). Automotive Torque Measurement: A Summary of
Seven Different Methods. IEEE Transactins on Vehicular Technology, Vol.
VT-31, No 3, August 1982.
[26] Stephanie Ginoux and Jean-Claude Champoussin (1997). Engine Torque
Determination by Crankangle Measurements: State of the Art, Future
Prospects. SAE Technical Paper 970532.
[27] P. M. Azzoni, G. Minelli, D. Moro, R. Flora and G. Serra (1999). Indicated
and Load Torque Estimation using Crankshaft Angular Velocity
Measurement. SAE Technical Paper 1999-01-0543.
[28] Terrence S. Brown and W. Stuart Neill (1992). Determination of Engine
Cylinder Pressures from Crankshaft Speed Fluctuations. SAE Technical Paper
920463.
[29] Kazumasa Iida, Katsuo Akishino and Kazuo Kido (1990). IMEP Estimation
from Instantaneous Crankshaft Torque Variation. SAE Technical Paper
900617.
[30] F. Gu, P. J. Jacob and A. D. Ball (1999). Non-Parametric Models in the
Monitoring of Engine Performance and Condition Part 2: Non-Intrusive
Estimation of Diesel Engine Cylinder Pressure and its Use in Fault Detection.
Proceedings of the Institution of Mechanical Engineers, Part D: Journal of
Automobile Engineering 1999 213: 135.
[31] Stephen J. Citron, John E. O’Higgins and Lillian Y. Chen (1989). Cylinder by
Cylinder Engine Pressure and Pressure Torque Waveform Determination
Utilizing Speed Fluctuations. SAE Technical Paper 890486.
[32] Jianguo Yang, Lijun Pu, Zhihua Wang, Yichen Zhou and Xinping Yan (2001).
Fault Detection in Diesel Engine by Analysing the Instantaneous Angular
Speed. Mechanical Systems and Signal Processing (2001) 15(3), 549-564.
[33] Francisco V. Tinaut, Andres Melgar, Hannes Laget and Jose I. Dominguez
(2007). Misfire and Compression Fault Detection Through the Energy Model.
Mechanical Systems and Signal Processing 21 (2007), 1521-1535.

References
153
[34] Mert Geveci, Andrew W. Osburn and Matthew A. Franchek (2004). An
Investigation of Crankshaft Oscillations for Cylinder Health Diagnostics.
Mechanical Systems and Signal Processing 19 (2005), 1107-1134.
[35] Binh Le Khac and Tuma Jiri (2012). Approach to Gasoline Engine Faults
Diagnosis Based on Crankshaft Instantaneous Angular Acceleration. 13th
International Carpathian Control Conference, 2012 - IEEE Xplore Digital
Library.
[36] William J. Fleming (2001). Overview of Automotive Sensors. IEEE Sensors
Journal, Vol. 1, No. 4, December 2001.
[37] Kazuko Satake, Ai Katayama, Hideki Ohkoshi, Takeshi Nakahara and Takashi
Takeuchi (1994). Titania NOx Sensors for Exhaust Monitoring. Sensors and
Actuators B, 20 (1994) 111-117.
[38] J. Riegel, H. Neumann and H. M. Wiedenmann (2002). Exhaust Gas Sensors
for Automotive Emission Control. Solid State Ionics 152-153 (2002), 783-
800.
[39] Mohamad Abu-Qudais (1995). Exhaust Gas temperature for Knock detection
and Control in spark Ignition Engine. Energy Conversion and Management,
Vol. 37, No 9 (1996), pp. 1383-1392.
[40] Jerzy Merisz, Piotr Bogus and Rafal Grzeszczyk (2001). Overview of Engine
Misfire Detection Methods Used in on Board Diagnostics. Journal of Kones.
Combustion Engines, Vol 8, No 1-2.
[41] Jurgen Forster, Andrea Lohmann, Manfred Mezger and Klaus Ries-Muller
(1997). Advanced Engine Misfire Detection for SI-Engines. SAE Technical
Paper 970855.
[42] O. Chiavola and S. Conforto (2001). Exhaust Pressure Signal for Automotive
Engines Diagnosis. SAE Technical Paper 2001-01-3198.
[43] Massimo Ceccarani, Corrado Rebottini and Riccardo Bettini (1998). Engine
Misfire Monitoring for a V12 Engine by Exhaust Pressure Analysis. SAE
Technical Paper 980518.
[44] Markus Willimowski and Rolf Isermann (2000). A Time Domain Based
Diagnostic System for Misfire Detection in Spark-Ignition Engines by
Exhaust-Gas Pressure Analysis. SAE Technical Paper 2000-01-0366.

Characterisation of Combustion Related Acoustic Emission Sources for Diesel Engine Condition Monitoring
154
[45] Mike Johnson and Matt Spurlock (2009). Strategic Oil Analysis: Systems,
Tools and Tactics. Tribology and Lubrication Technology, Apr 2009; 65, 4;
ProQuest Central, pg. 28.
[46] Mike Johnson and Matt Spurlock (2009). Strategic Oil Analysis: Setting the
Test Slate. Tribology and Lubrication Technology, May 2009; 65, 5; ProQuest
Central, pg. 20.
[47] Mike Johnson and Matt Spurlock (2009). Strategic Oil Analysis: Systems,
Developing the Test Slates. Tribology and Lubrication Technology, Jul 2009;
65, 7; ProQuest Central, pg. 28.
[48] Mike Johnson and Matt Spurlock (2009). Strategic Oil Analysis: Selecting
Alarms, Setting Limits. Tribology and Lubrication Technology, Nov 2009; 65,
11; ProQuest Central, pg. 18.
[49] Mike Johnson and Matt Spurlock (2009). Strategic Oil Analysis: Lubricant
Sampling for Quality Results. Tribology and Lubrication Technology, Dec
2009; 65, 12; ProQuest Central, pg. 22.
[50] Renyan Jiang and Xinping Yan. (2008). Condition monitoring of Diesel
Engines. In: Khairy A. H. Kobbacy and D. N. Prabhakar Murthy (Editors).
Complex System Maintenance Handbook. 2008. Springer-Verlag London
Limited
[51] S. D. Haddad, Condition Monitoring and Fault Diagnosis in Diesel Engines.
In: S. D. Haddad, N. Watson, Eds, 1984, Principles and Performance in
Diesel Engineering, Ellis Horwood Limited, England.
[52] Yan Liu, Zhong Liu, Youbai Xie and Zhigang Yao (2000). Research on an
On-Line Wear Condition Monitoring System for Marine Diesel Engine.
Tribology International 33 (2000), 829-835.
[53] B. J. Fielding and J. Skorecki (1969). Identification of Mechanical Sources of
Noise in a Diesel Engine: Sound Originating from Piston Slap. Proceedings of
the Institution of Mechanical Engineers 1969-70, Vol. 184, Pt 1, No 46.
[54] T. Priede (1971). Origins of Automotive Vehicle Noise. Journal of Sound and
Vibration 15 (1), (1971), 61-73.
[55] F. Gu, W. Li, A. D. Ball, and A. Y. T. Leung (2000). The Condition
Monitoring of Diesel Engines Using Acoustic Measurements Part 1: Acoustic
Characteristics of the Engine and Representation of the Acoustic Signals. SAE
Technical Paper 2000-01-0730.

References
155
[56] A. D. Ball, F. Gu, and W. Li, (2000). The Condition Monitoring of Diesel
Engines Using Acoustic Measurements Part 2: Fault Detection and Diagnosis.
SAE Technical Paper 2000-01-0368.
[57] Weidong Li, Robert M. Parkin, Joanne Coy and Fengshou Gu (2002).
Acoustic Based Condition Monitoring of a Diesel Engine Using Self-
Organising Map Networks. Applied Acoustics 63 (2002), 699-711.
[58] F. Molinaro and F. Castanie (1995). Signal Processing Pattern Classification
Techniques to Improve Knock Detection in Spark ignition Engines.
Mechanical Systems and Signal Processing (1995) 9(1), 51-62.
[59] Jean-Hugh Thomas, Bernard Dubuisson and Marie-Agnes Dillies-Peltier
(1997). Engine Knock Detection from Vibration Signals using Pattern
Recognition. Meccanica 32: 431-439, 1997.
[60] M. M. Ettefagh, M. H. Sadeghi, V. Pirouzpanah and H. Arjmandi Tash (2008).
Knock Detection in Spark Ignition Engines by Vibration Analysis of Cylinder
Block: A Parametric Modelling Approach. Mechanical Systems and Signal
Processing 22 (2008), 1495-1514.
[61] Jinseok Chang, Manshik Kim and Kyoungdoug Min (2002). Detection of
misfire and Knock in Spark Ignition Engines by wavelet Transform of Engine
Block Vibration Signals. Measurement Science and Technology 13 (2002),
1108-1114.
[62] Steve Goldman (1999). Vibration Spectrum Analysis: A Practical Approach,
2nd Edition. Industrial Press Inc., New York, New York.
[63] Zunmin Geng, Jin Chen and J. Barry Hull (2003). Analysis of Engine
Vibration and Desigh of an Applicable Diagnosing Approach. International
Journal of Mechanical Sciences 45 (2003), 1391-1410.
[64] J. Antoni, J. Daniere, F. Guillet and R. B. Randall (2002). Effective Vibration
Analysis of IC Engines Using Cyclostationarity. Part II – New Results on the
Reconstruction of the Cylinder Pressures. Journal of Sound and Vibration
(2002) 257(5), 839-856.
[65] Xianhua Liu and R. B. Randall (2005). Blind Source Separation of Internal
Combustion Engine Piston Slap from Other Measured Vibration Signals.
Mechanical Systems and Signal Processing 19 (2005), 1196-1208.

Characterisation of Combustion Related Acoustic Emission Sources for Diesel Engine Condition Monitoring
156
[66] Xianhua Liu, Robert B. Randall and Jerome Antoni (2008). Blind Separation
of Internal Combustion Engine Vibration Signals by a Deflatation Method.
Mechanical Systems and Signal Processing 22 (2008), 1082-1091.
[67] Brian R. Long and Kathy D. Boutin (1996). Enhancing the Process of Diesel
Engine Condition Monitoring. ICE-Vol. 27-1, 1996 Fall Technical
Conference, Volume 1, ASME 1996.
[68] G. Chandroth, A. J. Sharkey and N. E. Sharkey (1999). Vibration Signatures,
Wavelets and Principal Components Analysis in Diesel Engine Diagnostics.
Proceedings of Marine Technology ODRA ’99, 11-13 October 1999, Poland.
[69] G. O. Chandroth, A. J. Sharkey and N. E. Sharkey (1999). Cylinder Pressures
and Vibration in Internal Combustion Engine Condition Monitoring.
Proceedings of the 12th International Conference on Condition Monitoring and
Diagnostic Engineering Management, COMADEM, Sunderland, UK, 7-9 July
1999.
[70] Lixiang Shen, Francis E. H. Tay, Liangsheng Qu and Yudi Shen (2000). Fault
Diagnosis using Rough Sets Theory. Computers in Industry 43 (2000), 61-72.
[71] Piotr Bogus and Jerzy Merkisz (2005). Misfire Detection of Locomotive
Diesel Engine by Non-Linear Analysis. Mechanical Systems and Signal
Processing 19 (2005), 881-899.
[72] A. P. Carlucci, F. F. Chiara and D. Laforgia (2006). Analysis of the Relation
Between Injection Parameter Variation and Block Vibration of an Internal
Combustion diesel Engine. Journal of Sound and Vibration 295 (2006), 141-
164.
[73] Yujun Li, Peter W. Tse, Xin Yang and Jianguo Yang (2009). EMD-Based
Fault Diagnosis for Abnormal Clearance between Contacting Components in a
Diesel Engine. Mechanical Systems and Signal Processing (2009),
doi:10.1016/j.ymssp.2009.06.012.
[74] Hongkun Li, Xiaojiang Ma, Hongying Hu and Quanmin Ren (2006).
Investigation on Reciprocating Engine Condition Classification by using
Wavelet Packet Hillbert Spectrum. Licheng Jiao, Lipo Wang, Xinbo Gao, Jing
Liu and Feng Wu (Editors): Advances in Natural Computation, 2nd
International Conference, ICNC 2006, Xi’an, China, September 24-28, 2006.
Proceedings, Part II, Lecture notes in Computer Science 4222, pp 588-597.
Springer-Verlag 2006, ISBN 3-540-45907-3.

References
157
[75] Yanping Cai, Shu Cheng, Yanping He and Ping Xu (2008). Application of
Image Recognition Technology Based on Fractal Dimention for Diesel Engine
Fault Diagnosis. 9th International Conference for Young Computer Scientists,
doi:10.1109/ICYCS.2008.265.
[76] P. Zhou, H. Li and D. Clelland (2005). Pattern Recognition on Diesel Engine
Working Conditions by Wavelet Kullback-Leibler Distance Method.
Proceedings of the Institution of Mechanical Engineers, Part C: Journal of
Mechanical Engineering Science, 219 (9), pp. 879-887. ISSN 0954-4062.
[77] Y. Gao and R. B. Randall (1999). Reconstruction of Diesel Engine Cylinder
Pressure Using a Time Domain Smoothing Technique. Mechanical Systems
and Signal Processing (1999) 13(5), 709-722.
[78] J. D. Gill, R. L. Reuben, M Scaife, E. R. Brown, and J. A. Steel (1998).
Detection of Diesel Engine Faults Using Acoustic Emission. Proceedings of
the 2nd International Conference on Planned Maintenance Reliability and
Quality, 1998, Oxford, England.
[79] Torben Fog, 1998, Condition Monitoring and Fault Diagnosis in Marine
Diesel Engines. Ph.D. Thesis, Technical University of Denmark.
[80] T. L. Fog, E. R. Brown, H. S. Hansen, L. B. Madsen, P. Sorensen, E. R.
Hansen, J. A. Steel, R. L. Reuben, and P. S. Pedersen. Exhaust Valve leakage
Detection in Large Marine Diesel Engines. In: B. T. Kuhnell and B. K. N. Rao
(Editors), COMADEM ’98 Proceedings of the 11th International Conference
on Condition Monitoring and Diagnostic Engineering Management, Volume I,
CMCM, Monash University, 1998
[81] T. L. Fog, L. K. Hansen, J. Larsen, H. S. Hansen, L. B. Madsen, P. Sorensen,
E. R. Hansen, and P. S. Pedersen. On Condition Monitoring of Exhaust Valves
in Marine Diesel Engines. Proceedings of the IEEE Workshop on Neural
Networks for Signal Processing IX, Piscataway, New Jersey, 1999, pp 554-
563.
[82] Amanda J. C. Sharkey, Gopinath O. Chandroth, and Noel E. Sharkey, (2000).
Acoustic Emission, Cylinder Pressure and Vibration: A Multisensor Approach
to Robust Fault diagnosis. Neural Networks 2000. IJCNN 2000, Proceedings
of the IEEE-INNS-ENNS International Joint Conference on Neural Networks,
Como, Italy.

Characterisation of Combustion Related Acoustic Emission Sources for Diesel Engine Condition Monitoring
158
[83] Amanda J. C. Sharkey. Condition Monitoring, Diesel Engines and Intelligent
Sensor Processing. Intelligent Sensor Processing, (Ref. No. 2001/050),
IEEExplore Digital library.
[84] A. K. Francis, J. D. Gill, R. L. Reuben, J. A. Steel, Investigation into
Identification of Faults in a Small HSDI Diesel Engine Using Acoustic
Emission, DGZfP-Procedings BB 90-CD, Lecture 30, EWGAE, 2004
[85] Niels Henrik Pontoppidan. 2006. Condition Monitoring and Management
from Acoustic Emissions. PhD Thesis, Technical University of Denmark,
Kongens Lyngby, Denmark.
[86] Niels Henrik Pontoppidan, Jan Larsen and Torben Fog, Independent
Component Analysis for Detection of Condition Changes in Large Diesel
Engines, International Journal of COMADEM, 2005.
[87] Niels Henrik Pontoppidan, Sigurdur Sigurdsson and Jan Larsen. (2005).
Condition Monitoring with Mean Field Independent Components Analysis.
Mechanical Systems and Signal Processing 19 (2005) 1337-1347.
[88] Niels Henrik Pontoppidan and Jan Larsen. (2003). Unsupervised Condition
Change Detection in Large Diesel Engines. In: C. Molina, T. Adali, J
LarsenM. Van Hulle, S Douglas and Jean Rouat, Editors, 2003 IEEE
Workshop on Neural Networks for Signal Processing, pp 565-574,
Piscataway, New Jersey.
[89] A. Friis-Hansen and T. L. Fog. Monitoring Exhaust Valve Leaks and Misfire
in Marine Diesel Engines. In: Andrew G. Starr and Raj B. K. N. Rao. (Eds).
Condition Monitoring and Diagnostic Engineering Management, 2001.
Elsevier Science Ltd.
[90] M. H El-Ghamry, R. L. Reuben and J. A. Steel. (2003). The Development of
Automated Pattern Recognition and Statistical Feature Isolation Techniques
for the Diagnosis of Reciprocating Machinery Faults using Acoustic Emission.
Mechanical Systems and Signal Processing 17 (2003) 805-823.
[91] Pornchai Nivesrangsan, (2004). Multi-Source, Multi Sensor Aproaches to
Diesel Engine Monitoring using Acoustic Emission. Ph.D. Thesis, Heriot-
Watt University.

References
159
[92] P. Nivesrangsan, J. A. Steel, R. L. Reuben, 2004, AE Mapping of Engines for
Spatially Located Time Series, Mechanical Systems and Signal Processing 19
(2005), pp1034-1054.
[93] P. Nivesrangsan, J. A. Steel, R. L. Reuben, 2005, Acoustic Emission Mapping
of Engines for Spatially Located Time Series- Part II: Spatial Reconstitution,
Mechanical Systems and Signal Processing 21 (2007), pp1084-1102.
[94] P. Nivesrangsan, J. A. Steel, R. L. Reuben, 2006, Source Location of Acoustic
Emission in Diesel Engines, Mechanical Systems and Signal Processing 21
(2007), pp1103-1114.
[95] A.I.F. Robertson, R.M. Douglas, P. Nivesrangsan, E. R. Brown, J. A. Steel, R.
L. Reuben, 2004, Source Identification Using Acoustic Emission on Large
Bore Cylinder Liners. DGZfP – Proceedings BB 90-CD, Lecture 65, EWGAE
2004.
[96] M. El-Ghamry, J. A. Steel, R. L. Reuben and T. L. Fog, (2005). Indirect
Measurement of Cylinder Pressure from Diesel engines using Acoustic
Emission. Mechanical Systems and Signal Processing 19 (2005), pp 751-765.
[97] R. M. Douglas, J. A. Steel, R. L. Reuben and T. L. Fog, (2006). On-Line
Power Estimation of Large Diesel Engines using Acoustic Emission and
Instantaneous Crankshaft Angular Velocity. International Journal of Engine
Research, Vol 7 (2006).
[98] F. Elamin, F. Gu and A. Ball, (2010), Diesel Engine Injector Faults Detection
Using Acoustic Emissions Technique. Modern Applied Science, Vol 4, No 9,
September 2010.
[99] Elamin, Fathi, Fan, Yibo, Gu, Fengshou and Ball, Andrew (2009), Detection
of Diesel Engine Valve Clearance by Acoustic Emission. Proceedings of
Computing and Engineering Annual Researchers’ Conference 2009,
CEARC’09. University of Huddersfield, Huddersfield, pp 7-13. ISBN
9781862180857.
[100] A. K. Frances, J. Gill, R. L. Reuben, J. A. Steel , A Study of the Variability
of Acoustic Emission Signals from a medium Size Marine Diesel Engine
Under Service Conditions, COMADEM, 2003.
[101] R. M. Douglas, J. A. Steel and R. L. Reuben, (2006).A Study of the
Tribological Behaviour of Piston Ring/cylinder Liner Interaction in Diesel

Characterisation of Combustion Related Acoustic Emission Sources for Diesel Engine Condition Monitoring
160
Engines using Acoustic Emission. Tribology International 39 (2006), 1634-
1642.
[102] Jang Kyu Kim and Min Cheol Lee, (2009), Real-time Diagnostic System
Using Acoustic Emission for a Cylinder Liner in a Large Two-Stroke Diesel
Engine, International Journal of Precision Engineering and Manufacturing,
Vol 10, No 3, July 2009, pp 51-58.
[103] Singh, D., Elamin, Fathi, Gu, Fengshou, Gilkes, Oliver S., Fieldhouse, John
D., Jain, A. K., Sinh Nishan and Singal, S. K. Study of Friction Characteristics
of a Diesel Engine Running on Different Viscosity grade Engine Oils Using
Conventional and Acoustic Emissions Technique. 7th International Conference
on Industrial Tribology (ICIT 2010), 2-4 December 2010, Ranchi, India.
[104] A. Noorul Haq and T. Tamizharasan, (2006). Ring Wear Monitoring in IC
Engines: An Acoustic Emission Approach. International Journal of Advanced
Manufacturing Technology (2007) 31, pp 1148-1155.
[105] J. Z. Sikorska and D. Mba (2008). Challenges and Obstacles in the
Application of Acoustic Emission to Process Machinery. Proceedings of the
Institution of Mechanical Engineers, Part E: Journal of Process Mechanical
Engineering 2008 222:1. DOI: 10.1243/09544089JPME111
[106] F. Millo and C. V. Ferraro (1998). Knock in S.I. Engines: A Comparison
between Different Techniques for Detection and Control. SAE Technical
Paper 982477.
[107] Mark C. Sellnau, Frederic A. Matekunas, Paul A. Battiston, Chen-Fang Chang
and David R. Lancaster (2000). Cylinder-Pressure-Based Engine Control
Using Pressure-ratio management and Low-Cost Non-intrusive Cylinder
pressure Sensors. SAE Technical Paper 2000-01-0932.
[108] Noboru Miyamoto, Tadashi Murayama and Shin-ichi Gotoh (1980). Unique
Measuring Method of Indicator Diagrams using Strain History of Head Bolts.
SAE Technical Paper 800983.
[109] International Standard ISO 22096:2007(E). (2007). Condition Monitoring and
Diagnostics of Machines – Acoustic Emission.
[110] Victor Baranov, Evgeny Kudryavtsev, Gennady Sarychev, Vladimir
Schavelin, 2007, Acoustic Emission in Friction, Elsevier BV.
[111] Jack C. Spanner, 1974. Acoustic Emission Techniques and Applications. Intex
Publishing Company, Evanston, Illinois, USA.

References
161
[112] Trevor J. Holroyd, 2005, The Application of AE in Condition Monitoring,
BINDT Organized CM2005 Conference, Cambridge, July 2005.
[113] K. Ono, 2003, Current Understanding of Mechanisms of Acoustic Emission,
Journal of Strain Analysis, Vol. 40, No 1, IMechE 2005.
[114] Christian U. Grosse, Masayasu Ohtsu, Eds. 2008, Acoustic Emission Testing,
Springer-Verlag, Berlin, Heidelberg.
[115] Vallen, H. (2002), AE Testing Fundamentals, Equipment, Applications.
NDT.net, September 2002, Vol 7, No 9 [online]. Accessed 20 September 2012
at: http://www.ndt.net/article/v07n09/05/05.htm
[116] International Standard ISO 16148:2006 Gas Cylinders – Refillable Seamless
Steel Gas Cylinders – Acoustic Emission Testing (AT) for periodic Inspection.
First Edition, 2006-05-01. ISO.
[117] European Standard I.S. EN 15856:2010, Non-Destructive Testing – Acoustic
Emission – General Principles of AE Testing for the Detection of Corrosion
Within Metallic Surrounding Filled With Liquid. European Committee for
Standardisation (CEN).
[118] Australian Standard 4748-2001, Acoustic Emission Testing of Fibregrass-
Insulated Booms on Elevating Work Platforms. Standards Australia
International.
[119] H. V. Ravindra, Y. G. Srinivasa and R. Krishnamurthy, (1997). Acoustic
Emission for Tool Condition Monitoring in Metal Cutting. Wear 212 (1997),
78-84.
[120] Ichiro Inasaki, (1998). Application of Acoustic Emission Sensor for
Monitoring Machining Processes. Ultrasonics 36, (1998), 273-281.
[121] E. Govekar, J. Gradisek and I. Grabec, (2000). Analysis of Acoustic Emission
Signals and Monitoring of Machining Processes. Ultrasonics 38, (2000), 598-
603.
[122] Xiaoli Li, (2002). A Brief Review: Acoustic Emission method for Tool Wear
Monitoring during Turning. International Journal of Machine Tools and
Manufacture 42, (2002), 157-165.
[123] Leszek Golaski, Pawel Gebski and Kanji Ono, (2002). Diagnostics of
Reinforced Concrete Bridges by Acoustic Emission. Journal of Acoustic
Emission 20 (2002), Acoustic Emission Group.

Characterisation of Combustion Related Acoustic Emission Sources for Diesel Engine Condition Monitoring
162
[124] Archana Nair and C. S. Cai, (2010). Acoustic Emission Monitoring of
Bridges: Review and Case Studies. Engineering Structures 32 (2010), 1704-
1714.
[125] D. Dornfeld, (1992). Application of Acoustic Emission Techniques in
Manufacturing. NDT& E Intenational, Volume 25, Number 6 (1992),
Butterworth-Heinemann Ltd
[126] T. Jayakumar, C. K. Mukhopadhyay, S. Venugopal, S. L. Mannan and Baldev
Raj, 2005). A Review of the Application of Acoustic Emission Techniques for
Monitoring Forming and Grinding Processes. Journal of Materials Processing
Technology 159 (2005), 48-61.
[127] R. M. Douglas, S. Beugne, M. D. Jenkins, A. K. Frances, J. A. Steel, R. L.
Reuben and P. A. Kew, 2004, Monitoring of Gas Turbine Operating
Parameters Using Acoustic Emission, DGZfP-Proceedings BB 90-CD,
EWGAE 2004.
[128] L. Alfayez, D. Mba and G. Dyson, 2004, Detection of Incipient Cavitation and
the Best Efficiency Point of a 2.2 MW Centrifugal Pump Using Acoustic
Emission, DGZfP-Proceedings BB 90-CD, Lecture 39, EWGAE 2004.
[129] D. Mba and Raj B. K. N. Rao, (2006). Development of Acoustic Emission
Technology for Condition Monitoring and Diagnosis of Rotating Machines;
Bearings, Pumps, Gearboxes, Engines and Rotating Structures. The Shock and
Vibration Digest, 2006, Vol 38(1), pp. 3-16.
[130] A. Choudhury and N. Tandon, 2000, Application of Acoustic Emission
Technique for the Detection of Defects in Rolling Element Bearings,
Tribology International 33 (2000) 39-45.
[131] D. Mba, 2003, Acoustic Emissions and Monitoring Bearing Health, Tribology
Transactions, 46(3), pp.447-451, 2003.
[132] N. Jamaludin and D. Mba, 2001. Monitoring Extremely Slow Rolling Element
Bearings: Part 1. NDT&E International 35 (2002), p 349-358.
[133] N. Jamaludin and D. Mba, 2001. Monitoring Extremely Slow Rolling Element
Bearings: Part II, NDT&E International 35 (2002), p 359-366.
[134] N. Jamaludin, D. Mba and R. H. Bannister 2001. Condition Monitoring of
Slow-Speed Rolling Element Bearings Using Stress Waves, Proceedings of
the Institution of Mechanical Engineers, Part E: Journal of Process Mechanical
Engineering 2001, 215 – 245.

References
163
[135] D. Mba and R. H. Bannister and G. E. Findlay (1999). Condition Monitoring
of Low-Speed Rotating Machinery Using Stress Waves Part 1. Proceedings of
the Institution of Mechanical Engineers, Vol 213, Part E: Journal of Process
Mechanical Engineering 1999, 213: 153.
[136] J. D. Gill, E. R. Brown, M Twite, G. Horner, R. L. Reuben and J. A. Steel,
(1998), Monitoring of a Large Reciprocating Compressor, COMADEM
Proceedings 1998.
[137] N. B. Jones and Yu-Hua Li, A Review of Condition Monitoring and Fault
Diagnosis for Diesel Engines. Department of Engineering, University of
Leicester, Leicester, UK In: Tribofest journal 6-3, March 2000
[138] Staton Abbey, 1968, Diesel Fault Tracing Maintenance and Repair, 4th Edition,
Sir Issac Pitman and Sons Ltd, London, UK.
[139] J. D. Gill, R. L. Reuben, J. A. Steel, M. W. Scaife, and J. Asquith (2000). A
Study of Small HSDI Diesel Engine Fuel Injection Equipment Faults using
Acoustic Emission. Journal of Acoustic Emission, Vol. 18, January –
December 2000.
[140] Horst Bauer, Editor in Chief. 2004. Diesel-Engine Management, 3rd Edition.
Robert Bosch GmbH, Postfach 1129, D-73201, Plochingen.
[141] Bernard Challen and Rodica Baranescu. Editors. 1999. Diesel Engine
Reference Book, 2nd Edition. Butterworth-Heinemann, Oxford, UK.
[142] Klaus Mollenhauer and Helmut Tschoke, Editors. 2010. Handbook of Diesel
Engines. Springer-Verlag, Berlin Heidelberg.
[143] Perkins Service Manual 400C Series. Service Manual Publication Number:
RENR9825.
[144] Walter Egler, Rolf Jurgen Giersch, Friedrich Boecking, Jurgen Hammer,
Jaroslav Hlousek, Patrick Mattes, Ulrich Projahn, Winfied Urner and Bjorn
Janetzky (2010). Chapter 5: Fuel injection Systems. In: K. Mollenhauer, H.
Tschoeke (Editors). Handbook of Diesel Engines. Springer-Verlag Berlin
Heidelberg 2010, DOI 10.1007/978-3-540-89083-6_5.
[145] Jorg Ullmann, Marion Geduldig, Heinz Stutzenberger, Rinaldo Caprotti and
Graham Balfour (2008). Investigation into the Formation and Prevention of
Internal Diesel injector Deposits. SAE Technical Paper 2008-01-0926.
[146] A. Birgel, N. Ladommatos, P. Aleiferis, S. Zulch, N. Milovanovic, V. Lafon,
A. Orlovic, P. Lacey and P. Richards (2008). Deposit Formation in the Holes

Characterisation of Combustion Related Acoustic Emission Sources for Diesel Engine Condition Monitoring
164
of Diesel Injector Nozzles: A Critical Review. SAE Technical Paper 2008-01-
2383.
[147] M. Gavaises, D. Papoulias, A. Andriotis, E. Giannadakis and A.
Theodorakakos (2007). Link between Cavitation Development and Erosion
Damage in Diesel Injector Nozzles. SAE Technical Paper 2007-01-0246.
[148] A. K. Hannum (1960). Why Valves Fail. SAE Paper No 600432, Society of
Automotive Engineers, Warrendale, PA, 1960.
[149] J. R. Kelley and N. J. Musil. Valve Failure Fingerprints. SAE Paper No
620591, Society of Automotive Engineers, Warrendale, PA, 1962.
[150] Vernon A. Johnson and Clifford W. Galen. Diesel Exhaust Valves. SAE Paper
No 660034, Society of Automotive Engineers, Warrendale, PA, 1962.
[151] Yushu Wang. 2007. Introduction to Engine Valvetrains. SAE International,
400 Commonwealth Drive, Warrendale, PA, 15096-0001.
[152] Y. S. Wang, S. K. Schaefer, C. Bennett and G. C. Barber. 1995. Wear
mechanisms of Valve Seat and Insert in Heavy Duty Diesel Engine. SAE
Paper No 952476, Society of Automotive Engineers, Warrendale, PA.
[153] R. Lewis and R. S. Dwyer-Joyce. (2003). Combating Automotive Engine
Valve Resession: A Case Study. Tribology and Lubrication Technology, 59
(10). pp. 48-51.
[154] Nurten Vardar and Ahmet Ekerim. (2010). Investigation of Exhaust Valve
Failure in Heavy-Duty diesel Engine. Gazi University Journal of Science
23(4). pp. 493-499.
[155] Everett B. Arnold, Maralyn A. Bara, Daniel M, Zang, T. N. Tunnecliffe and
Jerry Oltean. 1988. Development and Application of a Cycle for Evaluating
Factors Contributing to Diesel Engine Valve Guttering. SAE Paper No
880669, Society of Automotive Engineers, Warrendale, PA.
[156] J. R. Nicholls. (1994). Coatings and Hardfacing Alloys for Corrosion and
Wear resistance in Diesel Engines. Materials Science and Technology,
November 1994, Vol. 10.
[157] Peter Anderson, Jaana Tamminen and Carl-Erik Sandstrom, 2002, Piston Ring
Tribology; A Literature Survey, VTT Industrial Systems, Metallimiehenkuja 6,
P.O. Box 1702, FIN-02044 VTT, Finland.

References
165
[158] P. A. Lakshiminarayanan and Nagaraj S. Nayak (2011). Critical Component
Wear in Heavy Duty Engines. John Wiley andf Sons (Asia) Pte Ltd, ISBN:
9780470828830.
[159] F. S. Silva (2006). Fatigue on Engine Pistons – A Compendium of Case
Studies. Engineering Failure Analysis 13 (2006), 480-492.
[160] L. Gara, Q. Zou, B. P. Sangeorzan, G. C. Barber, H, E, McCormick and M. H.
Mekari (2010). Wear Measurement of the Cylinder Liner of a Single Cylinder
Diesel Engine Using a Replication Method. Wear 268 (2010) 558-564.
[161] M. Priest and C, M. Taylor (2000). Automotive Engine Tribology –
Approaching the Surface. Wear 241 (2000) 193-203.
[162] S. D. Haddad and H. L. Pullen. Piston Slap as a Source of Noise and Vibration
in Diesel Engines. Journal of Sound and Vibration 1974, 34(2).
[163] Z. Geng and J. Chen. Investigation into Piston-slap Induced Vibration for
Engine Condition Simulation and Monitoring. Journal of Sound and Vibration
282 (2005), pp.735-751.
[164] Sam D. Haddad and Kek-Tjen Tjan. An Analytical Study of Offset Piston and
Crankshaft Designs and the Effect of Oil Film on Piston Slap Excitation in a
Diesel Engine. Mech. Mach. Theory, Vol 30, No2, pp. 271-284, 1995.
[165] Minoru Okubo, Hiroshi Kanda and Tohru Yonezawa. Analysis and Reduction
of Piston Slap Noise in Diesel Engines, 1989, SAE Technical paper 890127.
[166] Kazuhiro Nakashima, Yuji Yajima and Kyochi Suzuki. Approach to
Minimization of Piston Slap Force for Noise Reduction – Investigation of
Piston Slap Force by Numerical Simulation. JSAE Review 20 (1999), pp. 211-
216.
[167] Y. Fujimoto, T. Suziki and Y. Ochiai (1979). Some New Results Concerning
Parameters Influencing Piston Slap in Reciprocating Machinery. In: Noise and
Vibrations of Engines and Transmissions, I Mech E conference Publications
1979-10. ISBN 0 85298 439 1.
[168] Yu-Kang Zhou, Jiu-Gen He and F. G. Hammitt. Cavitation Erosion of Diesel
Engine Wet Cylinder Liners. Wear, 76 (1982), pp. 321-328.
[169] Yu-Kang Zhou, Jiu-Gen He and F. G. Hammitt. Cavitation Erosion of Cast
Iron Diesel Engine Liners. Wear, 76 (1982), pp. 321-328.
[170] Tohru Yonezawa and Hirosi Kanda. Analysis of Cavitation Erosion on
Cylinder liner and Cylinder Block. 1989. SAE Technical Paper 850401.

Characterisation of Combustion Related Acoustic Emission Sources for Diesel Engine Condition Monitoring
166
[171] Bertrand D. Hsu. Practical Diesel-Engine Combustion Analysis. Society of
Automotive Engineers, Inc. Warrendale, PA, USA. 2002.
[172] Y. Ren, R. B. Randall, B. E. Milton. Influence of the Resonant Frequency on
the Control of Knock in Diesel Engines. In: Proceedings of the Institution of
Mechanical Engineers, Part D: Journal of Automobile Engineering. 1999.
[173] John B. Heywood. Internal Combustion Engine Fundamentals. McGraw-Hill
Inc. 1988.
[174] R. J. Nates and A. D. B. Yates. (1994). Knock Damage Mechanisms in Spark-
Ignition Engines. SAE Technical Paper 942064.
[175] R. J. Nates. (2000). Thermal Stresses Induced by Knocking Combustion in
Spark-Ignition Engines. SAE Technical Paper 2000-01-1238.
[176] John Fitton and Roy Nates. (1996). Knock Erosion in Spark-Ignition Engines.
SAE Technical Paper 962102.
[177] J. C. Fitton and R. J. Nates. (1992). Investigation into the Relationship between
Knock Intensity and Piston Seizure. R & D Journal, South African Institute
Mechanical Engineers, Vol. 8, No2, (July 1992).
[178] M. H. Saidi and K. Eisazadeh Far (2005). Analysis of Combustion Process in
Dual Fuel Diesel Engines: Knock Phenomenon Approach. SAE Technical
Paper Series, Paper # 2005-01-1132. 2005.
[179] G. A. Karim, S. R. Klat and N. P. W. Moore. Knock in Dual-Fuel Engines.
Proceedings of the Institution of Mechanical Engineers 1966-67, Vol. 181, Pt1,
No 20.
[180] Z. Liu and G. A. Karim. 1995. Knock Characteristics of Dual-Fuel Engines
Fuelled With Hydrogen Fuel. International Journal of Hydrogen Energy, Vol.
20, No 11, pp. 010-024
[181] M. H El-Ghamry, E. Brown, I. G. Ferguson, J. D. Gill, R. L. Reuben, J. A.
Steel, M Scaife and S. Middleton (1998). Gaseous Fuel Quality Identification
for a Spark Ignition Gas Engine Using Acoustic Emission. COMADEM
Proceedings 1998.
[182] Cummins Engine Company Limited Automotive Engine Datasheet 91210,
Date of Issue: 31/1003.
[183] Personal communications at Highway Diesel Service - Bosch Diesel Centre, 26
Annie Street, Coopers Plains QLD, Australia on 7th October 2010

References
167
[184] MatLab® Signal Processing Toolbox™ Reference (2012), The MathWorks,
Inc.
[185] MatLab® SimPowerSystems™ Reference (2012), Hydro-Quebec and the
MathWorks, Inc.
[186] Doug Woodyard. 2009, Pounder’s Marine Diesel Engines, Elsevier Ltd.
[187] Withit Chatlatanagulchai, Kittipong Yaovaja, Shinapat Rhienprayoon and
Krisada Wannatong. 2011. Fuzzy Knock Control of Diesel-Dual-Fuel Engine.
SAE Technical Paper 2011-01-0690.
[188] John Kubesh and Diana D. Brehob. 1992. Analysis of Knock in a Dual-Fuel
Engine. SAE Technical Paper 922367.
[189] O. M. I. Nwafor. Knock Characteristics of Dual-Fuel Combustion in Diesel
Engines Using natural Gas as Primary Fuel. Sadhana Vol. 27, Part 3, June
2002, pp. 375-382.
[190] Noboru Noguchi, Hideo Terao and Chikanori Sakata. 1996. Performance
Improvement by Control of Flow Rates and Diesel Injection Timing on Dual-
Fuel Engine with Ethanol. Bioresource Technology 5691996), pp. 35-39.
[191] M. Abu-Qudais, O Haddad, and M. Qudaisat. The Effect of Alcohol
Fumigation on Diesel Engine Performance and Emissions. Energy Conversion
and Management 41, (2000), pp. 389-399.
[192] Robert Hickling, Douglas A. Feldmaier, Francis H. K. Chen and Josette S.
Morel. Cavity Resonances in Engine Combustion Chambers and Some
applications, J. Acoust. Soc. Am., Vol. 73, No 4, April 1983.
[193] R. Hickling, D. A. Feldmaier, Francis and S. H. Sung. Knock-induced Cavity
Resonances in Open Chamber Diesel Engines, J. Acoust. Soc. Am., 65 (6),
June 1979.
[194] A. J. Torregrosa, A. Broatch, X. Margot and V. Marant. Combustion Chamber
Resonances in Direct Injection Automotive Diesel Engines: A Numerical
Approach. Int. J. Engine Res. Vol. 5, No 1, 2004.
[195] J. A. Eng. Characterization of Pressure Waves in HCCI Combustion. SAE
Technical Paper Series, Paper 2002-01-2859. Society of Automotive
Engineers, Inc. 2002.
[196] Norton, Robert L. (2009). Cam Design and Manufacturing Handbook, 2nd
Edition. Industrial Press Inc. 989 Avenue of the Americas, New York, NY,
10018, USA.

Characterisation of Combustion Related Acoustic Emission Sources for Diesel Engine Condition Monitoring
168
[197] Robert L. Norton, David Eovaldi, James Westbrook III and Ronald L. Stene
(1999). Effect of Valve-Cam Ramps on Valve train Dynamics. SAE Technical
Paper 1999-01-0801.
[198] T. R. Thoren, H. H. Engemann and D. A. Stoddart (1952). Cam Design as
Related to Valve Train Dynamics. SAE Technical Paper 520208.
[199] Winston M. Dudley (1948). New Methods in Valve Cam Design. SAE
Technical Paper 480170.
[200] Philip Barkan. (1953). Calculation of High-Speed Valve Motion with a
Flexible Overhead Linkage. SAE Technical Paper 530261.
DOI:10.4271/530261.
[201] H. S. Jeon, K. J. Park and Y. S. Park (1989). An Optimal Cam Profile Design
Considering Dynamic Characteristics of a Cam-Valve System. Experimental
Mechanics, Vol. 29, No. 4, P. 357 – 363.
[202] W. J. Qin and J. Q. He (2010). Optimum Design of Local Cam Profile of a
Valve Train. Proceedings of the Institution of Mechanical Engineers, Part C:
Journal of Mechanical Engineering Science 2010 224: 2487. DOI:
10.1243/09544062JMES2116.
[203] Kishiro Akiba, Akira Shimizu and Hiroshi Sakai (1981). A Comprehensive
Simulation of High Speed Driven Valve Trains. SAE Technical Paper 810865.
[204] Kishiro Akiba and Toshiaki Kakiuchi (1988). A Dynamic Study of Engine
Valving Mechanisms: determination of the impulse Force Acting on the Valve.
SAE Technical Paper 880389.
[205] S. Mclaughlin and I Haque (2002). Development of a Multi-Body Simulation
Model of a Winston Cup Valvetrain to Study Valve Bounce. Proceedings of
the Institution of Mechanical Engineers, Part K: Journal of Multi-body
Dynamics 2002 216: 237. DOI: 10.1177/146441930221600304.
[206] M. Teodorescu, M. Kushwaha, H. Rahnejat and D. Taraza (2005).
Elastodynamic Transient Analysis of a Four-Cylinder Valvetrain System with
Camshaft Flexibility. Proceedings of the Institution of Mechanical Engineers,
Vol. 219, Part K: Journal of Multi-body Dynamics 2005. DOI:
10.1243/146441905X9962.
[207] Gordon P. Blair (1999). Design and Simulation of Four-Stroke Engines.
Society of Automotive Engineers, Inc, 400 Commonwealth Dr, Warrendale,
PA 15096-0001, USA.

References
169
[208] MatLab® Curve Fitting Toolbox™ User’s Guide (2011), The MathWorks, Inc.

Characterisation of Combustion Related Acoustic Emission Sources for Diesel Engine Condition Monitoring
170

Appendix A; Calculation of the Perkins Valve-Train Dynamic Model Parameters
171
Appendix A
Calculation of the Perkins Valve-Train Dynamic Model Parameters
Valve-train component masses were measured directly and the measured valve and
valve spring masses were divided and assigned to the relevant mass elements
according to procedures detailed previously [196, 200] with the valve head and
valve spring mass elements being denoted as Mvh and Mvs respectively. The
measured valve-train component masses are listed in Table A.1 Spring rates for the
pushrod kpr, and tappet kcm, were calculated using Equation A.1 with A being the
cross-sectional area, E Young’s modulus for the material, and where l is the length
of the component. The spring rate ksp, for the valve coil spring was calculated using
Equation A.2 where d is the wire diameter, G the modulus of rupture, D, the mean
coil diameter and N being the number of coils.

Characterisation of Combustion Related Acoustic Emission Sources for Diesel Engine Condition Monitoring
172
Table A.1: Measured valve-train component masses Component Mass
(grams) Pushrod 41 Tappet 40 (estimated)
Rocker 41 Adjustment Screw 8
Inlet Valve 65
Valve Cap 4
Valve Keepers 2
Spring Retainer 13
Valve Spring 20
The rocker arm was approximated as a double cantilever beam and the spring rates
associated with each side were calculated separately according to the equation
reproduced as Equation A.3 with E being Young’s modulus for the material, l being
the length of the component, and where I is the cross-sectional second moment of
area:
(A.1)
(A.2)
(A.3)
Evaluation of the damping parameters was addressed by assuming that the overall
damping effects could be approximated using external and internal damping
coefficients. The external damping coefficient was defined as addressing the
damping effects occurring due to the lubricated friction between valve-train
components and the engine structure whilst the internal damping coefficient
addressed the damping effects occurring between the components of the valve-train
itself. An external damping coefficient of 0.185 was adopted from Barkan [200]
whilst the internal damping coefficient was calculated in a fashion such as that
detailed by Norton [196] using vibration response data measured directly from the

Appendix A; Calculation of the Perkins Valve-Train Dynamic Model Parameters
173
Perkins engine valve-train with a B&K 8307 accelerometer. As Figure A.1(a) and
A.1(b) show, the accelerometer was mounted on the valve side of the rocker arm
using cyanoacrylate glue and a number of vibration responses were measured whilst
generating light impacts on the adjustment screw which as Figure A.1(b) shows was
located on the pushrod side of the rocker arm.
Figure A.1: The accelerometer and adjustment screw on the Perkins valve-train rocker arm
A total of 20 vibration responses were measured with the valve-train mechanism in
two different engagement positions in order to record vibration responses from the
valve-train whilst under different preload conditions. These valve-train engagement
positions were the valve “just opening” and “fully open” positions. Figure A.2
shows a typical example of a valve-train vibration response.
Figure A.2: Plot showing a typical Perkins valve-train vibration response

Characterisation of Combustion Related Acoustic Emission Sources for Diesel Engine Condition Monitoring
174
The internal damping coefficient (ζ) for each valve-train vibration response was
calculated according to the procedure outlined by Norton [196] using Equations
A.4a and A.4b in which δ is the logarithmic decrement and mx is the thm peak in the
vibration response plot measured.
(A.4a)
(A.4b)
The individual damping coefficient values calculated were then averaged giving an
overall average damping coefficient value of 0.105.

Appendix B: Derivation and Solution of the Perkins Valve-Train Equations of Motion
175
Appendix B
Derivation and Solution of the Perkins Valve-Train Equations of Motion
Following the development of the single DOF model, a free body diagram
highlighting the relevant forces acting upon the effective mass, Meff was produced
in order to derive the equations of motion. The free body diagram developed has
been reproduced as Figure B.1 with the valve spring force denoted as Fs; the linkage
compression force denoted as Fc; the coulomb damping term denoted as Ccb and the
viscous damping term denoted as Ceff. Summing the terms shown in Figure B.1
using Newton’s second law it is possible to formulate the equation of motion for the
Perkins valve-train as Equation B.1:

Characterisation of Combustion Related Acoustic Emission Sources for Diesel Engine Condition Monitoring
176
Figure B.1: The free body diagram from the single DOF lumped mass model
xMeffhyKsyYybyyyYKeffyYKeff
=+−−−−−−− )()()())(()( βϕ (B.1)
Using the variable substitutions shown as Equation B.2a, B.2b and B.2c, where x is
the displacement of Meff relative to the cam follower (mass-less “contact shoe”); x
is the velocity of Meff relative to the contact shoe and x is the acceleration of Meff
relative to the contact shoe gives Equation B.3:
yYx −= (B.2a)
yYx −= (B.2b)
yYx −= (B.2c)
)()())((1 hYKsYYMeffbxxKeffyy
KeffKsxMeff +++=−−
−++
ββϕ (B.3)

Appendix B: Derivation and Solution of the Perkins Valve-Train Equations of Motion
177
The term; )( hYKsYYMeff +++ β is the forcing function ( )(tF ) where Y , Y and
Y are the displacement, velocity and acceleration inputs associated with the cam
profile.
)()( hYKsYYMefftF +++= β (B.4)
Equation B.3 is two equations depending on whether y is positive or negative. The
substitutions 1K and 2K for when y is positive and negative respectively are
defined below as Equations B.5a and B.5b.
111 KKeffKeffKsKeff
yy
KeffKs
=
−−=
−+ ϕϕ
(B.5a)
211 KKeffKeffKsKeff
yy
KeffKs
=
+−=
−+ ϕϕ
(B.5b)
Using Equations B.5a and B.5b and the following substitutions listed as Equation
B.5c, B.5d, B.5e and B.5f it is possible to define valve motion for whenever the
valve-train linkage is in a state of compression (positive x values).
MeffK1
1 =ω (B.5c)
MeffK 2
2 =ω (B.5d)
11 2 ω
βξMeffb +
= (B.5e)
22 2 ω
βξMeffb +
= (B.5f)

Characterisation of Combustion Related Acoustic Emission Sources for Diesel Engine Condition Monitoring
178
The equations defining valve motion when the valve-train linkage is in a state of
compression are therefore detailed as Equation B.6a and B.6b. Equation B.6a is
valid for the valve opening conditions (when y > 0) whilst Equation B.6b is valid
for the valve closing conditions (when y < 0).
)(12 2111 tF
Meffxxx =++ ωωξ (B.6a)
)(12 2222 tF
Meffxxx =++ ωωξ (B.6b)
As seen Equations B.6a and B.6b are given in terms of x which in physical terms
defines the displacement of mass Meff, relative to the mass-less contact shoe.
Dynamic valve motion y is defined using parameters detailed in Figure 7.7 as:
xZy −−= ε or: xYy −= (B.7)
Equations B.6a and B.6b define valve motion for the Perkins valve-train linkage
however in order to solve these equations it is necessary to firstly define the relevant
boundary conditions. The boundary conditions for valve opening are:
• When the valve is seated, the equivalent cam lift (Z) is taken up by the valve
lash clearance and the compression of the valve-train linkage until the cam
lifting force exceeds the opposing forces and the valve (Meff) begins to
accelerate off the valve seat
• The point at which the Meff begins to accelerate off the valve seat is defined
as 0θ and occurs when the net force on Meff becomes positive
• Prior to 0θ the linkage compression force is )( ε−ZKeff and the opposing
forces are those due to atmospheric and cylinder pressure differences, spring
preload, spring vibration and friction

Appendix B: Derivation and Solution of the Perkins Valve-Train Equations of Motion
179
Assuming the effects due to pressure differences friction and spring vibration are
negligible 0θ can be defined as the instant when )()()( YKeffhKsYKeff ϕ+= which
if rearranged gives Equation B.8:
)(0 hKeffKsZ
+= ε (B.8)
As is shown, Equation B.8 is used to calculate the equivalent cam lift value at
which 0θ occurs. 0θ is then defined using measured equivalent lift data that has been
recorded with respect to crank-angle. At 0θ it is also noted that 00 =y and 00 =y as
the valve has not yet moved, therefore a second initial boundary condition can be
defined using Equation B.9a and B.9b:
0000 YyYx =−= (B.9a)
0000 YyYx =−= (B.9b)
Upon seating Equations B.6a and B.6b governing valve motion are no longer valid.
The boundary condition for valve closing is given by Equation B.10 whilst the valve
closing velocity can be calculated using Equation B.11.
0=−= xYy (B.10)
xYy −= (B.11)
Having specified the relevant boundary conditions it was now necessary to define a
general numerical solution in order to solve Equations B.6a and B.6b as F(t) can only
be defined using numerical valve lift data measured directly from the Perkins
engine. Therefore to solve the 2nd order differential equation of motion it is assumed
that F(t) can be specified using a linear equation reproduced here as Equation B.12
with nF being the incremental force value, t∆ being the time step increment and τ
being the time value within the interval.

Characterisation of Combustion Related Acoustic Emission Sources for Diesel Engine Condition Monitoring
180
)()( 1 τt
FFFtF nnn
ttnttnt
∆
+∆+==
−+= (B.12)
The equation to be solved therefore is shown in general terms as Equation B.13:
)(2 12 τωξωt
FFFxxx nnn
∆
+ −+=++ (B.13)
The solution of Equation B.13 for the Perkins valve-train can be written as Equations
B.14 and B.15.
)()()()( 431211 nnnnn xNxNFNFNx +++= ++ (B.14)
)()()()( 871651 nnnnn xNxNFNFNx +++= ++ (B.15)
Two sets of the coefficients 1N to 8N were calculated using the following previously
detailed expressions [200]. The first set of coefficients; calculated using v1 defined
below as Equation (B.16a), was applicable when the valve-train linkage is
compressed and y is positive. The second set of coefficients was calculated using v3
defined below as Equation (B.16b), and was applicable when the valve-train linkage
is compressed and y is negative.
2/1
1 1'
−+= ϕ
Kkvv o (B.16a)
2/1
3 1'
++= ϕ
Kkvv o (B.16b)
( )
+−+= dca
MvN ζαζ
αζ 2
21 221 (B.17)

Appendix B: Derivation and Solution of the Perkins Valve-Train Equations of Motion
181
+−= dcb
MvN 2
22 221 ζαζ (B.18)
dtN ⋅∆=3 (B.19)
( ) cdN −+⋅= 14 ζα (B.20)
⋅
−
++−
∆= fc
tMvN
2251
1ζαζ (B.21)
⋅
−−
∆= fc
tMvN
2261
1ζ
ζ (B.22)
fcN ⋅−
−−=27
11
ζζ (B.23)
281 ζ−
−=vN (B.24)
With the following substitutions:
tv ∆⋅=α (B.25a)
( ) αζσ ⋅−=2/121 (B.25b)
( ) ( ) ( ) ...!
1...2
12
+−
+−=−
me
mm ζαζαζαζα (B.25c)
( ) ...128
51682
11 8642
2/12 ζζζζζ −−−−=− (B.25d)
( )( )
+
+⋅−
−=+
− ...!12
21...303
2142
mmea
mm σσσζα (B.25e)

Characterisation of Combustion Related Acoustic Emission Sources for Diesel Engine Condition Monitoring
182
( )( )
+
+−
−+−=+
−− ...!12
1...1206
)1(2142
meeb
mm σσσζαζα (B.25f)
bac += (B.25g)
bd −=1 (B.25h)
( ) ( )
+
−−−=
−+− ...
!121...
6
121
3
mef
mm σσσζα (B.25i)
In order to define the forcing function F(t), detailed as Equation B.4. it was necessary
to define the displacement (Y ), velocity (Y ) and acceleration (Y ) inputs associated
with the cam profile. Out of necessity, these parameters were defined using tabulated
valve lift data that was experimentally measured directly from the valve-train of the
Perkins engine and tabulated with respect to crank-angle. As shown in Figure B.2(a)
valve lift values were measured directly from the cylinder 1 inlet valve spring
retainer using a dial indicator whilst the corresponding crank-angle values were
measured using the graduated adaptor plate shown in Figure B.2(b) that was fitted to
the front of the engine.
(a) (b)
Figure B.2: The valve lift measurement set-up showing (a) the dial indicator and
(b) the graduated adaptor

Appendix B: Derivation and Solution of the Perkins Valve-Train Equations of Motion
183
In order to define the displacement (Y ), velocity (Y ) and acceleration (Y ) inputs,
tabulated valve lift data was then processed with MATLAB® in the Curve Fitting
Toolbox™ environment [208] using a smoothing spline. Displacement (Y ), velocity
(Y ) and acceleration (Y ) input arrays were generated having a crank-angle interval
of 0.1˚. Figure B.3 highlights this process by showing plots of both measured, and
smoothed valve displacement data.
Figure B.3: Plot showing measured and smoothed valve lift data
In numerically defining the forcing function F(t), the displacement (Y ) parameter
was consequently incorporated into the third term in Equation B.4 as an array of
valve lift versus crank-angle data whilst the cam related acceleration )(Y parameter
was converted from ( 2θm ) into ( 2secm ) before being incorporated into the first
term in Equation B.4. The friction related term; Yβ in Equation B.4 has been
identified as being negligible when compared to the other terms [200] so therefore
was excluded.