character │ leadership │ influence ... – year 12 was 772 students. college address: 276...
TRANSCRIPT

CH AR AC T E R │ L E AD E R S H I P │ I NFL UE N CE │ B RE AK T H R O UG H 1

CH AR AC T E R │ L E AD E R S H I P │ I NFL UE N CE │ B RE AK T H R O UG H 2
Headmaster’s Foreword It is with great pleasure that I present the Annual Report for 2015 to our College community. The following report provides information and data on a range of key indicators within the College and serves a dual role in meeting State and Federal legislation regarding statutory requirements, as well as providing the wider College community with a snapshot of our College achievements in 2015. Our College was established in 1989 as a result of a vision from Pastor Claude Fingleton and as a ministry of the Cathedral of Praise Church to provide quality Christian education to the wider community of Rockhampton and the Capricorn region. The school officially commenced in 1989 with two teachers and 29 students and has steadily grown in both size and influence since that time and has earned a reputation as a quality education provider within the wider community. The governance of Heights College is seamlessly aligned with the local sponsoring church, with the senior pastor holding the position of Chairman of the Board and each board representative being required to be a member of Cathedral of Praise Church.
Heights College seeks to provide a distinctively Christian education grounded on biblical values and the promotion of a caring, positive, challenging and engaging learning environment for all students. Our values of honour, integrity, love, service and excellence we seek to nurture in students in all that they do throughout their school journey. The College seeks to develop the whole child: intellectually, physically, spiritually, emotionally, and socially.
The College credo, 'For Excellence, For Greatness, For Christ' is consistently applied to all facets of the College. Heights College is proud of its well-equipped classrooms, technological resources, landscaped grounds and integrated curriculum across four sub-schools: Kindergarten, Primary, Middle and Senior.
Successful sporting teams and a vibrant creative arts program are available for students across all sub-schools. Alternative pathways in Senior such as student university partnerships and school based apprenticeships provide the opportunity for all students to develop their talents and abilities.
We are truly thankful for the achievements, celebrations and accomplishments of 2015 and are pleased to share some of these with you through this report.
For Excellence, For Greatness, For Christ!
Mr Darren Lawson Headmaster

CH AR AC T E R │ L E AD E R S H I P │ I NFL UE N CE │ B RE AK T H R O UG H 3
1.0 General School Information
Heights College is situated in Rockhampton on the corner of Yaamba Road and Carlton Street, directly opposite CQUniversity. It is located close to the Bruce Highway and is serviced by bus services both
locally and from Gracemere, the Caves and Capricorn Coast. Heights College also runs its own fleet of buses with a door-to-door service. In 2015, our student enrolment in Kindergarten – Year 12 was 772 students.
College Address: 276 Carlton Street, Kawana, North Rockhampton Postal Address: PO Box 5671, Red Hill Rockhampton, Queensland 4701 Phone: 07 4936 1076 Fax: 07 4936 3952 Website: www.heights.qld.edu.au Year Levels Offered: Kindergarten to Year 12 (Co-educational) School Sector: Independent Enrolments: 772 College Structure: Primary School – Kindergarten to Year 6 Middle School – Years 7, 8, 9 Senior School – Years 10, 11, 12 Affiliations: Heights College is an independent Christian College that is an
affiliated member of ISQ (Independent Schools Queensland) and ACS (Associated Christian Schools).
CH AR AC T E R │ L E AD E R S H I P │ I NFL UE N CE │ B RE AK T H R O UG H 4
2.0 Characteristics of the Student Body
Year Level Total Male Female Indigenous
Kindergarten 44 25 19 0
Preparatory 41 24 17 0
Year 1 47 24 23 4
Year 2 48 24 24 5
Year 3 54 30 24 5
Year 4 50 19 31 2
Year 5 56 24 32 3
Year 6 49 26 23 7
Year 7 73 36 37 6
Year 8 45 32 13 5
Year 9 72 37 35 4
Year 10 68 29 39 7
Year 11 55 27 28 2
Year 12 70 34 36 7
TOTAL 772 391 381 57
Table 1: Full time students 2015 (source: DEEWR census data August 2015)
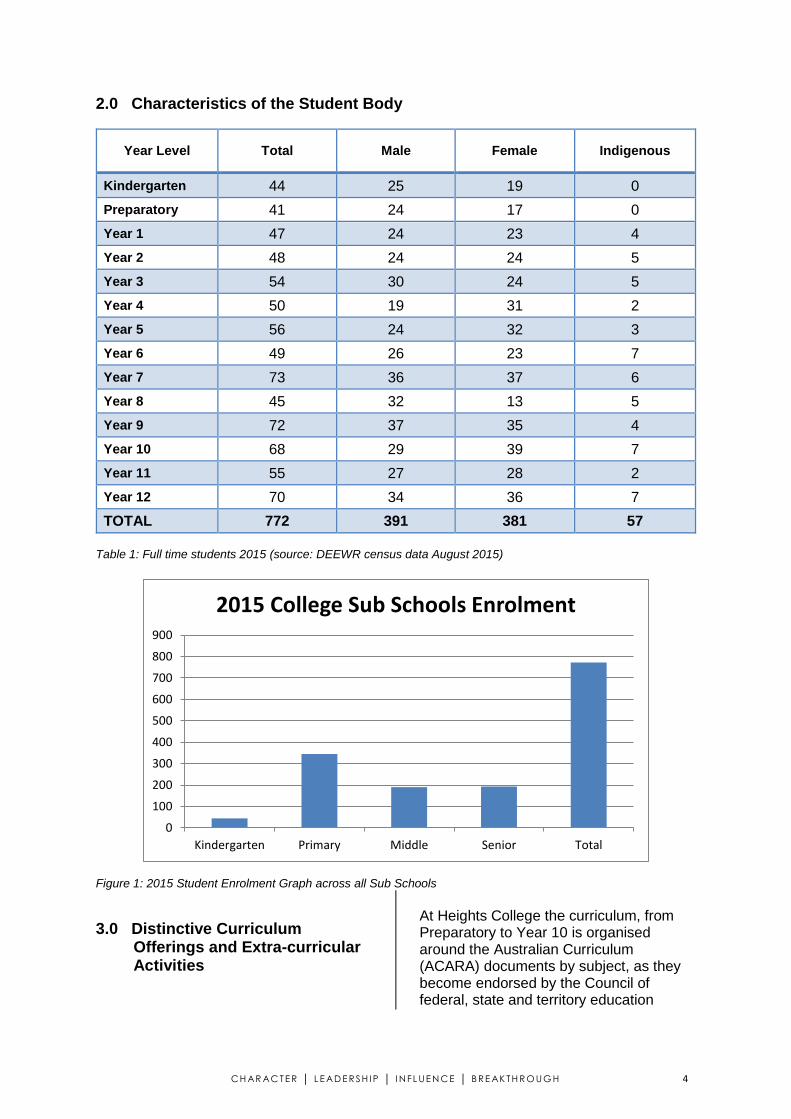
Figure 1: 2015 Student Enrolment Graph across all Sub Schools
3.0 Distinctive Curriculum
Offerings and Extra-curricular Activities
At Heights College the curriculum, from Preparatory to Year 10 is organised around the Australian Curriculum (ACARA) documents by subject, as they become endorsed by the Council of federal, state and territory education
0
100
200
300
400
500
600
700
800
900
Kindergarten Primary Middle Senior Total
2015 College Sub Schools Enrolment

CH AR AC T E R │ L E AD E R S H I P │ I NFL UE N CE │ B RE AK T H R O UG H 5
ministers. The curriculum in Years 11 and 12 is based on a range of Queensland Curriculum and Assessment Authority (QCAA) syllabus documents including both Authority and Authority Registered subjects. As well as academic subjects in the OP pathway, the College also offers a number of vocational subjects for Year 11 and 12 students in a range of industry areas which provide students with practical experience coupled with theoretical knowledge. These include: Furnishings, Engineering Technology, Business Management, Industrial Technology, Hospitality, Home Economics and Certificate III in Fitness. In conjunction with an extensive range of co-curricular activities, such as debating, Rostrum Voice of Youth, Order of Australia and Rotary competitions, the College provides a breadth of curriculum offerings to enable students to develop a broad and strong base of knowledge and skills to assist them in becoming independent, confident learners. Middle and Senior School students participate in weekly sport time which includes a range of on-site and off-site activities to suit every preference. Other co-curricular activities include craft, art, community service, sport, information technology and cultural activities. Students are able to participate in a range of extra-curricular activities which have uniquely added value to the curriculum in 2015. These initiatives included: • Perceptual Motor Program • Domestic and International Missions
Trips • Debating • Public Speaking • Community Service • Bi-annual School Musical • Jazz Band • Choirs • Team Sports Program • Take Home Reading system including
Reading Room • AUSTSWIM training
• First Aid and CPR training • Support-a-Reader • Primary Literacy and Numeracy clinics
(Terms 2 & 3) • Sensory kits – feely seats, slope
boards, feely toys, etc • Instrumental program for all Year 5
students and individual students up to Year 12
• Instrumental evenings and performances
• Maths Olympiad and World Maths Day • Christian Heritage College courses,
workshops and professional development
• Interschool sports • Swimming programs in Primary, Terms
1 & 4 • Strong camping program from Year 6
to Year 12 • Weekly Assembly presentations • Praise and Worship program on a daily
basis • Buddy program Years 11 and 12 with
Prep and Year One • Speech pathologist assessments for
Prep (and new students) and teacher in-service
• Operation Christmas Child • Swimming Carnival and Interschool
Carnival • Mother’s Day stall • Grandparents’ Day • Regional Battle of the Bands
competition • See you at the Pole (prayer morning) • Athletics Carnival/District Athletics • Cross Country – Big Day Out • Individual Education Program reviews • Bi-annual Showcase Evening • Parade of Nations • Book Week • Awards Ceremonies • Brigance testing – Kindy and Prep • Arts Council and visiting performances • Health checks for Prep and Indigenous
students by Department of Health • EAP funding for students with
disabilities • Open Door Parent Policy • Homework Centre twice a week

CH AR AC T E R │ L E AD E R S H I P │ I NFL UE N CE │ B RE AK T H R O UG H 6
4.0 The Social Climate of the College
Heights College is renowned for a vibrant, engaging and highly relational school culture. This culture has been cultivated and jealously guarded by the College Board, Leadership, staff and students over many years. A number of key pillars contribute to this distinctive and vibrant culture. These include: • Daily Praise and Worship across the
College • Student Welfare Program • Student Services Coordination • School Chaplaincy • EXTRA Program • Anti-Bullying Policy • Service opportunities – both locally and
internationally • Community celebrations and events
including Grandparents’ Day and Showcase Evening
5.0 Parental Involvement • Support-A-Reader Program (Prep-6) • Perceptual Motor Program (Kindy-
Prep) • Coaching of Sporting Teams • Musical involvement • Open policy for class involvement • Volunteers for Tuckshop, Reading and
assistance in classrooms • Camping Program
6.0 Parent, Teacher and Student
Satisfaction with the College
The College surveyed a number of staff, students and teachers regarding their satisfaction with the College and hosted a number of parent and staff forums, student workshops and whole school surveys to assist in our College’s development of a strategic plan. The following table highlights overall satisfaction across five key areas from our most recent survey:
Satisfied/ Highly Satisfied
Mission and Values 93%
Student Outcomes 83.95%
Student Welfare 85.78%
School Leadership 94%
Communication 86.45%
Table 2: Staff/Parent/Student Survey Details 2013 (source: Heights College School Survey 2013)
6.1 Achievements in 2015 After an extensive building and construction phase, the College has now entered a consolidation phase where improving the quality of teaching and learning has become our focus and priority. In 2015, students and staff participated in a missions trip to Cambodia. This bi-annual trip was again a great success and it was inspirational to hear of lives transformed and hearts changed as our staff and students served in these cross-cultural contexts. Our College continued to experience breakthrough within our sporting programs, winning district premierships and contributing a record number of students to representative teams at both district, regional, state and national level. Four students achieved outstanding results in their chosen sport, representing Australia: Ty Hartwell in Swimming, Zoe Henare and Rachel Lawson in Athletics and Jarrett McCoombes in Squash. Students’ success was also evidenced in successful Debating teams, Battle of the Bands, Maths Competitions, Eisteddfods and other cultural events. The College also hosted another hugely popular Musical and participated in a diverse range of music and cultural performances, year level camps, excursions and theme days.

CH AR AC T E R │ L E AD E R S H I P │ I NFL UE N CE │ B RE AK T H R O UG H 7
7.0 School income broken down by Funding Source
Please refer to the My School website http://www.myschool.edu.au/ for information relating to Heights College financial information.
8.0 Staffing Information 8.1 Staff Composition
Full Time
Indigenous %
Part-Time
Indigenous %
Teaching
Male 15 0 1 0
Female 25 0 14 7%
TOTAL 40 0 15 7%
Non-Teaching
Male 8 0 8 0
Female 18 0 16 6%
TOTAL 26 0 24 6%
Table 3: Staff Summary Details 2015 (source: DEEWR Census data August 2015)
8.2 Teacher Qualifications The following table identifies the highest qualification held by Heights College teaching staff and the percentage of classroom teachers and school leaders who hold this qualification.
Qualification Percentage
Doctorate 0
Masters 9%
Bachelor 87%
Diploma 4%
Certificate 0
Table 4: Staff Summary Details 2015 (source: Heights College TASS Database of Qualifications, 2015)
8.3 Staff Professional Development
Major professional development activities for 2015 included:
• ConQEST Conference • CPA Congress • Association of School Business
Administrators Qld (ASBAQ) • Early Years Conference • Positive Schools Mental Health and
Wellbeing Conference • Strategic Vision Casting • Fire Safety • Work Health and Safety • A Transforming Vision – Christian
Worldview Orientation for Teachers New to Christian Schools
• Accidental Counselling • ACHPER Conference • ACS School Leaders Conference • ALEA – The Writers Voice Workshop • Bandscales for Aboriginal and Torres
Strait Islander Learners Training • Certified Casper Technician (CCT)
Ipads Training • Child Protection Update • Continuity of Teaching and Learning in
the Early Years • ED622 Teaching Christianly • First Aid Certificate • Food Safety Supervisor Course • Grammar and Meaning Unpacked • Great Teachers = Great Results • Guide to Making Judgements • HEIA Workshops • Implementation Session on Sound
Waves Phonics • Legal Issues • Music Conference • NAPLAN • National Consistent Collection of Data
on School Students with Disability • Principals and School Leaders Briefing
and Curriculum Leaders Workshops • QCAA Standards Elaborations • Registrars National Conference • Science by Doing Professional
Development Program • Seven Steps to Writing Success
Workshop • The AIS ICT Management and
Leadership Conference –Teaching and Technology

CH AR AC T E R │ L E AD E R S H I P │ I NFL UE N CE │ B RE AK T H R O UG H 8
• Understanding Autism Spectrum Disorder
• VET in Schools Conference • QCAA Workshops and seminars
across all College sub-schools and focussing upon a range of key learning areas and learning priorities
• A variety of Career Development workshops
8.4 Expenditure on Professional
Development
Number of Teaching
Staff participating
in PD
Total Expenditure on Teacher
Professional Development
Average Expenditure
on Professional Development per Teacher
56 $100,964 $1,802
Table 5: Staff Professional Development 2015 (source:TASS Report)
8.5 Staff Attendance and Retention The table below indicates the average staff attendance for the College, including unplanned absences of sick and emergency leave periods of up to 5 days.
Number of Staff
Number of
School Days
Total Days of
Staff Absence
Average Staff
Attendance Rate
51.1 FTE
(permanent Teaching & Leadership)
181 195 97.9%
40.5 FTE
(permanent Non-
Teaching)
181 180 97.5%
Table 6: Staff Attendance 2015 (source: Staff Payroll Report)
Average attendance rate of all staff is 97.7%.
8.6 Proportion of teaching staff retained from 2014
Number of permanent
teaching staff at end of 2014
Number of these
retained in 2015
% of Retention
Rate
53 50 94%
Table 7: Staff Retention 2015 (source: College Board report, 10 Feb 2015)
9.0 Key Student Outcomes 9.1 Student Attendance and
Retention Heights College seeks to provide a learning environment where students enjoy learning and where their school experience is a positive and enriching one. The following table highlights the College’s student attendance rates in 2015:
Number
of School days in
year
Total number of students
Total number of all student absences
Average Attendance
Rate %
181 772 10,580 92.3%
Table 8: Student Attendance 2015 (source: TASS report)
The average number of school days in the year for all year levels is 181, except for Kindergarten which is 90.
Year Level Enrol-ments
Total number of student
absences per year level
Average Attendance
Rate %
Kindergarten TOTAL 44 267 96.4
Preparatory 41 548 92.6
Year 1 47 642 92.3
Year 2 48 636 92.6
Year 3 54 732 92.3
Year 4 50 681 92.2
Year 5 56 675 93.2
Year 6 49 615 93.0 Primary School TOTAL 345 4,529 92.6
Year 7 73 975 92.5

CH AR AC T E R │ L E AD E R S H I P │ I NFL UE N CE │ B RE AK T H R O UG H 9
Year 8 45 673 91.4
Year 9 72 985 92.3 Middle School TOTAL 190 2,633 92.2
Year 10 68 1180 90.2
Year 11 55 748 92.4
Year 12 70 1223 90.4 Senior School TOTAL 193 3,151 90.9
COLLEGE TOTAL 772 10,580 92.3
Table 9: Student Attendance Rate 2015 (source: TASS report)
Any patterns of non-attendance by students are managed through a flag process that is instigated via our student management software and monitored by our student reception staff. Once a pattern of non-attendance has been confirmed, a written letter is sent home to the parents of the child and a request for a face-to face interview is requested to ensure the information regarding compulsory attendance is clearly understood. If further breeches occur, an interview with the Headmaster is required, and a ‘show cause’ procedure is carefully followed regarding the student.
9.2 National Assessment Program – Literacy and Numeracy (NAPLAN) Results for 2015
For the past few years ACARA (Australian Curriculum, Assessment and Reporting Authority) has released information on schools demonstrating substantially above average gain in their NAPLAN results as students progress from Year 3 to Year 5 and from Year 7 to Year 9.
For 2015, Heights College was identified by ACARA as a school that had demonstrated substantially above average gain in NAPLAN results. By measuring the gain from Years 3 to 5 and from Years 7 to
9, with at least 70% of the students having taken NAPLAN at the school two years earlier, ACARA measured how much difference the school has made to those students’ achievement levels.
We are very pleased to be achieving substantially above average in this area, and we aim to continue to improve learning outcomes for all our students. We congratulate staff and students at Heights College for their achievements in this testing.
The results of the 2015 NAPLAN testing of the College’s Yr 3, 5, 7 and 9 cohorts are listed in the tables below. The tables display the raw score of each year level at Heights and the College’s performance against State and National benchmarks. Each year’s NAPLAN figures are part of a trend in time, whether rising, falling or holding relatively stable. We have been systematically reviewing teaching/ learning processes and pedagogies across key learning areas over the whole school, in order to enhance student learning outcomes. Our Year Three NAPLAN results, while still slightly below State and National averages, have significantly improved from last year and have started a climb we intend to continue. Continued improvement has been the focus of a range of professional development, in-service training and new curriculum initiatives. The College Executive, senior leadership team and curriculum coordinators regularly review and analyse the learning outcomes and academic achievements of all students against State and National benchmarks, to ensure that our standards of learning increase in excellence. The College also provides annual analysis with summarised five year trend data on NAPLAN results, to assist in remediation and improved standards of achievement throughout the College.

CH AR AC T E R │ L E AD E R S H I P │ I NFL UE N CE │ B RE AK T H R O UG H 10
Year 3 2015
(Heights) 2015
(State) Above Qld
(%) 2015
(National) Above Nat
(%)
Reading 419 418 0.20% 426
Writing 410 406 1.00% 416
Spelling 389 397 409
Grammar 405 430 433
Numeracy 383 393 398
Year 5 2015
(Heights) 2015
(State) Above Qld
(%) 2015
(National) Above Nat
(%)
Reading 517 495 4.40% 498 3.80%
Writing 483 470 2.80% 478 1.00%
Spelling 494 489 1.00% 498
Grammar 512 500 2.40% 504 1.60%
Numeracy 502 486 3.30% 492 2.00%
Year 7 2015
(Heights) 2015
(State) Above Qld
(%) 2015
(National) Above Nat
(%)
Reading 564 543 3.90% 546 3.30%
Writing 512 505 1.40% 511 0.20%
Spelling 541 544 546
Grammar 540 538 0.40% 541
Numeracy 538 539 3.90% 543 3.30%
Year 9 2015
(Heights) 2015
(State) Above Qld
(%) 2015
(National) Above Nat
(%)
Reading 583 572 1.90% 580 0.50%
Writing 532 537 546
Spelling 584 580 0.70% 583 0.20%
Grammar 590 566 4.20% 568 3.90%
Numeracy 598 585 2.20% 592 1.00%
Table 10: NAPLAN Results Summary (source: QCAA NAPLAN data 2015)

CH AR AC T E R │ L E AD E R S H I P │ I NFL UE N CE │ B RE AK T H R O UG H 11
9.3 Year 10 to Year 12 Apparent Retention Rates
Year Year 10 Enrol
Year Year 12 Enrol
10-12 Apparent Retention Rate
2006 49 2008 32 65.3%
2007 56 2009 46 82.1%
2008 47 2010 32 68.1%
2009 52 2011 36 69.2%
2010 46 2012 33 71.7%
2011 61 2013 54 88.5%
2012 73 2014 62 85%
2013 73 2015 70 96%
Table 11: (source: Census Data 2013/QCAA 2015)
9.4 Year 12 Outcomes (2015 Cohort)
Outcomes for our Year 12 cohort of 2015
Number of students awarded a Senior Education Profile 70
Number of students awarded a Queensland Certificate of Individual Achievement 0
Number of students who received an Overall Position (OP) 47
Number of students who are completing or completed a School-Based Apprenticeship or Traineeship (SAT)
6
Number of students awarded one or more Vocational Education and Training (VET) qualifications
25
Number of students awarded a Queensland Certificate of Education at the end of Year 12
63
Number of students awarded an International Baccalaureate Diploma (IBD) 0
Percentage of Year 12 students who received an OP1-15 or an IBD 83%
Percentage of Year 12 students who are completing or completed a SAT or were awarded one or more of the following: QCE, IBD, VET qualification
95.7%
Percentage of Queensland Tertiary Admissions Centre (QTAC) applicants receiving an offer
91.2%
Table 12: 2015 Learner Outcomes – (source: QCAA 2015 School Learner Report for Heights College)
9.5 Year 12 Performance for 2015 The Year 12 cohort of 2015 achieved excellent results in their overall position (OP) rankings. Two (2) students in the cohort received an OP 1. The Yr 12 performance for 2015 resulted in 83% of eligible students gaining an OP score between 1 and 15 and 55% receiving an OP of 10 or better.
21% of the OP eligible senior class achieved between a 1 and 5.

CH AR AC T E R │ L E AD E R S H I P │ I NFL UE N CE │ B RE AK T H R O UG H 12
Overall Position
1-5 6-10 11-15 16-20 21-25
Percentage of OP-eligible cohort
21% 34% 28% 17% 0%
Figure 2: OP Groupings 2015. (source: QCAA 2015 School Learner Report for Heights College)
9.6 Next Step Survey –
2014 Cohort of Senior Students This report is based on the findings of the Queensland Government Next Step survey, which targeted all students who completed Year 12 and gained a Senior Statement in 2014, whether they attended a Government, Catholic or independent school, or a TAFE secondary college. The Queensland Government Statistician’s Office conducted the survey between
March and June 2015, approximately six months after the young people left school. Responses were predominantly collected via computer-assisted telephone interviewing and an online survey. The survey results were compiled and reported on by the Next Step team, Department of Education and Training. Table 13 reports the response rate for Heights College. It expresses the number of respondents from Heights College senior class of 2014 who completed the Queensland Government Next Step Survey.
Number of
Respondents Number of students
who completed
Year 12
Response rate (%)
49 62 79%
Table 13: (source: NextStep 2015 for Heights College, DET)
9.6.1 Main Destination Figure 1 reports the main destinations of Year 12 graduates from Heights College in 2014. The pathways of Year 12 completers were categorised into 10 main destinations. Year 12 completers who were both studying and working were reported as studying for their main destination.
21%
34%28%
17%
OP Groupings
1 - 5
6 - 10
11 - 15
16 - 20

CH AR AC T E R │ L E AD E R S H I P │ I NFL UE N CE │ B RE AK T H R O UG H 13
Figure 3 compares the main destinations of Year 12 completers from Heights College with those of Fitzroy and all schools Statewide. Differences may reflect diversity in the types of students attending different schools, regional variation in labour markets and access to university and VET providers. Regional areas are based on the Australian Statistical Geography Standard.
9.6.2 Comparison over time of main destinations of Year 12 completers for Heights College
Figure 4 compares the main destinations of all Year 12 students for Heights College over the past 5 years.

10.0 Technology and Innovation in Education
In 2015, Heights College had a total of 660 computer units comprising of 247 desktops, 111 laptops, 276 IPADS, 26 IMACs. Of the units above, 144 units are set aside for Administration with 516 units allocated to student use. Whilst the College has three (3) designated computer laboratories in the lower floor of our Learning and Leadership Centre, there are also two (2) designated computer laboratories in the lower floor of Jireh, and a number of GLA’s across the Middle and Senior school precincts that also contain computer units. In the Primary area, there are approximately four (4) computer units available for student use per classroom and each primary GLA has an interactive projector with white board. These projectors are short throw, have brighter display and allow for several users to use finger-touch interactivity on the whiteboards at one time. In 2015 the College moved to a transition year for BYOD (Bring Your Own Device) where Secondary students, Year 7 through to Year 12 were given the option of BYOD (laptop or tablets) with the remainder of those that didn’t have a device given access to a College-owned IPAD. 2016 will see the commencement of a mandatory BYOD program where every Secondary student will be required to have their own device. The primary area received another set of iPADs for use by the Prep students. This was added to the current inventory that was implemented in 2014 via three (3) shared IPAD trolleys. Each trolley had approximately 25-30 iPADs that were used for two Grade levels (Years 1-2, Years 3-4, and Years 5-6). Each Primary teacher also has access to their own IPAD to assist with the use of these devices. Technology for Teachers also received a major change in 2015. All Teaching staff
moved away from fixed desktop PC’s in the classroom to using laptops. This allowed the teachers to be more mobile and being able to always have access to a computer without having to share amongst other staff members. Students have greatly benefited in 2015 from a diverse array of technology-related learning experiences. These include content generation, word processing, information research, multimedia applications, internet research, Mathletics, Reading Eggs and other educational software programs, financial planning strategies, graphic art design and multimedia presentations. The Primary school also saw the introduction of Soundwaves in 2015. The internet speed (bandwidth) was also doubled in 2015 to support the increased use of Internet technology in the classroom by both teachers and students. Through the adoption of a BYOD program, a number of Wi-fi points were purchased to allow for better coverage of wireless devices throughout the school.
11.0 The Heights Way The Heights Way continued during 2015 as a thematic framework for each of the four terms of the year, to reinforce the distinctive culture of Heights College and to describe the way we do things at Heights. Each term of the academic year has a central focus: Character, Leadership, Influence and Breakthrough, and these themes are the integrating context in which to achieve the College purpose of providing education that inspires character and leadership.

CH AR AC T E R │ L E AD E R S H I P │ I NFL UE N CE │ B RE AK T H R O UG H 15
Character is moral excellence, it is made in the
small moments of our lives and it is often
described as who we are when no one is looking.
“Someone with good character is like an
immovable rock. You will always be able to go
back to them, no matter how many storms and
trials come their way, you will still know where
they are and where they stand in any given
situation. They don’t change according to the
situation; they always remain faithful to those
around them.” Year 12 Heights Student – 2005
“Leadership is influence.” “Leaders must be close
enough to relate to others, but far enough ahead
to motivate them.” John Maxwell Students at
Heights College are encouraged to develop their
leadership skills through their relationships with
others and ability to use the giftings they have to
their full potential in the situation they may be
placed in.
Influence – Connect with people, be an
influencer. “The only inheritance that a person
will leave that has eternal value is their
influence.” Every student is encouraged to be
aware of the influence they have on their peers,
other students, community members, staff and
family through their words, actions and
thoughts.
Breakthrough – Reach for the sky – fly high.
“Develop success from failures. Discouragement
and failure are two of the surest stepping stones
to success.” Dale Carnegie. Students are
encouraged to achieve breakthrough in an area
of their lives, whether it be physical, academic,
spiritual, emotional etc., through persistence,
prayer and practise.

12.0 Annual Theme: “I Lift Up My Eyes…” Our 2015 College theme was, “I lift up my eyes”, from the opening verses of Psalm 121 and 123. Actually, there are many more times in Scripture when these words or a slight variation appears. The two main thoughts we took from this exhortation were: firstly, the reminder that our dependence is on God and that is where our help comes from; and secondly, that by lifting our eyes up and seeing from God’s perspective we are encouraged to see further, wider and higher than we could by ourselves. In seeing higher, we wanted to raise our expectations of what our students can do, and raise students’ own expectations of what they are capable of. We prayed that this year would be a year where students experienced breakthroughs and achievements that they never previously believed possible.
13.0 Capital Works The main focus of our capital works program in 2015 was to invest in two new playgrounds for our Primary School Precinct. One of the playgrounds replaced an existing playground and is used by our Year 1 to Year 3 cohorts. The second playground was a new addition to the campus and is used by our Year 4 to Year 6 cohorts. The College also invested in approximately 200 lockers for our middle and senior school cohorts and we continue to invest in IT Infrastructure as part of our IT Strategy for managing our BYOD program.