chapter:3 where prices come from: the interaction of ... · chapter:3 where prices come from: the...
TRANSCRIPT

Copyright © 2017 Pearson Education, Inc. All Rights Reserved
Economics6th edition
Chapter 3 Where Prices Come From: The
Interaction of Demand and Supply
Modified by Yulin Hou
For Principles of Microeconomics
Florida International University
Fall 2017
1

Copyright © 2017 Pearson Education, Inc. All Rights Reserved
What determines the price of a
smartwatch?
Demand for smartwatches
– How many smartwatches do consumers want to buy?
– Affected by price of the smartwatches
– Affected by other factors, including prices of other goods
Supply of smartwatches
– How many smartwatches are producers willing to sell?
– Affected by price of the smartwatches
– Affected by other factors, including prices of other goods
2

Copyright © 2017 Pearson Education, Inc. All Rights Reserved
Our model of a market
To analyze the market for smartwatches, we need a model how
buyers and sellers behave.
The model we use in this chapter is a perfectly competitive
market, a market with (1) many buyers and sellers, (2) all firms
selling identical products, and (3) no barriers to new firms entering
the market.
3

Copyright © 2017 Pearson Education, Inc. All Rights Reserved
3.1 The Demand Side of the Market
Market demand: the demand by all the consumers of a given
good or service.
4

Copyright © 2017 Pearson Education, Inc. All Rights Reserved
Demand curve: A curve that shows the relationship between the
price of a product and the quantity of the product demanded.
5

Copyright © 2017 Pearson Education, Inc. All Rights Reserved
Quantity demanded: The amount of a good or service that a
consumer is willing and able to purchase at a given price.
6

Copyright © 2017 Pearson Education, Inc. All Rights Reserved
Law of Demand
Law of Demand:
A rule that states that, holding everything else constant,
when the price of a product falls, the quantity demanded of
the product will increase, and when the price of a product
rises, the quantity demanded of the product will decrease.
7

Copyright © 2017 Pearson Education, Inc. All Rights Reserved
Shifting the demand curve (1 of 2)
A change in something other
than price that affects
demand causes the entire
demand curve to shift.
A shift to the right (D1 to D2)
is an increase in demand.
A shift to the left (D1 to D3) is
a decrease in demand.
8

Copyright © 2017 Pearson Education, Inc. All Rights Reserved
Shifting the demand curve (2 of 2)
As the demand curve
shifts, the quantity
demanded will change,
even if the price doesn’t
change.
The quantity demanded
changes at every possible
price.
9
P1
Q3 Q1 Q2

Copyright © 2017 Pearson Education, Inc. All Rights Reserved
What factors influence market demand?
-Income
-Prices of related goods
-Tastes
-Population
-Expected future prices
-And so on
10

Copyright © 2017 Pearson Education, Inc. All Rights Reserved
Changes in income of Consumers
Normal goods:
Goods for which the demand increases as income rises and decreases
as income falls.
Examples: Clothing
Restaurant meals
Vacations
11

Copyright © 2017 Pearson Education, Inc. All Rights Reserved
Changes in Income of Consumers
Inferior goods: Goods for which the demand increases as
income falls and decreases as income rises.
Examples: Second-hand clothing
Cheaper cars
Inter-city bus service

Copyright © 2017 Pearson Education, Inc. All Rights Reserved
Effects of changes in income
An increase in income would increase
the demand for clothing, ceteris paribus.
However the same increase in income
would likely decrease the demand for
second-hand clothing.
13

Copyright © 2017 Pearson Education, Inc. All Rights Reserved
Changes in the price of related goods
Substitutes: Goods and services that can be used for the same purpose.
Examples:
Potatoes from different farms
Coke and Pepsi
McDonald’s and Burger King hamburgers
Crest and Colgate toothpastes
14

Copyright © 2017 Pearson Education, Inc. All Rights Reserved
Changes in the Price of Related Goods
Complements: Goods and services that are used together.
Examples:
Hot dogs and hot dog buns
Coffee and Coffer filters
Mobile phones and SIM cards
DVD players and DVDs
Flashlight and Battery

Copyright © 2017 Pearson Education, Inc. All Rights Reserved
Effects of changes in the price of related
goods
An increase in the price of a Coke
would increase the demand for Pepsi.
An increase in the price of coffee would
decrease the demand for coffee filter.
16

Copyright © 2017 Pearson Education, Inc. All Rights Reserved
Practice
Suppose that when the price of hamburgers decreases, John increases his
purchases of ketchup. To John,
A) hamburgers and ketchup are complements.
B) hamburgers and ketchup and substitutes.
C) hamburgers and ketchup are normal goods.
D) hamburgers are normal goods and ketchup is an inferior good.
17

Copyright © 2017 Pearson Education, Inc. All Rights Reserved
Changes in tastes
Tastes
If consumers’ tastes change,
they may buy more or less of
the product.
Example: If consumers
become more concerned
about eating healthily, they
might decrease their demand
for fast food.
18
Copyright © 2017 Pearson Education, Inc. All Rights Reserved
Changes in Tastes
Example:
Advertisement
Fashion and Trends
In general, when consumer’s taste for a product increases, the
demand curve will shift to right; and when consumer’s taste for a
product decreases, the demand curve will shift to the left.

Copyright © 2017 Pearson Education, Inc. All Rights Reserved
Changes in population/demographics
Demographics: The characteristics
of a population with respect to age,
race, and gender. Increases in the
number of people buying something
will increase the amount demanded.
Example: An increase in the elderly
population increases the demand for
medical care.
20

Copyright © 2017 Pearson Education, Inc. All Rights Reserved
Changes in expectations about future
prices
Consumers decide which products to buy and when to buy them.
• An expected increase in the price tomorrow increases demand
today.
• An expected decrease in the price tomorrow decreases demand
today.
21

Copyright © 2017 Pearson Education, Inc. All Rights Reserved
Changes in Expectations about Future
Prices
Example: If you found out the price
of gasoline would go up tomorrow,
you would increase your demand
today.
Copyright © 2017 Pearson Education, Inc. All Rights Reserved
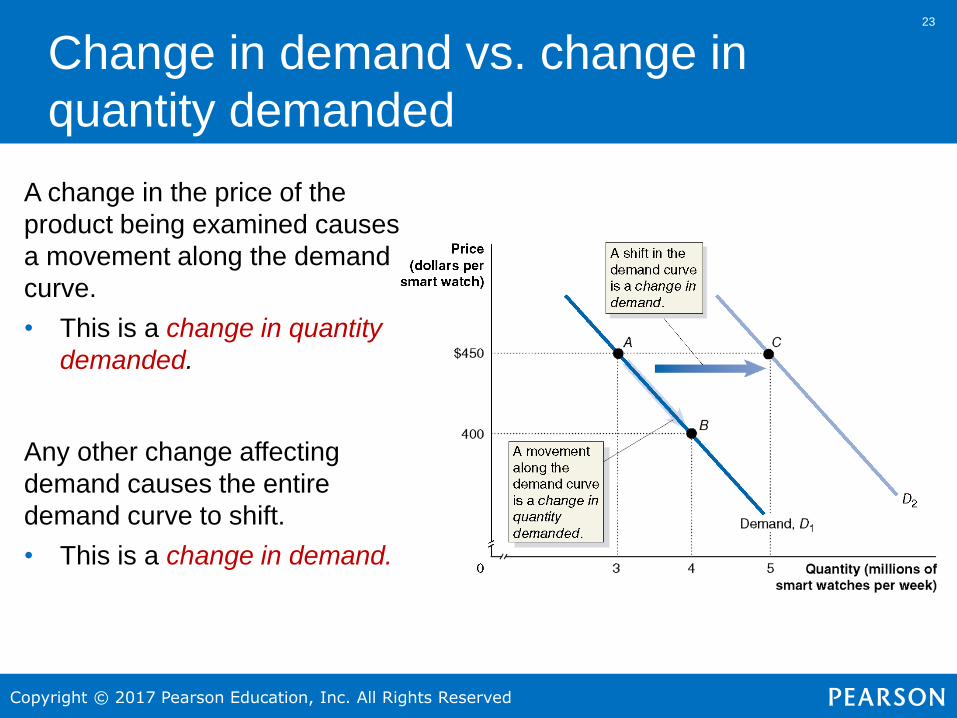
Change in demand vs. change in
quantity demanded
A change in the price of the
product being examined causes
a movement along the demand
curve.
• This is a change in quantity
demanded.
Any other change affecting
demand causes the entire
demand curve to shift.
• This is a change in demand.
23

Copyright © 2017 Pearson Education, Inc. All Rights Reserved
3.2 The Supply Side of the Market
Market supply, i.e. the
decisions of (generally) firms
about how much of a product
to provide at various prices.
24

Copyright © 2017 Pearson Education, Inc. All Rights Reserved
Supply curve: A curve that shows the relationship between the
price of a product and the quantity of the product supplied.
25

Copyright © 2017 Pearson Education, Inc. All Rights Reserved
Quantity supplied: The amount of a good or service that a firm is
willing and able to supply at a given price.
26

Copyright © 2017 Pearson Education, Inc. All Rights Reserved
Law of Supply
The law of supply: The rule that, holding everything else
constant, increases in price cause increases in the quantity
supplied, and decreases in price cause decreases in the quantity
supplied.

Copyright © 2017 Pearson Education, Inc. All Rights ReservedCopyright © 2017 Pearson Education, Inc. All Rights Reserved
28Shifting the Supply Curve (1 of 2)
A change in something other than
price that affects supply causes
the entire supply curve to shift.
• A shift to the right (S1 to S3) is
an increase in supply.
• A shift to the left (S1 to S2) is a
decrease in supply.

Copyright © 2017 Pearson Education, Inc. All Rights ReservedCopyright © 2017 Pearson Education, Inc. All Rights Reserved
29Shifting the Supply Curve (2 of 2)
As the supply curve shifts, the
quantity supplied will change,
even if the price doesn’t
change.
The quantity supplied changes
at every possible price.
P
1
Q2 Q1 Q3

Copyright © 2017 Pearson Education, Inc. All Rights Reserved
What factors influence market supply?
-Prices of inputs
-Technological change
-Prices of substitutes in production
-Number of firms in the market
-Expected future prices
-And so on
30

Copyright © 2017 Pearson Education, Inc. All Rights Reserved
Change in prices of inputs
Inputs are things used in the
production of a good or service.
An increase in the price of an input
decreases the profitability of selling
the good, causing a decrease in
supply.
A decrease in the price of an input
increases the profitability of selling the
good, causing an increase in supply.
31

Copyright © 2017 Pearson Education, Inc. All Rights Reserved
Technological change
A firm may experience a positive or
negative change in its ability to
produce a given level of output with a
given quantity of inputs. We call this a
technological change.
Examples:
A new, more productive variety of
wheat would increase the supply of
wheat.
Governmental restrictions on land
use for agriculture might decrease
the supply of wheat.
32

Copyright © 2017 Pearson Education, Inc. All Rights Reserved
Prices of related goods in production
Many firms can produce and sell alternative
products. Eg: A farmer can plant corn or
soybeans. If the price of soybeans rises, he
will plant (supply) less corn.
Sometimes, two products are necessarily
produced together. Eg: Cattle provide both
beef and leather. An increase in the price of
beef encourages more cattle farming, and
hence increase the supply of leather.
33

Copyright © 2017 Pearson Education, Inc. All Rights Reserved
Number of firms and expected future
prices
More firms in the market will result in
more product available at a given
price (greater supply).
Fewer firms → supply decreases.
34

Copyright © 2017 Pearson Education, Inc. All Rights Reserved
Expected Future Prices
If a firm anticipates the price of its product will be higher in
the future, it might decrease its supply today in order to
increase it in the future.
35

Copyright © 2017 Pearson Education, Inc. All Rights Reserved
A change in the price of the
product being examined
causes a movement along the
supply curve.
• This is a change in
quantity supplied.
Any other change affecting
supply causes the entire
supply curve to shift.
• This is a change in
supply.
36

Copyright © 2017 Pearson Education, Inc. All Rights Reserved
3.3 Market Equilibrium: Putting Demand
and Supply Together
Market equilibrium is a situation in which quantity demanded
equals quantity supplied.
Price is determined by the interaction of buyers and sellers.
Neither group can dictate price in a competitive market (i.e. one
with many buyers and sellers).
37

Copyright © 2017 Pearson Education, Inc. All Rights Reserved
Example: Market equilibrium
At a price of $350,
• consumers want to buy
5 million smartwatches, and
• producers want to sell 5
million smartwatches.
We say the equilibrium price
in this market is $350, and the
equilibrium quantity is 5
million smartwatches per week.
38

Copyright © 2017 Pearson Education, Inc. All Rights Reserved
Quantitative Demand and Supply Analysis
Example:
Suppose that the demand for apartments in New York City is
QD = 4,750,000 − 1,000P
and the supply of apartments is
QS = −1,000,000 + 1,300P
In equilibrium, we know
QD = QS (the equilibrium condition.)
39

Copyright © 2017 Pearson Education, Inc. All Rights Reserved
Solving for the equilibrium rent and
quantity
QD = 4,750,000 − 1,000P
QS = −1,000,000 + 1,300P
QD = QS
We use these to find the equilibrium rent and quantity:
4,750,000 − 1,000P = −450,000 + 1,300P
5,750,000 = 2,300P
P = 5,750,000/2,300
= $2,500
40

Copyright © 2017 Pearson Education, Inc. All Rights Reserved
Find the equilibrium quantity of
apartments rented:
QD = 4,750,000 – 1,000P
= 4,750,000 – 1,000(2,500)
= 2,250,000
or
QS = – 1,000,000 + 1,300P
= – 1,000,000 + 1,300(2,500)
= 2,250,000
41

Copyright © 2017 Pearson Education, Inc. All Rights Reserved
The effect of surpluses on the market price
What if the price were
$400 instead?
At a price of $400,
• consumers want to
buy 4 million
smartwatches, while
• producers want to
sell 6 million.
This gives a surplus of 2 million smartwatches: a situation in
which quantity supplied is greater than quantity demanded.
Prediction: sellers will compete amongst themselves, driving the
price down.
42

Copyright © 2017 Pearson Education, Inc. All Rights Reserved
The effect of shortages on the market price
Now what if the price
were $250?
At a price of $250,
• consumers want to
buy 7 million
smartwatches, while
• producers want to
sell 3 million.
This gives a shortage of 4 million smartwatches: a situation in
which quantity demanded is greater than quantity supplied.
Prediction: sellers will realize they can increase the price and still
sell as many smartphones, so the price will rise.
43

Copyright © 2017 Pearson Education, Inc. All Rights Reserved
3.4 The Effect of Demand and Supply
Shifts on Equilibrium
Predictions about price and quantity in model require us to know
- Supply curve
- Demand curves
- How the curve moves
44
Copyright © 2017 Pearson Education, Inc. All Rights Reserved
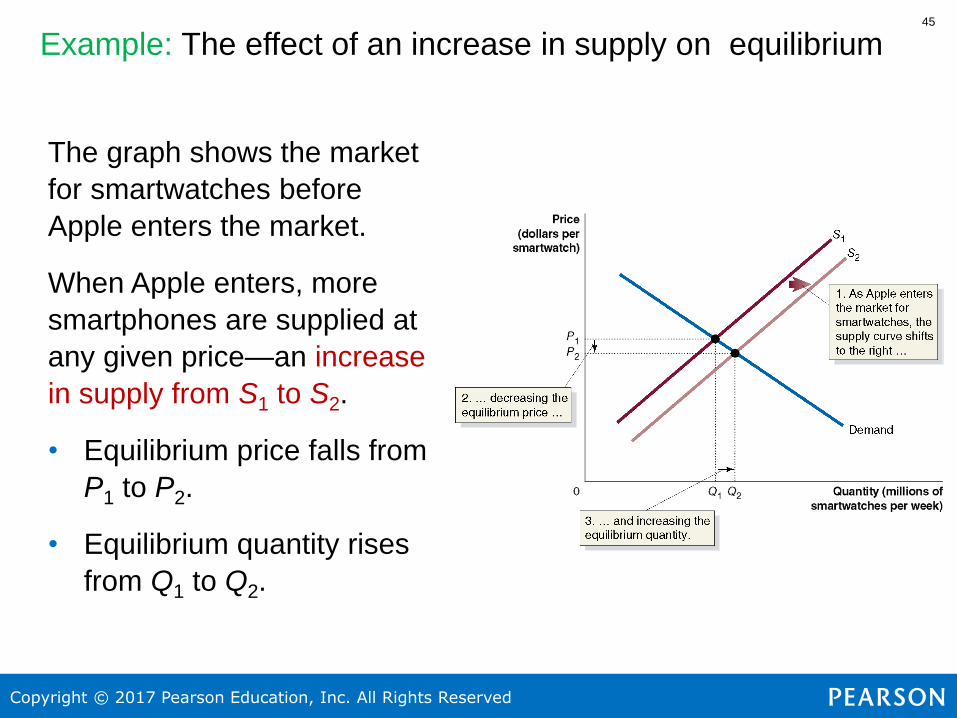
Example: The effect of an increase in supply on equilibrium
The graph shows the market
for smartwatches before
Apple enters the market.
When Apple enters, more
smartphones are supplied at
any given price—an increase
in supply from S1 to S2.
• Equilibrium price falls from
P1 to P2.
• Equilibrium quantity rises
from Q1 to Q2.
45

Copyright © 2017 Pearson Education, Inc. All Rights Reserved
Example: The effect of an increase in demand on equilibrium
Suppose incomes
increase. What happens to
the equilibrium in the
smartwatch market?
Smartwatches are a normal
good, so as income rises,
demand shifts to the right
(D1 to D2).
• Equilibrium price rises
(P1 to P2).
• Equilibrium quantity
rises (Q1 to Q2).
46