chapter13 learning to reason about statistical inferencereed/instructors/math 10041/reasoning...
TRANSCRIPT

Chapter 13Learning to Reason About Statistical Inference
Despite all the criticisms that we could offer of the traditionalintroductory statistics course, it at least has a clear objective:to teach ideas central to statistical inference.
(Konold & Pollatsek, 2002, p. 260)
Snapshot of a Research-Based Activity on Statistical Inference
Students revisit an activity conducted earlier in the semester in the unit on compar-ing groups with boxplots (Gummy Bears Activity in Lesson 2, Chapter 11). Onceagain, they are going to design an experiment to compare the distances of gummybears launched from two different heights. The experiment is discussed, the studentsform groups, and the conditions are randomly assigned to the groups of students.This time a detailed protocol is developed and used that specifies exactly how stu-dents are to launch the gummy bears and measure the results. The data gatheredthis time seem to have less variability than the earlier activity, which is good. Thestudents enter the data into Fathom (Key Curriculum Press, 2006), which is used togenerate graphs that are compared to the earlier results, showing less within groupvariability this time due to the more detailed protocol.
There is a discussion of the between versus within variability, and what thegraphs suggest about true differences in distances. Fathom is then used to run atwo sample t test and the results show a significant difference, indicated by a smallP-value. Next, students have Fathom calculate a 95% confidence interval to estimatethe true difference in mean distances. In discussing this experiment, the studentsrevisit important concepts relating to designing experiments, how they are able todraw casual conclusions from this experiment, and the role of variability betweenand within groups. Connections are drawn between earlier topics and the topic ofinference, as well as between tests of significance and confidence intervals in thecontext of a concrete experiment.
The metaphor of making an argument is revisited from earlier uses in the course,this time in connection with the hypothesis test procedure. Links are shown betweenthe claim (that higher stacks of books will launch bears for farther distances), theevidence used to support the claim (the data gathered in the experiment), the qualityand justification of the evidence (the experimental design, randomization, samplesize), limitations in the evidence (small number of launches) and finally, an indicatorof how convincing the argument is (the P-value). By discussing the idea of the
J.B. Garfield, D. Ben-Zvi, Developing Students’ Statistical Reasoning,C© Springer Science+Business Media B.V. 2008
261

262 13 Learning to Reason About Statistical Inference
P-value as a measure of how convincing our data are in refuting a contradictoryclaim (that the lower height resulted in farther distances), students see that the fartherthey are from this contradictory claim, the more likely we are to win our argument.As they have seen in earlier uses of informal inference throughout the course, thefarther in the tails, the smaller the probability of observing what was seen in thesample if the contradictory claim is true and the smaller the P-values. So they linksmall P-values with convincing evidence and a more convincing argument.
Rationale for This Activity
Unlike many of the topics in previous chapters of this book, there is little empiricalresearch on teaching concepts of inference to support the lessons described in thischapter. However, there are many studies that document the difficulties studentshave reasoning and understanding inferential ideas and procedures. Therefore, weare much more speculative in this chapter, basing our lessons and activities moreon writing by influential statistics educators as well as general research-based peda-gogical theories. Later in this chapter, we address the many questions we have aboutappropriate ways to help students develop good reasoning about statistical inferenceand some promising new directions that are just beginning to be explored.
This particular activity is introduced near the end of a course that is designed tolead students to understand inferences about one and two means. We use it at a timewhere the material often becomes very abstract and challenging for students, a timewhere it is often hard to find a motivating activity for students to engage in. Nowthat students have already conducted this experiment, they are more aware of theneed to use good, consistent protocols for launching gummy bears, to decrease thevariability within each condition, and to provide a convincing argument supportingtheir claim and refuting the alternative claim. Also, now that students are acquaintedwith formal methods of making statistical inferences, they can do a statistical com-parison of the difference in distances using a two-sample test of significance. Theuse of the argument metaphor helps students connect the confusing terminologyused regarding hypothesis tests to something they can understand and relate to, andbuilds upon earlier uses of this metaphor and associated terms throughout the course.
The Importance of Understanding Statistical Inference
Drawing inferences from data is now part of everyday life but it is a mystery as to why andhow this type of reasoning arose less than 350 years ago.
(Pfannkuch, 2005b, p. 267)
Drawing inferences from data is part of everyday life and critically reviewing re-sults of statistical inferences from research studies is an important capability forall adults. Methods of statistical inference are used to draw a conclusion about aparticular population using data-based evidence provided by a sample.

The Place of Statistical Inference in the Curriculum 263
Statistical inference is formally defined as “the theory, methods, and practiceof forming judgments about the parameters of a population, usually on the basisof random sampling” (Collins, 2003). Statistical inference “moves beyond the datain hand to draw conclusions about some wider universe, taking into account thatvariation is everywhere and the conclusions are uncertain” (Moore, 2004, p. 117).There are two important themes in statistical inference: parameter estimation andhypothesis testing and two kinds of inference questions: generalizations (from sur-veys) and comparison and determination of cause (from randomized comparativeexperiments). In general terms, the first is concerned with generalizing from a smallsample to a larger population, while the second has to do with determining if apattern in the data can be attributed to a real effect.
Reasoning about data analysis and reasoning about statistical inference are bothessential to effectively work with data and to gain understanding from data. Whilethe purpose of exploratory data analysis is exploration of the data and searchingfor interesting patterns, the purpose of statistical inference is to answer specificquestions, posed before the data are produced. Conclusions in EDA are informal,inferred based on what we see in the data, and apply only to the individuals andcircumstances for which we have data in hand. In contrast, conclusions in statisticalinference are formal, backed by a statement of our confidence in them, and applyto a larger group of individuals or a broader class of circumstances. In practice,successful statistical inference requires good data production, data analysis to ensurethat the data are regular enough, and the language of probability to state conclusions(Moore, 2004, p. 172).
The Place of Statistical Inference in the Curriculum
The classical approach to teaching statistical inference was a probability theory-based explanation couched in formal language. This topic was usually introducedas a separate topic, after studying data analysis, probability, and sampling. How-ever, most students had difficulty understanding the ideas of statistical inferenceand instructors realized something was wrong about its place and portion of thecurriculum. For example, an important part of Moore’s (1997) plea for substantialchange in statistics instruction, which is built on strong synergies between content,pedagogy, and technology, was the case to depart from the traditional emphasis ofprobability and inference. While there has been discussion on whether to start withmeans or proportions first in introducing inference (see Chance & Rossman, 2001),there has been some mention about ways to bring ideas of inference earlier in acourse. The text book Statistics in Action (Watkins et al., 2004) does a nice job ofintroducing the idea of inference at the beginning of the course, asking the funda-mental question - ‘is a result due to chance or due to design’, and using simulationto try to address this question.
We believe that ideas of inference should be introduced informally at the be-ginning of the course, such as having students become familiar with seeing wherea sample corresponds to a distribution of sample statistics, based on a theory or

264 13 Learning to Reason About Statistical Inference
hypothesis. Thus, the informal idea of P-value can be introduced. These typesof informal inferences can be part of units on data and on distribution (does thissample represent a population? would it generalize to a population?), comparinggroups (do the observed differences lead us to believe there is a real difference inthe groups these samples represent?), sampling (is a particular sample value surpris-ing?), and then inference (significance tests and confidence intervals). By integratingand building the ideas and foundations of statistical inference throughout the course,we believe that students should be less confused by the formal ideas, procedures, andlanguage when they finally reach the formal study of this topic; however, there isnot yet empirical research to support this conjecture. We also recommend revisitingthe topic of inference in a subsequent unit on covariation, where students build onapplying their inference knowledge to test hypotheses about correlation coefficientsand regression slopes.
Review of the Literature Related to Reasoning AboutStatistical Inference1
Historically, there were huge conceptual hurdles to overcome in using probability models todraw inferences from data; therefore, the difficulty of teaching inferential reasoning shouldnot be underestimated.
(Pfannkuch, 2005b, p. 268)
Difficulties in Inferential Reasoning
Research on students’ informal and formal inferential reasoning suggests that stu-dents have many difficulties in understanding and using statistical inference. Theseresults have been obtained across many populations such as school and collegestudents, teachers, professionals, and even researchers. Many types of misunder-standings, errors, and difficulties in reasoning about inference have been studied anddescribed (e.g., Carver, 1978; Falk & Greenbaum, 1995; Haller and Krauss, 2002;Mittag & Thompson, 2000; Oakes, 1986; Vallecillos and Holmes, 1994; Wilkersonand Olson, 1997; Williams, 1999; Liu, 2005; Kaplan, 2006). In addition to studiesdocumenting difficulties in understanding statistical inference, the literature con-tains studies designed to help explain why statistical inference is such a difficulttopic for people to understand and use correctly, exhortations for changes in theway inference is used and taught, and studies exploring ways to develop studentsreasoning about statistical inference.
1 We gratefully acknowledge the contributions of Sharon Lane-Getaz as part of her dissertationliterature review with Joan Garfield.

Review of the Literature Related to Reasoning About Statistical Inference 265
Survey Studies on Assessments of Students’ UnderstandingStatistical Inference
In a study of introductory students’ understandings about “proving” the truth orfalsity of statistical hypotheses, Vallecillos and Holmes (1994) surveyed more than400 students from different fields who responded to a 20-item survey. One of theinteresting results in this study was that nearly one-third of the answers reflecteda faulty belief that hypothesis tests logically prove hypotheses. Additional mis-understandings were found among introductory statistics students at the end ofa one-semester introductory statistics course by Williams (1997, 1999). Williamsinterviewed eighteen respondents and found that statistical ideas of P-values andsignificance were poorly understood. In an earlier study, Williams (1997) identifiedseveral sources of students’ misunderstanding of P-values such as inadequate orvague connections made between concepts and terms used, and confusion betweenP-value and significance level. Williams (1999) also found that many introductorystudents believed that the P-value is always low.
To assess graduate students’ understanding of the relationships between treat-ment effect, sample size, and errors of statistical inference, Wilkerson and Olson(1997) surveyed 52 students. They found many difficulties students had, such asmisunderstanding the role of sample size in determining a significant P-value. Sim-ilar results were documented in a study by Haller and Krauss (2002), who surveyedinstructors, scientists, and students in psychology departments at six German uni-versities. The results showed that 80% of the instructors who taught courses in quan-titative methods, almost 90% of instructors who were not teaching such courses, and100% of the psychology students identified as correct at least one false meaning ofP-value (Haller and Krauss, 2002).
Additional difficulties in reasoning about inference were identified such as confu-sion about the language of significance testing (Batanero et al., 2000) and confusionbetween samples and populations, between α and Type I error rate with P-value(Mittag & Thompson, 2000). In sum, survey studies have identified persistent mis-uses, misinterpretations, and common difficulties people have in understanding ofinference, statistical estimation, significance tests, and P-values.
Students’ responses to inference items were described as part of an examinationof data from a national class test of the Comprehensive Assessment of Outcomes ina first Statistics course (CAOS – delMas et al., 2006). A total of 817 introductorystatistics students, taught by 28 instructors from 25 higher education institutionsfrom 18 states across the United States, were included in this study. While the re-searchers found a significant increase in percentage of correct scores from pretestto posttest on items that assessed understanding that low P-values are desirable inresearch studies, ability to detect one misinterpretation of a confidence level (95%refers to the percent of population data values between confidence limits), and abil-ity to correctly identify the standard interpretation of confidence interval, there werealso items that showed no significant gain from pretest to posttest. For these items,less than half the students gave correct responses, indicating that students did notappear to learn these concepts in their courses. These items included ability to detect

266 13 Learning to Reason About Statistical Inference
two misinterpretations of a confidence level (the 95% is the percent of sample databetween confidence limits, and 95% is the percent of all possible sample means be-tween confidence limits), and understanding of how sampling error is used to makean informal inference about a sample mean. There was also a significant increasein students selecting an incorrect response (26% on pretest and 35% on posttest),indicating that they believed that rejecting the null hypothesis means that the nullhypothesis is definitely false. In addition, although there was statistically significantgain in correct answers to an item that assessed understanding of the logic of asignificance test when the null hypothesis is rejected (37% correct on the pretestto 47% correct on the posttest), there were still more than half the students whoanswered this item incorrectly on the posttest.
Why Is Statistical Inference so Difficult to Learn and Use?
Reasoning from a sample of data to make inferences about a population is a hard no-tion to most students (Scheaffer, Watkins & Landwehr, 1998). Thompson, Saldanhaand Liu (2004) examined this difficulty, noting that literature on statistical inference“smudges” two aspects of using a sample.
The first aspect regards attending to a single sample and issues pertaining to ensuring thatan individual sample represents the population from which it is drawn. The second aspectregards the matter of variability amongst values of a statistic calculated from individualsamples. The two aspects get “smudged” in this way: (1) we (researchers in general) hopethat people develop an image of sampling that supports the understanding that increasedsample size and unbiased selection procedures tend to assure that a sample will look likethe population from which it is drawn, which would therefore assure that the calculatedstatistic is near the population parameter; (2) we hope that people develop an image ofvariability amongst calculated values of a statistic that supports the understanding that assample size increases, the values of a statistic cluster more tightly around the value of thepopulation parameter.
(Thompson et al., 2004, p. 9)
Thompson et al. (2004) state that they see ample evidence from research on under-standing samples and sampling that suggests that students tend to focus on individualsamples and statistical summaries of them instead of on how collections of samplesare distributed. There is also evidence that students tend to base predictions about asample’s outcome on causal analyses instead of statistical patterns in a collection ofsample outcomes. They view these orientations as problematic for learning statisti-cal inference because they appear to “disable students from considering the relativeunusualness of a sampling process’ outcome” (Thompson et al., 2004, p. 10). Theseauthors report on a study that explored students developing reasoning about inferencein two teaching experiments in high school mathematics classes that involve activitiesand simulations to build ideas of sampling needed to understand inference. They foundthat those students who seemed to understand the idea and use a margin of error for asample statistics had developed what. Saldanha and Thompson (2002) called a “mul-tiplicative conception of sample” – a conception of sample that entails recognition ofthe variability among samples, a hierarchical image of collections of samples that si-multaneously retain their individual composition, and the idea that each sample has an

Review of the Literature Related to Reasoning About Statistical Inference 267
associated statistic that varies as samples varied. This study suggested that if studentscould be guided to develop this reasoning, they would be better able to understandstatistical inference. Indeed, Lane-Getaz (2006) developed a visual diagram to helpstudents develop this type of reasoning that has been adapted and used in the lessonsin this book (Simulation of Samples Model, see Chapters 6 and 12).
Other studies designed to reveal why students have difficulty learning statisticalinference have examined how this reasoning develops and offer suggested ways tohelp students move toward formal inference (e.g., Biehler, 2001; Konold, 1994b;Liu, 2005; Pfannkuch, 2006a).
Using Simulation to Illustrate Connections Between Samplingand Inference
Recent research suggests that improving the instruction of sampling will help studentsbetter understand statistical inference (e.g., Watson, 2004). This can be done by usinggood simulation tools and activities for teaching sampling distribution and the CentralLimit Theorem (e.g., delMas et al., 1999; Chance et al., 2004).
However, using these simulation tools is not enough; they need to be linked toideas of statistical inference. Lipson (2002) used computer simulations of the sam-pling process and concept maps to see how college students connected samplingconcepts to statistical inference. She found that while the simulations appeared tohelp students understand some aspects of sampling distributions, students did notappear to be linking these ideas to hypothesis testing and estimation. In a subsequentstudy, Lipson, Kokonis, and Francis (2003) devised a computer simulation sessionto support the development of students’ conceptual understanding of the role of thesampling distribution in hypothesis testing. The researchers identified four devel-opmental stages through which students progress while using the visual simulationsoftware: (a) recognition of the software representations, (b) integration of the threeconcepts of population, sample, and sampling distribution; (c) contradiction that thesample may not be typical of the hypothesized population, and (d) explanation ofresults from a statistical perspective. A stumbling block for the students appeared tobe that that they looked for a contextual explanation rather than a statistical explana-tion, even when they acknowledged the low probability of the sample coming fromhypothesized population. The researchers concluded that current software supportedthe recognition stage only, and suggested that students need to have a substantialexperience in thinking about samples and sampling.
Some statistics educators (e.g., Biehler, 2001; Gnanadesikan et al., 1987; Jones,Lipson & Phillips, 1994; Konold, 1994b; Scheaffer, 1992) advocate that inferenceshould be dealt with entirely from an empirical perspective through simulationmethods to help students understand how statistical decisions are made. One suchapproach is the resampling method. Konold (1994b) used his DataScope Software(Konold & Miller, 1994) tool to introduce resampling methods to help studentsdevelop a more intuitive idea of a P-value. Mills (2002) summarizes papers that giveexamples of how simulation can be used to illustrate the abstract ideas involved inconfidence intervals; however, it is difficult to locate research studies that documentthe impact of these methods on students’ reasoning.
268 13 Learning to Reason About Statistical Inference
Informal Reasoning About Statistical Inference
A topic of current interest to many researchers as well as teachers of statistics isinformal inferential reasoning rather than formal methods of estimation and tests ofsignificance (e.g., Pfannkuch, 2005a). As new courses and curricula are developed,a greater role for informal types of statistical inference is anticipated, introducedearly, revisitedoften, anddeveloped throughuseof simulationand technological tools.
Informal Inferential Reasoning is the cognitive activities involved in informallydrawing conclusions or making predictions about “some wider universe” from datapatterns, data representations, statistical measures and models, while attending tothe strength and limitations of the drawn conclusions (Ben-Zvi et al., 2007). Infor-mal inferential reasoning is interconnected to reasoning about distribution, measuresof centre, variability, and sampling within an empirical enquiry cycle (Pfannkuch,2006a; Wild & Pfannkuch, 1999).
Rubin et al. (2006) conceptualize informal inferential reasoning as statisticalreasoning that involves consideration of multiple dimensions: properties of dataaggregates, the idea of signal and noise, various forms of variability, ideas aboutsample size and the sampling procedure, representativeness, controlling for bias,and tendency. Bakker, Derry, and Konold (2006) suggest a theoretical framework ofinference that broadens the meaning of statistical inference to allow more informalways of reasoning and to include human judgment based on contextual knowledge.
Using the Logic of an Argument to Illustrate Hypotheses Testing
Ben-Zvi (2006) points out that informal inference is closely related also to argu-mentation. Deriving logical conclusions from data – whether formally or informally– is accompanied by the need to provide persuasive explanations and argumentsbased on data analysis. Argumentation refers to discourse for persuasion, logicalproof, and evidence-based belief, and more generally, discussion in which disagree-ments and reasoning are presented (Kirschner, Buckingham-Shum, & Carr, 2003).Integration and cultivation of informal inference and informal argumentation seemto be essential in constructing students’ statistical knowledge and reasoning in richlearning contexts. This view is supported by Abelson (1995), who proposes twoessential dimensions to informal argumentation: The act or process of deriving con-clusions from data (inference), and providing persuasive arguments based on thedata analysis (rhetoric and narrative).
Part of making a statistical argument is to know how to examine and portraythe evidence. In statistical inference, this means understanding how a sample resultrelates to a distribution of all possible samples under a particular null hypothesis.Therefore, one type of informal inference involves comparing samples to samplingdistributions to get a sense of how surprising the results seem to be. This type ofinformal reasoning is based on first having an understanding of sampling and sam-pling distributions (see Chapter 12).

Implications of the Research: Teaching Students to Reason About Statistical Inference 269
Students’ Dispositions Regarding Statistical Inference
Another important research topic is students’ dispositions and their relation to sta-tistical proficiency. Kaplan (2006) studied the extent to which differences in psy-chological dispositions can explain differences in the development of students’ un-derstanding of hypothesis testing. Kaplan investigated undergraduate students whohave taken an algebra-based statistics course. She used large samples to find rela-tionships between statistics learning and dispositions and smaller samples to un-cover themes and common conceptions and misconceptions held by undergraduatestatistics students. No relationships were found between the statistics learning andthe dispositions that were studied: “Need for Cognition,” and “Epistemological Un-derstanding.” The research did identify three emergent themes in the student discus-sions of hypothesis testing: how students consider the experimental design factorsof a hypothesis test situation, what types of evidence students find convincing, andwhat students understand about P-values.
Teachers’ Understanding of Statistical Inference
Content and pedagogical-content knowledge of statistics teachers have a consider-able influence on what and how they teach in the classroom. Liu (2005) exploredand characterized teachers’ understanding of probability and statistical inference,and developed a theoretical framework for describing teachers’ understanding. Tothis end, she analyzed a seminar with eight high school teachers. Liu revealed thatthe teachers experienced difficulties in understanding almost every concept that isentailed in understanding and employing hypothesis testing. Beyond the complexityof hypothesis testing as a concept, Liu conjectured that teachers’ difficulties weredue to their lack of understanding of hypothesis testing as a tool, and of the char-acteristics of the types of questions for which this tool is designed. Although theteachers were able to root the interpretation of margin of error in a scheme ofdistribution of sample statistics, some of them were concerned with the additivedifference between a population parameter and a sample’s estimate of it. This studyrevealed a principle source of disequilibrium for these teachers: They were asked todevelop understandings of probability, sample, population, distribution, and statisti-cal inference that cut across their existing compartments.
Implications of the Research: Teaching Students to ReasonAbout Statistical Inference
Deepen the understanding of inferential procedures for both continuous and categoricalvariables, making use of randomization and resampling techniques.
(Scheaffer, 2001)
The research suggests that understanding ideas of statistical inference is extremelydifficult for students and consists of many different components. Many of these

270 13 Learning to Reason About Statistical Inference
components themselves are difficult for students to understand (e.g., sampling dis-tributions). Simulation and resampling methods are viewed as having the poten-tial to offer a way to build informal inferences without focusing on the details ofmathematics and formulas. In addition, using data sets and questions in early dataanalysis units to have students consider informal inferences (e.g., what does thissample suggest about the population, what do we believe about the difference inmeans for these two groups that these two samples come from) may help developformal ideas of inference in later units.
In studying the difficulties students have reasoning about statistical inference,many different types of errors and misunderstanding have been identified, as wellas a detailed description about what it means to reason about different aspects ofstatistical inference. Being aware of the complexities of the ideas as well as thecommon misunderstandings can help teachers be on the alert for student difficultiesthrough formal and informal assessments that can be used for diagnostic purposes.
Some of the ideas related to correct (and incorrect) reasoning about two as-pects of statistical inference: P-values and confidence intervals have been de-tailed by the Tools for Teaching and Assessing Statistical Inference Project (seehttp://www.tc.umn.edu/∼delma001/stat tools/). For example, some common mis-conceptions about P-values and confidence intervals are summarized as follows:
Misconceptions about P-values
� A P-value is the probability that the null hypothesis is true.� A P-value is the probability that the null hypothesis is false.� A small P-value means the results have significance (statistical and practical
significance are not distinguished).� A P-value indicates the size of an effect (e.g., strong evidence means big effect).� A large P-value means the null hypothesis is true, or provides evidence to sup-
port the null hypothesis.� If the P-value is small enough, the null hypothesis must be false.
Misconceptions about Confidence Intervals
� There is a 95% chance the confidence interval includes the sample mean.� There is a 95% chance the population mean will be between the two values
(upper and lower limits).� 95% of the data are included in the confidence interval.� A wider confidence interval means less confidence.� A narrower confidence interval is always better (regardless of confidence level).
Suggestions for Teaching Statistical Inference
As mentioned at the beginning of this chapter, there is little empirical researchon the effectiveness of different instructional strategies, sequences of activities, or

Suggestions for Teaching Statistical Inference 271
technological tools in helping students develop correct reasoning about statisticalinference. However, there are many strong and often conflicting beliefs amongstatistics educators about optimal methods of teaching these ideas. Arguments havebeen made for teaching inferences on proportions before means, teaching confi-dence intervals before tests of significance, not teaching students the method ofpooling variances in comparisons of two-sample means, and abandoning t-testsaltogether and instead using resampling and randomization methods. We describebelow some of the suggestions that we believe to be aligned with the approachesdescribed in our book and which we have used to build our suggested sequences ofactivities, acknowledging that they are not necessarily based on empirical researchstudies, and that their effectiveness is untested at this point.
Connecting Statistical Inference to Data Collection, Description,and Interpretation
Rossman and Chance (1999) offer “Top Ten” list of recommendations for teach-ing the reasoning of statistical inference. Their goal is to help students to focuson investigation and discovery of inferential reasoning, proper interpretation andcautious use of results, and effective communication of findings. The list includesthe following recommendations:
1. Have students perform physical simulations to discover basic ideas of inference.2. Encourage students to use technology to explore properties of inference proce-
dures.3. Present tests of significance in terms of P-values rather than rejection regions.4. Accompany tests of significance with confidence intervals whenever possible.5. Help students to recognize that insignificant results do not necessarily mean
that no effect exists.6. Stress the limited role that inference plays in statistical analysis.7. Always consider issues of data collection.8. Always examine visual displays of the data.9. Help students to see the common elements of inference procedures.
10. Insist on complete presentation and interpretation of results in the context ofthe data.
Presenting Statistical Inference as Argumentation
A more recent approach to teaching statistical inference is to connect these ideasto the making of an argument, as described earlier by Ben-Zvi (2006). The logic ofarguments can be used to explain the reasoning of a hypothesis test as follows:
� In statistics, we argue about claims (hypotheses) we believe to be true or false.While we cannot prove they are true or false, we can gather evidence to supportour argument.
� A hypothesis test can be viewed as a method for supporting an argument.
272 13 Learning to Reason About Statistical Inference
� An argument (hypothesis test) may originate from two different perspectives:wanting to argue against a claim (i.e., the null hypothesis) or wanting to arguefor a claim (i.e., the research (alternative) hypothesis).
� Just as in real life, even if we convince someone by our argument, we are onlyconvincing them with evidence, we cannot really establish if our claim is actuallytrue or not. In a hypothesis test, we only decide if the evidence is convincingenough to reject the null hypothesis, but not prove it is true or false.
� In order to make a good argument, we need four building blocks:
1. A clear claim we are making (and a counterclaim that includes all other pos-sibilities).
2. Data to support our argument.3. Evidence that the data are accurate and reliable, not misleading.4. A good line of reasoning that connects our data to our argument.
� In real life when we make an argument, the resolution is that we win or lose theargument based on how convincing our argument is. This is based on the strengthof our evidence, and how we use the evidence to support our case. In a hypothesistest, the result is to reject or fail to reject the null hypothesis, which is based onthe size of the obtained P-value.
� We need to see how far away our data are from the claim we are arguing against.Therefore, we look for data that are far from what we would expect if the claimwe are arguing against is true. A low P-value results from data that are far fromthe claim we are arguing against, and the lower (farther) they are, the strongerthe evidence.
Introducing the idea of an argument would seem to be a useful way to help studentsunderstand the process of making and testing hypotheses, and may help studentsbetter understand this complex and often counterintuitive procedure.
Basing Inference on Simulation and Randomization
While many educators have advocated the use of simulations to help students un-derstand the connections between sample, population, and sampling distribution ininference, to illustrate the abstract ideas of confidence interval (e.g., Mills, 2002)others have suggested that traditional approaches to inference be replaced entirelywith resampling methods (e.g., Simon, Atkinson, & Shevokas 1976; Simon, 1994;Konold, 1994b). More recently, in light of flexible and accessible technologicaltools, educators such as Cobb (2007) and Kaplan (2007) have suggested radicallydifferent approaches to statistical inference in the introductory course. Their sug-gestions place inference as the focus of a course that teaches three R’s: Randomizedata production, Repeat by simulation to see what’s typical, and Reject any modelthat puts your data in the tail of the distribution (see Cobb, 2007). We find theseideas very appealing but have not yet explored ways to build a sequence of lessonsaround them and experimented with them in our classes.

Progression of Ideas: Connecting Research to Teaching 273
Progression of Ideas: Connecting Research to Teaching
Introduction to the Sequence of Activities to Develop ReasoningAbout Statistical Inference
The sequence of ideas and activities for inference represent one of many possibleways to guide students to develop good inferential reasoning, and we do not havea strong conviction that this sequence is an optimal one. Although we have usedthese lessons and find them to work well in engaging students, we believe that itmight be better to adopt more of an informal and conceptual approach, rather thanleading students to learn the formal aspects of testing hypotheses and construct-ing confidence intervals. However, we provide examples in this chapter of how tobuild lessons about inference on the previous big ideas and activities, and makeconnections between foundational concepts and the formal aspects of statisticalinference.
We suggest that ideas of informal inference are introduced early in the courseand are revisited in growing complexity throughout the course. Underlying thedevelopment of this inferential reasoning is a fundamental statistical thinking el-ement, consideration of variation (Moore, 1990; Wild & Pfannkuch, 1999), andhow variability of data and samples is a key part of making inferences. This meansthat students have opportunities to see and describe variability in samples through-out the course as they make informal inferences about how these samples relateto the population from which they were drawn, and whether these samples leadus to infer about what that population might be. When ideas of formal inferenceare eventually introduced, they are devoid of computations and formulas so thatstudents can focus on what the ideas of null and alterative hypothesis mean, theidea of P-value, and types of errors. The computer is used to run tests and gener-ate confidence intervals before students see the formulas. The culmination of thisprogression of ideas is giving students a set of research questions and associateddata and having them use their statistical thinking to choose appropriate proce-dures, test conditions, arrive at conclusions, and provide evidence to support theseconclusions.
In addition to the progression from informal to formal methods of statisti-cal inference, we suggest the use of two important pedagogical methods. Oneis the modeling by the teaching of statistical reasoning and thinking in makingstatistical inference. This means, making their thinking visible as they go fromclaims to conclusions, checking conditions, considering assumptions, questioningthe data, choosing procedures, etc. The second is the use of the argumentationmetaphor for hypothesis testing as described earlier. This means using the lan-guage of arguing about a claim, whether we believe a claim is true, the role ofevidence and using that evidence well, and what it takes to be convinced that theclaim is true or false. Table 13.1 shows a suggested series of ideas and activitiesthat can be used to guide the development of students’ reasoning about statisticalinference.
274 13 Learning to Reason About Statistical Inference
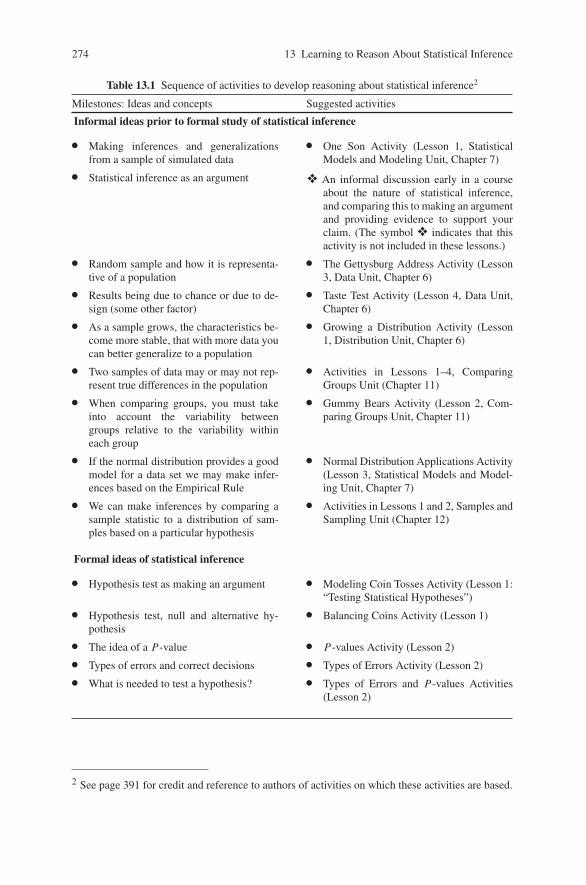
Table 13.1 Sequence of activities to develop reasoning about statistical inference2
Milestones: Ideas and concepts Suggested activities
Informal ideas prior to formal study of statistical inference
� Making inferences and generalizationsfrom a sample of simulated data
� One Son Activity (Lesson 1, StatisticalModels and Modeling Unit, Chapter 7)
� Statistical inference as an argument ❖ An informal discussion early in a courseabout the nature of statistical inference,and comparing this to making an argumentand providing evidence to support yourclaim. (The symbol ❖ indicates that thisactivity is not included in these lessons.)
� Random sample and how it is representa-tive of a population
� The Gettysburg Address Activity (Lesson3, Data Unit, Chapter 6)
� Results being due to chance or due to de-sign (some other factor)
� Taste Test Activity (Lesson 4, Data Unit,Chapter 6)
� As a sample grows, the characteristics be-come more stable, that with more data youcan better generalize to a population
� Growing a Distribution Activity (Lesson1, Distribution Unit, Chapter 6)
� Two samples of data may or may not rep-resent true differences in the population
� Activities in Lessons 1–4, ComparingGroups Unit (Chapter 11)
� When comparing groups, you must takeinto account the variability betweengroups relative to the variability withineach group
� Gummy Bears Activity (Lesson 2, Com-paring Groups Unit, Chapter 11)
� If the normal distribution provides a goodmodel for a data set we may make infer-ences based on the Empirical Rule
� Normal Distribution Applications Activity(Lesson 3, Statistical Models and Model-ing Unit, Chapter 7)
� We can make inferences by comparing asample statistic to a distribution of sam-ples based on a particular hypothesis
� Activities in Lessons 1 and 2, Samples andSampling Unit (Chapter 12)
Formal ideas of statistical inference
� Hypothesis test as making an argument � Modeling Coin Tosses Activity (Lesson 1:“Testing Statistical Hypotheses”)
� Hypothesis test, null and alternative hy-pothesis
� Balancing Coins Activity (Lesson 1)
� The idea of a P-value � P-values Activity (Lesson 2)� Types of errors and correct decisions � Types of Errors Activity (Lesson 2)� What is needed to test a hypothesis? � Types of Errors and P-values Activities
(Lesson 2)
2 See page 391 for credit and reference to authors of activities on which these activities are based.

Progression of Ideas: Connecting Research to Teaching 275
Table 13.1 (continued)
� Confidence interval as an estimate ofparameter, with margin of error
� Introduction to Confidence Intervals (Les-son 2)
� Understanding how confidence inter-vals may be presented in differentways
� Introduction to Confidence Intervals (Les-son 2)
� Understanding what 95% refers to in aconfidence interval
� Estimating with Confidence, EstimatingWord Lengths, and What Does the 95%Mean Activities (Lesson 3: “Reasoningabout Confidence Intervals”)
� A statistically significant differencebetween two groups where randomiza-tion of conditions has taken place
� Gummy Bears Revisited Activity (Lesson4: “Using Inference in an Experiment”)
Building on formal ideas of statistical inference in subsequent topics
� Statistically significant correlation co-efficient
� Activities in Lesson 3, Covariation Unit(Chapter 14)
� Statistically significant regressionslope
� Activities in Lesson 3, Covariation Unit(Chapter 14)
� There are many types of statistical in-ferences, and software may be used bycorrectly choosing the commands
� Research Questions Involving StatisticalMethods Activity (Lesson 5: “ApplyingMethods of Statistical Inference”)
� Understanding that the interpretationof P-values and confidence dependson assumptions being met
� Research Questions Involving StatisticalMethods Activity (Lesson 5)
Introduction to the Lessons
There are five lessons on statistical inference that begin with informal ideas andlead to running tests of significance and confidence intervals on the computer. Thefocus is on understanding the ideas and methods and interpreting the results, ratherthan on formulas and computing test statistics. The lessons proceed very slowly,building on informal ideas from previous lessons and also integrating ideas of ar-gumentation. The final lesson provides students with an opportunity to think sta-tistically and to integrate and apply their knowledge, as they are given only re-search questions and a data set and need to answer the questions using the data andsoftware.

276 13 Learning to Reason About Statistical Inference
Lesson 1: Testing Statistical Hypotheses
This lesson uses the context of balancing a coin on its edge to introduce formalideas of testing hypotheses. The proportion of heads obtained when a balanced coinfalls is used to test a null distribution based on equally likely outcomes. The ideaof the P-value is examined visually and conceptually, and then P-values are foundusing simulation software. The argumentation metaphor is used to explain the logicof testing hypothesis. Student learning goals for this lesson include:
1. Connect informal to formal ideas of statistical inference.2. Introduce the process and language of significance tests.3. Use Sampling SIM to conduct an informal test of significance.4. Understand the use of P-value in a test of significance.
Description of the Lesson
In the Modeling Coin Tosses activity, the instructor holds up a penny and asks whatstudents expect if the coin is tossed. It is agreed while the outcome of a toss isunpredictable, that they expect a fair penny to land with Heads up half the time andwith Tails up half the time. Students make a conejcture about what would happenif they balance a coin on its edge and let it fall, and if this is done many times,would it also land Heads and Tails in fiarly equal numbers. They are asked howto determine if a balanced coin is just as likely to land Heads up as it is to landHeads down.
Students discuss in pairs and then write down possible numbers of Heads theymight expect to get for 8 sets of 10 tosses of a fair penny (e.g., list the number ofHeads out of 10 for eight repetitions of this experiment). They are asked whetherthey expect to get 5 Heads each time, or if they expected some variability betweenresults of each set of 10 tosses, and how variable they expected each set of 10 to bein the number of Heads produced. Students also reason about what outcomes theywould consider to be less likely if using a “fair” coin and why.
Next, students use Sampling SIM to model tossing a fair coin ten times. Theysketch the resulting distribution of sample proportions and describe it in terms ofshape, center, and spread. Students shade in areas of the distribution that includewhat they would consider to be surprising results, so that if they obtained one ofthose results, they might question the assumption that the coin is equally likely toland Heads up or down (probability of Heads is 0.5).
In the Balancing Coins activity, students are asked what they think will happenif they balance sets of 10 pennies on their edge and let them fall, and if they ex-pect the same number of Heads and Tails when flippoing a coin (p = 0.5). They areintroduced to the idea of testing a statistical hypothesis, as shown below:
Idea 1: Balancing a coin is a “fair” process: Heads and Tails are equally likely to result.Idea 2: Balancing a coin is an “unfair” process: There will be a higher percent of Heads orTails.

Lesson 1: Testing Statistical Hypotheses 277
These ideas are then written as statistical hypotheses:
Null hypothesis: The proportion of Heads when we balance a coin repeatedly is 0.5.Alternative hypothesis: The proportion of Heads when we balance a coin repeatedly is not0.5. (In other words the proportion is more, or less, than 0.5.)
The null hypothesis is discussed as an idea of no difference from the norm or priorbelief (e.g., getting the same results as tossing fair coins). The alternative hypothesisis discussed as a statement that there will not be an equal number of Heads and Tails,something contrary to the first idea.
Students are told that we gather evidence (data) and determine whether or notit supports the null hypothesis or whether it provides convincing support for analternative hypothesis. To do this, students design an experiment to lead them tomake a decision about which of the two hypotheses are supported by the data. Theydiscuss what is needed to test a hypothesis or to make a good argument given thiscontext:
1. A hypothesis to test (e.g., the proportion of Heads is 0.5) (The claim).2. A sample of data which gives us a sample statistic (e.g., a sample proportion).3. A sampling distribution for that statistic (based on the null-hypothesis) so we can
see how unusual or surprising it is, by seeing if it is far off in one of the Tails(surprising) or in the middle (not surprising). This sampling distribution is basedon the null hypothesis and the sample size for our sample data. If our samplestatistic is in one of the Tails, that would lead us to reject H0 (A method to testthe claim).
4. A decision rule: how far is far off in the Tails? How far in one of the Tails doesour sample statistic need to be for us to decide it is so unusual and surprising thatwe reject the idea stated in H0, that the coin is equally likely to land Heads up orHeads down when we balance it? (How to evaluate the strength of the evidence.)
Students then get in groups and balance coins, counting the result when the coinsfall. The numbers of Heads and Tails are tallied, proportions of Heads for each set of10 balances are found and gathered for the class. The sample proportions typicallyrange from 0.5 to 0.9.
The next discussion regards an appropriate sampling distribution to use to judgewhether their results are due to chance or whether the chances of getting Heads whenbalancing a coin is greater than 0.5. They decide to refer to the simulation createdearlier (in the Modeling Coin Tosses Activity, Lesson 1), which allows a comparisonof their sample statistics to what they would expect if the coin is equally likely toturn up Heads or Tails when balanced. Students use their sketches made earlier inthe activity to determine whether or not this result is in a tail. They mark the sampleproportion for their group in the graph and discuss whether they think this result issurprising, and why or why not. This leads to an examination of what percent ofthe distribution has values more extreme than theirs. They use Sampling SIM to findthis area.
This value is discussed as the chance of getting the result students got or a moreextreme one, and is referred to as a P-value. The role of the P-value in making

278 13 Learning to Reason About Statistical Inference
a decision is seen as helping determine which of the two hypotheses seems morelikely. Students discuss how small a P-value must be to be judged surpassing andleading them to reject the null hypothesis. Again, the argument metaphor is used,and the P-value is described as an indicator of how convincing the evidence isagainst the claim (null hypothesis). The farther it is in the tails, the more we areconvinced that the null hypothesis (claim) is false. So the smaller the P-value, thestronger is the evidence. Students evaluate their P-values and determine whetherthey reject the claim that the coin is equally likely to land Heads up or Heads downwhen balanced on its edge. The class then combines their data to get a better, morestable estimate of the proportion of Heads, and test this result using the SamplingSIM software and finding the P-value via simulation.
Students are asked what conclusion can be drawn about the original researchquestion, and then apply the same procedure in determining whether or not theybelieve a Euro coin is equally likely to land Heads up or down when tossed, usingdata from a series of 100 tosses of a Euro coin.
A wrap-up discussion reviews the process of hypothesis testing (hypotheses,data-sample statistic, sampling distribution, and decision rule) and how this processmaps to making a convincing argument. The Simulation of Samples (SOS) Model isrevisited and used to map the different levels of data: population, sampling distribu-tion, and sample value.
Lesson 2: P-values and Estimation
This lesson builds on the previous lesson, using the context of balancing coins totest hypothesis and learn the language of tests of significance. This lesson also in-troduces the idea of a confidence interval, helping students see the two parts of theinterval (e.g., sample statistic and margin of error) and different ways or reportingconfidence intervals. Students also begin to interpret a confidence interval. Studentlearning goals for this lesson include:
1. Review use of simulations for inference.2. Review the process for hypothesis testing.3. Learn about the two types of errors when conducting tests of significance.4. Use Fathom to conduct a test of significance.5. Understand the idea of a confidence interval as a way to estimate a parameter.
Description of the Lesson
After balancing pennies in the previous lesson, students are asked if they think thatbalancing the Euro coin will yield equally likely chances of getting Heads andTails. In the P-values activity, they are given a sample result from a person whobalanced a Euro 100 times and got 31 Heads. First, students repeat the process theyused earlier, of finding this sample proportion and comparing it to the simulated

Lesson 2: P-values and Estimation 279
sampling distribution for a null hypothesis of equally likely outcomes. Next theyuse Fathom software to find P-values without simulation. These two P-values arecompared and students reason about why the P-value from the simulation is notexactly the same as the one produced by Fathom (Sampling SIM ran 500 simulationswhile Fathom is basing their result on the true sampling distribution of all possiblesamples).
In the Types of Errors activity, students review the steps of the previous lesson(Lesson 1 on Testing Statistical Hypotheses) discussing the components needed totest a hypothesis and how these compare to the argumentation process. They mapthe types of errors (Type 1 and Type 2) to this context of balancing the Euro coin.For example:
1) We select Ha but it is the wrong decision because H0 is true (Type 1 error).2) We select H0 but it is the wrong decision because H0is not true (Type 2 error).
Another context is provided and students try to reason about what the different typesof errors would mean in that context and the importance of keeping the chanceof making these errors small. The idea of alpha as the chance of making a Type1 error is contrasted to the idea and role of the P-value, and what is meant bythe term “statistically significant.” This term is compared to winning an argumentbecause the evidence is strong, and compelling. However, winning an argumentby presenting strong evidence may also result in an error, if the claim being dis-puted is actually true. So this parallel is drawn to rejecting a hypothesis when it isactually true.
The next activity, Introduction to Confidence Intervals, examines what happensafter a null hypothesis is rejected. In this case, balancing a Euro will result in anequal number of Heads and Tails. Students are referred back to the Euro data andmake a conjecture about the proportion of Heads they would expect to find in a largenumber of repetitions of this experiment. When students give different answers orranges of answers, it is suggested that because we are unsure about giving a singlenumber as our estimate, due to variability of our sample data, we might feel moreconfident about offering a range of values instead. Students are asked what interval,or range of values, might give an accurate estimate of possible values for this “true”proportion of Heads when a Euro coin is balanced on its edge and falls down. Tomove to the formal idea of a confidence interval, students are given the followingnews clip to read:
A recent poll of people in the military stated: While 58% say the mission (beingin Iraq) is clear, 42% say that the U.S. role is hazy. The survey included 944military respondents interviewed at several undisclosed locations throughoutIraq. The margin of error for the survey, conducted from Jan. 18 through Feb.14, 2006, is ± 3.3 percentage points.

280 13 Learning to Reason About Statistical Inference
Students are guided to use the information stated above to obtain an interval estimatefor the percentage of all people in the military who believe the mission is hazy. Theyconstruct a confidence interval using this information. They see that they need twopieces of information that are given in this article: This information is then relatedback to the problem of finding a confidence interval for the proportion of Headswhen balancing a Euro coin. This includes:
� A sample statistic (e.g., the class proportion of Heads when balancing coins),and,
� A margin of error (an estimate of how much this statistic varies from sample tosample for a given sample size, calculated from the sample data and informationfrom the sampling distribution for the sample statistic).
Students are shown two ways to present confidence intervals:
� The sample average, plus or minus a margin of error (e.g., estimating the averagetextbook price for statistics, $80 ± $15).
� The two endpoints (low and high values) of the interval. (e.g., $65–$95).
The relationship of the confidence level to the idea of error is examined, and stu-dents reason about what a confidence interval tells about estimating a parameter andpossibly making an error about that estimate. Students see that a confidence intervalprovides two kinds of information: an interval estimate for the population parameter(rather than a single number estimate) and a level of confidence (how confident weare that our interval includes the population value we want to estimate).
A wrap-up discussion includes what the term “margin of error” means, and howthis term is used when interpreting results from a poll. Students describe the sampleand the population for the survey reported above and critique it, referring back tomaterial from the unit on Data related to designing good surveys (Lessons 1 and 2in the unit on Data, Chapter 6). Students also consider and discuss different inter-pretations of the poll results, such as: Can we use our interval to give a guess aboutthe true percentage of all people in the military that believe the mission is hazy?How? How sure are we? Are there any problems with generalizing from our sampleof 944 military respondents to all people in the military?
Lesson 3: Reasoning About Confidence Intervals
This lesson helps students develop their reasoning about confidence intervals byusing simulation to make and test conjectures about factors that affect confidenceintervals. They also have opportunities to discuss common misconceptions as theycritique interpretations of confidence intervals. Student learning goals for this lessoninclude:
1. Develop reasoning about confidence interval.2. Understand what 95% confident actually means.

Lesson 3: Reasoning About Confidence Intervals 281
3. Understand how sample size and confidence level affect the length of the confi-dence interval.
4. Become familiar finding a confidence interval using Fathom software.5. Understand connections between confidence intervals and hypothesis tests.
Description of the Lesson
In the Estimating with Confidence activity, students return to the question from theprevious lesson: “What is the true (expected) proportion of Heads when a Euro isbalanced?” Now that they believe that the proportion of Heads when a Euro balancedis not equal to 0.5, then what is it? Students now know the idea of a confidenceinterval. Fathom is used to produce a confidence interval for the sample of databased on balancing a Euro coin. The class discusses how to interpret this result andare asked what type of estimate might be more informative about the location of theactual population parameter, a narrower or wider interval, and why.
Connections are then made between testing a hypothesis and estimating with aconfidence interval, and students see how a confidence interval can be used to testa hypothesis. Students make a conjecture about how the confidence interval wouldbe different if they had only 50 pieces of data rather than 100, and then if theyhad 1,000 data values and why. This conjecture will be examined later in a sim-ulation activity. Students reflect on the previous unit on sampling and distinguishbetween the sample statistic and a population parameter for the Euro coin exam-ple, and how much they would expect a sample statistic to vary from a populationparameter.
In the Estimating Word Lengths activity, students return to the Gettysburg Ad-dress activity from the unit on Data (Lesson 3 in Chapter 6) in which they sampledwords from the Gettysburg Address. They use the Gettysburg Address as a popu-lation and take samples and construct confidence intervals to see how they behaveand how to interpret them. They use the Gettysburg Address Web applet to take arandom sample of 25 words and then use Fathom to find a 95% confidence intervalto estimate the true mean word length for all of the words in the Gettysburg Ad-dress. Next, the students draw their confidence intervals on the board, one on top ofanother. These intervals are compared to the true population mean word length, andstudents examine how many of the intervals generated by the class overlap the truepopulation mean. Students are asked what percentage of all the intervals in the classthey would expect to not overlap the population mean and find it is close to whatthey have generated.
The next activity (What Does the 95% Mean?) leads students use Sampling SIMto make and test conjectures about confidence intervals. They sample data fromdifferent populations such as a normal curve as well as for a skewed distribution,which is shown in Fig. 13.1.
Students generate 200 95% confidence intervals for samples of size 25 and ex-amine how many do not include the population mean (shown as red lines) and howclose the proportion of intervals that include the mean is to 95% (see Fig. 13.2).

282 13 Learning to Reason About Statistical Inference
Fig. 13.1 A right-skewed population produced by Sampling SIM
They use the results from Sampling SIM to help answer the following questions thattarget common misconceptions about confidence intervals:
1. Does the level of confidence, 95%, refer to the percent of data values in theinterval?
2. Does the level of confidence, 95%, refer to the location of the sample mean orlocating the population mean? Explain.
3. Does the level of confidence, 95%, refer to a single interval (e.g., the one youfound in Fathom) or to the process or creating many intervals (e.g., all possibleintervals)? Explain.
Next, students use the Sampling SIM to make and test conjectures about what fac-tors affect the width of the confidence interval. They then test these conjectures byincreasing and decreasing the level of confidence, and changing the sample size,

Lesson 3: Reasoning About Confidence Intervals 283
Fig. 13.2 Two hundred 95% confidence intervals (sample size 25) from a right-skewed populationin Sampling SIM
Fig. 13.3 Two hundred 95% confidence intervals (sample size 50) from a right-skewed population
284 13 Learning to Reason About Statistical Inference
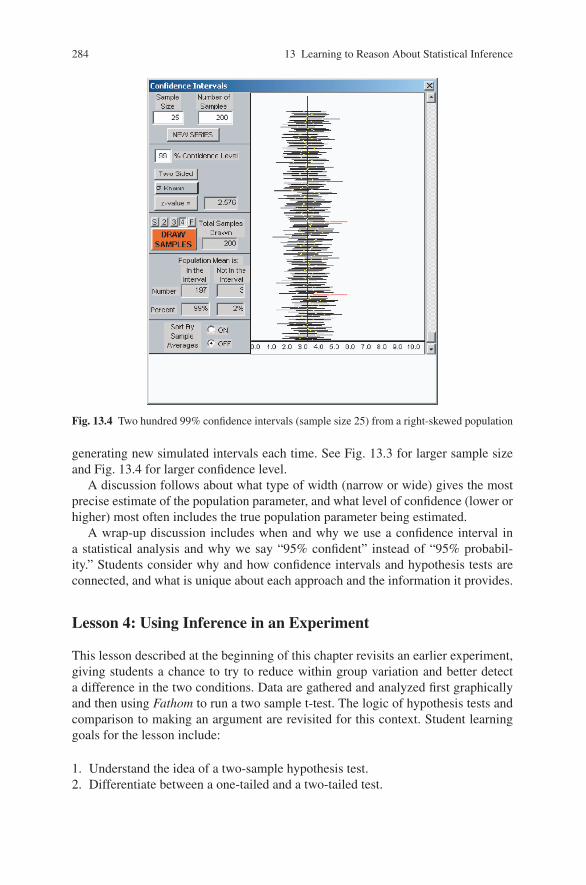
Fig. 13.4 Two hundred 99% confidence intervals (sample size 25) from a right-skewed population
generating new simulated intervals each time. See Fig. 13.3 for larger sample sizeand Fig. 13.4 for larger confidence level.
A discussion follows about what type of width (narrow or wide) gives the mostprecise estimate of the population parameter, and what level of confidence (lower orhigher) most often includes the true population parameter being estimated.
A wrap-up discussion includes when and why we use a confidence interval ina statistical analysis and why we say “95% confident” instead of “95% probabil-ity.” Students consider why and how confidence intervals and hypothesis tests areconnected, and what is unique about each approach and the information it provides.
Lesson 4: Using Inference in an Experiment
This lesson described at the beginning of this chapter revisits an earlier experiment,giving students a chance to try to reduce within group variation and better detecta difference in the two conditions. Data are gathered and analyzed first graphicallyand then using Fathom to run a two sample t-test. The logic of hypothesis tests andcomparison to making an argument are revisited for this context. Student learninggoals for the lesson include:
1. Understand the idea of a two-sample hypothesis test.2. Differentiate between a one-tailed and a two-tailed test.

Lesson 5: Solving Statistical Problems Involving Statistical Inference 285
3. Use Fathom to conduct a two-sample test.4. Understand the idea of a two-sample confidence interval (difference in means).5. Use Fathom to conduct a confidence interval to estimate a difference in means.6. Revisit the ideas of designing an experiment and making cause and effect infer-
ences.7. Revisit ideas of within and between group variation and how they affect a two
sample comparison.8. Revisit ideas of how to reduce variation within a condition, and ideas of signal
and noise in repeated measurements within each condition.
Description of the Lesson
In the Gummy Bears Revisited Activity, students reflect on the earlier Gummy Bearactivity (Lesson 2 in the Comparing Groups Unit, Chapter 11) and discuss how todetermine if there is a difference between two conditions in an experiment, in thiscase, if there are different average launching distances for the one book or four booklaunching pads. Students are asked, in light of recent discussions and activities onstatistical inference, to suggest how, if a difference in sample means is observed, thisis not just due to chance.
The students redo the experiment after first discussing a careful and systematicprotocol to follow in launching the Gummy bears. Treatments are assigned to groupsand each group produces data for 10 launches. Students use Fathom to produce sideby side boxplots, discussing what the boxplots suggest about the differences in flightdistances for the two conditions. Students are asked how to determine if the observeddifference in group means is statistically significant and what this means. The nulland alternative hypotheses are constructed and Fathom is used to run the test. Stu-dents contrast one and two tailed tests for this experiment, and run the test bothways using Fathom, contrasting the difference in results. Students explain what theresults of the hypothesis test suggest about the difference between the two launchingheights. Next, students use a confidence interval to estimate the mean difference inaverage launch. They discuss what it means if a difference of 0 is in the interval oris not in the interval. Since 0 was not in the interval, they concluded that this is astatistically significant difference in flight distances.
In a wrap-up discussion, students suggest reasons to use a one-tailed or two-tailedtest of significance, and advantages and disadvantages of each method. They reasonabout how the type of test (one or two tailed) affects the P-values obtained andwhich method is more conservative. Finally, students give a full statistical conclu-sion about the comparison of flight distances for short vs. high launching pads.
Lesson 5: Solving Statistical Problems InvolvingStatistical Inference
This lesson comes at the end of a course, after the study of covariation (see Chapter14) and helps students connect and integrate concepts and processes in statistical

286 13 Learning to Reason About Statistical Inference
inference, developing their statistical thinking. Student learning goals for the lessoninclude:
1. Review the process of conducting and interpreting a test of significance.2. Review the process for finding, reporting, and interpreting confidence intervals.3. Review the conditions/assumptions that are necessary for our inferences to be
valid.4. Be able to research questions to appropriate inferential procedures.5. Practice using Fathom to conduct tests of significance and to find confidence
intervals.6. Be able to interpret and justify results of statistical inferences.
Description of the Lesson
Discussion begins by looking back at the first few days of the course when studentssimulated data to estimate whether a sample statistic might be due to either chanceor to some other factor. For example, if a student was able to correctly identify Cokeof Pepsi in a blind taste test vs. the student was a lucky guesser. The discussionthen proceeds to when students learned how to use Fathom to generate P-valuesand confidence intervals to help in making inferences and decisions about popu-lation parameters. Now that software can be used to generate statistical results forinferences, students consider the decisions that have to be made, for example:
a. What type of analysis to run (e.g., test or estimate, one or two samples, etc.).b. What conditions to check.c. How to interpret the results (and also know if we made a mistake).
In the Research Questions Involving Statistical Methods activity, students are re-minded that the computer will generate P-values for tests of significance and con-struct confidence intervals for population parameters, even if the conditions are notchecked and met. The class discusses how one should interpret the results of a pro-cedure where the conditions are not met. Next, students are given the followingtable (Table 13.2) to discuss and complete it together, which will serve as a guidefor running different analyses to produce inferential statistics in Fathom.
Students are then given a set of research questions (as shown below in Table 13.3)and a data set to use in answering the questions, using Fathom software. The dataset contains the body measurements for a random sample of 50 college students.First, the instructor models statistical thinking, talking out loud and demonstratingthe questions and steps and interpretations involved in answering one or two of thequestions on the list below. Working together, students then discuss each question,select appropriate procedures, test conditions, generate graphs and analyses, andinterpret their results.

Lesson 5: Solving Statistical Problems Involving Statistical Inference 287
Table 13.2 A guide for running different analyses to produce inferential statistics in Fathom
Type of procedure Example of research question Fathom instructions
One sample confidenceinterval for proportion
What is the proportion of collegestudents who graduate in 4 yearsfrom your school?
One sample confidenceinterval for a mean
What is the average number of creditsearned by students when theygraduate with a bachelor’s degree?
One sample hypothesis testfor a proportion
Is the proportion of students whowithdraw during their first yearequal to 0.15 (The proportion whowithdrew 5 years ago)?
Is the proportion of students whowithdraw during their first year lessthan 0.15?
One sample hypothesis testfor a mean
Is the average number of years it takesto finish a degree equal to 5?
Is the average number of years it takesto finish a degree greater than 4?
Two sample confidenceinterval for the differencebetween two means
What is the difference in the averagenumber of hours spent studyingeach week between physics majorsand English majors?
Two sample hypothesis testto compare two means
Is there a difference in the mean GPAsof first year and fourth yearstudents?
Table 13.3 Selecting appropriate procedures and hypotheses to given research questions
Research question Type of procedure Null andalternativehypothesis (ifappropriate)
What proportion of students in this classhas a larger arm span than height?
What is the average hand span forstudents in this class?
What is the difference in hand spans formales and females?
Is the average height for female studentsgreater than 163 cm?
Is the proportion of male students who aretaller than 172.72 cm different from0.5?
Is there a difference between males andfemales in head circumference?

288 13 Learning to Reason About Statistical Inference
After students complete this work, group answers to the questions are shared andjustified.
Summary
Most students studying statistics encounter great difficulty when they reach thetopics of statistical inference. Some instructors have compared student response tolecturers on this topic as “the deer in the headlight” phenomena, as students seemfrozen, confused, and scared when learning these difficult topics. The research lit-erature documents the difficulty students have understanding inference, and typicalmisconceptions that persist regarding P-values and confidence intervals.
Although many statistics courses put statistical inference at the end of a firstcourse in statistics, we have illustrated a research-based approach that first presentsinformal ideas of inference early in the class and revisits these ideas again and again,so that when the formal ideas are introduced later they are more intuitive and easierto understand. The idea of statistical hypotheses as making arguments is used tohelp make this difficult topic more accessible to students. At the end of the course,students are given a set of research questions and need to integrate and apply allthat they have learned to determine what procedures are needed and appropriate,to provide answers, and to justify their conclusions. This process is first modeledby their instructor and then they have the opportunity to use and develop their ownstatistical thinking by approaching these questions as statisticians, rather than justsolving a series of textbook problems for each given procedure. This approach alsodiffers from more standard approaches because the computational procedures arenot emphasized. Instead, the process of using the computer to test hypotheses andestimating parameters is stressed, along with how to do this wisely and how tojustify and interpret results.