chapter v analysis of resultsshodhganga.inflibnet.ac.in/bitstream/10603/6847/13/13...chapter v...
TRANSCRIPT

CHAPTER V
ANALYSIS OF DATA AND RESULTS
u INTRODUCTION
3 SAMPLE OF T H E STUDY
u VARlABLES SELECTED EWH Tff E STUDY
u SUMMARY OF ANALYSES MADE
u TENABIL17T OF THE HYPOTHESES

CHAPTER V
ANALYSIS OF DATA AND RESULTS
5.1 INTRODIICTION
The major objective of the study was to determine the effectiveness ot'
Information Processing Models (JPM) on students' achievement in Geog,raphv.
Experimental methad was adopted to test the efyectiveness of Information Processing
Models by comparing it with that of Conventional l'eachiny Learning Method
(TTLM) co~nmonly adopted in Secondary Schools of Karala The non-equivalent
pretest-posttest control group design was selected for t h e study.
Fol this purpose three separate models from the Inf'ormatiorl
Processing Family were selected. The three models selected from the Information
Processing Family were Concept Attainment h/lodet (CAM). : idvan~:e Organizer
Madel (AOM) and Inquiry Training Model (11'M) Those taught through the Concept
Attainment Model (CAM) was treated as the Experimental Group I IExptl.l): those
through Advance Organizer Model (AOM) was the Experimental Group I I (Exptl II)
and those through Inquiry Training Model (ITM) was treated as the Experimental
Group I11 (Exptl Il l) . As has been stated earlier. those taught through the
Conventional Teachlng Learning Model (CTLM) was formed the Control goup.
5.2 SAMPLE O F THE STUDY
A sanlple of 638 students for the experiment was selected from e~ght
schools by giving representation to gender of the students, locale of residence and
marlagement of schonls. The details are given in Table 5 1 .

Table 5. I
Distribution of sample popul~tiuri iri t e r n ~ s of name o f
the school, locale of reside~lce. type o f nianngen~r~~t
and number of students selected
Total
No. of Students Selected
7 0
8 (1
80
ti0
70
6 t
7
Three experimental groups uf 1 59 students ( CAM-exptl I ) , 160
students ( AOM-erptl.11) and 1 59 students ( ITM-exptl I I I ) and a control gruup o t' 1 GO
students (CTLM) were formed.
5.3 VARIAB1,ES SELECTED FOR THE STUDY
The independent variable selected fbr the experirncut was the
instructional method at two levels, namely, the Information Processir~g Models and
S1. No.
I
-
'
5
Sex
Boys
Girls
Boys
Girls -.
Boys Muttuctura St .4_rnes G H S Muttuch~ra Government H S.S . Vaikom Government Cj H S \ia~kurn
Type of Management Govt/Private .--
Governmeti t --
Government -
1'1-1~ate - - .
Private - - . . - - -. -
1'riv;ite
of the School
Govt tl S S Ettumarinoor Govt G~rls H S.Ettumannoor St Thomas H S S Pala St Ma~v ' s G H S Pala Huiy ~ h u s l B H S
Locale/Rurn" Urban
Rural
Rural
Urban
Urban
Rural
Rural
Urban
Urban
Girls
Bovs
Gtrls
Governmetlt
--

the Conventional Teaching Learning Method. The dependent variable is the
,4chievement in Cieography as determined by the standardised tests scores The etiect
of' extraneous variables like Intelligence, Attitude towards Learning Geogaphy.
Geography Learnirly Environment and Socio-Economic Status was also studied
5.3.1 Major Ca~~nponents of the Dependent Variable
-Phe major components of the deperlderlt variables useti Irl the ptcserll
study were immediate achievement, immediate retention and itnmediate transfer.
Delayed achievement. delayed retention and delayed transfer, where the scores on the
items for retention and transfer together constitute the overall achievement
.4chievement itnrnediate and achievement delayed and the dlltkrence between
imtnediare post-test and detayed post-test were subjected to stat~st~cal analysis.
Heforc the treatment. a terminal behaviour test was adn~~nistered as pretest Atter the
experinlent two posttests were adtninislered One posttest was conducted
immediately after the treatme~lt and was termed as itnmediate post-rest. the second
post-test was administered after three weeks from the termination uf the experime~lt
This w a s known as the delayed post-test Tests were also administered to assess the
extraneous variables like Intelligence, Attitude towards Lxarn~ng Geographv.
Geographv Learnirlg Environment and Socio-Economic Status Scale The scores of'
the dependent and independent variables were subjected to statistical analvsis in order
to find the effect~veness of Information Processing Models over the Conventional
Metllod of teachii~y. A summary of different statistical analys~s of the data made is
given In the follo~v~ng section.

5.4 SUMMARY OF ANALYSES MADE
5.4. l Model Categories and Achievement
In order to find out the effectiveness of Information Pn)cessins Motlels
over the C'onventional Method, students' achieverner~t was assosse~l by adrnin~stering
the achievement tests in Geography for standard 1X in the Cotltrol Group (CTl..M)
and Experimental Groups ( C A M , AOM & ITM) before and after the treatments
lliffkrent statistical techniques were applied to compare the achievenlent test score>
obtained
The schematic representation of the variable5 selected for t he
experiment is given rn Table 5 . 2
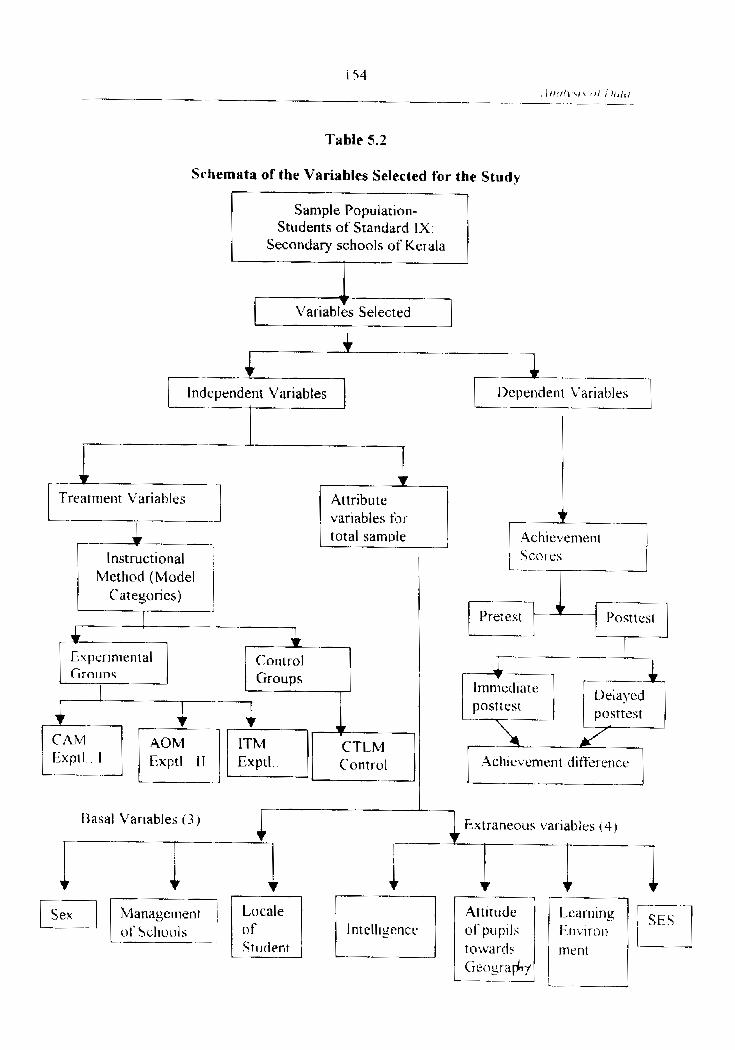
Table 5.2
Schemata of the Variables Selected for the Study
Variables Seltcted 7
lrldependent Variab tes E-
Treatment Variables
d . . . Instructional ;
Method (Model Cateyories)
Attribute variables for
Expe r~men~a l Control
Scores
----T-
of' Schuol:, of puplls St ~ l r i ~ n t towar d s merit
!

Thc inlportant statistical measures pertaining to central tendenc! and
dispersion such aa mean and standard deviation were computed till- the prytest.
immediate posttest and delayed posttest scores to study the nature of t h y scores ' fhe
statistical techniql~u ANCOVA was used for comparison of the effectiveness ot' the
Information Processlrlg Model and the conventional tnethnd of teaching Cieography i n
the secondat? schools of Kerala. The schematic representation of the stat~stical
techniques used in the study is given in Table 5 .;
'Table 5.3
Schemata of Statistical Tech~~iques used for the Study
1
Central Tendency Dispersion Variance C'ovariance (Arithmetic Mean) (Standard (ANOVA) (ANCOV.4)
Deviation)
I ntcr-action between Standard errors Sigificancc Var,~ables. One-way Errors ot' of' dificrenct. Two-way & Three-way difference bet ween bet ween Analys~s Sample means ( of,) sample ~neans
(Critical Ratio)
5.4.2 I n s f ~ ~ u c t i o ~ ~ a l Method (Model Categories) a d Student Achievcmet~t
I)i.$trihutifln uf' Pr~tc.v.st scores in itclr ievenrent in (;eogrrrpiz~
Betbre proceeding to find out the effectiveness of LLiM i t is necessap
10 study the nature of the achievement scores The nlaxlmum score in the

achievement test uas 40 The mean and standard deviation of pretest scores classified
by school and modt:! categories are given in Table 5 4
Table 5.4
Meall and Variance for Pretest Scores- Classified bv
Values in brackets are standard deviation
School and Model Categories
(iraphical representation of the mean and variance tbr- pretest scores
classified by schuol and model cateyories i s presented in F'ig 5 I
-- -- ('TI ,M
(('ontrol
ITM
(Exptl. 1I1 )
AOM
(Expti. 11)
Model categories
School
CAM
(Exptl. I)
13 6 5
(9 96)
9 10
( 3 08)
(S 2 1 85) 30
18 9q
(9 68)
16 30
( 8 45)
10 85
(4 28)
23 35
( 7 70)
17 b5
(8 73)
I6 24
( 8 67)
160
are mean
-:1-I L 12-
I 4
I-- --7 I-
41
6
7
-
8
--
Total
i--
Y
Values
13 7C) 1 Group) 1 4 i T ---
16 45
( ( 1 81 )
( 2 94)
24 05
( 7 9 1 0 16)
19 40
( 5 54)
1% 05
(9 27)
I0 89
( 4 03)
23 30
(8 75)
22 05
(8 96)
17 26
(9 08)
159
without brackets
( 0 5 : )
r) 30
( 3 I h )
17 84) -- - 8 00
( 2 7 5 ) .-
( h 20 3 5 ) 80
24 40
1 ( 0 W )
74 10 05
( I 0 84)
I j 00
(601)
I 1 60
(.: 7 9 )
3.7 95
( 7 67,)
2 0 ;<
( I 0 lcl) - -
I ; 50
(o 8 5 ) I
10 2 5
(1 74) -
7 2 40
( 6 i X ) --
2 I 00
( 7 (A) ( 4 40) - "--A
17 1.; 17 74
(9 01) ( 0 h5) t values

CAM
I II Ill IV V VI Vtl Vlll
AOM
I I! Ill IV v VI VII Vlll 1
Figure 5.1
Pretest Su~res-Classified by School and Mode l Categories

Comparison o f Pretest Scores of Pupils in the T A M (exptl.1) (;roup and C'TLM
(Control) Group
The mean and standard deviation of the pre-test scores of 1 5'J pupils in thc
C'AM (Exptl Ciroup 1 ) and 160 pupils in the C'TLM (Control) ( i roup wet-e calculated
The Critical Ratio ( C R) was found out and tested tbr significance The data and
results uf test of siy~iiticance of diffierence between inearls are given in 'Tahle 5 5
Table 5.5
Data and Results of Test of Significance of difference betweerl tneaa pretest
scores o f pupils in the CAM (exptl. 1) Group a ~ ~ d CTLM (C:ontrol) Group
S.D Critical Ratio Significar~ce
--
(expt l I ) 1726 908
I'TLM significant (C'untrul 1774 9 6 5
The Critical Ratio (C.R) obtained is not significant at 0 0 1 level. wee
the values for signiticance are 2.58 and 1 96 at 0 01 and 0 O 5 levels r.espectivel!-. t b r
dl' ! 18 This indicates that there is no significant difierence between the mean pretest
scores uf pupils ( r = 0 2 1; p -, 0.01) in CAM (exptl I ) group aud C'-l'l,M (control)
Group Since the mean score o f t he CAM (exptl 1) group and I'-]-[ .hl (control) Ciroup
shows no siynificant difference, i t indicates that the twu groups (CAM and ("7.1 ,hl) do
nor difier signiticar~tlv in the pretest scores. The inference is that the two groups do
not difl'er in their ~ n ~ t i a l academic abilitv of studerits

Comparison of Pretest Scores of Pupils Classified by School in the .40M {eaptl.
11) Group and CTLM (control) Group
The mean and standard devlation of the pretest scores of I hO pupils in the
AOM (expti 11) Group and 160 pupils in the CTLM (control) group here calculated
The Critical Ratio (C R) was found out and tested for s~gnificance The data and
rtsults of test u f s~gnificance of difference between means are given in Table 5 b
Table 5.6
Data and Resiilts o f Test o f Significance o f difference between Inean Pretest
Scores of Pupils in the AOM (exptl.11) Group and C'TLM (control) Group
The Critical Ratio (C.R) obtained is not significant at 0 01 levet. since
the values for significance are 2 . 5 8 and 1 46 at 0.0 1 and 0.05 respectively f'or degrees
of' freedom 3 19. This indicates that there is no significant diff'erence between the
rnean pretest S C O ~ C S of pupils ( t --= 1.47; p . (1.0 I ) in the AOM (csptl 11 ) Groi~p arlri
C'SLM (control) C~roup Since the mean score of the AOM (esptl 11) (-;roirp and
C'TLM (canrrol) C;rr?iips shows no significant dityerence. i t indicates tha t the two
groups (AOM and CTLM) do not differ significantly in the pretest scores She
-- --- --A
Critical Ratio I .eve1 of'
(C-R)
' s~grlificant
.
----
Group
-
AOM
(exptl 11)
C'TL,M
(Control Ciroup)
N
160
160
Mean
1624
1 7 7 4
S. D {(J)
8 6 7
9 6 4

~nference is that the two groups do not differ i n their iiiit~al acadern~c abrlitv oi'
students
Comparison of Pretest Scores o f Pupils Classified by Schuols in the ITM
(exptl.1 l I) Group and CTLM (Control) Group.
The mean and standard deviation of the pretest scores of I T 9 pup~ls in
the ITM (exptl Group 111) and 160 pupils In the CTLM (control Group) were
calculated The ('rrt~cal Ratio(C R) was found out and tested for stgn~ticat~ce 'l'iie
data and results of' the test of wgnificance of drtference betweeti ineatls are glvtin 111
Table 5 7
Table 5.7
Ilata atid Results o f Test of Significance of difference between mean Pretest
Scores of Pupils ill the ITM (exptl.111) Group i~tld CTLM (control) Group
The Critical Ratio (C R) obtamed 1s not significant at 0 0 1 level sjnce
the values for stgn~ficance are 2 58 and 1 96 at 0 0 l and 0 05 levels respect~velv for
degrees of iieedotn ? 18 This ~ndicates that there is tlo srgnlticant d~flererlct: between
t h e mean pretest scores of pupils ( t - O 58; p -. O 01 ) in t h e 11'M (exp l l I l l ) Group and
1
Cmup N I f
1TM 1 5 ' 1
Mean
1 7 1
17 74
(exptl 111)
C'TL.M (Control croup) L
-.
160
S.D (0)
9.01
9 64
-- A
Critical Ratio (C.R)
0 59
- " ."".,? -, .- -- -- I,cIW~I ( ~ f
signi ficrr nce
,l,'ot
~ I ~ ~ I ~ I C L ~ ) I I
--- - --

C'Tl..V ((control) Group Since the mean score of the ITM (rxptl I l l ) Ciroup and
C'TLM (control) Group shows no significant dif-Terence It ir~dicates that the twt)
groups (ITM and C'TLM) do not differ signiticantly in the pretest score3 l'lic.
itlt'erence is that the two groups do not diiXer significantly in theit. in~tial acadenlic
ability of students.
5.4.3 Distribution of Immediate Posttest Scores in Achievenleat
Statistical measures were applied for the immediate postles~ scores 111
achievement for the cotltrol (CTLM) and experitnental (CAM. .4OM and I-I'M)
groups to determine the dependability of sanlple statistics and to compare the
achievement scores of all the four groups in the subsequent analvsls It is give11 In
Table 5 8
The Scores on Achievement (Immediate) of'the students constdered fur
the study when classified bv the school and model categories p~.o~.idt l the fvllowiny
summary statistics

Table 5.8
Mean and Variance for Immediate Posttest Scores-<:lassified by
School and Model Categories
Graphical represer~tation of the lnean and variance f i ~ r Imiucdlate
l'osttest scores classified by school and rnodel categories IS presented 111 I : I ~ 5 ?
I
11
--- --
I l l
--"
I \
---
\
---
\ 'I
\ / I I
--
Vll l
Tota I
N
(frg~ircj.\ I l r h/*crr kc./.\ \h(~rv
CAM
(Exptl. I )
25 80
(4 43 )
26 00
( 3 08)
27 75
(6 37)
27 70
( 5 10)
25 50
(5 41)
24 1 1
(3 30)
25 5 5
(4 14)
3 1 40
( 4 98)
26 74
( 5 07)
159
rmrru~lce)
AOM
(Exptl. II)
1 T 80
(4 9 3 )
29 40
( 2 64)
1 0 90
( 4 82)
30 .;5
( 5 4)
26 CjO
( 3 5 8 )
29 70
( 2 17)
:o 30
( ? 56)
3h 70
( 5 3 6 )
38 7 6
(4 5 1 )
160
2h 90 24 05
25 75
(7 07) ( 2 89) I
i I (15
(0 2; ) (; 7 2 )
30 10 3 h 8 5
75 ;0
(4 10) ( 2 0 )
26 75 30 ;1$
(2 5.3 )
28 1 %
( 3 2 2 ) (.; (19) ----
( 5 5 2 ) (4 $ 2 )
27 10
( 5 0 7 )

CAM
t 11 Ill N V VI VII Vlll 1 I.-.- - 1
AOM 1
I t l I11 IV V VI VtI Vlll i r - - -
ITM 1
I I 1 It I l l IV v VI VII Vtll /
Figurt. 5.2
Immcdhtr I'osttest Scorrs-Classified by School and Modcl Categories
ANOVA for immediate Posttest Scores of Pupils of the Experimental (C'AM,
AOM and ITM) and Control (CTLM) Group Classified by Model C'ategories
with Pretest as Covariate
Aiier introducing the independent variables it was fourid that the
experimental groups were better than the control group in their achievement
Su the investigator concluded tentatively h a t the Informat~on
I'rocessll~g Models were more effective than the conventional teachiny learniny
net hod It was dit'ficult to ascertain whether the difference between the pt-erest and
ilnit~ediate posttest scores resulted from the experimental factor or other variables So
~t became necessan that the scores be analysed using the technique of :lnalysis of'
C'ovariance (ANTOVA) for comparison. ANCOVA uses the principle of partial
correlation with Analysis of Variance. It is particularly appropriate whet] tlie suhject~
in two or more groups are found to differ on a pretest or' other initial kariiihlcs In this
case the effect of' extraneous variables like Intelligence. .bitt~tudc. rouards learn in^
Geography, Geosraphy Learning Environment and SES will he studied In the
difierence in achievement that would have been caused by other extraneous variat~les
are partialled out arid the resulting adjusted means of the posttest scores are cutnpared
.ANC'0\!.4 is a method of analysis that enables the researcher tcl equntt. the pre-
experimental status of the group items of known variables Difference in the initial
status of the groups can be removed statistically. so that they can he compared as
though their initial status has been equated, The use of ANC0jY.A method i s thus
justified for the arlalvsis of the scores of the present study

Table 5.9
Summary of Analysis of Variance (ANOVA) of the Immediate Posttest scores of
Pupils of the Experimerital (CAM, AOM & ITM) and control (CTLM) Group
classified by Model Categories with Pretest as C'ovaria te
Source o f variation
Pretest
(Covariate)
Between groups
F t - c ~ n the 'l'able 5 9, i t is clear that the obtained F-i alue 1s s~ynificai~t at
0 0 1 level So it can be concluded that the means uf immediate pusttest scores dlflkr
significantly between the model categories taking pretest as covariate In order to
Interpret the result more accurately, it is necessary ttu equate the pre-exper.irnental
status of the groups.
Therefore the adjusted sums of squares and adjusted mean squai-c
variance tor posttest scores were computed using ANCOVA The results of analysis
are given in Table 5 10.
Within groups
SS
3421.38
1645 75.3
* * ,Sigt/;ftc~itt/ ~ t f 0. urtd 0.01 /civ/ -1 13993.932
d f
I
3
633
Ms
342 I 38
ri48578
22 107
F
154.762
3 4 x 1 4
-- . . , -. - -
Significarlce

Table 5.10
Summary of Analysis of Covariance (ANCOVA) o f the Immediate Posttest
Scores o f Pupils of the Experimental (CAM, AOM & II'M) and C:o~itrol
The adjusted mean of the experiniental yroup is greater. than that cjt'
(CTLM) Group classified by Model Categories with Pretest as Covariate
control group Hence i t i s concluded that '1nfi)rrnation Processing hlodels' i s supel-iol,
Source o f
Variation
Amony means
Within group
Total
to conventional teaching learning method
-.
5067 l I 4 1266 78
13993.94 633 1 2 107 57 : iOz*
1906 I 05 63 7 79 0 2
In order to asc,ertain which model categon! 1s superlor the significance
* * S S j p r / f j ~ ' ~ ~ ~ t / r t / fJ.fl.5 C I ~ I J 0.01 It'l't~l.
of' dift'erence between rwo sample means 1% as calculated using ('ritical Katir~
(C' R - D/oll) where D is the obtained difference between two sample Incalls and rrll is
the standard el-ror of'the difference between two sample means.

Comparison of Immediate Posttest Scores Classified by School in the <:.AM
(exptl.1) Group and CTLM (Control) Group
The mean and standard deviation of the posttest scoi-es (immediate) of
I50 pupils in the ( ' A M (exptl.1) group and I60 pupils in the CTLM (ccm~r-ol) group
were calculated. ?'he Critical Ratio (C.R) was found out and tested fbt. significance
The data and results of the test of significance of difference between rnearls are giver1
in Table s. 1 1 .
Table 5.1 1
Data and Results o f Test of Significance o f Difference between
Mean Posttest Scores (immediate) of Pupils in the
<'AM (exptl. 1) group and CTLM (coatrol) Group
The C'rttical Ratio obtained i s s~yniiicant at 0 0 I level and 0 05 level.
sirlce the values for significance are 2 . 5 8 and 1 96 at O 0 I and 0 05 levels respect ivel~
for df .: 18 T h ~ s indicates that there is s~gnificant difference between the Inean
pusttcst (~mmediate) scores of pupils (t = 3 75, p < 0 01) in the TAM lexpt1.l) goup
S. D
(
5 07
(>.>I
Critical
Ratio {C.K]
; 25
.--1
--
Gruup
CAM
(exptl I )
C'TLhl
(cotltrol g o u p )
L-
----- -
Level of
significance
---. -
S yntfican t
N
IS9
160
Mean
26 74
3,466

and C'l'LM (control) group. The inference is that the students who learned through
CAM excelled than the students in CTLM in achievement Compared with the pretest
scores ( t - 0 2 1, p - 0 0 1 ) the posttest done im~nediately affer the treatment variable
C',4M, the students showed marked difference in t h e ~ r ach~evemen~
Comparison o f lmrnediate Posttest Scores Classified by School in AOM (exptl.11)
Group and CTLM (Control) Group
The Itlean and standard deviatton of posttest (~mrnediate) scores of 1611
puptls In the .40M (exptl II) group and 160 pupils in the CTLM (corltrol) yroup were
calculated l 'he Critical Ratio (C R) was found out and tested fur significance The
data and results of the test of significance between Illearls are givcrl In 7'ahle 5 1 3
Table 5.12
Data and Results of the Test of Significance o f Difference
between Mean Posttest scores (immediate) o f pupils ia
AOM (expt1.11) Group and CTLM (Control) Group
The Critical Ratio obtained is significant at 0 01 level since ~ l i e ialues
for significance are 2-58 and 1.96 at 0.0 1 and 0.05 levels t-espect~\,elv f i l l (11' 3 10 'Phis
-
Group
AOM
(exptl 1 1 )
C'TLM
(control group)
--
S. D
(0)
4 5 1
6 3 I
N
160
160
Crit ical
Ratio (T . R)
6 72.
Mean
2876
24 66
.- -
1,evc.l o f
sigriificar~cc
\
Stg111 ticant

indicates that theru is signrficant difference between the rnearl posttest (~mmetiiate )
scores of pupils ( t h 72, p *, O 01 ) in AOM (exptl 11 j group and <' I'1,M (control)
group The inference is that the students who learned through Advance Orpanizcr
Model excelled than the students who studied under cor~ventional 'Peaching Learning
Vethod in their achievement in immediate posttest scores Compared with the prxlest
scores ( t 1 47, 17 , 0.01 ) in the posttest given iri~incdiately after the trearimer\l
variable Advance Organizer Model, the students showed marked diflrerlct: in their
achievetnent
Comparison of Immediate Posttest Scores Classified by School in ITM (exptl.lll)
Group and CTLM (Control) Group
The mean and standard deviation of posttest (immediate) scores ot' I50
pup~ls in the IThI (cxptl I l l) group and 160 pupils tn the C'TLM (contrtjl) gruup merr
calculated The I'rit~cal Ratio (C R) was found our and tested for s~gn~ficance Thy
data and results of'the test of significance between means are given in Tabte 5 1 3
Table 5.13
Data and Results o f the Test o f Significance o f Difference between Mean Posttest
Scores (immediate) in ITM (exptl.Il1) Group and CILM (C:ontrol) Group
Group
ITM (exptl I l l )
C"1'1 .M (control group)
N
159
160
Mean
2 7 1 0
24 66
S. D
(0)
5 0 7
6 3 l
Criticirl
Ratio ( C . R)
2 5.;
Level of
significance
---
S~gn~ticant

The CI-itical Ratio IC.R) obtairled is significant at O 0 5 level, sincc the
value for s~gnificance is 1 -96 at 0.05 level for df -3 1 8 'I'hts ~ndicates that there 15
significant dityerence between the mean pusttest (immediate) scores ot' pupils ( t --
2 5 3 . p .- 0 05) in ITM (exptl.lI1) yroup and CTLM (control) group ?'he Inference i s
that the students who learned through Inquiy Trainirig Mudel showed ruiirked
dit't'erenct: in their achievement in the posttesl done immediatelv after t l ie treatrl~e~lt
var-iable.
Comparison o f lmmediate Posttest Scores Classified by School in C A M (exptl.1)
Group and AOM (exptl.ll) Group
The mean and standard deviation of posrtest (immediate scores of 150
pi~pils in the CAM (esptl I ) group and 160 pupils i n the AOhl (exptl 1 1 ) r u u p ivel-c
calculated l'he CI-itical Ratio (C R) was found out and tested fhr signiticance 'The
data and results of the tests of significance between means are given 111 Table 5 14
Table 5.14
Data and Results of the Test of Significance o f Difference between Meall Posttest
Scores (immediate) in CAM (exptl.1) Group and AOM (exptI.II) Group
-
Croup
CAM
(exptl I)
AOM
(exptl 1 1 ) -
N
159
160
Mean
26 74
2 8 7 6
S. I) (0)
5 07
4 5 2
Critical Ratio (C.R)
? 74
Level of s i g n i f i c a ~ ~ r ~
S ~ ~ n ~ t i c a n t
-. -- 1

The Critical Ratio (C.R) obtained is significant at 0 0 I le\.el. since the
values for significance are 2.58and 1.96 at 0 0 1 and O Oti levels respectively. ii,r
degrees of freedoin (df) 3 18 This indicates that there i s s~gniflca~ir difference
between the mean posttest (immediate) scores of pupils (t- 3 73. p - (1 U I ) in :\Oh1
(exptl. l l ) group and CAM (exptl.1) group. The inference is that the studet~ts who
learned through Advance Organizer Model showed marked dif'ference in their
achievement than the students who learned in Corlcept Attain~nent \lode1
Thc above anatysis leads tu the coriclusiun that between the t ~ v o
treatment vanables. the Advance Organizer Model is rnore effict ive than the Concept
Atta~timent Model in t h e learning of Geography in standard IX
<:omparison o f Immediate Posttesc Scores Classified by School i r r the C'AM
( e~pt l . I ) Group and ITM (exptl.lll) Group
The tnean and standard deviation of posttest (irn~nediate) scores ut' I 59
pupils in the CAM (exptl I ) group and 159 pupils in the ITM (exptl 111) group were
calculated The C't.~tical Ratio (C .R) was f b u t ~ d out and tested for significance The
data and results of ' the tests of significance of ditt'erence between nieanh al-e gtvctl 111
Table 5 I 5

Table 5.15
Data and Results of the Test of Significance of Difference between
Meall Posttest Scares (immediate) in the CAM (expti.1)
Group and ITM (exptl.llI) Group
The Critical Ratio (C.R) obtained is nut significant. since the values till-
significance are 2 58 and 1.96 at 0.01 and O O C levels respectively for df ; 17 Tho
obtained C' R value ( t = C) 79; p :. 0.05) shows that the C'Ahl yroup arid L'L'M gwup du
not dii'f'er significantly in their achievement in the posttest (immediate) in Cieography
I t may therefore he concluded that the students who learned in ('uncept .Attainment
Model (('.AM -exptl.l) and those in the Inquir]lm Trainins hlodel (ITM esp t l I l l arc
equally good in performance. Both models seem to he yood 111 ~ e a c h ~ n g I;eogi-aphv
No marked difference is noted between the mean scores obtained by the pupils \vho
belong to r A M (esptl I ) and ITM (exptl.111) groups
Group
C AM
(exytl I )
Il'M
(exptl I l l )
N
159
159
Mean
26 74
2719
S.D
(0 )
5 07
007
Critical
Ratio (C.R)
0 79
Level of'
significance
Not sign~ficant

Comparison of Immediate Posttest Scores Classified by School in the GUM
(exptl.11) Group and ITM (exptl.111) Group
The mean and standard deviation of posttest (immediate) scores of 160
pupils in the AOM (exptl.ll) group and 159 pupils in the ITM (exptl.111) group were
calculated. The Cr~tical Ratio (C.R) was found out and tested for significance The
data and results of the tests of significance of ditierence between rneans are given in
Table 5 16.
Table 5.16
Data and results of the Test of Significance o f Difference between Mean Posttest
Scores (immediate) in the AOM (exptl.tl) Group and ITM (exptl. i l l ) group
The Critical Ratio (C R) obtained is stgnificant at 0 01 level. since the
values for significance are 2.58 and 1 96 at 0 01 and O 0 5 b e t s respectrvely for
degrees of freedom 3 I8 This indicates that there IS significant difference between the
mean posttest scores (immediate) of pupils ( t = 2 91, p . 0 01 ) in AQM (exptl 11)
uruup and ITM (extpl Ill) group. The inference is that the studerlts who learned L
Level o f
significance
S~gnificant
Group
AOM
(exptl. 11)
IT M
(exptl.lIl)
Mean
28.76
27.19
N
\60
159
S. D
( )
4.52.
5.07
Critical
Ratio (C.R)
2 9 1

through Advance Organizer Model showed marked difference over the students who
learned in Inquiry Training Model
The above analysis leads to the conclusion that between the two
treatment variables, viz., Advance Organizer Model (AOM) and l nqu~ry Training
Model. the first one is more effective in learning Geography for standard IX
5.4.4 Model Categories and Delayed Posttest Scores (Delayed Achievement)
Statistical measures were applied for the delayed posttest scores in
achievement tbr the control (CTLM) and experimental (CAM, AOM and 11-M)
groups to determine the dependability of sample statistics and to compare the
achievement scores of all the four groups in the subsequent analysis
Distribution of Delayed Posttest Scores in Achievement
The achievement in delayed posttest was analysed statistically to find
the effectiveness of lnformation Processing Models with that of Conventional
Teaching Learning Method

Table 5.17
Mean and Variance for Delayed Posttest Scores -Classified by
School and Model Categories
Graphical representation of the rnean and variance for delaved posttest
scores classified by school and model categories are given in Figure 5 3
(Exptl. 1)
AOM
(Exptl. 11)
23 -35
(3 83)
24 75
( 3 14)
30 90
(4 40)
28 85
( 4 36)
23 00
(4 -36)
2 5 90
(3 7 7 )
26 00
(3 04)
26 25
(4 42)
2 C j 13
(4 51)
160
L
? -
3
4
5
6
7
8
Total
N
IFigurus nt hnrcket.r show
20 90
(3 86)
21 25
( 3 0 2 )
24 75
(7 93)
22 85
(3 79)
21 5 5
(4.33)
19 21
(2 20)
20 20
(3.65)
26 5 5
(4 52)
22.18
(4 93)
I59
variur~ce,)
ITM
(Exptl. 111)
2 2 40
( 3 73)
21 10
( 3 19)
25 3 5
(3 89)
28 5 5
(.? 6 7 )
21 50
( 3 72)
20 70
(2 7 5 )
23 42
( 4 41)
20 90
( 4 12)
22 98
(4 56)
I 59
CTLM
(Control)
31 35
( 2 7;)
I5 30
( 2 4;)
20 80
( 3 5 1 )
22 90
( 2 8 3 )
17 20
( 2 3 1 )
16 20
( 2 29)
I 6 3 5
( 3 74)
17 0 5
( 7 65)
18 49
( 3 95)
160

. . . . . . ... -. . -
CAM
AQM
I 11 I l l IV V VI VII Vlll
! ITM
I 1 1 Ill IV v VI VIt Vlll
Figure 5.3
I)elayed Posttus t Scores-Classified by School and Model C 'ategorics

From Table 5.17, the distribution of delayed posttest is tnade clear
The delayed achievement scores for subjects classified by tr~odels and school
categories show marked difference.
The ANOVA results are presented in Table 5 18
Table 5.18
Summary of Analysis of Variance (ANOVA) o f the Delayed Posttest Scores o f
Pupils of thr Experimental (CAM, AOM & ITM) and Control (CTLM) GI-oup
classified by the Model categories with Pretest as Chvariate
Source of variation SS d f Ms Significance
Term examination 1879.43 1 1 1879.431 112 h l 1
(Covariate)
Frurn the table value it is clear that the111 mean scores differ
significantly between the groups. The obtained F value ( F value, 1 12.6 1 1 ) is
signifcant at 0.01 level between model categories compared with the pretest as
covariate. Therefore it can be concluded that the experimental groups (CAM. AOM
& ITM) and control group (CTLM) differ significantly in its delayed pusttest scores
Compared with the pretest, the posttest scores differ significantly
Among the model categories also there is significant difference between the pretest
and delayed posttest scores.
Between Groups
Within Grouph I
* * . s t g ~ ~ i f i c j ~ ~ ~ ~ t uf 0.01 uud 0.05 Ie\?cl
5 109.593
10564.556
3
633
1703,196
16690
102.051 * I
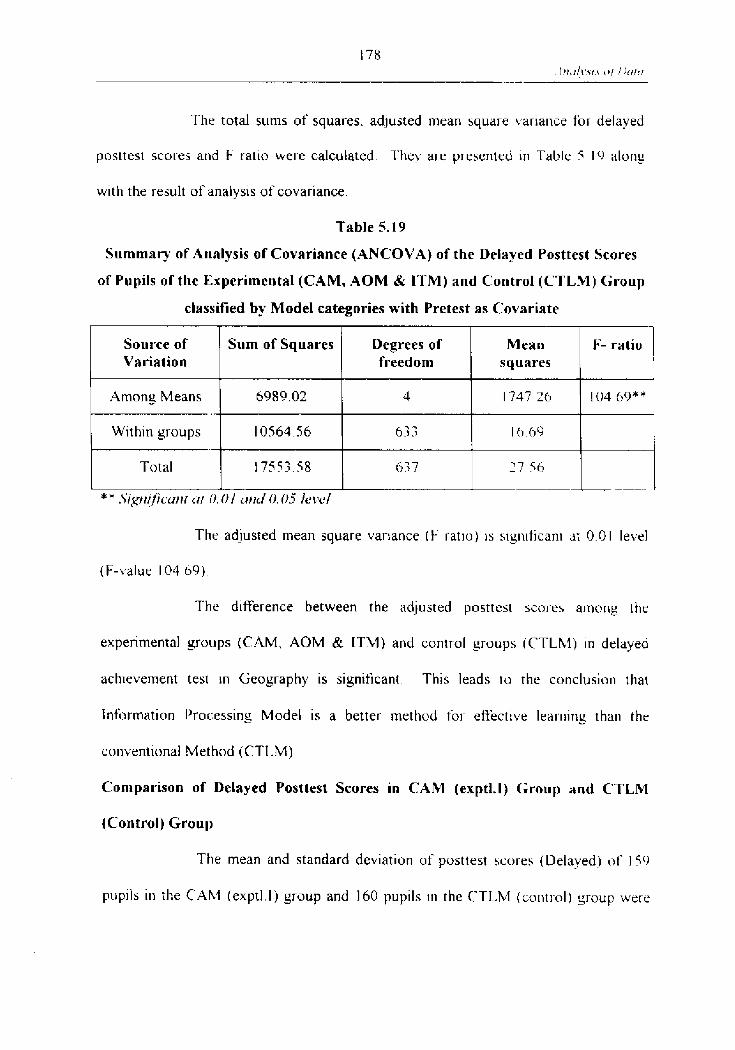
The total sums of squares. adjusted mean square i,ariance for delayed
posttesl scores and I- ratio were calculated ?'hey are presented In Table 5 10 along
with the result of analysis of covariance
Table 5.19
Summary of A~ialysis of Covariance (ANCOVA) o f the Delayed Posttest Scores
of Pupils o f the Experimental (CAM, AOM & ITM) and Coritrol (L'TLM) Group
The adjusted mean square variance ( F ratlo) is s~gnifican~ at 0.0 I level
(F-\,slue I 04 69)
The difference between the adjusted posttest scores among the
experimental grorrps (CAM, AOM & ITM) and control groups (CTLM) in delayed
achievement test in Geography is significant This leads to the conclusion that
Information I'rocessing Model is a better rnettlud fol- effective lear~rlirlg thari the
conventional Method (CTLM)
Comparison of Delayed Posttest Scores in CAM (expt1.l) Ciroup and CTLM
(Control) Group
Tile mean and standard deviation of posttest scores (l lelaved) of 1 5 0
pup~ls in the CAhl (expt1.l) group and 160 pupils 111 the CTLM (control) group were
classified by Model categories with Pretest as Covariate
Source of Variation
Among Means
Within groups
Total
* * .5'/gt11 f i c ~ ~ t t t ( { I 0.0 1 ~ ~ t t d 0. U.5 /cw/
Sum of Squares
6989.02
10564 56
17553 5 8
Degrees o f freedom
4
6-33
637
Mean squares
1747 20
I 0 04
27 5b --
-
F- ratio
104 69**
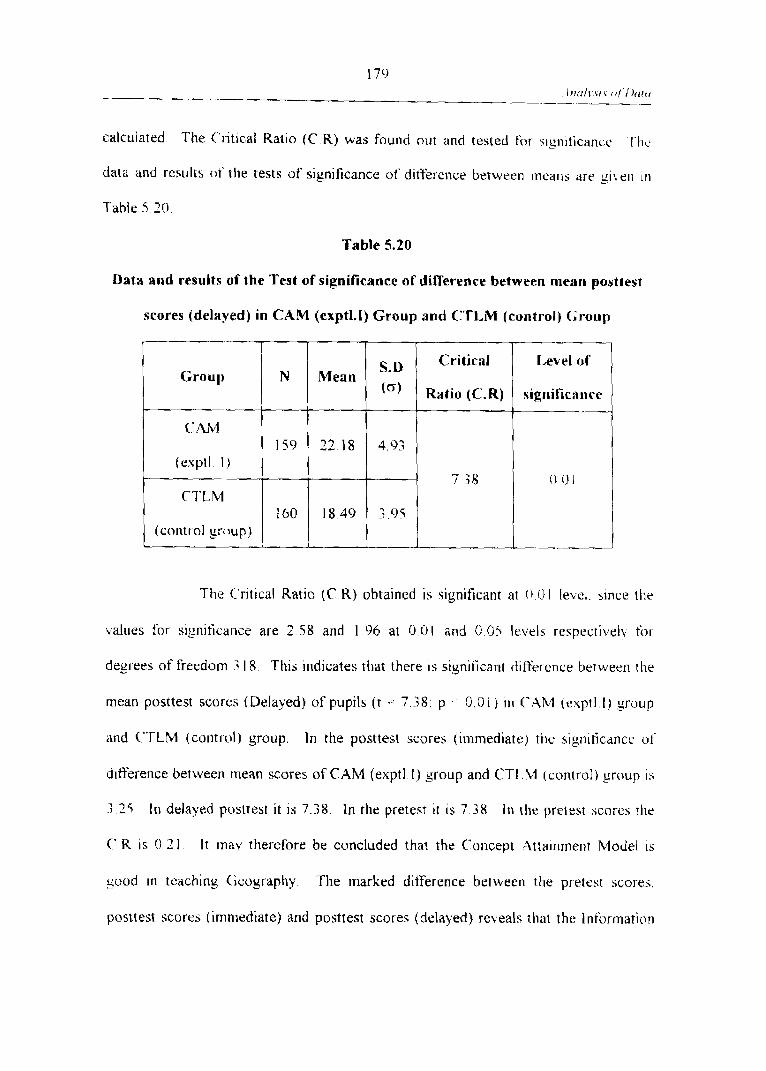
calculated The C'ritical Ratio (C.R) was found out and tested for s ~ g n ~ f i c a n ~ c 't 'hu
data and results ot ' the tests of significance ut' difference between rncans are g i i e ~ l HI
Table 5 20
Table 5.20
Data and results of the Test o f significance of difference between Inearl posttest
scores (delayed) in CAM (expt1.I) Gro~lp and CTLM (control) Group
The Critical Ratio (C R) obtained is significant at 0 (31 level. since the
values for significance are 2.58 and 1 96 at O 01 and O 05 levels respectively for
degrees of freedom .; 18. This indicates that there i s siynificant difl'er-cnce between the
mean posttest scores (Delayed) of pupils ( t -; 7 -38: p . 0.01 ) in ('.Ah4 it'xptl. I) group
and C"PLM (contrul) group. In the posttest scores (immediate) the sigll~ficancc of'
difference between rnean scores of CAM (exptl I) group and CT1.M (control) g o u p IS
; 22 In delayed posttest it is 7.38. In the pretest i t is 7 38 111 the pretest scor-es the
C' R i s 0 2 1 It rriay therefore be concluded that the Concept :Ittainment Model is
cood in teaching Cieogaphy. The marked difference between the pretest scores. - posttest scores (immediate) and posttest scores (delayed) reveals thal the Infbrrnation
Groul)
c: AM
(exptl I )
C7'LM
(control yrtlup)
N
159
160
Mean
22 18
18.49
S. D
4.93
3.95
Critical
Ratio (C.R) -
7 38
Level o P
significnnrt
O 01
-

processing capabll~ty of students leads to the improvement of thew yeneral ~ntellcctual
ability to master ir~forrnat~on and retain it for lotlger periods
Comparison of Delayed Posttest Scores Classified by School in :\OM (exptl.ll)
Group and CTLM (Control) Group
Thc mean and standard deviation of pusttest scnl-es (Delaved) ot' I h0
pupils 111 the AOM (exptl 11) Group and 160 pupils In the CT1.M (control) yr.oup i4tir.t.
calculated The C'titical Ratlo { C R) was found out and rested fin slgnificancu I'he
data and results nf the tests of significance of difference between means are gtien 111
Table 5 2 1
Table 5.2 1
Data and results of the Test of significarlce of difference between mean posttest
scores (delayed) in AOM (expt1.Il) Group and CTLM (control) group
The critical ratio obtained ( t - I 5 0 2 , p , 0 0 1 ) is significant at 0 O l
level. slnce values for significance are 2 5 $ and 1.96 at 0 0 1 and 11 05 levels
respectively for df -3 I9 This indicates that there is signiticant difference between the
Group
AOM
(euptl 1 )
C'TLhl
(control yroup)
T
Critical
Ratio (C.R)
1 5 02
N
160
160
Level of
significance
r ) 0 1
J
Mean
2613
I 8 4 9
S.D (O)
4 5 1
3 9 5

rlleatl posttest scores (delayed) of pupils in AOM (cxptl 11) yroup and ('-1.1 .hl
(control) group
For the posttest scores (irnrnediate) the sigtlificance of differ-cr~ce
between the mean scores of AOM (exptl.11) group and C'TLM (control) group 1s 6 7 1
( t = b 7 2 : p . - - 0 0 1 )
I n the pretest scores the C.R for the AOM (exptI 1 1 ) gr-oup and C-1'L.hf
(control) group 1s 1 47 ( t = 1 -47: p 0.0 1 )
The marked difference in the pretest scores. posrtcst score3
(immediate). posttest scores (delayed) indicates that Advance Organizer M ode1 is
eflective in strengthening the coynitive structure and enhancing thy retcnt on uf new
infbrmation.
Comparison o f Delayed Posttest Scores Classified by Schoul in ITM (exptl.lil)
Group and CTLM (Control) Group
The ]near1 and standard deviation of the posttest scores (Delayed) of
159 pupils In the ITM (exptl.ll1) group and 160 pupils in rhe C'TLM (control) gl-ouy)
were calculated, 7'he Critical ratla (C R) was found out and testod l i j r sigtliiicance
The data and resul~s of the test of significance of difference between means are g~ven
in Table 5 32

Table 5.22
Data and results of the Test of significance of difference between mean pusttest
scores (Delayed) in ITM (exptl. 111) Group and CTLM (corltrolf Ciroup
The C r ~ t ~ c a l Ratlo obtained ( t - 9 38. p 0 0 1 ) 1s s~gn~ficant at (1 0 l
level, since ~ a l u e s for significance are 7 58 and 1 Of) at (11 0 1 and 0 0 levels
--
Group
ITM
(exptl I l l )
CTLhl
(control gr.oup) --
respectively for dl' 3 18. This indicates that there is signrficant dlt'ference butween the
N
I59
160
Mean
2299
1 8 4 9
mean posttest scol-es (delayed) of pupils in ITM (exptl.111) group and ('Tl,iZ?I (control)
In the posttest scores (immediate) the s~gnifrcatlce of' difTe~,enct.
between the mean scores of 1TM (exptl.II1) group and C'TLM (control) group 1s 2 5;
signifirarrce
a-.
S. D
(0)
4 i h
3 9 5
In the pretest scores the C .R for the ITM (exptl. l I I ) group 'ind T1'LhZ
Critical
Ratio (C'.R)
0 -3 8
(cor~trul) group is 0.59 ( t = 0 59; p :> 0 01)
The glaring difference between the pretest scores. postlest scores
(immediate) and posttest scores (delayed) indicates that l n q u q Training hlodel helps
students develop the intellectual discipline and skills

Comparisor~ of Delayed Scores Classified by Schools ill CAM (exp11.l) Groul~ and
AOM (exptl.11) Group
The mean and standard deviation of the posttest scol-es (delaved) uf
159 pupils in the CAM (exptl.1) group and 160 pupils in the .4OM (exptl 11) group
were calculated. The Critical ratio (C.R) was found out and tested for sign~ticance
The data and results of the test of signiticance between ineans are given In Table i 2 3
Table 5.23
Data and results of the Test of significance o f difference between rliean posttest
scores (Delayed) in CAM (exptl.1) Group and AOM (exptl.ll1) Group
The Critical Ratio obtained ( t = 7 45, p . 0 0 1 ) I S s ~ g r l ~ f i c a r ~ ~ at C) 0 I
level, since values for s~gnificance are 3 58 and 1 96 at 0 01 and 0 05 lebels
respectively t'or df 3 l X This indicates that there is significant drfference hetween the
mean posttest scvtes (delayed) of pupils in C.AM (exptl 1) group and jiOM (cxptl \ I )
yroup
---
Group
('..ZM
(exptl I )
AO hl
(exptl 1 1 )
N
159
160
Mean
2 2 1 8
26 13
S. D ( )
49-<
4 5 1
Critical Level of
Ratio (C.R) signifieancc
7 4s 0 0 1
I n the pretest scores (immediate) the significance of diff'erence
between the mean scores of CAM (exptl.1) group and AOM (exptlLI1) yraup is 3 74 { t
= 3 74, PC-: 0 01).
The above analysis leads to the conclusion that between the two
treatment variables the Advance Organizer Model is more effective In the posttwr
(immediate) the Advance Organizer Model is more effective rhan the Concept
Attainment Model in the learning of Geography in Standard IX
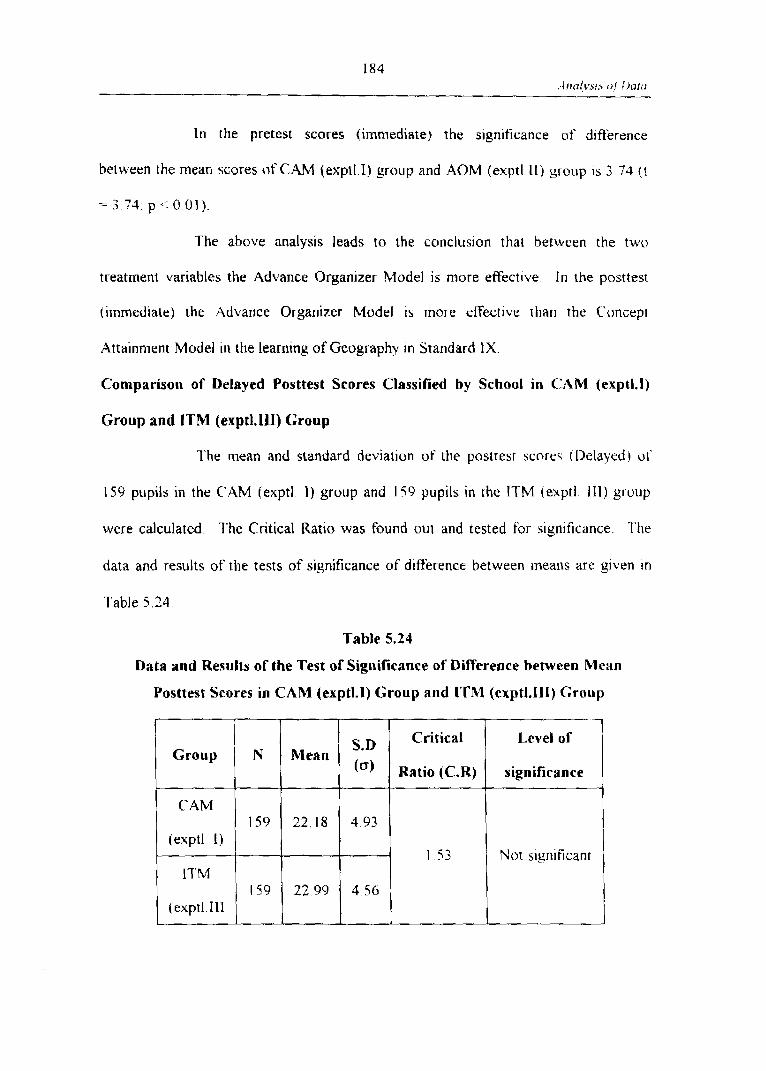
Comparison o f Delayed Posttest Scores Classified by School in C A M (exptl.1)
Group and ITM (exptI.lI1) Group
I'he mean and standard deviation of the posttest scores (Delayed) of
159 pupils in the C'AM (exptl 1) group and 159 pupils in the ITM (expti 111) group
- >
were calculated I'he Critical Ratio was found out and tested for significance. I he
data and results of the tests of significance of di f i rence between inearls are given in
Table 5.24
Data and Results of the Test of Significance of Difference between Mean
Posttest Scores in CAM (exptl.1) Group and ITM (exptl.111) Ciroup
Group
C.4M
(exptl. 1)
17'M
(exptl. Ill
N
159
I59
Mean
22. I8
22.99
-- -
Level of
significance
Not agnificant
Ad
S.D
4.93
4.56
Critical
Ratio(C.R)
1 53
The Critical Ratio (C. R) obtained is not significant, slrlce the values for
significance are 7.58 and 1.96 at 0.01 and 0.05 levels respectivel~ fjlr df i 17 The
obtained (C.R) value ( t = 1.53; p > 0.0 1 ) shows that the ('AM (exptl I ) yroup and ITM
group (exptl.ll1) group do not differ significantlv in their achievernerlt in the delaved
post test scores in Geography. It may therefore be concluded that the students who
learned in Concept Attainment Model (CAM- exptl I) and those i n the lnquin.
Tra~ning Model (ITM- exptl.111) are equally good in pert'ormance Hotli models seem
to be good in teaching Geography. No marked difference is noted between the mean
scores obtained by pupils who belong to the above said treatment groups
Comparison of Delayed Posttest Scores Classified by School in AOM (exptl.11)
Group and ITM (exptl.111) Group
The mean and standard deviation of rhe delayed posttest scores of 160
pupils in the .40M (exptl.11) group and 159 pupils in the ITM (exptl I l l ) group were
calculated. The Critical Ratio was found out and tested for significance The data
and the results of the test of significance of difference between means are given in
Table 5 35

Table 5.25
Data and Results o f the Test o f Significance of Difference between Mean Posttest
Scows {delayed) in the AOM (exptl.11) Croup and ITM (exptl-111) Croup
Group Critical
Ratio (C-R) Mean
I ,wel o f
significance
S. D ((3)
AOM
(exptl 11)
The Critical Ratio obtained (I = 6.1 6. p .- 0 0 1 1 i s significant at 0.0 1
level. since values for significance are 2.58 and 1.96 at 0 0 1 and 0.05 levels
respectively for df .< 18. This indicates that there is significant difference betweeti the
mean posttest scores (delayed) of pupils in AOM (exptl. 11) group and 1TM (exptl.111)
group
In the posttest scores (immediate) the significance of difference
between the mean scores of AOM (exptl.11) group and ITM (exptl LII) group is 2 9 I (
t = 2 9 1 , p q 0 . 0 1 )
The above analysis leads to the conclusion that between the two
treatment variables viz.. Advance Organizer Model and Inquiq Train~ng Model. the
first one is more effective in learning Geography for standard 1X
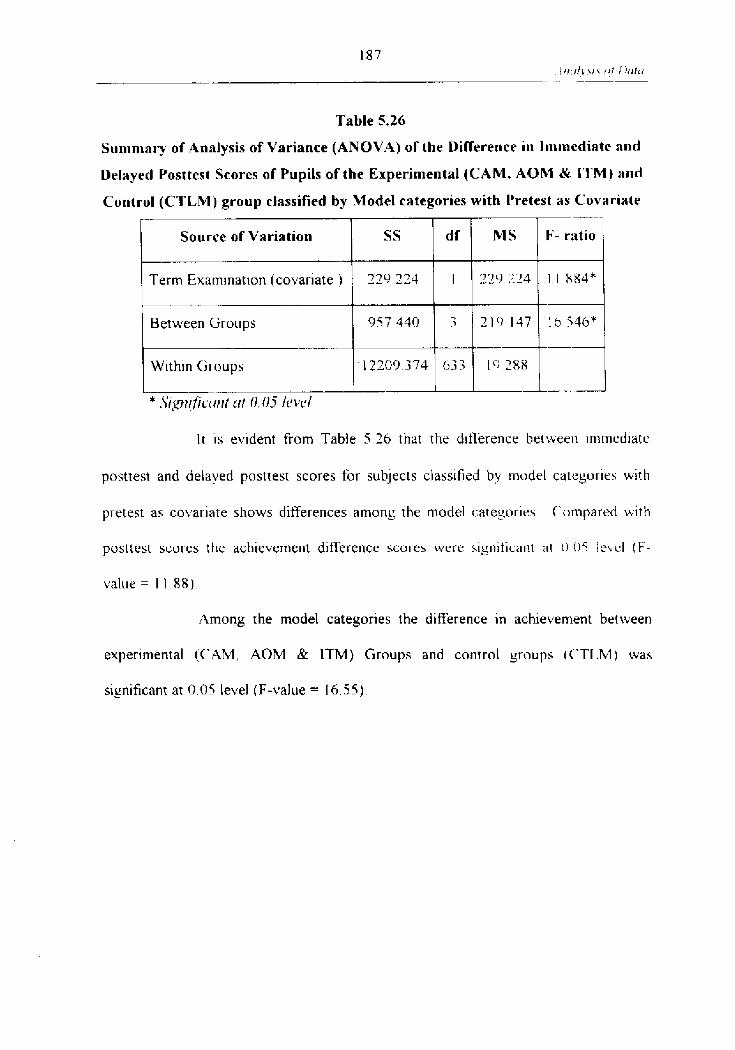
Table 5.26
Summary o f Analysis of Variance (ANOVA) o f the Difference in I~rlnlediate and
Delayed Posttest Scores o f Pupils of the Experimental (CAM, AOM & ]I'M) and
It I S evident from Table 5 36 that the dift'erence betweel l immcdiatu
Control (CTLM) group classified by Model categories with Pretest as C'ovariate
posttest and detaved posttest scores for subjects classified by model categories with
pretest as covariate shows differences among the model catesorles ('ompared with
-- -
F- ratio
1 1 X8J*
16546*
-. --
posttest scores the achievement difference scores were significa~l~ ; ~ t 0 05 l e ~ c l ( F -
* .Y~pr~f i iv r t r t < I / 0.0j It'vel
Source of Variation
Term Exatnination (covariate )
Between Groups
Within GI oups
value = I 1 88)
df
1
?
63:
SS
139 234
957440
12209374
Among the model categories the difference in achievement between
M S
729 314
210147
- I 9 2 8 8
experimental (CAM, AOM & ITM) Groups and control groups (C'TLM) was
significant at 0.05 level (F-value = 16.55)
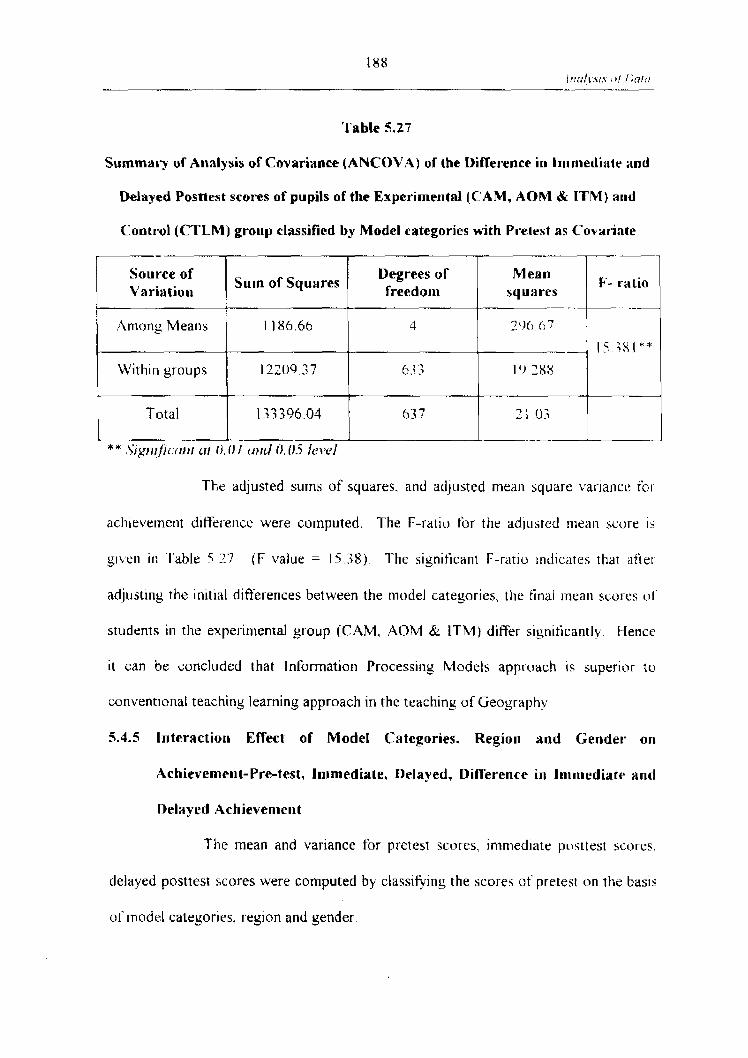
Table 5.27
Summary of A~lalysis of Covariance (ANCOVA) o f the Difference io I~~rr~el i iate and
Delayed Posttest scores of pupils of the Expe~.irneatal (CAM, AOM & ITM) and
Control (CTLM) group classified by Model categories with Platest as Covariate
Source of Variation
The adjusted sums of squares. and adjusted meall square variance for
achlevetnetlt diffei-ence were computed. The F-ratiu for the adjusted mean score is
giver1 i i ~ 'l'able 5 17 ( F value = 15..38). The significant F-ratiu ~ndicates that afit.1
adjusting the initial differences between the model categories, tlie final lnearl scol-es 01'
students in the experimental group (CAM, .40M & ITM) differ significantly Hence
it can be concluded that Information Processing Models apprclach IS superior to
conventional teachiny learning approach in the teaching of Geography
5.4.5 Interaction Effect of Model Categories, Region and Gender on
Achievement- Pre-test, Immediate, Delayed, Difference in Inirnediate and
Delayed Achievemerit
The mean and variance for pretest scores, immediate pllsl test scores.
delayed posttest scores were computed by classifying the scores of pretest on the basis
Among Means
With~n groups
Total
of tnudel cateyories, region and yende~
Sum o f Squares
* * S~gt~r#ic.~r!~~ L I I I i . fJ I L O ~ 0 0.5 kve l
118666
12209 37
133296 04
Degrees o f freedom
Mean V- ratio
squares I 1 4
6.3 3
63 7
10 388
21 03

Mean and Variance for Pretest Scores-Classified by Model Categories, Region
and Gender
The effect of model categories, region and gender on immediate. delayed
and difierence between immediate and deiayed scores was studied using one-way.
two-way and three-way Analysis of variance and Covariance w ~ t h pretest as cuvariate.
Table 5.28
Summa? of Scores on Pretest of Students considered for the study, when
Classified by the Model, Region and Gender categories
* \ .~r i~~t . . \ i l r hr-crck.ket.s LII'L' .st~r~~Ljrnd dev~ atian
The graphical representation of the mean scores on pretest of students
classified by the model, region and gender categories in given in Figure 5 4
ha ode1 I 1 I I 1 I
- - - -. A -. *
1V
Urban
16-58
(9.30)
1793
( 8 00)
17 25
( 8 . 6 5 )
Rural
16.60
(8,47)
1693
( 8 . 5 3 )
16.76
(8.45)
Rural
1762
( 8 . 5 9 )
1697
( 7 84)
17.29
( 8 17)
Rural Rural
1633
( 8 1 I )
1770
( 8 7 2 )
17 01
( 8 4 0 )
CTrban
I
( 7 . 6 7 )
1630
( I 0 06)
15 .73
(8.91)
I!rhatl
1505
( 7 04)
1890
( I 1 37)
I ( > 98
( 9 8 2 )
Boy
Girl
Total
\.'rban
l 6 h 5
( I0 0.3)
30.30
( 10 70)
18 46
(1076)
16.24
(8.267)
crr-e nreou ~wirrt. .~
17.13
(0 01)
17.26
( 0 . 2 4 )
20.05
( 9 22)
18.67
(9.28)
* i ) ~ r / t r ~ ' s
17 7 3
(Cj 65) 2
17 96
( 8 97)
~r*ithorr/ hrzrckut.~

ALL
MODEL MODEL MODEL MODEL 1 2 3 4
BOYS I
I
MODEL MODEL MODEL MODEL 1 2 3 4
GIRLS
MODEL MODEL MODEL MODEL 1 2 3 4
i 1
Figure 5.4
I'retcst Scnros-Classified by Model Ca tegorius, Region and I; ender

Table 5.29
Summary of Scores on Pretest of Students Considered
for the Study, When classified by the Gender and Model Categories
Model
Gender
Girl
Table 5.30
Summary of Scores on Pretest o f Students Considered for the
Study when Classified by the Region and Mode1 Categories
Kural
--
Llrban
l'otal
0 i111re.s it] hruckut.~ jtldrcatu stlrt~di~rd cle ~i tut tot t )
1
16 67
( 9 2 8 )
17 25
(8.65)
17.96
( 8 97)
11
I6 76
( 8 4 5 )
15 73
(890)
16 24
(8.67)
111
17 29
( 817 )
16 98
(9.81)
17 13
(9 00)
IV
--
17 01
( 8 40)
18 48
( I 0 7 6 )
17 74
(9 6 5 ) -
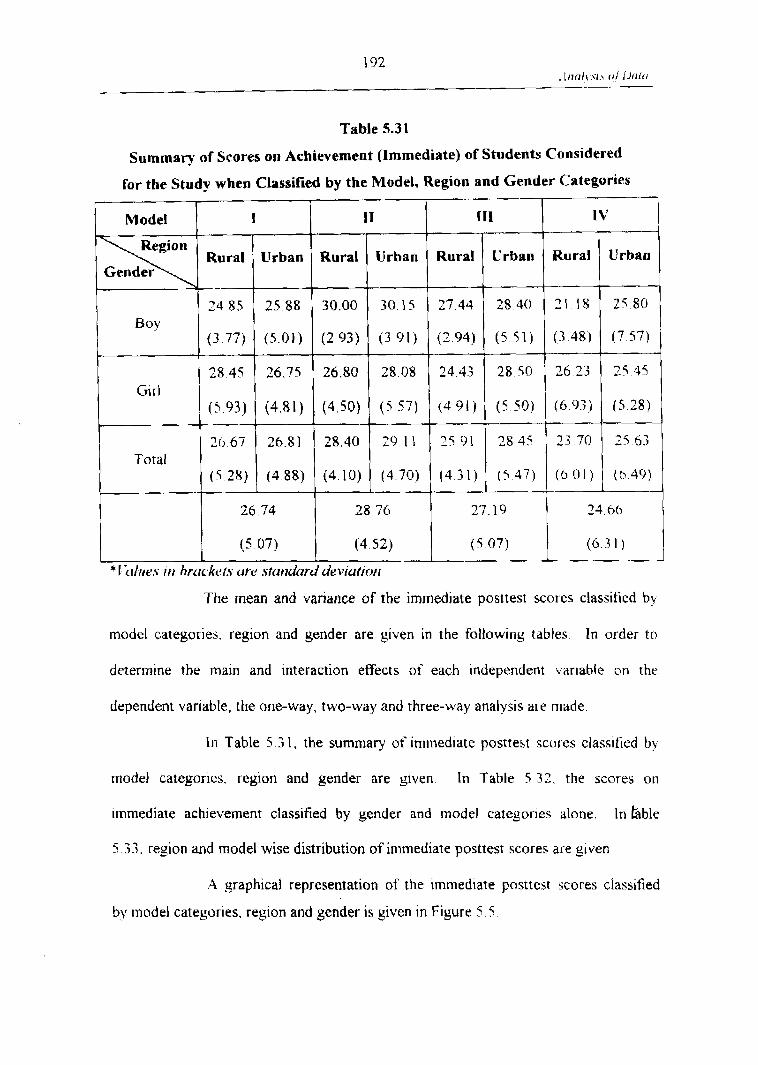
Table 5.31
Summary o f Scores on Achievement (Immediate) of Students Considered
for the Study when Classified by the Model, Region and Gender Categories
Model I 11 TII 1V 1
The mean and variance of the immediate posttest scores classifred by
model categories. region and gender are given in the following tables. In order to
determine the main and interaction effects of each ~ndependent 1;ariable on the
( 5 2 8 ) (488) (410) ( 4 7 0 ) (431 ) ( 5 4 7 ) 1
Urban
2 5 8 8
( 5 01)
26 73
(4 81)
26 81
Rural
dependent variable, the one-way, two-way and three-way analysis are made
Rural
30.00
(2 93)
26.80
(4.50)
28.40
BOY
Girl
Total
In Table 5 .3 I , the summary of immediate posttest scures classified hy
Urban
3 0 1 5
( 3 91)
28 08
( 5 57)
29 1 l
2485
(3 77)
28 45
( 5 93)
26 67
model categories. region and gender are given In Table 5 32. the scores o t ~
Rural
2 7 4 4
(2 94)
24 43
(4 91)
2 5 01
immediate achievement classified by gender and model categories alone. In hble
Rural
- 31 18
( 3 48)
26 23
(6 93)
23 70
Urban
2840
(5 5 1 )
28 50
( 5 0 )
28 45
5 3 3 , region and model wise distribution of immediate posttest scores are given
Urban
2 5 8 0
(7 57)
25 45
( 5 28)
1 5 6.3
A graphicaj representation of the immediate posttest scores classified
by model categories, region and gender i s given in Figure 5 5


Table 5.32
Scores on Achievement (Immediate) of Students Considered for the Study,
when Classified by the Gender and Model Categories
Table 5.33
Summary of Scores on Achievement (Immediate) o f Stude~~ts Considered
1V
23 -49
(G.-<O)
3 84
( b t 3 )
24 66
(6 3 1 )
for the Study, when Classified by the Region and Model Categories
fliil~res hraukels indica/r s~ur~Jur'J deviufiutr)
11 1
27 92
(4.42)
26 46
(5.57)
27.19
(5.07)
I I
30.08
(3.43)
27 44
(5.07)
28 76
(4.52)
I
Roy
Cjirl
Total
25.87
(4.53)
27.80
(5.44)
26.74
(5.07)
Rural
Urban
I ;)I#/
I;
26 67
(528)
26.8 1
(4.88)
26.74
(3.0 7)
11
28 40
( 4 1 0 )
29 1 1
(4 89)
28.76
(4.32)
Ill
15 91
(4 -3 1)
26 45
( 5 47)
27.19
(-5.oU)
-
IV
7 3 70
(601)
25 4.3
( 6 49)
34.66
((1 30)

Table 5.34
Summary of Analysis of Variance (ANOVA) of the Immediate Posttest scores of
pupils of the Experimental (CAM, AOM & ITM) and Control (CT1.M) Groups
classified by Model Categories Region and Gender with pretest as Cyovariate
(One-way, Two-way and Three-way classification)
Source o f Variation
Pretest (Covariate)
Between groups
hlodel
Region
Gender
?-way interaction
Model x Region
Model w Gender
Region K Gender
3-way interactions
Model x Region K Gender
Within Group
SS
3421.377
2000.687
1650.017
319.694
34.957
796.629
95.975
594.160
106.597
409.892
409,892
12430.461
D f
1
5
3
1
I
7
3
3
1
3
3
621
MS
342 1.377
400.137
550.006
319.694
34 957
1 14.090
3 1.992
198.U53
106 597
136,631
130 63 1
20.017
F
170 925
19990
27 477
15971
1 736
5 700
1 598
0894
5 3 2 5
h 826
6 1526
Significance
*
*
*
*
*
*
*
*

The immediate achievement scores of the post test of the total sample
considered together bv taking pretest as a covariate give the data and results in the
Table 5 32
From Table F, it is seen that d f 11621 F at 0 05 i s 3 85 and F at U 01
level is 6 66 The obtained value (F value 170 93, p O 01) 1s significant at O 01
level. Compared with the pretest the immediate posttest scores are sign~ficant
Considering the pretest scores the model categories exen a significant ir~fluence on
the immediate posttest scores. The significant F ratio revealed this fact
From Table F df 5/62 1
F at 0.05 lcvel - - 2.22
F at O 0 1 level - - 3.04
The obtained value is 19.99, it is significant at 0.0 t level ( F value
19 99; p *: 0 01).
Taking the one-way interaction of model categorres and pretest. the
immediate achievement score is significant compared with the pretest scores
Frorn Table F df 3/62 1
F at 0 05 level - - 2.6 1
F at 0.0 1 level - - 3 .80
The obtained value is 27.48. It i s significant at 0 0 I tevel (F value =
27 48: p - 1 0.01).
Considering the region alone. the one-way interaction of' irnn~ediate
posttest scores of the rural and urban pupils separately. there is significant difference
between the immediate posttest scores and pretest scores

From Table F, df 1 /62 1
F at 0.05 level - - 3.85
F at 0.0 1 level - - 6.66 ( F value 15.97, p - O 0 1 ).
The obtained value is significant at 0.01 level (F value = 1 9: p - 0 0 1 )
Considering the Gender category, the difference between the pretest
and postt est and the obtained F-value is not signif cant
From Table F, df 1/62 1
F at 0.05 level - - 3.85
F at 0.0 1 level - - 6 66. ( F value 1 75, p --, 0 O l )
It can be co~icluded that in the immediate posttest scores. boys and
girls do not differ much when the scores are compared with pretest scores
Considering the two-way interactions between Model categories and
Region. Model categories and gender, Region and Gender the ~nteraction effect is
given in Table 5,34
The significant F ratio among the groups indicates that coilsidering all
the variables and their totat interaction on immediate posttest scores 1s sigt~rficant.
Frorn Table F, df 7/62]
F at 0 05 level - - 2.03
F at 0.0 1 level - - 2.68
The obtained value 5.70 is significant at 0 01 level (F value 5 70; p L,
0 01).

Taking only variables such as Model categories and reylon alone. the
vb~ained value i s riot significant ( F value I 611. p . 0 O t ). The rut-al and UI-ban
~nteraction with immediate posttest scores does not differ much
Coniparing the pretest scores. boys and girls dlf1't.r much in the11-
posttest scores co~~sidering the rnodel categuries. Anlong the f i ~ u r rllociel categories
bovs and girls difi5er in the immediate achievement scores
Considering the combined influence of three variables V I Z . . blodel
categories. Region and Gender, the immediare post test scores art: siyn~ficant at 0 01
level
I t i s seen frotn Table F, df 3/63 1
F at 0 05 level -- 2 61
F at 0 01 level .- - 3 .80
The obtained value 6.83 is significant The combined influetice of
Modcl categories. Kegion and Gender exerts sigtliticant itliluence on rhe immediate
posttest scores. when compared with the pretest scores
To get the adjusted mean scores. Al~alvsis of C o ~ a r ~ a n c e i i calcul;lted . . I he data and results are given in Table 5 35

Table 5.35
Summary o f Analysis of Covariance (ANCOVA) of the Immediate Posttest
scores o f Pupils o f the Experimental (CAM, AOM di ITM) and C:ontrol (CTLM)
Groups Classified by Mode1 Categories, Region and Gender with Pretest ;IS
Covariate (One-way, Two-way and Three -way Classificatio~l)
Among Means 6630 59 Ih 314 31 .. --
Within groups 12430 46 h2 1 20 0 1
Source o f Variatiorr
The total sum of squares, mean square variance and F ratios were
cornputed
I t is seen from Table F, d f 16/62 1
I at 0.05 lecel - - 1.14
F at 0 O l level - - 2.0 1
The obtained F ratio was siyniticant (F ratio -20 70. p . 0 O I ) which
leads to the conclusion that adjusting the interaction effect of reylun and yender the
rnodel categories affect the immediate achievement oft he students
Sum of Squares Degrees o f freedom I squares 1 F- ratio 1
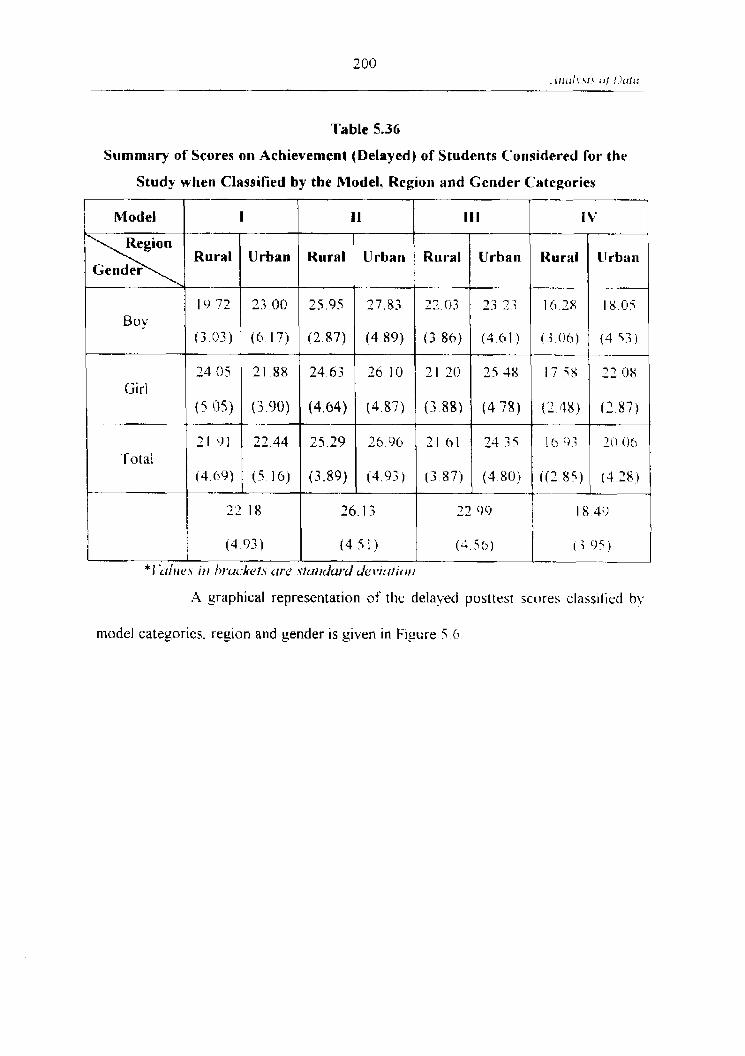
Table 5.36
Summary o f Scores on Achievement (Delayed) of Students Considered for the
Study when Classified by the Model, Region and Gender Categories
A yraphical representation of the delayed posttest scores i;lass~fied by
Model
model categories. region and gender i s given in Figure 5 . 6
I I1
Urban
3 3 0 0
(6 17)
21 88
(3 90)
2344
( 5 1 6 )
Rural
I t l
Rural
2595
(2 87)
24 6-3
(464)
2 5 2 9
(3.89)
Roy
G~r l
Total
-- ---- I \'
Urban
2 7 8 3
(4 8 9 )
36 10
( 4 87)
2696
( 4 9 3 )
I S 7 2
( 3 03)
74 0 5
( 5 0s)
2 1 0 1
(4(,9)
I I
26 13
(4 5 1 )
s t ~ ~ ~ j d ~ ~ r d ~ P I , I U I ~ O I I
Rural
2203
( 3 86)
31 20
(3 88)
7 1 0 1
( 3 8 7 )
22 18
(4 93)
Rural
" -
1618
(i Oh) -
17 < #
( 2 4s)
1 0
( ( 7 8 5 )
Urban
2 7 2 7
(4 61 )
75 38
(4 78)
2 4 i T
(480) -
* I ktilte\ i~ t)rucke~.$ ( I I - L ~
CIrbau
1 8 0 5
(4 s;)
27 08
( 2 87)
3 1 0 h
( 4 2 8 )
22. 09
( 4 56)
18 30 1
( i 9 1 ) I --

i
ALL
I MODEL I MODEL 2 MODEL 3 MODEL 4 I
- .
BOYS
MODEL I MODEL 2 MODEL 3 MODEL 4
GIRLS
MODEL 1 MODEL 2 MODEL 3 MODEL 4 I I
Figure 5.6
1)elaycd I'osttest Scores-Classified by Model Cyategories, Region and Gender
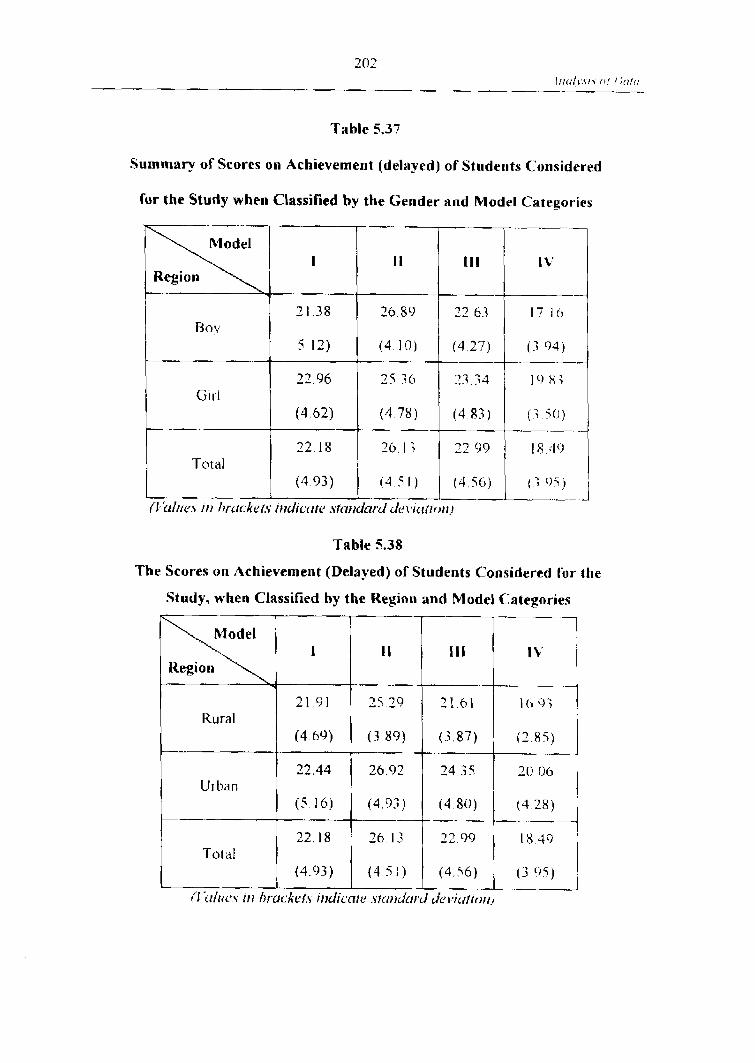
Table 5.37
Summary of Scores on Achievement (delayed) o f Studerits C:orlsidered
for the Study when Classified by the Gender and Model Categories
Table 5.38
Bov
Gi 1-1
Total
The Scores on Achievement (Delayed) of Students Considered for the
I I I 111
21.38 26 89 1 2 63
5 12) (4 10) (4 27)
22.96 25 -36
(4.62) ( 4 78) ( 4 8.7) ( 3 5 0 ) .-
22.18 26 13
(4 93) ( 4 5 1 ) (4.56) {; O i ) .----- . -
Study, when Classified by the Region and Model Categories
0 ~/ I /L* . \ - 111 b r ~ ~ k e i . s i t ~ d i c ~ i t ~ ~ .~fm~dard ~ k \ ~ u t i o ~ t ~ I
I
(I irlrrc.1 I I I hr-crckef.5 ~tldicate \tcn~dcrr.d L f ~ ) i , ~ c r / r o r l l
I I
25 79
( 3 89)
26 92
(49.3)
26 I.?
( 4 3 I )
Rural
Urban
Total
L
21 91
(4 69)
22 44
( 5 1 6 )
22 18
(4 (13)
1 1 1
21 61
( 3 8 7 )
24 35
( 4 8 0 )
1 2 '19
(4 5 6 )
-- - -
I t '
- - -- 10 0;
( 2 85)
20 (MI
(4 28) -- -*
I X 49
(-? 0 5 )

Table 5.39
Summary of Analysis o f Variance (ANOVA) of the Delayed Posttest Scores o f
Pupils o f the Experimental (CAM, AOM & ITM) and Control (CTLM) Groups
classified by Model categories, region and gender with pretest as Chvariate
(One-way, Two-way and Three-way classificatioa)
Source of Variation
Pretest I Covariate)
Between groups
Model
Region
Gender
?-way interactiot~
Model Reginn
Model Gender
Region Getldet
.;-way interactions
Mode' R~"JII *
Within Grilup
SS
1879.431
5845.846
5107.830
697.004
39 725
428.672
108.-387
3161139
4 132
362932
G e n d e ~ 3 6 L 9 3 2
9036.70
d f
1
5
3
1
1
7
.?
-3
1
3
3 I 120 977 I tl .i 14 I * ; - "+
621 14 5 5 2
MS
1879,431
1169.169
1702.610
607 004
39 725
h123'1
36 129
105.<80
4.131.
170977
F
i29154
80335
11700-i
47 Xi>#
2 730
4 2 0 8
2 4x3
7 2 4 7 .-
284
S . i I . 1
Signiticance
* c
* *
* *
+
9 0 - --
*
*
* . -. . . --
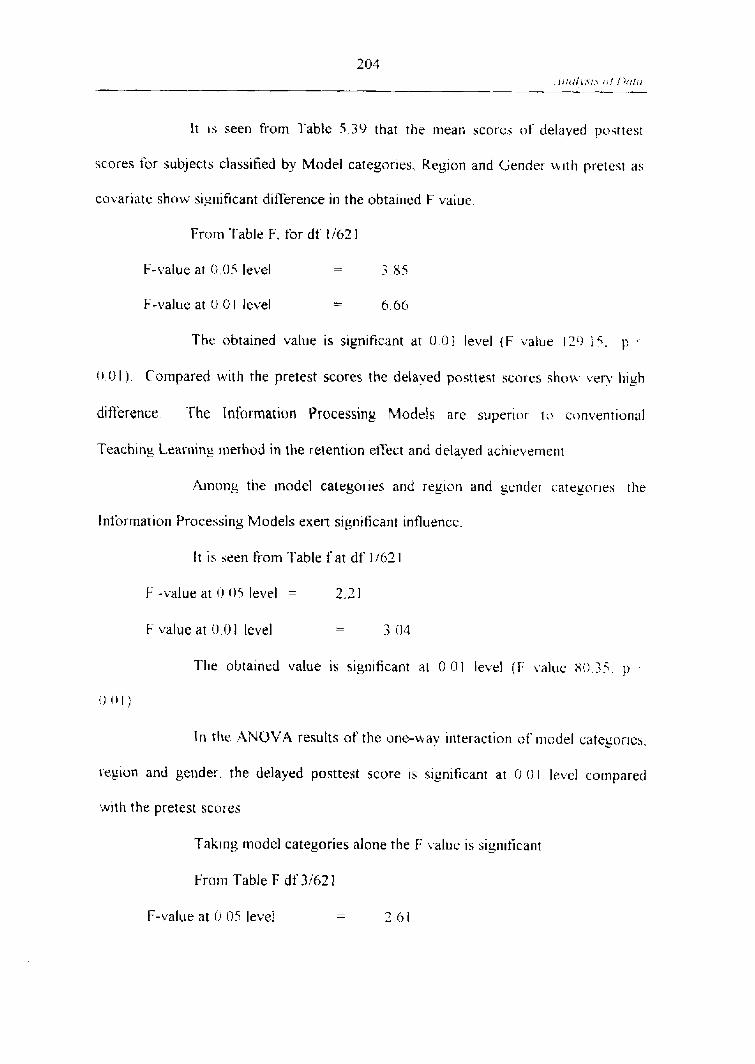
It is seen from Table 5 . 3 9 that the mean scores nf delayed pusttest
scores for subjects classified by Model categories, Region and Gender ui th pretest as
covariate show sigrlificant difference in the obtained F value
Frorn 'fable F. for df 1/62 1
F-value at 0.05 level - - 3 85
F-value at O O I level - - 6 66
The obtained value is significant at U O I level (F value 17'1 I t ; . p .
0 0 1 ) . Compared with the pretest scores the delaved pnsttest sctlres s h o ~ ve? hiyh
ditfercnce 'The Information Processing Models are superior t o conventional
Teachins Learnins method in the retention effect and delayed ach~evemen~
.4tnong the model categories and region and gender- catesories. the
Information Processing Models exert significant influence.
It i s seen from Table f at df 1162.1
F -value at 0 05 level = 2 .2 1
F value at 0 0 1 level - - 3 04
The obtained value is significant at 0 01 level (I: value 80 ;i. p ,
0 o l )
In the ANOVA results of the utle-way ir~teraction of r~iudel categories.
region and gender, the delayed posttest score is significant at I1 0 I level cornpared
with the pretest scores
Taking model categories alone the F i.alue i s sign~ficant
Frorrl Table F df 3162 1
F-value at 0 05 level - - 3 h l
F value at 0 01 level - - .; 80
Thc obtained value of 1 17 0; shows that the delayed posltest score3
among difkrent model categories are significantly difikrent from the scores of pretest
scores ( F value 117.03, p 0.01).
In the localitylregion the interaction etyect of delayed posttcst scores is
sign~ticant The obtained value 47.90 shows that the difference In rural and urban
students is significant in the delayed posttest scores
Ft-om Table F it is seen, df 1162 1
F value at 0.05 level - - 3 85
F value at 0 0 1 level - 6.66
The obtained value is significant (F-value 47.90, p 0 0 I )
Considering the Gender difference there is no signiticant difference
betwee11 the bovs and girls in the delayed posttest scores coitipa~-ed with the pretest
scoi-es
From Table F, it i s seen df 1/62
I: value at 0.05 level .-- - 3 85
F value at 0.01 level - - 6 htj
'I'lie obtained value is not sig~iificanr (F value 2 77. p , 0 0 5 )
I t can be concluded that in the delayed posttcst scorcs the boys arid
girls secure similar scores compared with their pretest scores.
Considering the two-way interactions between model categories and
resion. model categories and gender and between region and gender the ANOVA
results and data are given in Table 5 39 The Table value of F at df 7 i t 2 I I S 2 0; and
2 O X I-espectively
The combined intluence of model categories. reyion a n d gende~. the
[near1 scores among the _rroups exerts significant ~ntluence on the delilved pusttesr
scores But in the two way interactions between nlodel categories and reglun together
there i s no significant ~nfluence on delayed postrest scores ( F value 2 48. p - 0 (1 I )
But In the model categories and sender. there i s s~gtiitica~lt intluence
on delayed posttest scores ( F value= 7.24; p . 0.05 )
In the case of the combined intluence of region and ge11dc.1- there 15 no
signiticar~t diiference in the delayed posttest scores ( F value 3 8. p , 0 05 I
The three-way irlteractions between rnodel categories. region arld
gender the coinbtrled influence of these three variables on the delayed achievetilent i s
significant (F-value 8 -3 I , p -: 0.0 1 )
T h ~ s leads to the conclusion thar these three val-iables t.xrrt a
significant influence on delayed posttest scores by taking pretest as a covar~ate
To get the adjusted mean scores analysis of covariance was calculated.
The data and rxsults are seen in Table 5.40.

Table 5.40
Sunlmaly o f Analysis o f Covariance (ANCOVA) of the Delayed Posttest Stores of
Pupils of the Experimental (CAM, AOM & ITM) and Control (CTLM) Groups
The rota1 sun1 of adjusted rneari squares. mean square va1.ianct.s and 1:
classified by Model categories, region and Gender, with Pretest as Covariate
ratios were calculated using ANCOVA.
Source o f Variation
Among Means
W ~ t h ~ n groups
F m ~ ~ i -l'ilble F fbr df 16162 1
F at O 0.5 l e ~ e l - - 1 14
F at O 01 lecel 2 01
The obtained F value is signiticant (F value 3 0 5 8 . p , 0 01) whlch
Sum o f Squares
8516 88
9036 70
leads to the cunclusion that after adjusting the interactinn eeects of 1-eyion and gelider..
the model categories influence the delayed posttest scores of the students
Degrees o f freedom
16
02 I
Total
* * L S ~ g t ~ l f i c ~ ~ t ~ i (r i 0 0 1 c1t1.d 0.03 l e \ ~ /
Mean F- ratio
squares - ,.- --
I 4 5 5
t- 6 ; 7 17553 58 27 <(>
i-.

Table 5 4 1
Summary uf Analysis o f Variance of the Difference in Achievenlerit Scores af
Pupils of the Experimental (CAM, AOM & ITM) and C:onirol (CTLM) C' ~ r o u p s
Classified by Model Categories, Region and Gender with Pretest as C'ovariate
Source o f Variation
Pretest (Covartate)
Between groups
Model
Kegion
Gender
?-way interactiori
Model Region
Model Gender b
Region r Gender -
.;-way Interactluns
Model x Region Gender
Within Group
SS
229.224
1178.060
953.490
72.605
149.213
218.260
32.958
116,550
68.755
670.784
670 784
11098.810
df
1
i
.
1
1
7
3
.<
1
3
3
621
M S
329223
2;5792
3 7 8 .0
72 605
149.213
31180
10.i18b
-38 850
6 8 7 5
723 5c15
22.; i 95
17 872
F
12820
l 3 l t l . ;
17-78.;
4-06?
8 2 4 9
1 7 4 5
h l 5
2 1713
j 8 4 7
I2 1 I I
1 2.5 1 1
, . - - -. -
Significance - ---
* - -
I
-- .
* - -
.-- *
.--
* ( 0 50)
*
*
--A

The total sum of squares. the ad,justed mcan square imar.lances and I'
ratio were calculated by using analysis of covariance The data and results al-e give11
in Table 5 42
Table 5.42
Sumn~ary of A~ialysis of Covariance (ANCOVA) of the differer~cr irk
Achievement Scores of Pupils of the Expel-imental (CAM. AOM & ITM)
and Control (CTLM) Groups Classified by Model Categories,
Region and Gender with Pretest as Covariate
Source of Variatiorl
The achievement differences between the immediate posttcst sctlres
and delayed posttest scores of the total sample were subjected to the : \~ ia lys~s ut'
L'anance and .4nalys1s of Covariance by taking pretest as a covariatt. Thc data and
results of the analys~s o f variance are given in 'Table 5 4 1
The one-way. two-way and three way interaction viz ~rlodel
categories, region and gender were found out.
The significant F-value for the total sarrlple by tablrlp pre-test as a
covariate and ~t~odel categories, region and gender as categories indtcates the
combined intluence of these three variables on the achievemenr drtkre~icu of' the
pupils in Geography (F value = 12.83; p .; 0 0 1 )
Among Means
Within groups
Total
Sum of Squares
2297 23
11098 81 .- -
13396 04
Degrees or freedom
Mearl squares F- ratio i I 16
62 1
637
14; S X -. 8 r w *
17 $7 1- 2 1 03

Xn~ony the groups the F valuc 1s 1 3 10 whicli I > a lso sigliiticar-11 l't11s
leads t o the conclusion that the difference in mean scores betweell iiiunediatt. aiid
delayed posttest scores
( F t,alue 1.3 19; p .: O O I ) is siynific;uit at 0 0 I Jevel
Takrng one-way interaction of model categories the 1.' ~ - a l u c 1 5
significant Cu~npared with the pretest scores the achlevel-[lent d~ft'erence i:,
significant among model categories (F value - 17 78. p , 0 0 I )
The influence of region is significant ( I - value 4 0 1) 0 05)
Taking the gender variable alone the obtained value i s signifrcatit ( F ialirt. - 8 ;i. 11
0 0 l )
In the achievement difference the two -way intt'racllons between
rnodel categories and reyion, model categories slid yender and reyon and gctlder.
t;imultanet~usIy. al-e not significant. I t is therefore corlcluded that I h u cr)lnhined
influences of model categories and region do not exert an! itltluence on the
achieilemeut difli.rence between immediate ar~d delaved posttest scores ( F ~ i i l u e --
1 75 . p , 0 0 5 )
111 the case of tnodel categories and r,egloti. the combitled Influence 13
tlol siyniiicant 0; \.due = 62. p -,. 0 05).
l'llt. dif'f'ere~~ce in achievement scores arnons inodel ct?lesorle> and
gender is also not siyniticant (F value = 2 17. p - , 0 0 5 b
I n the three-way interactions beticeetl ]nude! caresor,ies. region and
gender tile ciiffe1-ence is significant ( F value 3 847. p 0 115) I t i s ther-etbre
concluded that the combined intluence of model categories. rcyiun and sendel- t t ~ e

achievement differer~ces between the immediate and (jelaved posttest sCo1,t.s 3r.u
significant compared with the pretest scores
F1-on) table F, it is seen df 16/62 1
F at 0 05 le\:el 1.14
r. at 1) 0 1 level - 2 01
The obtained F value significatlt ( F value = 8.03. (1 , 0 O l ) which
l~idicates the significant influence o f model categories after adjust~rly the intluencu ot'
region and gender un the achievement ditt'eretlct: uf immediate and delayed pusttest
scores compared with the pretest scores.
5.4.6 Instructionat Strategies and Intelligence
l'he ar~alysis of the Immediate posttest scures. delaved post test scor.es
and the achievement difkrence of the students betwcen the irnrlletiiate and delayed
posttest scores in the three model categories and in one teacher-centred t raditiorlal
method g o u p revealed the effectiveness of the Inforniatio~~ 1'rocessin.g flodt.lh
approach over the traditional approach. But one cannot say whetl1t.r the s~gni t icai~t
ditTerence in the actlievetnent scores of the expurirnental group oi,er. tlic c o ~ i l r o l gt.(7up
I S due to the eeect iveness of model categories alone The eft'ectiveness of' any ne\\
approach shuuld be assessed on the basis of the other extraneous variables u h ~ c l i
influence thc dependent variable in a s~gnificant way Consider-iny research studich.
learning principles and learning theories. intelligence exerts a significant ~ n t l u e n c ; ~
i~por l the achlevernenr at'the students. The ahaw reason justifies the need fur he
analvsis of the scot-es of 1Q of the students as a covatxite in a (Hie-hay. tho-icay and
three-way Analvsis of Variance and Analysis of C'ocariance

For this a standardised Non-Verbal Group Test of' Inteliigencc w:ds
adm~nistercd to the total sample The mean and standard d e v i a t ~ o ~ of the intelligence
test scores \%ere fi)ui~d out I t was ciassified by tvpu of school and Model cateyor-1e5.
according to ses. locaie were found out. The .\NOVA and .4I\ji'Ol'.4 01' the
immediate delayed and achievement difference of the posttest scot-es un ;~chiet.cment
in Geography were calculated with intelligence score as n covariatt.
Distribution of lr~telligence Scores of Pupils-Classified by Type of School and
Model Categories
The statistical measures of mean and standard dev~at~on for the hon-
Verbal Group Test of intelligence were computed. 'Che scores or~ Intelligence Test u!'
' ' jr1es studcnts considered for the study. were classified by the school and nod el c a t ~ h c
The data is presented in Table 5.43
The Scores on lntelligence of students considered t i j r the study when
classified by the school and Model categories provide the folluuing surnman
statistics
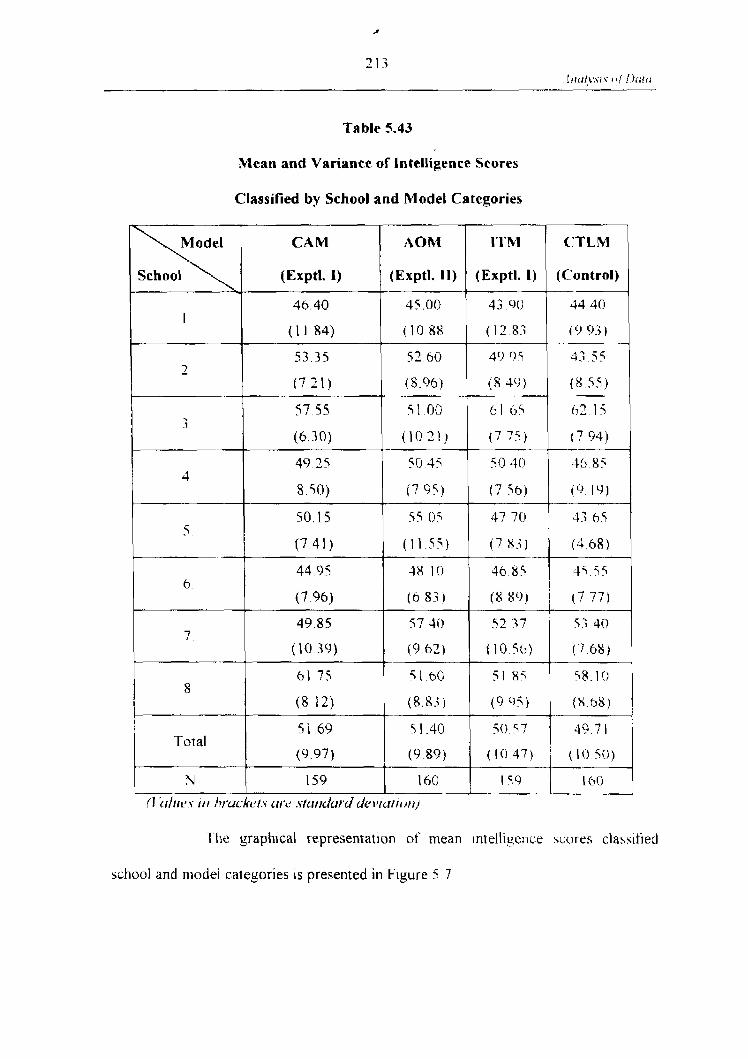
Table 5.43
Mean and Variance of Intelligence Scores
Classified by School and Model Categories
The graphical representation of mean ~ntellise~ice scores clabsified
school and model cateyories i s presented in Figure 5 7
CTLM
(Control)
44 40
( 0 9.3) - 3.; 55
(8 5 3 )
(13 15
( 7 94) - 36) 85
tL) 19)
-1; 65
(J 68)
] 4 5 5 5
CAM AOM
(Exptl. 11)
45 00
( l o 88
52 60
(8 96)
5 1 00
(10 31)
50 45
( 7 95)
5 5 0 5
( 1 1 55)
1 X 10
1
2
1
J
4
5
ITM
(Exptl. I )
4.3 00
(12 83
40 05
(8 4(1)
61 0 5
I7 75 )
50 30
( 7 $ 6 )
47 70
(7 8 3 ) - 4b8q
(Exptl. 1)
46 40
I 1 84)
53 35
(7 21)
57 5 5
(6 30)
49 25
8 SO)
50 1 s
(7 41)
44 95 6
7
8
Total
N
(I irlrrc, 5 in hr-~rckcjt.\
( b 83)
57 40
(9 62)
51 60
(8 83)
51 40
(9 89)
160
~ C I ~ L I I I I I I I J
(7 96)
49 85
(10 39)
61 75
(8 12)
51 69
(9 97)
159
c r w .\tcrntd~lrd
( 8 80 )
5 2 i 7
( 10 5(7)
51 8 5 $8 10
(9 05 )
(1047) (1050)
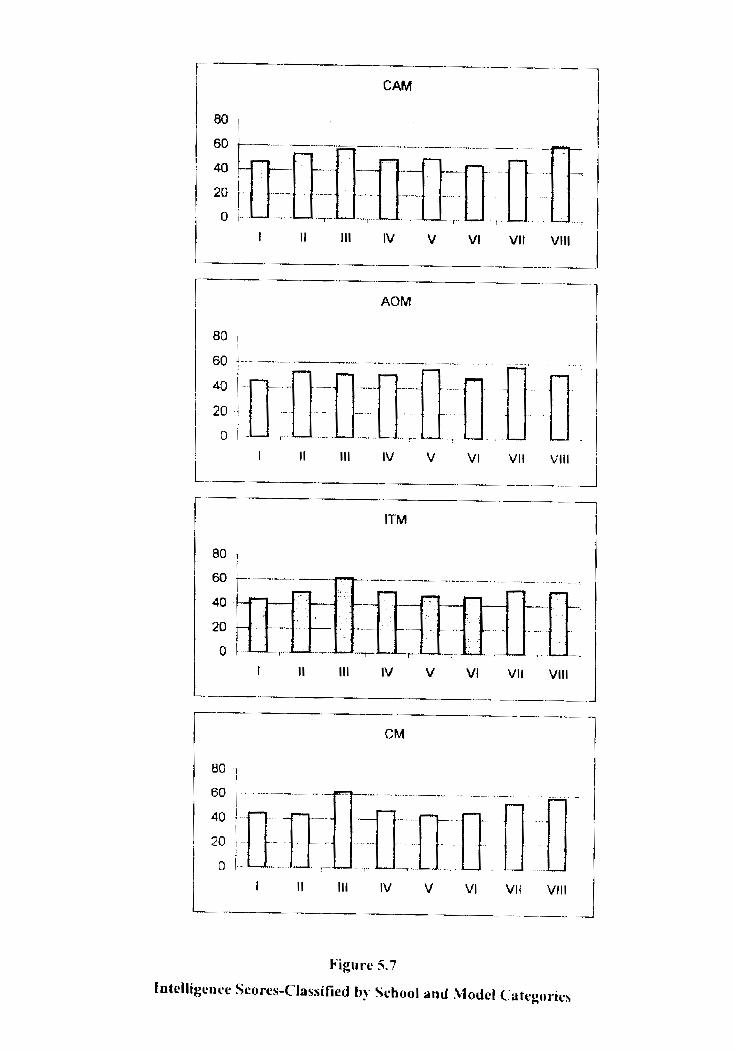
CAM
L ----- 1 AOM
80 1 1 1 O l -
L- -- J
-.
ITM --1
-- . - ._
1 -
I II Ill IV v VI VI1 Vlll
Figure 5.7
In tclligencc Seorcs-Classified h! School and i lodcl (:ategorich

The arithmetic mean of the scores on intelligence r ~ l ' studer~ts belol~gil~g
to the CAM (esptl.1) Group i s 5 1 69 and the standard deviation is L1.97 The
Arithmetic mean of AOM (exptl.11) Group is 51 40 and standard deviation is L1 8')
The 1I'M (exptl. Ill) Group obtained an arithmetic mean of 50.57 ( 1 0 42) and t h a ~ of
the control group i s 49 7 1 and standard deviation is 10 50 This shows that the
intelligence scores of four model categories do not difier tr~uch hur v a y c ~ l l y sliyhtlv
It means that the intelligence scores of students in four nlodel categories are almost
s~milar
But by merely comparing the four model groups one cannot be
conclusively said that four groups were not differed significantly In the tnean scores
on intelligence
Comparison o f Intelligence Scores in the CAM (exptl. I) Group and C.:fLM
(Control) Group
The mean and standard deviation of the intelligence scores of pupils of
159 pupils in the CAM (exptl.1) and 160 pupils in the CTLM (control) _rroup were
calculated. The Critical Ratio (C.R) was found out and tested for sipificanct: The
data and results of the test of significance between means are given in 'I-able 5 44

Table 5.44
Data and Results o f Test of Significance of Difference between Mean Intelligence
Scores of Pupils in the CAM (expt1.l) Group and CTLM (control) Group
The critical ratio obtained is significant at O 05 level (E' R I 90. p , -
U 0 5 ) . So i t can be concluded that there is significant difYet-ence heriveen ('.Ah1
(exptl . l ) and CTLM (control) in terms of intelligence This difkrence it; i n f'avuut of
CAM (exptl. L )
Cumparison of intelligence scores classified by school and model
categories In the .40M (exptl 11) Group and T'TI..M (control ~ T O L I P ) i w ~ . e calcc~lated
Thc data and results of the test of significance of diflercnce between
mean intelligence scores are given in 'Table 5 45
Group
(exptl I )
C'I'L,M (Control y'uup)
Mean
5 1 7 0
49 71
N
159
160
S.D (0)
9 9 7
10 50
C'ritical Ratio (C.R)
1 90
Level o f significance -1
- I

Table 5.45
Data and Results of Test o f Significance of Difference betweell Meal1 IQ Scores
o f Pupils ill the AOM (exptl.11) Group and CTLM (control) Group
The cntical ratio obtained is not significant at O 0 5 and 0 01 level
(C R = 1 48, p . U 05) So it can be concluded that there rs nu s~gn~ticant dityerence
between . 4 0 M (exptl I I ) and CTLM (control) Groups
Comparison o f Intelligence Scores Classified by Schools and Model I:ateguries in
the ITM {exptl.lll) Group and CTLM (control) G r o ~ ~ p
The mean and standard deviation of the I($ hcclres In the ITM
(exptl 111) Group and Control (CTLM) Group were calculated 'Ptw significance of
difference between means is given in Table 5 46
--- Level o f
signiiicance --
Wc>t sigtlificat~t
Group
(exptl 11)
CTLM (C:ontrol group)
TY
IhO
160
S. D (0)
9.89
10.50
Mean
5 1 40
49.71
Critical Ratio (C-H)
1 38

Table 5.46
Data and Results of Test of Significance of difference between Meau IC) Scorrs ol'
Pupils in the ITM (extpl.LI1) Group and CTLM (control) group
The critical ratio obtained is not significant (C.R 1 89. p , 0 0 5 ) S o
Group
ITM
(uxprl. f l I )
CTLM (Control group)
~t can be concluded that there is no significant d~fference between Il 'hl (e.uptI.III) and
C'TLM (control) groups
Table 5.47
N
I59
160
Summary of A~lalysis of Variance (ANOVA) of the immediate posttest scores of
Mean
5057
49.7 1
S. D ( ~ 1
10.47
10 50
pupils of the Experimental (CAM, AOM & ITM) and Control (CTI,M) Groups
Critical Ratio Ixvel of siprlificance
I ,St)
classified by Model Categories with Intelligence as Covariate
Kut s i ~ n ~ f i c a n t
----- -, i
* * L S ~ p ~ j f i c ~ ~ ~ ~ t 'it 0.03 / i w / llttd 0.0 I It> I Y /
1 i
MS
39 19 470
-370 9 ~ 3
22134
d f
1
3
6.3.3
Source of Variation
Intelligence(covariate )
Hetween Groups
Withtn Groups
F- ratio -1 1 1 884** i 17 03 I * * i
SS
391 9 470
I 130.888
14010.683
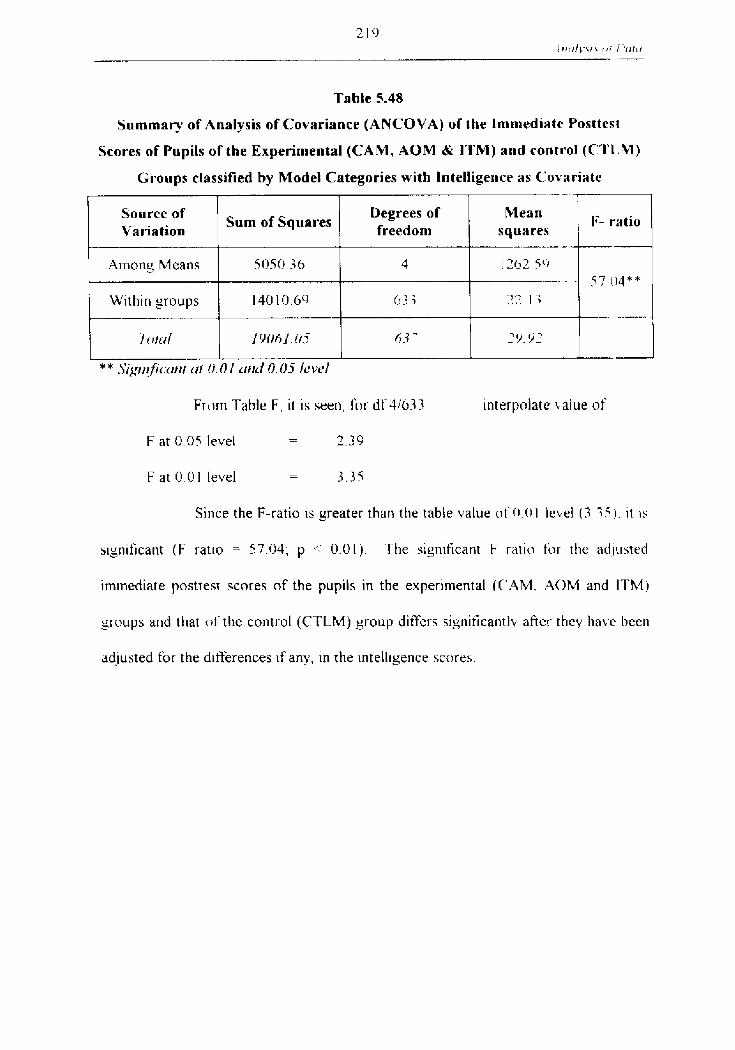
Table 5.48
Summary o f Analysis o f Covariance (ANCOVA) of the Immediate Yosttest
Scores o f Pupils o f the Experimental (CAM, AOM & ITM) and control (CpI'lAM)
Groups classified by Model Categories with Intelligence as Covariate
I --- -
Source o f I Degrees o f Sum of Squares F- ratio
Variation freedom squares -
A~nony Means 5050 36 4
Within groups 14010 69 6 -3 ; 32 1.3 - -.
I olul 1 Y t l f i l . fij 43 - _"Y V.?
Frwn Table F. it is seen, for df 416.?3 inter pol at^ r alue of
F at 0.05 level - - 2.39
F at 0 0 1 level - - 3 , 3 5
Since the F-ratio is greater than the table value ilt' 0 0 1 l e ~ el ( 3 7 5 1 . i t IS
significant ( F ratto = 57 04; p 0.01) The sign~ticant t ratio tijl- the adlusted
irnrnediate posttest scores of the pupils in the experimental ( ( 'AM. .40M and ITM)
31-uups and that of'the control (CTLM) group differs signiticantlv after they have been
adjusted for the differences if any, in the intelligence scores
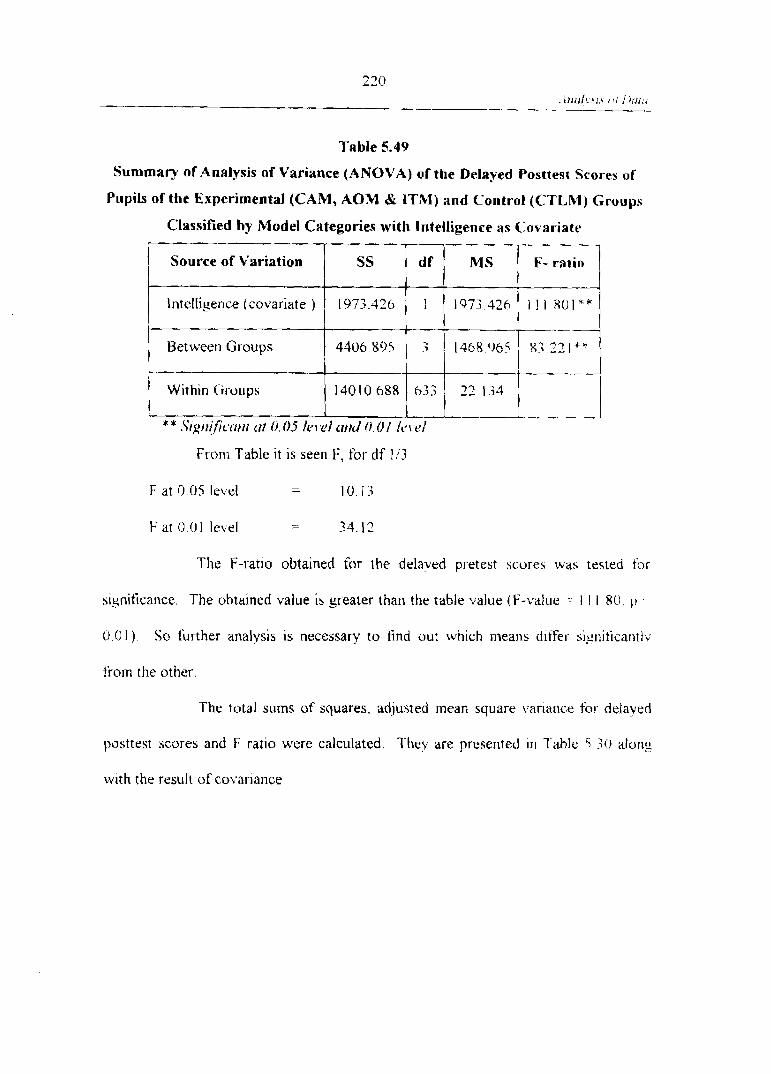
Table 5.49
Summary of Analysis of Variance (ANOVA) of the Delayed Posttest Scores of
Pupils of the Experimental (CAM, AOM & ITM) and Control (CTLM) Groups
Classified by Model Categories with Inteltigenre as C:ovariatt. I
Source of Variation
l~~teilipence (covariate )
Betweet) Groups
I I 1 I I --- * * . Y ~ p ~ i f i ' c , t i t ~ t crr 0.03 ILJVL.I ~ I J 0.0 I kc\'~'/
J Within Ciroups
From Table i t is seen F. for d f 113
SS
1973 426
4406 805
F at 0.05 level - - 10 I . ?
1401068X
F at 0 0 I level -. - 34.12
d f
1
The F-ratio obtained for the delaved pretest scores was tested for
633
siyniticance. The ohtained value is greater than the table value (F-L-alue - 1 I 1 80. 11
M S
1973 32h
1468 065
22.134 I---- 1
0 01). So further analysis is necessary to tind out which means d~f'fer- sigr-iiticantty
F- ratio
l l 1 X O I * * .---
8 ; 22 I * *
from the other
The total sums of squares, ad,justed mean square vartatlce for delaved
posttest scores and f: ratio were calculated. They are presented 111 Table 5 30 along
with the result of covariance
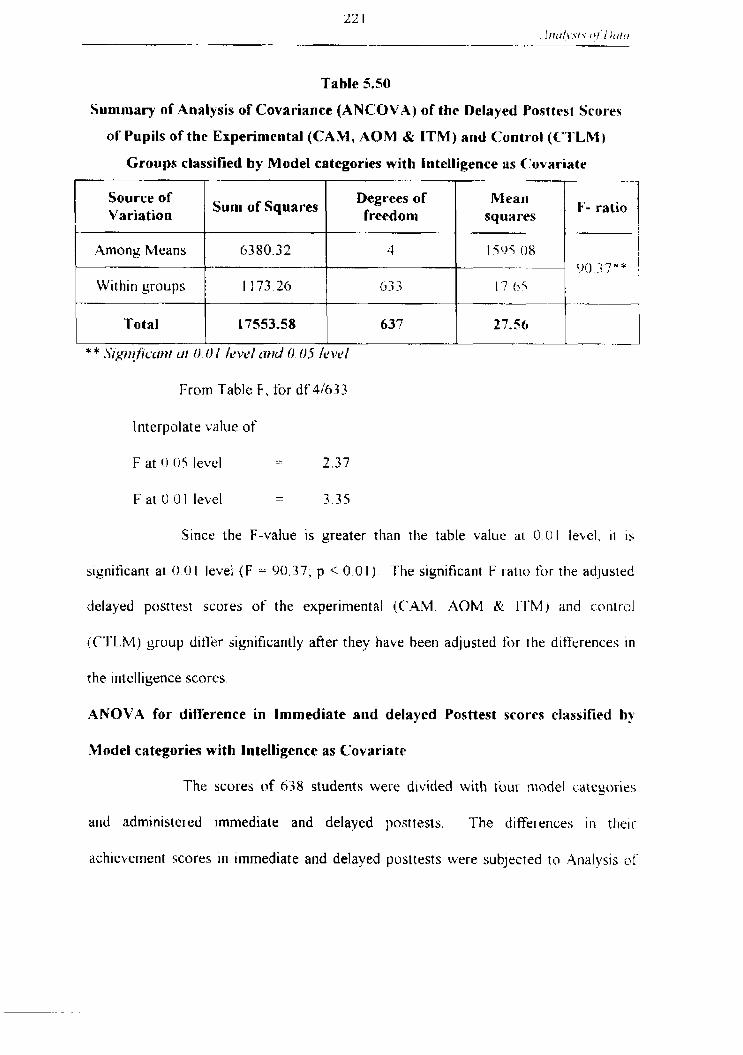
Table 5.50
Summary of Analysis of Covariance (ANCOVA) of the Delayed Yosttest Scures
o f Pupils of the Experimental (CAM, AQM & ITM) and Control (C'I'LM)
Groups classified by Model categories with Intelligence as Covariatt
Source o f Variation
Among Means
Within groups --
From Table F, for df 41633
Sum of Squares Degrees of freedom
'Total
lnterpolate value of
F at U 05 level LL 2.37
Meall F- ratio squares T- ---
6380 32
1 173 26
17553.58 / 637 1 27.56 i
F at O 0 1 level - -. 3 35
Since the F-value is greater than the table value at 0 .0 1 level. i t is
4
6 -3 -3
significant at 0 01 level (F - 90.37; p < 0 01) The s~gnificant F ratlo f i ~ r the adjus~ed
"(?"" 11,) ;j"+*
17 05 - -- . --
delayed posttest scores of the experimental (('AM. AOM & ITM) and control
(C'1'L.M) group dif'fr significantly after they have been adjusted fbr the diikrences in
the intelligence scores
ANOVA for difference in Immediate and delayed Posttest scores classified by
Model categories with Intelligence as Covariate
The scores of 638 students were divided with tour 111odel c.ntegoi.ies
and administered ~mmediate and delayed post tests. The differences in their
ach~evement scores in immediate and delayed posttests were subjected to 4nalvsis of'

Covariance ( ANCOVA) to find out whether there existed any sisrlificant relatiotl in
the effectiveness of the four methods considering ~ntelligence as a cvvariate
Before proceeding to ANCOVA. the scores are sutljected lo
ANCOVA. The total sum of squares, mean square variances and F' ratio for the
differences in achievement scores of immediate and delayed posttest scores of the
three esperllnental (CAM, AOM & ITM) and one control group (C'Tl .hl) considering
intelligence as a covariate were found out. Table 5.5 l shows the data and result ot'
analysis of variance
Table 5.5 1
Summary o f Analysis o f Variance (ANOVA) of the Difference 111 Im~nediate and
Delayed Posttest scores of pupils of the Experimental (CAM, AOM ITM) and
From Table F, it i s seen for df, I / ;
Control (CTLM) Group classified by model categories with Intelligence as Covariate
F at 0 05 level - - 10 13
Source uf Variation
Intelligence (covariate)
Between Groups
Within Groups L
F at O 0 1 level - - 34 12
-
SS d f M S F- ratio
330 600
1080.370 3 360 12.; I 0 O2U*
1 1985 067 63.; 1 8 '13 4
The F ratios for the four sets of scores were subjected tu the test of
* ,S~,qr~~ficmtt ( / I ~ 1 . 0 j IP IWI
significance The table value of F for df 113 value is 10.I.3 at 0 0 5 level and 34 12 at
0.01 level The obtained value of F ratio is significant at 0 05 level F value = 17 4h. p

.I 0.05) This indicates that the four groups (CAM. .40M. ITM and C'TLM) diffel-
siyniticantly in the diRerence in the immediate and delayed post-test scor-es
Since the F values are significant. the rnean scores of' differences in
achievement must be adjusted for the intelligence scores and only then car1 one say
whether the groups differ very much in their diEerence in immediate and delayed post
test scores in achievement. So hr ther analysis is necessary to finti out which means
differ siynjticantly tiom the others
The total sums of squares, adjusted mean square barlance for- the
differences in immediate and delayed post test scores and F r a t ~ n were calculated
They are presented in Table 5.52 along with the result of Analysis of C ' O L ~ T I ~ I I C ~
Table 5.52
Summary of Analysis of Covariance (ANCOVA) of the Difference in
lmmediate and Delayed Posttest Scores of Pupils in the Experimental
(CAM, AOM & ITM) and Control (CTLM) Groups Classified
by Model Categories with intelligence as Covariate
Source of Variation
. b o n g Means
Within groups
* * Sigttffic~~tu cl! 0. (13 uttd 0.01 level.
* Siptif icu~ti r r f 0.05 Icwl
From 'Table F, it seen for df 4/63? interpolated value ut'
SS
1410.07
- Total
F at 0.05 level = 2.39
1198507
F at 0 1) 1 level = 3.35
df
4
13396.04
633
lClS
352.74
637
F- ratio
18 6.<**
1893
2 1 03
19020*
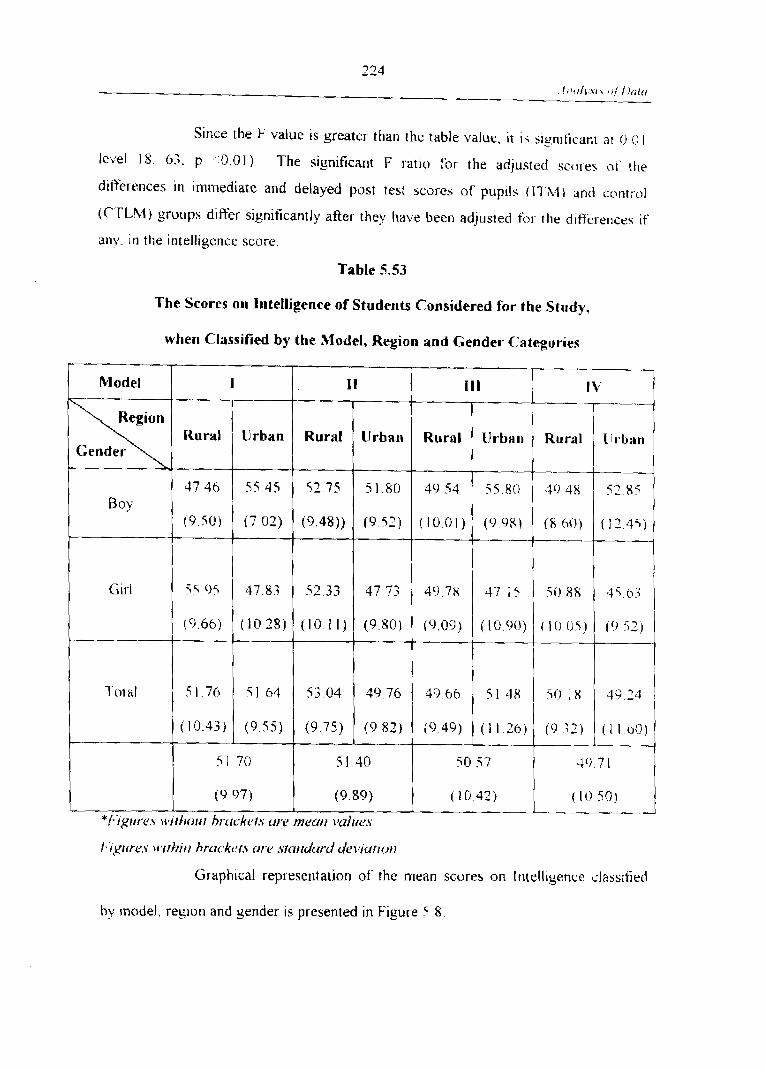
Since the F value i s greater than the table value, it i s sign~iicilnt a1 0 , O 1
level 18 63. p - 0 , O I ) . The significant F ratio for the adfuted scores ol. the
differences in imtr~ediate and delayed post test scores of puplls (11.M) and cirntrul
(TTLM) gruups differ significantly after they have been adjusted ti)]- the ditTel-uncrs if
any. in the intell iger~ce score
Table 5.53
The Scores on Intelligence of Students Considered for the Study,
when Classified by the Model, Region and Gender Categories
Graphical representation of the mean scores un Intell~gence classrfied
by model, rey~on and sender is presented in Figure 5 8
T
M ode1
Boy
Girl
1'01 ai
*I-igttrc~h
I I I I l I I I I \ ,
ttural
47 4h
( 9 5 0 )
55 0 5
(9 6 6 )
I 7t)
(10 43)
Rural
53 75
(948) )
5 2 . 3 3
(10 1 I )
53 04
(9 75)
Urban
5 5 45
( 7 0 2 )
47 83
(10 28)
5 1 64
(9 5 5 )
Urban
5 1 80
(952 )
47 73
( 9 8U)
49 76
(9 82)
5 1 70
( 0 9 7 )
\ v~ i l~o tc / hr-rrcket.) rrru
5 1 40
(9 89)
mew! ~~olllrre.+
Rural
40 53
(1001)
llrhar~
55 80
0
-
Rural
30 4X
(XhO) - -
4'1 78
(9.09)
49 66
('1 49)
Iirb;in
-
52 85
( 1 2 4 5 )
47 I5
(10
5 1 4% 50 18 39 14
( 1 1 26) rC> ;2 ) ( 1 1 60)
50 37 40 7 I
(10 42) ( l o 50) -
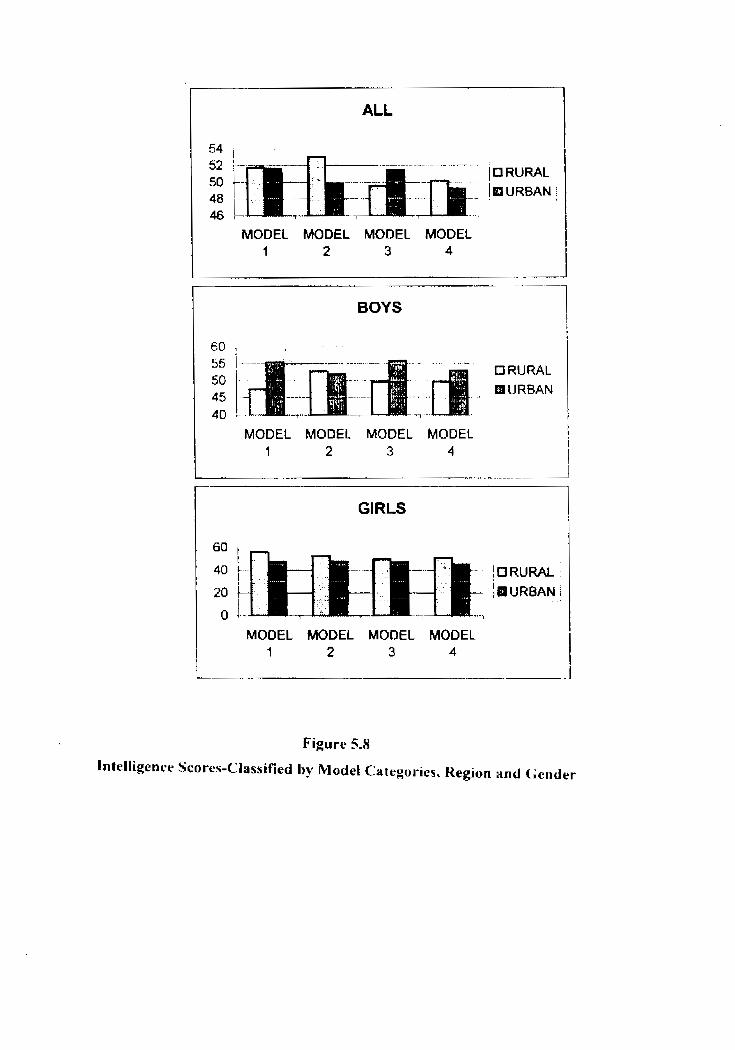
ALL
54 t
I RURAL I :: l-:~--fic-~; m--
48 I URBAN
46 r - -7 - -7-
MODEL MODEL MODEL MODEL t 2 3 4
-- -- -- 1
BOYS 1 I
60 " ' El RURAL
45 URBAN
40 -7 - -- I MODEL MODEL MODEL MODEL !
1 2 3 4 1
- . -- - -- I
J
GIRLS 1
MODEL MODEL MODEL MODEL
Figure 5.8
Intelligence Scores-Classified by Model Categories. Hegiun and Lender

Table 5.54
The Scores on Intelligence of Students Considered for the Srudy,
when Classified by the Gender and Model Categories
Table 5.55
Bov
G~r l
1. otal
The Scores on Intelligence of Students C:oasidered for the Stedy.
when Classified by the Region and Model Categories
I*/p~rr.e.r wrfholrt hrcrukt.f.3 crre m c ~ u ~ rstr/rrr).$
I
55 51
(920)
51 89
(10 72)
5 1 70
( 9 9 7 )
I I
52 23
(945)
5 0 5 3
(1029)
5 1 30
( 9 8 7 )
-
I v
-- 50 I'd
(9333) --
40 2.1
( 1 1 (70
iCC171
( 10 50)
111
52 71
(1042)
48 46
(10 0 5 )
5 0 5 7
(1042)
I+ig~rrt~.t w~thortl hrcrckei.~ are mucr/t ~ t rhre .~
I
-- 1
I v
5 1 10
( 1 0 7 7 ) --
48 2'1
(10 08)
4g71
( I l l S o ) - . J
I1
53 03
( 9 7 5 )
49 7h
(9 8 3 )
5140
(9 89)
Kural
I!rban
Total
1 l l
49 06
(349)
51 4%
( 1 1 26)
5 0 5 7
( l o 42)
5 1 76
(1043)
5 1 64
(9 5 5 )
5170
(9.97)
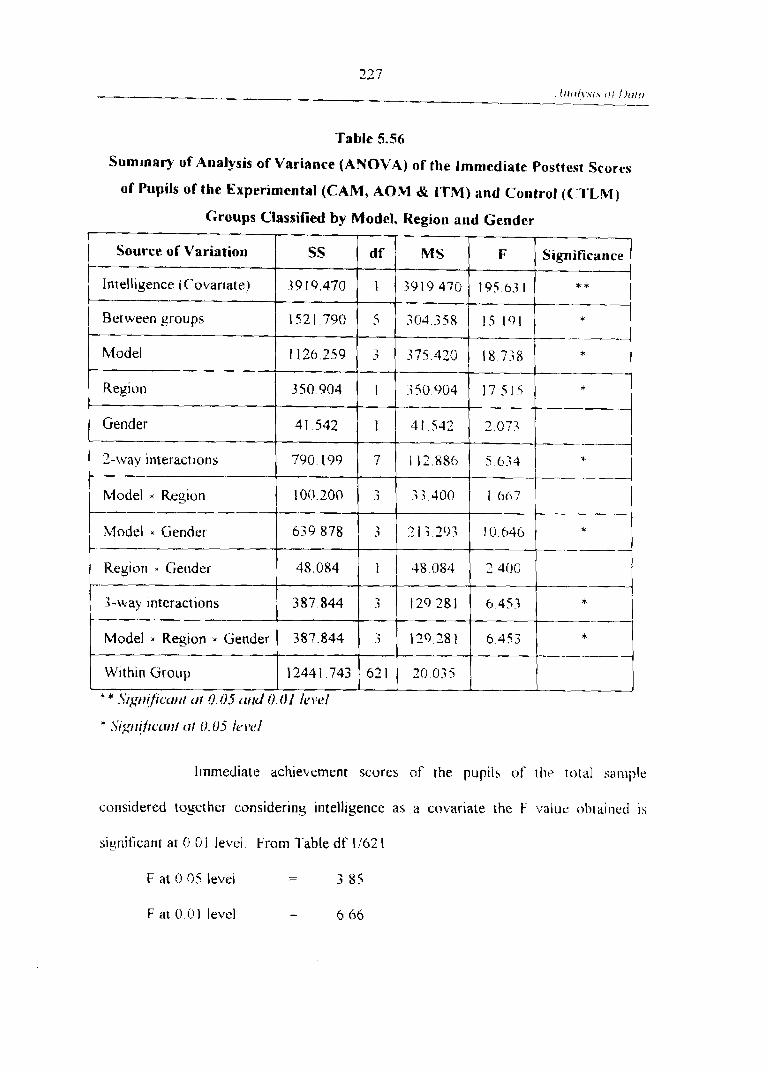
Table 5.56
Summary of Analysis o f Variance (ANOVA) o f the Immediate Posttest Scores
o f Pupils of the Experimental (CAM, AOM & ITM) and C o ~ ~ t r o l (("TLM)
Immediate achievement scores of the puptls of rht. total sample
considered toyether considermy ~ntelligence as a covarlate the F valur: obta~ned 15
sl yniiicant ar 0 0 1 level Frum Table df 1/62 1
F at 0 05 level - - 3 85
F at O 0 1 level - - 6 66
Groups Classified by Model, Region and Gender
Source of Variation
Intelllgence (C'ovartate)
Between groups
Model
Re_rlon
Gender
?-way ~nteractions
Model x Regton
Model x Gender
Keglvn * Gender -
;-way lnteractlons
Model Region Gender
W~th tn Group
* * . S I ~ ~ ~ ! I ~ ~ L L I I I / (11 0.05 ~ltld
SS
39 19 470
1521 790
1126259
350904
41 542
790 I99
100 200
639878
48 084
387844
387 844
13441743
U.OI /c\lel
d f
1
5
3
1
7
3
-3
I
3
3
621
M S
39 19 470
304 -is8
375420
350904
4 i 5 4 2
1 12 886
;3400
2133r1?
48 084
129281
129 28 1
20035
F
i 95 63 1
15 I O I
187;8
1 7 5 1 5
Significance
* * -- --
* -.--- ---
T
A-
* ;;;;I -;--j --
1 6 0 7
10hJO
2 400
6 4 5 1
-- -A 6 45.3 *
---

'The obtained value is significant at 0 0 1 level ( F value - 19i.61
p - O 01) which shows that the difference in mean scores among intelligence level is
sign~ficant. So it can be concluded that there is a significant influence of 1Q on
immediate posttest scores.
.Among the niodel categories and intelligence levels there existed
sign~ticant diRerence.
From table F. fur df 5/62 I .
F at 0.05 level - - 1 2 2
F at 0 0 1 level - - 3 04
The obtained value IS significant at 0 01 level (F - 15 19. p ,- O 01
Hence it inav be concluded that intelligence evens a significant influence upon
immediate achievement
Considering the four model catesories alone intelligence cxcrts a
significant influence on immediate achievement
From Table F, for df 1/62 1
F at Of15 level - - 3.85
F at 0 0 1 level - - 6 66
The obtained value is 18 738 F ratio is significant at O 01 level ( F
ratio: 18 74, p c. 0 01 ) Therefore 11 can be concluded that intelligence exerts a
significant influence on immediate posttest scores
Considering the region as a single category the influence vf
intelligence on immediate achievement is sign~ficant From Table F, for df 1/62 I .
F at 0 05 level - - >85
F at 0 0 I level - - 6.66
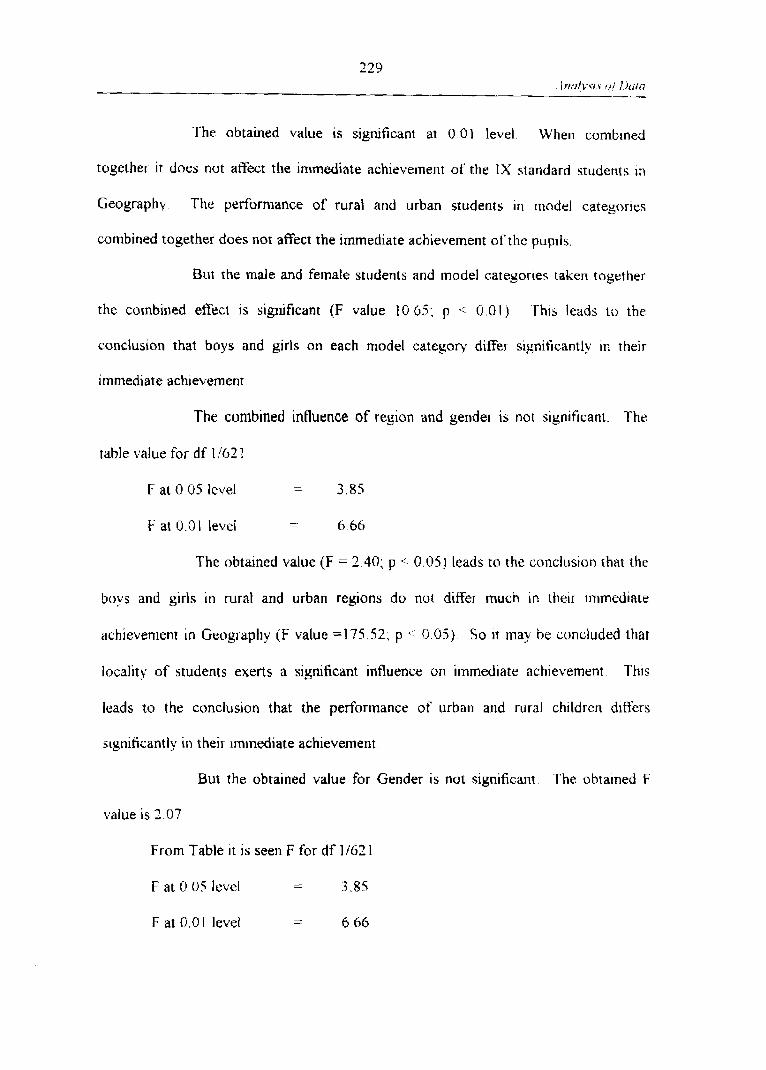
The obtained value is significant at 0 01 level When combtned
together it does not affect the immediate achievement of the IX standard students in
Geography The performance of rural and urban students in model categories
combined together does not affect the immediate achievement of the pupils.
But the male and female students and model categories taken together
the combined effect is significant (F value 10 65; p i 0.01) 'This leads tu the
conclusion that boys and girls on each model category differ significantly in their
immediate achievement
The combined influence of region and gender is not significant. The
table value for df 1/62 1
F at 0 05 level - - 3.85
F at 0.0 1 level -. - 6.66
The obtained value (F = 2.40; p -- 0.05) leads to the conclusion that the
boys and girls in rural and urban regions do not differ much in their ~mmediate
achievement in Geography (F value =175.52; p % - 0 05) So 11 may be concluded that
locality of students exerts a significant influence on immediate achievement This
leads to the conclusion that the performance of urban and rural children ditfers
significantly in their immediate achievement
But the obtained value for Gender is not significant The obtained F
value is 7.07
From Table it is seen F for df 1/62 1
F at O 05 level - - 3.85
F at 0.0 1 level - - 6.66
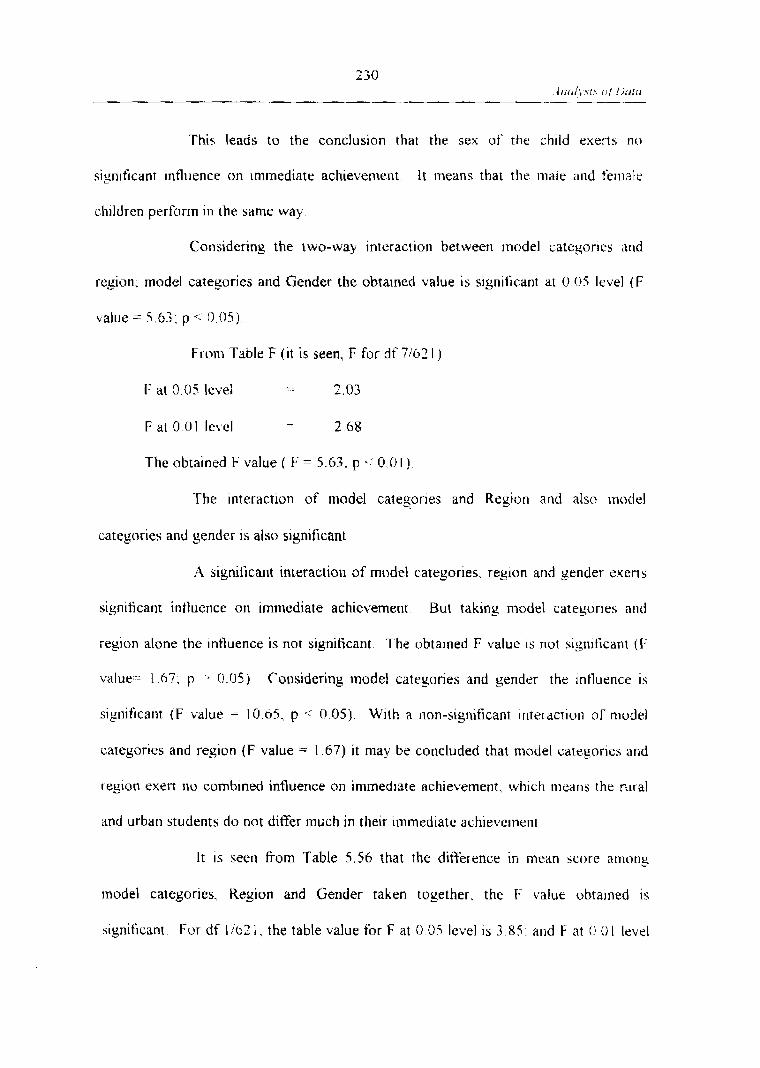
This leads to the conclusion that the sex of t h e child exer-ts n o
sisnificant influence on immediate achievernent. l t means that the male and f'eliialt.
children perfbrm in the same way
Considering the two-way interaction between model catesorles and
I-egion; model catesories and Gender the obtained value is signiticant at O 05 level ( F
L-alue = 5.63. p -- O 05).
Fro~n Table F ( i t is seen, F for d f 7/62 1 )
I- at 0 0 5 level . . 2.03
F at 0 0 1 level - - 2 68
The obtained F value ( F = 5 . 6 3 ; p .: 0.0 I )
The interaction of model categories -. and Region and also nod el
categories and gender is also significant.
A significant interaction of model categories. region and render exens
significant inthence 011 immediate achievement But taking model categories ntid
reg~on alone the intluence is nor significant. The obtained F value is nut signiticant (1;
value- 1 67. p 0.05) Considering tnodel categories and gender the influence is
significant (F value - 10 0 5 , p .: 0.05). With a non-significant interacrion of model
categories and region (F value = 1.67) i t may be concluded that model categories and
region exert no combined influence on immediate achievement, which means the nlral
and urban students do not differ inuch in their immediate achievernen~
I t is seer1 from Table 5.56 that the difyereme in mean score atnot13
rnodel categories, Region and Gender taken together. the F value obta~ned is
significant For df 1/02 1, the table value for F at 0 05 level is 3 8 5 . and F at 0 0 I level

is 0.66 The obtained F value is significant at 0.05 level. This leads to the conclusion
that the interaction effect of model categories. region and gender is significant 'I'hus
1 1 may be concluded that model categories, region and gender when corrlbined
together exert a siyniticant influence on immediate achievement scores So further
analysis 1s necessary to find out whether there exists any signiticant difference in the
effectiveness of the four methods considering intelligence as a covarin~e
The total sum of squares, adjusted mean square varia~iue atld F I-atlo
were calculated. The results of analysis are given i t ] Table 5 57
Summary o f Analysis of Covariance (ANCOVA) of the Immediate Posttest Scores of
Pupils o f the Experimental (CAM, AOM & ITM) and Control (C'TLM) (;r+oups
From Table F it is seen df 16/62 1
classified by Model Categories, Region and Gender. with Intelligence as C'uvar.iale
F at 0.05 level - - 1 14
Source of Variation
Aniong Means
Within sroups
Total
F at 0.OI level - 7 01
The obtained value (F value = 20.65, p .: 0 O l ) is greater than table
* * . S I ~ J I I # ; L ~ ~ ~ I ~ r r f 11.05 U ) I ~ 0.01 IL>I'L'I -1
SS
6619 30
12441 74
1906105 I
value. I t shows that the immediate posttest scores of the experimental group ditier
df
16
621
637
M S
413 71
20 04
29.97,
F- ratio
2065** 1 ----I
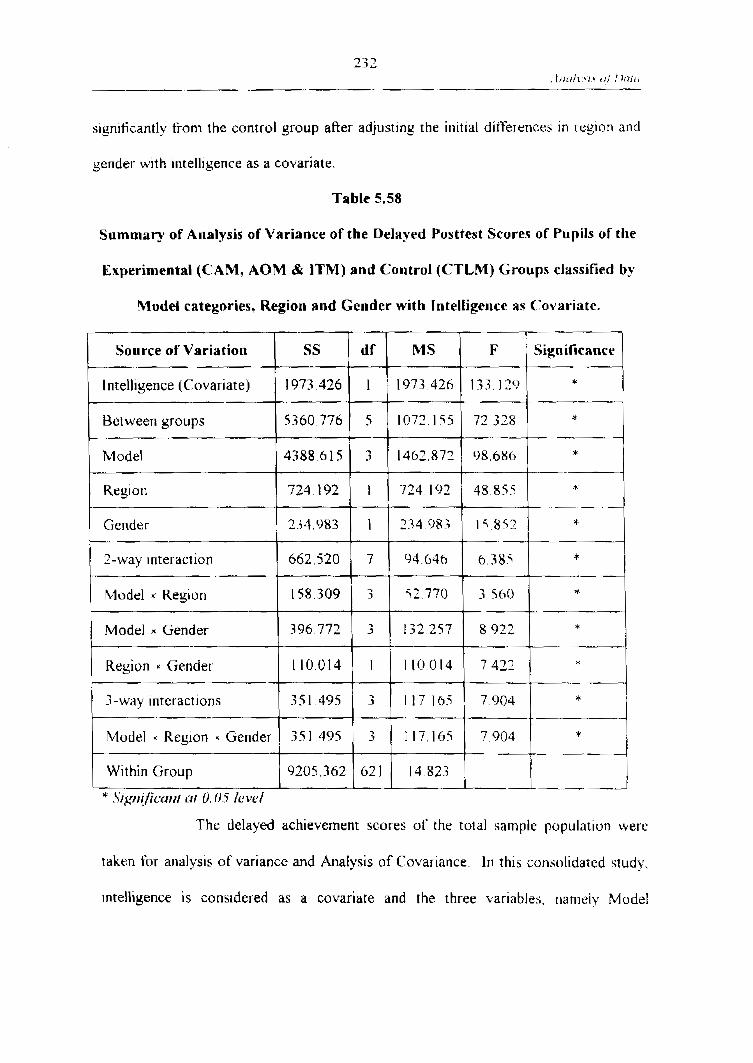
sieniticantly L from the control group after adjusting the initial ditt'erences In reyon and
gender with intelligence as a covariate.
Table 5.58
Summary of Analysis o f Variance of the Delayed Posttest Scores of Pupils of the
Experimental (CAM, AOM & ITM) and Control (CTLM) Groups classified by
Model categories, Region and Gender with In teltigence as C:ovariate.
Source of Variation SS d f M S F Significance
Intelligence (Covariate) 1 973.426 1 1973 426 1 3 3 1 20
Between groups 5360.776 5 1072 155 72 328
Model 4388615 -3 1462872 98686
Region 724192 t 724192 48855 --
?-way interaction 662,520 7 94.646 6.385
Model . Region
Model r Gender
Region * Gendet
;-way interactions
The delayed achievement scores of the total sample population were
158.309
396.772
Within Group
taken for analysis of variance and Analysis of Covariance. In this corlsolidated studv,
1 I
5 2 770 3
110.014
3 5 1 4 9 5
intelligence is considered as a covariate and the three variables. namely Model
3
- * S I ~ H ! f~ccu~r ut 0.05 /e vt.1
J 9205.362
3 560
1
3
lr
132,257
62 1
8922
110014
117165
14 823
7422
7904
1
* I

categories, Region and Gender are subjected to one way. two way and three-way
analysis
The total sum of squares, mean square variance arlci F ~-atios fiv the
delayed posttest scures were computed.
The significant ratio for the one-way. two-way and three-way analysis
indicates that there is significant difference between the delayed posttest scores III
experimental and control groups. Hence it can be concluded that the 'tnformatiun
I'rocessing Models of teaching' i s superior to curlventior~al Teac hi113 Lea1-ning
Method in the case of achievement and retention eft'ect
For the purpose of correcting the final scores by consideriny the
differences in ~ntelligence scores, the adjusted sums of scures, mean square variance
and F ratio were calculated The data and results are given in Table 5 59
Table 5.59
Summary of Analysis of Covariance (ANCOVA) of the Delayed Posttest scores uf
pupils o f the Experimental (CAM, AOM & ITM) and Control (CT1.M) Groups
classified by Model categories. Region and Gender with Intelligence as Covariate
Among Means 8348.22 Ih ; 5.20**
Within yroups 9205.36 62 I 14 X2 .. --
Source of Variation
Frorn Table F for df 16/62 1
F at 0.05 level -. - 1.14
F at 0 01 level - - 2.0 1
Sum of Squares F- ratio Degrees of freedom
Mean squares

'The obtained F value (35 20) is sreater than Table value (F - 3 5 20.
p U 01). Hence it can be concluded that after adlusting the ~nitial drffercnces in
Reyion and Gender with intelligence as a covariate. the experimental group taught in
Information Processing Models was found superior to the control g o u p taught in
conventional teachir~g learning method
Table 5.60
Summary of Analysis of Variance of the difference in Achicve~nent scares of
pupils of the Experimental (CAM, AOM b;: ITM) and Control (C'I'LM) Groups
classified by Model categories, Region and Gender with intelligence as Covariate
Source of Variation
intelligence (Covanr-lte)
Between grcx.~ps
Model
Region
Gender -
7-wa!: interactions
Model Region
Model x Gender
Region - Gender
;-way interactions
Model K Region 8 Gender
Within Group
* LSjgt! 1fic~tt11 ({I 0 . O j /C>IV/
SS
330.600
I225 254
1075 850
66 886
78.922
127.169
17.297
98 848
12 634
672.688
672.688
11040.335
df
1
5
3
1
1
7
3
3
1
3
3
621
MS
.3;0.600
245 049
358.617
6 6 5 5 6
78 022
18 I67
766
32 949
11634
224.229
224.229
17 775
F
18 590
1-3 784
20 172
3,762 - - -
4 439
1.022
3 24
I 853
711
12.b33
12 633
Significance .Lj *
---- P
--..- I --
* * 4 - , --
.- - - . . .
---
. - . - - - - -3 - -.
--
--

The achievement difference between the immediate posttest scores and
delayed posttest scores of the total sample was subjected to analysis of variance and
analysis of covariance considering intelligence as a covariate. The ore-wav. twu-wav
and three-way interactions of other variables namely. Model catcgcjries. Ke~ion arlil
Gender were found out
The total sum of squares and mean square variances anlong gl-oups arid
the F ratio were cornputed by considering intelligence as a covariate The ~nfluence
ut'intelligence on tnodel categories is significant
The table value for df 1 I62 1
F at 0 0 5 level - - 1 14
F at O 0 I level - - 2.0 l
The obtained value is significant ( F value = 18 h0, 1, , 0 11 1 ) ~t is
concluded that intelligence exert a significant intluence on achievement atid retent~un
of informatiori
lntelliyence exerts a significant influence among rhc cateyor~es viz
lrlodel group. Region category and Gender category
The significant F ratio indicates the influence of intetliscnce o n
achievement difference in the standard IX Geographv students (F value - 1.3 78. p -
001)
Among the model categories inteilisence exercises a sign~ficant
intluence ( F value = 20.17: p 0.01).
In the achievement difference of the rural and urban pupils 1. r-a~io 1s
3 76. the table value is j.85. I t is not significant at 0.05 level t t is infixred that the

rntelllgence does nut exert a considerable influence on the achievement differer-rce o!.
the niral and urban pupiis In the intelligence level they are found sinlilar
While taking intelligence as a covariate. the gender difference i s
significant (F value = 4.44; pq; 0.05). Intelligence exerts a significant intluence 011
achievement diff'erence between boys and girls
The combined interactions of Model cateyories and Keg~rjn, hlodef
categories and Gender and between Region and Gender. the diKerences are not found
significant consider~ng ~ntelligence as a covariate The inference is that ~ntelligencc
does not play a vital role in the achievement difiierence uf the immediate and delayed
posttest In the case of ~ntelligence all the categories do not show marked difference
Considering ihe three-way interactions ilf Model categvries, Kegion
and Gender amon5 groups and within groups the difference is sign~ficant {l, ialut.
12 6.3. P..- O . O I )
The combined influence of model categories, reyinn and gender
considering intelliger~ce as a covariate affects the achievement difference of the pupils
in Geography
The ad-justed means for the ach~evement diRerencc c ~ f t lw pupils In
geography are calculated by using analysis of covariance with ~ntelligertce as a
covariate. The data and results of analysis are given in Table 5.6 1 .
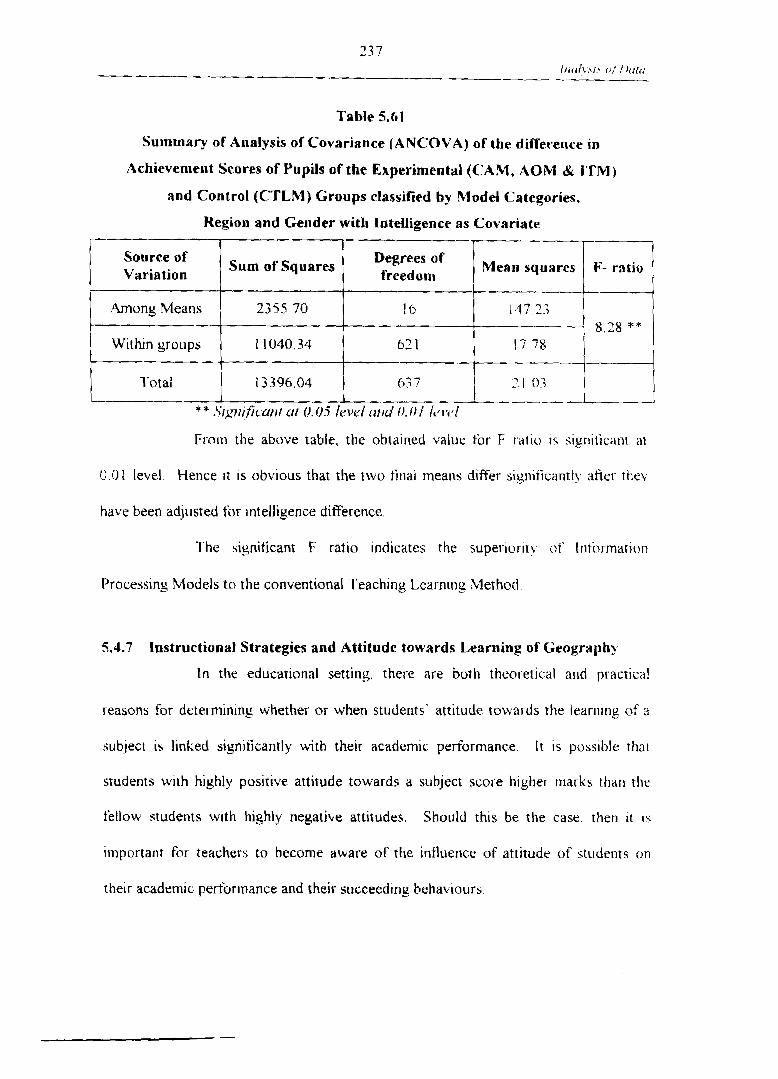
Table 5.61
Surnmaq of Analysis of Covariance (ANCOVG) of the differerlce in
Achievement Scores of Pupils of the Experimental (CAM, AOM & ITM)
and Control (CTLM) Groups classified by Model Categories,
Region and Gender with intelligence as Covariate
Source of Variation
.4mony Means
Within groups
From the above table, the obtained value t o r F r,atio i s sisniticant a1
0 01 level. Hence 11 is obvious that the two filial means differ significantly after the\
have been adjusted for intelligence difference.
The signiticant F ratio indicates the superiority ot' I n t i ~ m a t ~ o n
Processing Models to the ~onventiona1 Teaching Learning Method
I Sum of Squares
Total
5.4.7 Instructional Strategies and Attitude towards Learning of Geography
I n the educational setting, there are both theoretical and practical
2355.70
1 1040.34
reasons for determinins whether or when students' attitude towards the learn~ns of a
Degrees o f freedom
* * .S~~~tjf icur~t ut 0. (15 kevcl L I~ IL I 0.01 i ~ , i ~ ~ * (
13396.04
subfect is linked significantly with their academic performance It is possible that
16
62 1
b.3 7
students with highly positive attitude towards a subject score higher [narks than the
feilow students with highly negative attitudes. Should this be the case, then it I.;
Mean squares
147 23 8.28 **
17 78
important for teachers to become aware of the influence of attitude of students o n
F- ratio
their academic performance and their succeed~ng behaviours

The research findings reviewed so far indicate that there IS significanr
relationship between students' attitudes towards school subject and their scholastic
performance. I n the present study the effectiveness of Information Processing Models
over Conventional teacher centred Method was studied The ~ntluer~cc of' attitude is
also taken into consideration as an independent variable
For this purpose. the investigator prepared an attitude scalc ti-rr learn~ng
Geography and it 1s standardised by the investigator with psychometric techniques
The scores of attitude scale were subjected to statistical analysis
Distribution o f Attitude Scores o f Pupils-Classified by Type of Schools and
Model Categories
Thc mean and standard deviation of the attitude scores of the 638
students belonging to four model categories and 8 schools were yivcn irl 'I-able 5 h l
'The Scores on Attitudes of Students Considered for the Studv when classified
by the School and rnodel categories provide the following summay statistics.

Table 5.62
Mean and Variance for Attitude Scores-
Classified by School and Model Categories
Graphical representation of mean scores of attitude classified by school and
1
7 -
1
4
--
5
h
7
8
Total
h
I irilct..\ ~t'ifhorrt hru~kers
model categories 1s presented in 5.9
CAM
(Exptl. 1)
158 75
(14 19)
168 55
(12 69)
170 65
(24 37)
164 85
( 1 3 72)
169 45
(21 91)
155 47
( 1 8 70)
153 GO
(4096)
180 70
(19.69)
165
(23 56)
159
cn.u nteml
ITM
( ExptI. I l l )
243 5 0
(335 54)
1 5 9 00
(14 5 5 )
169 75
(23 2 3 )
164 45
(21 95)
160 50
( 13 45)
165 90
{ 1 4 21)
l i l 58
( 1 5 31 )
172 60
(14 7 5 )
173 55
( 1 17 20,
1 5 9
AOM
(Exptl. 11)
I54 75
(20 32)
163 40
( I 7 30)
168 80
(23 57)
168 90
(17 -36)
181 3 0
(31 02)
1 5 5 -35
( 17 36)
157 65
( 1 1 3 1 )
169 40
( 1 3 5 7 )
164 82
(19 6 5 )
160
~,lrllte\
C'TL,M
(Control) --I 174 45
( I l i 2 )
158 50
( I h X O )
173 5 5
( 12 87)
164 3
( 1 $ 4 7 )
I h,! c)O
( \ 2 96)
I 59 60
( 12 29)
I 5 i 0 5
( 19 09)
174 25
( 18 06) -
16q 7.3
(10 5 5 )
I00

AOM
ITM -- - I 200
t I I 1 I i i l iV V VI Vlt Vlll
." 1
Figure 5.9
Attitudc. Scorcs-Classificd by School and Model C'ategorics

Comparison of Attitude Scores classified by Schools and Model Categories in the
CAM (exptl. I ) group and CTLM {Control) group
The mean and standard deviation of the attitude scores of 159 pupils in
the CAM (exptl. 1 ) yroup and I60 pupils in the CTLM (control) group were
computed. The Criticaf Ratio was tested for significance The data and results are
presented in Tabte 5.63
Table 5.63
Data and Results of Test of Significance of difference between mean scores of
attitude of pupils itr the CAM (exptl.1) and CTLM (control) group
The obtained C.R value for the experinlentat (CAM) group and control
group (CTLM) i s not significant (C.R - 0.04: p -, 0.01) The inference taken ti-om the - analysts is that the two groups do not differ much in their attitude scores
Comparison of Attitude Scores Classified by Schools and Model Categories in
the AOM (exptl. 11) group and CTLM (Controt) group
The mean and standard deviation of the Attitude scores of 160 pupils
itt the AOM (exptl.11) and 160 pupils in the CTLM (control) groups were cotnputed
The critical ratio and the level of significance are presented in Table 5.h4
Group
CAM (exptl. 1)
T-1-LM (Control group)
N
159
160
Mean
165.31
165.23
S.D ((3)
23.56
16.55
Critical Ratio IC*R)
0.04
Level of siptifjcunue
hut
s~yniticant

Table 5.64
Data and results of Test o f Significance of difference behueen Mean Attitude
scores of Pupils in the AOM (Exptl. I t ) group and CTLM (Control) Croup
From Table S 64, we can infer that the experimental group ( A O M ) and
control group (CTLM) do not differ significantly in t h e ~ r attltude scores (C ' R - 0 20.
p .001)
Comparison of Attitude Scores classified by Schools and the Model Categories in
the Learning Environment Scores in the ITM (expt1,Ill) group and CT1,M
(control) Group
I'he mean and standard deviat~an of the attitude scores of the pup~ls In
the ITM (exptl 111) group and CTLM (control) group were calculated The crit~cal
ratio was subjected to the test of significance The data and results are preserited 111
Group
.40M
(exptl I!)
CTLM (Control y roup 1
N
159
160
Mean
164 82
I65 23
S.D
(a)
19.65
16 55
Critical Ratio (C . R)
0 20
Level c!f
significitncr .-
.Yrlt
i~gtt~fti~ 1tt1
I

Table 5.65
Data rr~d Results of Tests of Significance of Difference between Mean Attitude
Scores of ITM (exptl.ll1) Group and CTLM (Control)Group
The C . R value is significant at 0.01 levei iC' R =. 4 40, p - 0 0 1
The use of ANCTOVA enabled the researcher to ccluale thc pre-
experimental status of the group and removed the difference 111 initial s t a ~ u s ol' thy
Group
CAM (exptl I )
CTLM (control group)
groups. The ptrforniance of the groups can be compared as though their ~nrtial status
N
IS9
160
Mean
17354
165 23
has been equated
Table 5.66
Summary of Analysis of Variance of the lmnlediate Postrest Scores of
Pupils o f the Experimental (CAM, AOM & ITM) and Control (CTI,M)
Groups Classified by Model Categories with Attitude as Covariate
S.D (n)
1720
16 5 5
C:ritical Ratio
( C . R)
4 40
-
Source of variation
Lcvd of --1 signljicrmcc -4
,Attitude (Covariate)
Between groups
Within groups
SS
76 1
1366.679
d f
L.
* .\-i,q-tt/fic~i~t~l ( i f 0.0.5 / ~ ~ i , c l
17693.608
Significance --
M S
1
3
F
633
76 1
455 560
37 952
027
16.298 Y
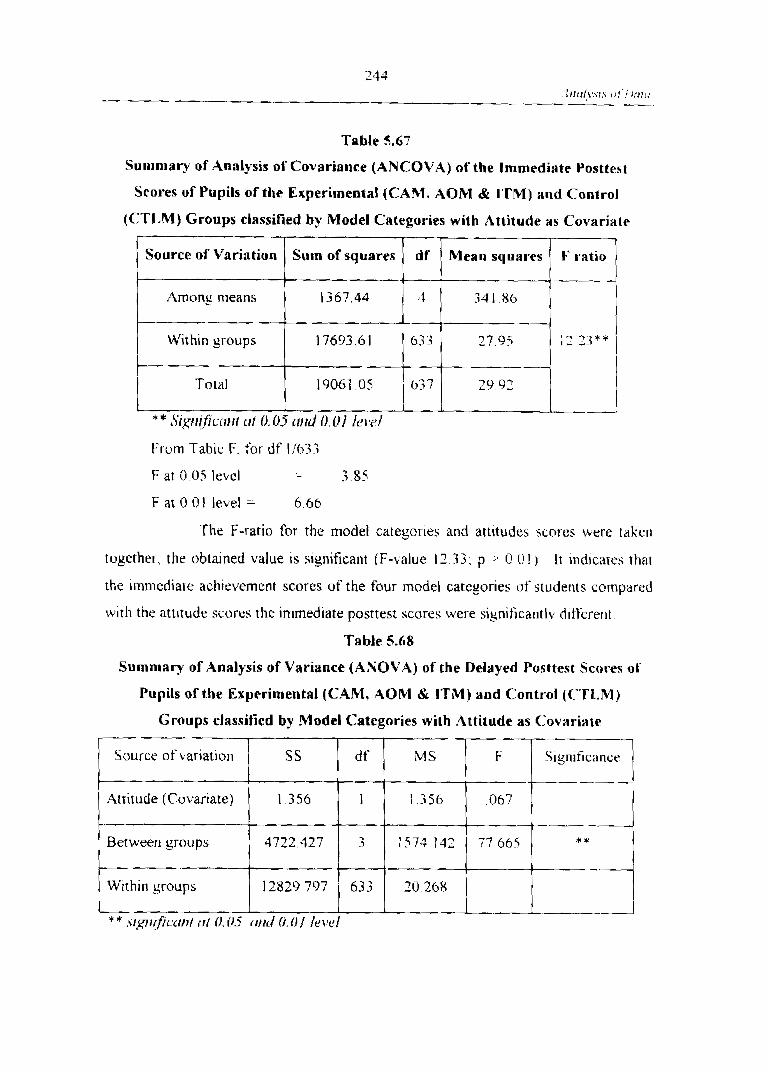
Table 5.67
Summary of Analysis of Covariance (ANCOVA) of the Immediate Posttest
Stores of Pupils of the Experimental (CAM, AOM & ITM) arid Control
F at 0 05 level - - 3 8
(CTLM) Groups classified by Model Categories with Attitude as Covariate
F at 0 0 1 level = 6.66
Source of Variation
Amunr means
Within yroups
Total
The F-ratio for the model categories and attitudes scores were take11
tugether-. the obtained value is significant (F-value 1233, p ;, O ( ! I ) It Indrcates that
* * S ~ ~ I I ~ ~ ~ U L I ! I I [ i f 0. U j I I ! I L ~ 0.01 IL'w/
Frotn Tabit. F. for df 1/63?
Sum of squares
1367.44
17693.61
19061 -05
the immediate achievement scores of the four model categories of students compared
with the attitude scores the immediate posttest scores were significantlv d i fben t
Table 5.68
df
4
b33
h j 7
Sumniav of Analysis of Variance (ANOVA) of the Delayed Posttest Scores of
Pupils of the Experimental (CAM, AOM d ITM) and Control (C"TL,M)
Groups classified by Model Categories with Attitude as <:ovariate
Mean squares t.' ratio
34 1.86
27.95
29.92
Source of varlatlon
.4ttitudr f Covartate)
Between groups
Wrthln groups
SS
1 356
4722 427
12829 797
df.
1
3
633
MS
1 356
1574142
211 268
F
067
77665
S~gn~ficance
-
* *
I

The obtalned F ratios were tested for siynificar~ce R! taking rhc
at t~tude score of the 628 students and their delayed pusttest scores taken ti>sethcr the
obtained value is not significant (F-value - 0 67, p , O 01) But the Fy vaiue IS
significant at O O I levet and indicates that among the rnodel categories at least one of
the goups digers srgniticantly in the delayed posttest scores by taklny attrtude as a
covariate
So to interpret more rigoruusly. the data is subjected r o analvsis of
covariance
Table 5.69
Summary of A~~a lys is of Covariance (ANCOVA) of the Delayed Posttest Scot-rs
of Pupils af the Experimental (C4M, AOM & ITM) and Control (C'T1,M)
Groups classified by Model Categories with Attitude as Covariate
From Table 5 6'4, it is seen that the obtained Fv .u value IS s~gn~ficant ;it
0 01 l e ~ e l Hence it is obvious that the two final rneans differ sign~ticantlv between
the experimental and control groups
Source of Variation
Among means
Within groups
To taI
* * ,Sig~l(ficcmrr cir 0.05 a ~ d 0.01 Irvt!I
Sum of squares
4723 78
12829.80
17553.58
df
4
033
63 7
--
20.27
37 56

Table 5.70
Summary o f Analysis of Variance of the difference in immediate and ddaycd
Posttest Scores of Pupils in the Experimental (CAM, AOM & ITM) and Control
(CTLM) Groups classified by Model Categories with Attitude as Covariate
Source of variation
Attitude (Covar~ate)
Hetween groups
Table 5.71
Within groups
Summary of' Analysis of Covariance (ANCOVA) of the Difference in
SS
OX 5
1 U I 1 691
Immediate and Delayed Posttest Scores of Pupils in the Experimerltal
(CAM, AOM & ITM) and Control (CTLM) Groups classified by
- 12384,261
d f
1
s 1
I-rum Table 5 71, it is seen that the obtained F-ratio 1s siynifrcant at 0 0 I level
633
Model Categories with Attitude as Covariate
M S
OX 5
3.37 ",;O
Source of Variation
Among rneans
Witlun groups
Total
19564
F
004
17237 ----I
** .s/~r/tlticciw <it 0.05 ~l!ld 0. ui fcl~ei
Sum o f squares
1011 78
12384 26
13.7396 04
Significance i ----I
---
df
4
63 3
1137
-- Mean squares F ratio
-. '52 94
F-- 19 56
21 03
--
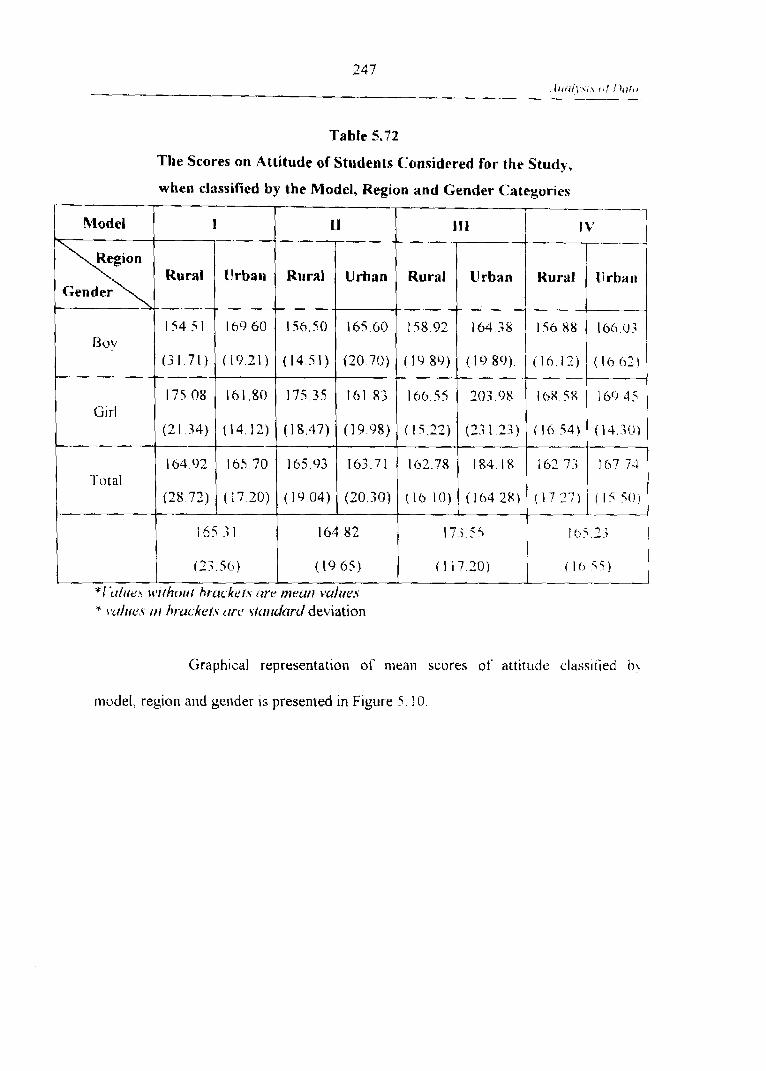
The Scores 011 Attitude of Students Considered for the Study,
when classified by the Model, Region and Gender Categories
I I Model 1 C1
Bov
CIl rl
l'utal
Graphical representation of ~nean scores of attitude classifeci b!
165 : I
(23 5 b )
rl~odei. region and gender is presented in Figure 5 10
---- 11 1
Rural
15451
(31 711
17508
(21 34)
164')2
(2x72)
---- * I L l t ~ . i tsffhr~ttl brt~ckvi\ itrt2 mmt! vu/t{e.$ * Y.YI/IIC>.\ 111 hr~tcken ( t r . ~ ~ st~it~dcird deviation
164 82
( 19 6 5 )
11'
Urban
l h96O
(1921)
I h l 8 0
(14 12)
16570
( i 7 2 0 )
Rural
1 5 6 5 0
( 1 4 5 1 )
17535
(1847)
16593
(1404)
173 .i<
( 1 17 20)
Urban
16560
(2070)
t b l 8 3
(1998)
16371
(2030)
16i 2.i
( I 0 T i )
Rural
15892.
(1989)
I6655
(1522)
16278
(1610)
Urban
16438
(1980)
7 0 3 0 8
( 2 3 1 2 ; )
18418
(1042X)
Rural
- 15688
( l h 12)
1085F:
(Ih54)
1027 ;
7
--- -
lirbaa
166U:
( I ~ J O ~ )
l f > r ) 4 <
(14;0}
16774
( I 5 q O )

I ALL
. . . . .- .- - . .
ORURAL '
; W URBAN - ,
MODEL MODEL MODEL MODEL 2 3 4
BOYS
I MODEL MODEL MODEL MODEL
I 1 2 3 4
,ORURAL ' : URBAN
MODEL MODEL MODEL MODEL 1 2 3 4
Figurc 5.10
Attitude Scurus-Classifid by Model Categories, Kegion and Gender

Table 5.73
The Scores on Attitude of Students Considered for the Study.
when Classified by the Gender and Model Categories
Table 5.74
1 3 0 ~
Girl
Total
The Scores on Attitude of Students Considered for the Stud),
when classified by the Region and Model categories
0 ilitti!.s 111 hi-<tckcf.~ it~dicc~/c . V / L J ~ I L I ~ I - J d ~ \ ~ j ~ ~ i ~ o t ~ )
I
162.15
( 3 7 0 5 )
168.44
(19.18)
165 3 1
( 2 3 5 6 )
I I
164.82
(1965)
161 05
(18 33)
t66.5C)
( 2 0 3 0 )
Rural
Urban
Total
---
111
161.68
( 1 8 2 % )
185 26
(163.90)
173 .55
(172U)
/ I ithre.\ I I I hruckei,~ t~rrd~cate .rkrrrdrrl.rj dc.~~~urtun)
I
I6492
(28 72)
165 70
(17.20)
165.32
(2.7 56)
I \'
-,--I 161 3
{ I O O I )
I[>(> ( ? I
(IS 37)
( l ( - , 5 5 )
I V
--
it1273
(16 27)
l h 7 7 4
( 1 5 5 0 )
16'; 23
(16 55)
l I
1659;
(19 03)
16.3 72
(2030)
164 82
(19 6 5 )
111
16278
( I h IO)
184 18
(16428)
173 55
( I 17 20)

Table 5.75
Summary o f Analysis of Variance (ANOVA) of the Immediate Posttesl Scores of
Pupils of the Exllerimental (CAM, AOM & I'TM) and Control (CTLM) Groups
It i s evident from Table 5.75 that the rnean scores nmolig the suhects
classified by Model categories, Region and Gender with Attitude as C'ovariate
taken together the attitude exerts no significant influence 011 \he irntned~ate
Source of Variation
Attrtude (Covar~ate)
Between groups
Model
ficg~cln
Gender
'-way interact~on~
Model * Kegion
Model Gender
Regon * Gender
.;-way ~nteracttons
Model Region Gender
Wtthln Group
* . Y / ~ / l ~ # / ~ ~ ~ l / t l ( / I 0 0-5 It>\ 'J/
achievement o f the students (F value = 0.20. p ', 0 . 0 5 )
But arnong the model categories. a t t~ tude exerts a sigiliticant influer~cu
SS
76 1
1648.170
on immediate achievement (F value = 12.73; p - - O O I )
df
1
5
M S
76 1
-379634
F
0 2(1
1277;
455571
281473
000
12c)132
47310
2 i 3 262
601.30
160 508
160 508
2 5 807
- -
Sig~iificance
1765; , 10907
000
5008
18;;
-
9 O.<O
2 3 3 0
6 220
6 220
1366714
281473
000
904624
141929
699 786
60 130
481 524
48 1 524
16025 969
:q * 4'
-
-- -
a
*
-3
1
1
7
3
3
1
3
3
62 1

The results of one way interaction of rnudel categor-ies. I-eg~on and
gender are given In Table 5 .75 . One way interaction of rnodel catesaries by taliins
attitude as a cvvariate is significatlt at 0.01 levcl (F value -. 17 65 . p , 0 (11 1 The
influence of region also exerts significant intluence ( F value = 1 O I . p ,- (1 0 1 )
The immediate achievement scores of bovs and girls s h u n nno
difierence Both boys and girls perform in a similar way in their achievement
considering attitude as a covariate
The two-way interaction among niodel categories. region and yender
taken together exerts significant influence on immediate achievement ( F value = 5 10.
p , u,o I )
In the separate two-way interactions between model categories and
region, the F value is not significant IF value = 1.83. p --. 0.05) So i t t m v he
concluded that the rural and urban students of different model catesuries showed no
marked difference in thelr immediate achievement with attitude as a co~ariate
But the boys and girls of different model categories showed marked
difierence in their achievement ( F value = 9 04; p .: 0 0 1 )
When the n~ral boys and girls and urban boys and girls are considered.
their achievement ditt'erence is not significant ( F value = 2 3 3 . p - O 05) Phis leads
to the conclusion that reyion and gender exert no significant influence on Immediate
achievement considering attitude as a covariate.
In the three-way interaction between model categor.les, reglor] and
eender. the diff'erence in immediate achievement is significant ( 1 - value 6 22. p - - 0.01 ). So it can be concluded that model categories, region and gender when

combined together exert significant influence on immediate achievement considering
attitude as a covariate
The adjusted mean squares among the means. within grtlups and F
ratio were calculated by using ANCOVA. The dara and results are 3ii t .n in
Table 5-76
Summary of Analysis of Covariance (ANCOVA) of the Immediate Posttesi
Scores of Pupils of the Experimental (CAM, AOM & ITM) and Control
The significant F ratio indicates that while the mean squares are
Categories, Region and Gender with Attitude as Covariate
adjusted by using ANCOL'A, the experimental and control groups showed marked
Source of Variation
.Among means
Within yroups
Tot a1
ditierence in their ~mmediate achievement. So i t can legit~~t~atuly he concluded that
'Intbrmation Processing Models' exerts significant influence un ~nimediate
* * , S ; g t t ~ f i ~ ~ t ~ t ( I . Oj ut~d {). 0 1 k\v/
Sum of squares
3035 08
16025 97
19061.05
achievement ( F value = 7 3 5, p < 0 0 1 )
df
1 0
62 1
h.3 7
Mean squares
189 (19
25,8U
29.i12
F ratio
7 i f " * *

Table 5.77
Summary of Analysis of Variance of the delayed Posttest Scores of Prrpils of the
Experimental (CAM, AOM & ITM) and Control (CTLM) Groups C:lassified by
The effect of attitude on delayed posttest was studied using one-&a\. .
two-way and three-way ANOVA. The data and results are presented in J'able 5 77
The mean scores of subjects in their delayed achievement shau no
significant difference considering attitude as a covanate ( F value -- 08, p - 0 0 5 )
T h ~ s leads to the conclusion that attitude exerts no significant influence or) delayed
achievement scores.
Model categories, Region and Gender with Attitude as Covariate
Source o f Variation
Attitude (Covariate)
Between groups
Model
Region
Gender
'-way irlteractions
Model = Region
M Gender
Region Gender
3 -way interactions
Model .( Region Gender
Within Group
* S t g l l ~ j l ~ ~ l l f ut 0.05 IL'I'c'I
SS
1.356
5494.002
4723.062
655 618
120.357
544.623
165.033
378,903
014
474.328
474.328
11039271
d f
1
5
-3
1
1
7
3
3
I
3
3
621
Significance
--- +
*
*
*
*
*
1:
* :i
MS
1 356
1098,800
1574.354
655 618
120.357
77 803
5 5 01 1
126..301
0 14
158.109
1 58.1 OY
17777
F
0 76
61812
88.563
36.881
6 771
4 377
3.005
7 105
00 1
8.894
8.894
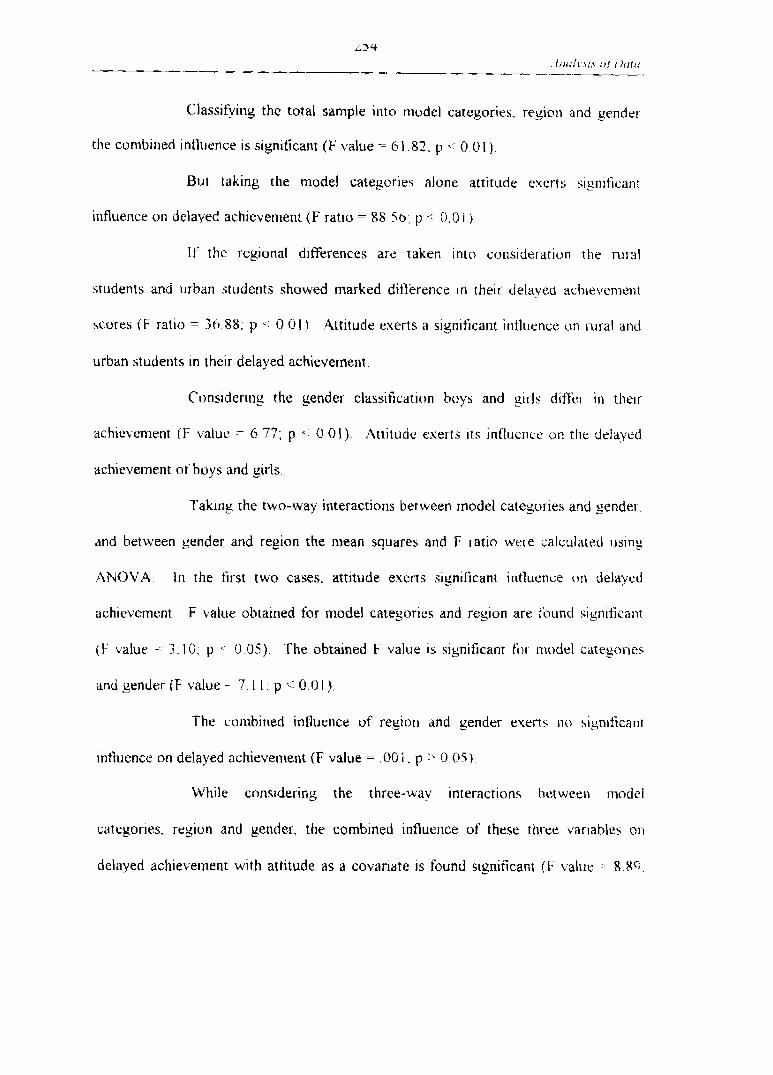
Classifying the total sample into rrlodel categories, reyion and gender-
the c,ombined intluence is signiticant (F value = 61.82. p =: 0.01 )
But taking the model categories alone attitude exerts s~y~,l~lficant
influence on delaved achievement (F ratio = R8 56. p .- 0.0 1 )
I f the regional differences are taken into ct~ns~deration the rural
students and ~ ~ r b a r ~ students showed marked dif'ference In their delaved achievement
scores ( F ratio = 3h 88. p -: 0 01 ) Attitude exerts a significant influence o n lural anri
urban students in their delayed achievement.
Considering the gender classification boys and girls d i f h in their
achievement ( F valuc = b 77; p .: O 01). Attitude exerts i t s int'tuericc o n t he delayed
achievement of buys and girls.
Takins the two-way interactions between model categories and gender.
and between gender and region the mean squares and F ratio were calculated using
ANOVA ln the first two cases, attitude exerts significant intluen~e on delayed
achievement F value obtained fbr model cateyor~es and region are found significant
( F value - - 3.10; p . U.05). The obtained F value is significant for 111ode1 ciitegorics
and gender ( F value : 7.1 1 ; p < 0.01).
The combined influence of region and gender exerts no significant
inthence on delayed achievement (F value = ,001. p :, 0 05)
While considering the three-way interactions ketween nod el
categories. region and gender, the combined influence of these thr-et: variables on
delaved achievement with attitude as a covariate is found significant (I.' valut. :- 8 Xt).

1' . - 0 01 ) I t leads to the conclusion that these three variables exerl significant
influence o n delayed achievement in Geographv
The adjusted means of the achicvetnent ditlirence of the pupils
eeography are calculated bv usiny analysis of covariance with attitude as a covar~ate -,
The data and the results are given in Table 5 . 7 8 .
Table 5.78
Summary of Analysis of Covariance (ANCOVA) of the Delayed Posttest
Scores of Pupils of the ~ x ~ e r i m e n t a l (CAM, AOM and ITM) and
Control (CTLM) Groups classified by Model Categories, Region
The significant F ratio indicates that while the meail sclual-es art.
adjusted by using ANCOVA, the experimental and control ytuups showed ma]-ked
difference in their achievement. So it can legitimately be concluded that ' Infortnatio~~
Processing Models' exerts significant influence on achievenlent ( E value - 22.90
p . 0 0 1 )
and Gender with Attitude as Covariate I
Source o f Variation
.Among ineans
Wtthin groups
Total
* * Srp~{jic~utr at 0. 05 wtJ ( I . 01 /~>11r>l
Mean squares
407 13
- 17 78
37 5 6
Sum of squares
6514 .;I
1 1039 27
17553 58
F ratio
1 2 oo**
! df
16
62 1
63 7

Table 5-79
Summary of Analysis of Variance (ANOVA) of the difference in Achievement Scores
o f Pupils of the Experimental (CAM, AOM & ITM) and Control (C'I'1,M) C~.oups
The total sum of squares, the adjusted mean square variance and F
classified by Model Categories, Region and Gender with Attitude as i7uvariate
ratio were calculated hv using analysis of covariance. The data and results are y v e n
Source of Variation
Attitude (Covarlate)
Between groups
Model
Reyon
Gender
?-way ~nteractlotls
Model Key~on
Model Gender
Rey~on Gender
.;-hay interact~onh
Model % Reg~on i Gender
W ~ t h ~ n Group
* S~g~~rfrcm~i L I I 0.05 I V I W I
SS
08 85
1208558
l o l l 9 2 3
77 93 1
120457
208 328
26 070
123555
58 282
655176
655 176
11323891
MS
08q
241 712
337308
77 931
120457
2i, 761
8 (Y)O
4 1 1 8 q
5 8 1 8 2
218392
2 l S 392
18235
df
I
5
3
1
1
7
3
3
I
3
3
621
F
00 5
I ; 255
I8498
4 274
6606
I 632
377
2 2 5 0
3190
I1977
1 1 977
Significance -- --I
-- + -
*
+
*
* --
-- -
--
-
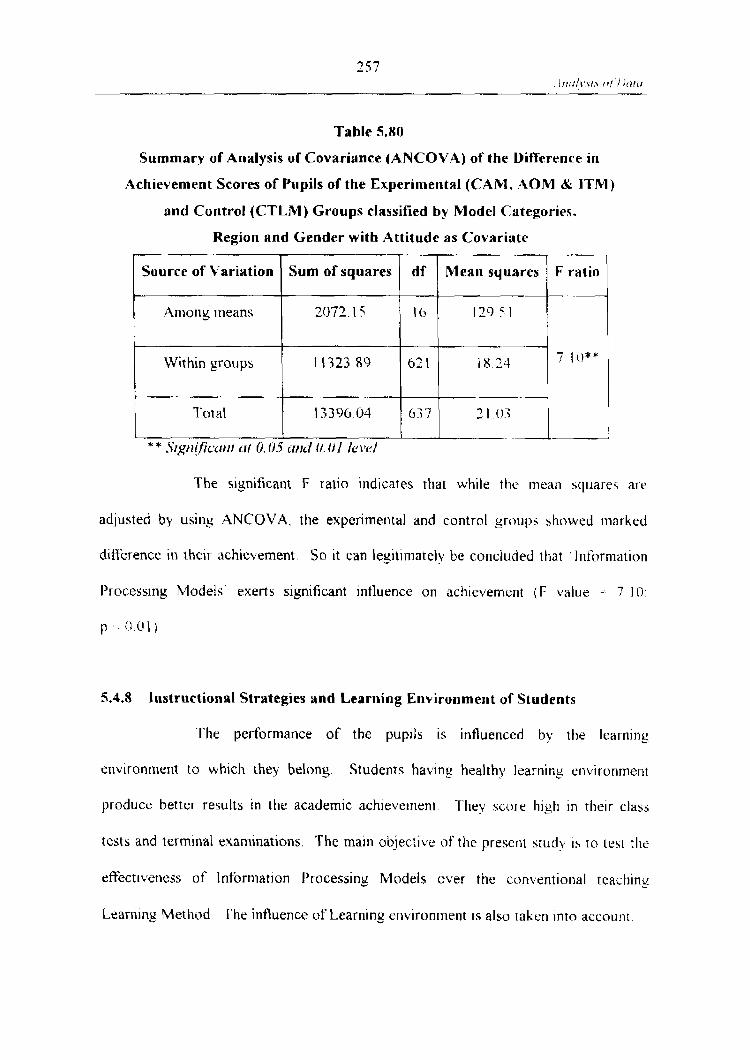
The sisnificant F ratio indicates that while the rneatl squares ai-t.
adjusted by usiny ANCOVA, the experimental and control groups showed inarked
ditterence in their achievement. So it can legitimately be concluded that ' Inf~~r~nation
I'rocessing Modets' exerts significant influence on achievement (I: value - 7 10:
p . O U l )
Table 5.80
Surnrnary of Analysis of Covariance (ANCOVA) of the Diflereoce in
Achievement Scores of Pupils of the Experimental (CAM, AOM & ITM)
snri Coritrot (CTLM) Groups classified by Model Categories.
Region and Gender with Attitude as Uovariate
5.4.8 Instructional Strategies and Learning Environment of Students
The performance of the pupils is iniluenced by the learning
environment to which they belong. Students having healthy learnins environment
produce better results in the academic achievement They scow high in their class
tests and ternlinal examinations. The main objective of the present study 15 to t c s ~ the
efiectivet~ess of I nforniation Processiny M odds over the conventional teac tins
Learning Method The influence of Learning environment i s also taken into accourlt
Source of Variation
.4mong ineans
1
Within groups
t
I'otal I
** S~gtt!'fiucrrr/ rr t O . O j mid O.01 /el)el
Sum of squares
2072.15
11323 89
13396 04
df
16
62 1
6 ; 7 I
Mean
129 51
18 24
2 1 0 3
- .

For this purpose the investigator hersetf prepared and startdardised a
Geography Learning Environment Questionnaire for the students of Standard IX. The
questionnaire was given to the sample population and scores were subjected t u
statistical analysis
The mean and standard deviation of the Learning Environment Scores
of the 638 students belonging to the four groups (CAM, AOM. ITM and V'l'l..M) were
The mean and standard deviation of scores on Geography Learning
Environment which are classified by the school and model categories are given I I I
Table 5 . 8 l
The scores on Learning Envirvnn~ent of studerlts cutis~dered tbr the
study, when class~fied by the school and tnudel categories provide the follclwing
summay statistics
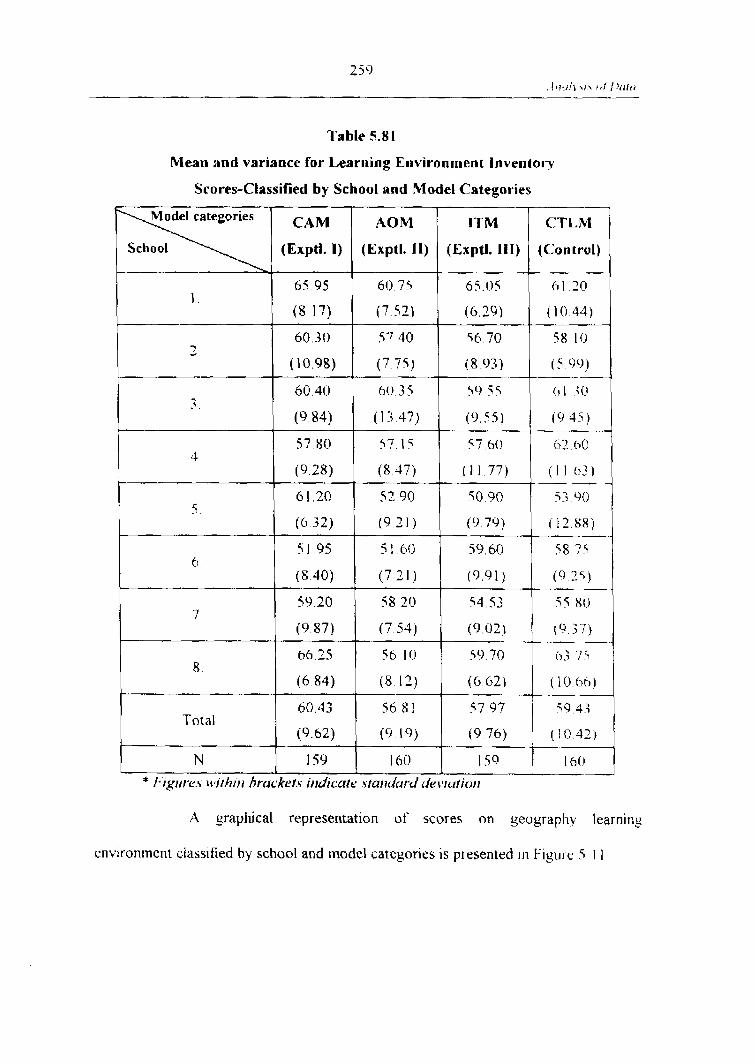
Table 5.8 1
Mean and variance for Learning Environment Inventory
Scores-Classified by School and Model Categories
A graphical representation of' scores on geography iearnins
environment classified by school and model categories is presented in Figure 3 1 1
(Exptl. I)
1
7,
- .r
4
5
6
7
8
Total
N * fi ~gtlre.~ ~ivfh~tj
C'TL,M
{C:or~trol)
h l 20
(10 44)
58 113
( 5 90)
01 ;O
( [ I 35)
62 b0
( 1 1 t73 )
53 L > O
( I 2 88)
58 7q
(9 25) -
5 5 811
( 9 <7)
0.; 7q
( 10 6 0 )
5 9 4 i
(10 42)
l(10
AOM
(Exptl. 11)
60 75
(7 52)
57 40
( 7 75)
60 3 5
(1:; 47)
7 15
(8 47)
52 90
( 9 21)
51 60
(7 21)
58 20
(7 54)
56 10
(8 12)
56 81
(9 1'1)
I hO
stc~t~durd de
65 95
(8 17)
60 30
( I0 98)
60 40
( 9 84)
57 80
(9 28)
61 20
(6 32)
11 95
( 8 40)
59 20
(9 87)
66 25
I6 84)
60 43
(9 62)
159
brucket.s ~ td i ca te
ITM
(Exptl. 111)
65.05
(6 29)
56 70
(8 0 3 ) -
59 5 5
(9 5 5 )
57 60
( I I 77 )
50 90
(9 75))
59 60
(9 91)
54 53
(9 02)
59 70
(6 62)
57 97
(9 76)
159
\ , I c ~ ~ I [ M I

1 --
CAM - ---I
I
L --_I .- - J
- -- --
AOM 7
L- - -- -- --
-- -- - i
ITM 1
I II Ill IV v VI VII Vlll
-- -
CM
J --- I
Lcr rning Enrimnmcnt Scurcs-C:lassificd h! Scltool and Modcl (.atrgorius

Comparison of Learning Environment Scores Classified by Schools and Mudel
categories in the CAM (expt1.l) and CTLM (control) group
The mean and standard deviation of the environment scores of 1 i')
pupils in the CAM (expti.1) group and 160 pupils in the CTLM (control) yroup were
calculated The Critical Ratio (C.R) was found out and tested f'ot significance The
data and results are given in Table 5.82
Table 5.82
Data and Results of Test of Significance of difference
between Mean Environment Scores of Pupils in thr
CAM (exptl.1) group and CTLM (Control) Group
The Critical Ratio (C.R) obtained ti-om the test ot' s~gnificance o f
Group
CAM
(exptl I)
CTLM
(Control group)
difl'erence between rneans in CAM and CTLhl groups was not s~yniticant (C' K
The result of the analysis indicates that the two yroups do not differ
N
159
160
much in the et~vironmental scores
Comparison of Learning Environment Scores Class~tied by Schools
Mean
60.43
59.43
and Model Categories in the AOM (exptl. 11) group and 160 pupils in the C'TLhl
Critical Level of Ratio
t nl (C. R) significance
9 07
0.83 Not significari t
10 42

(control) group were calculated. The Critical Ratio was also cornputed and tested for
signiticance The data and results are given in Table 5 83
Table 5.83
Data and Results of Test o f Sig~~ificance of
Difference between Mean Environment Scores of Pupils
in the AOM (exptl.11) group and CTLM (control ) gl-oup
The Critical Ratio of the control group is significant ( C ' K - : 7 38 , 17
O 05) at 0.05 level. The environment scores of the control group is significant ivhich
indicates that compared to the AOM (exptl 11) g o u p CTL.M (contl-ol) group had a
better environment for learning Geography than the AOM group
Comparison of Learning Scores CIassified hy School and Model Categories ia
the ITM (exptl.lll) and CTLM (control group)
The mean and standard deviation of the environment scores of 1 5 0
pupils in the ITM (exptl.IlI) group and 160 pupils in the CTLM (control) yroup were
computed The C'rltical Ratio (CR) was found nut and tested for- s~gnificar~ct: The
data and results are given in Table 5.84,
Group
AOM
(exptl 11)
CTLM
(Control group)
N
160
160
Mean
5681
5943
S. D Critical Levtl of Ratio
(0) (C:. K Significance
0 I (1
2 38 S~gnlticant at I) 05 level
1042

Table 5.84
Data and Results of 'rest o f Significance of
Difference between Mean Environment Scores of Pupils
in the ITM (exptl.111) group and CTLM (control ) group
The Critical Ratio obtained for the 1TM (exptl. 111) group and CI'I,M
(control) group does not differ significantly
Group
ITM
(exptl. 111)
CTL.M
(Control group)
The results of the analysis reveal that the learning etlvironn~ent of the
ITM and C'TL-M group is identical and does not differ much hefi~rl: the rr.eatrnent of
Level o f
Significarce S. D (a)
9 76
N
159
160
the experi~nerit
Critical Ratio (C . R)
Mean
57.97
59.42
Table 5.85
Summary of Analysis of Variance (ANOVA) o f the Immediate Posttest
l o 4 2
Scores of Pupil of the Experimental (CAM, AOM and 1'1-M) and
] , I . < 1 sisn!7anl
Control (CTLM) Groups Classified by School and Model
Categories with Learning Environment as C'ovariate
Source of variation
Environment (Covariate)
Between groups
With~n groups
* .stgr:!ficl~~r I / / 0.0.j /eve/ I SS
73 853
1445 568
17541 626
d f
I
-1 1
633
MS
73 853
481856
27 712
F
2 b h q
17.3888
Significance
*
- .-

In order to compare the effect of Information Processing Models and
of the Conventional teaching Learning Method in the achievement of Geography by
{along Geographv Learning Env~ronment of students as a covar-iate the Analysts of
I'ovariance (ANCOVA) was used to find out whether any significant relat~on existed
between the achievement of students in the experimental and control groups, In the
pretest, immediate posttest, delayed posttest, achievement difference hetween the
~rnniediate and delayed posttest scores and the (<eogaphy Learning Env~mnrnent
Before proceeding to ANCOVA. the scores were sublected to
.4NO\'A. The totals sums of square mean square variance and F ratios for. the
immediate posttest scores of pupils of the experimental and control groups were
computed The data and the results are presented in Table 5 85
FI-om table F. for df 113
F at 0.05 level - - I0 13
F at 0 O I level - - 34. I ?
I t is seen from Table 5 . 84 that the mean scores on Environment of
students considered for the study, when classified by the school anti model categories
show only a little difference. The difference is not considerable a111011g bch001s
The .4NOV.4 results reported in Table 5 8 establish this further Tht.
difference in mean score among various model categories is significant at 0 0 5 level
( F value = 17.39) This Iead to the conclusion that the means of ir~itnediate posttest
scores of the experimental and control groups diiter significantly amung the four
model categories Therefore it may be concluded that the learning env~t-onnlent exerts
a sisnificant tniluence on immediate posttest scores Since the d~tference 111 mean

scores hetween the schools is not significant ( F value = 2.67, p . 0 01) This leads to
the conclusion that there IS no significant difference in the performa~~ce of pupils who
belor~g to var~ous schools.
The F values were tested 01- s~gnificance Sinw the Fy value 1s
signiticant, the mean of the immediate posttest scores must he adjusted fbr the
diff'erence in Learning environment scores. then only one can say whether model
croups differ very much in the immediate posttest scores in achievement. So further k
analysis is necessar), to find out which means diser signiticantly from the others
The total sum of squares, adjusted mean square banance ftjr the
~~nmediate posttest scores and F ratio were computed They are presented in 'I'nble
5 8 h dong with the result of Analysis of Covariance
Table 5.86
Summary of Analysis o f Covariance (ANCYOVA) of the Immediate Posttest
Scores of Pupils of the Experimental (CAM, AOM & ITM) and Control (CTLM)
groups Classified by Model Categories with Learning Environment as Covariate
From I'able F , for df 4/633
F at O 0 5 level - - 2.39
F at 0.0 I level - 3.35
Source of Variation
Anioilg means
Within groups
TotaI
Mean squares
.;79 86
29 92
F ratio
1; 71**
Sum of squares
1519.42
17541.63
1906 1.05
df
4
63 3
63 7

Since the F ratio ( 13.7 1 ) i s greater than the table ~ a l u e I 3 3 5 ) at U O I
level. it is significant ( F ratio - 13.7 I ; p .: 0 0 1 ) 'The significant F ratio for- the
immediate posttest of the pupil in the experimental (CAM. AOM a& IThl) and that of.
the control (CTLM) groups differ significantly after thev have been adlusted fix the
diflerences i f any, in the Geography Learning Environment score If F raio i s not
significant, there is no justification for hr ther tesring as none of'the mean differences
will be s~gnificant
Table 5.87
Summary o f Analysis of Variance o f the Delayed Posttest Scores of Pupils of the
Experimental (CAM, AOM & LTM) and Control (CTLM) Groups Classified bv
Model Categories with Learning Environment as Covariate
Source of variation
* . S ~ g ~ ~ f t c ~ t t t ~ cr! 0. Oj /eve1
The .4NOV,4 results reported in Table 5.87 show that the mean scores
for subjects classified by model categories and Learning environment have exerted ;i
significant influence on delayed posttest scores
From Table I' for d f 1/3
F ar O 05 level - -. 10.1-3
F at O 01 level - - , 34.12
Environment (Covariate)
Bet ween groups
Within groups
SS
* * . v ~ g t ~ i f i c ~ i ~ ~ t 0. (15 (tud 0.0 1 /e w/
101.752
4915.387
12536.441
d f
1
3
6 3 3
M S F ( ~ i g n i k q
101.752
lb38462
19.805
5 138
82731
.-- *
x *
--2

The obtained value of F ratio is siynificant at O 0 1 levcl (F' valuc
87.73. p - 0.01)
This indicates that the four groups differ significantly in the delayed
posttest scores. This leads to the conclusion that Learning Environment exerts a
signiticant influence upon the delayed posttesr scores. but it does not tell us which
means differ 'The inference is that at least one yroup differ In the mean scores by
taking learning environment as a covariate.
The total sums of squares, adjusted mean square variance for delayed
posttest scores and F ratio were calculated. They are presented in Table 5 along with
the result of Covariance.
Table 5.88
Summary o f Analysis o f Covariance (ANCOVA) of the Delayed Posttest Scores
of Pupils of the Experimental (CAM, AOM & ITM) and Control (CTLM)
From table F, for df 4/63; interpolated value of
groups Classified by Model Categories with Learning Environment as Cyovariate
F at 0 (35 level - - 2.39
Source of Variation
Among means h.
Within groups
Total
F at O 0 1 level - - 3 35
* * . S / ~ I ? f l ~ ~ l t t l i l l (1.05 ~ltld 0.0 1 te\Y/
Sum of squares
5017.14
12536.44
17553.58
df
3
63;
6.3 7
Mean squares
1254.20
19.81
27 56
F ratio --
O . 3 . ; 3 * *

Since the F value i s greater than the table value at 0 0 1 level. 11 i s
significant at 0.01 level ( F = 63 3 3 ; p < 0.01)
The significant F ratio for the adjusted posttest scores of' t h e
experimental (CAM. AOM and ITM) and control (CTLM) group difl'cr significantly
af'ter they have been adjusted for the differences in the learning environment scores
Table 5.89
Summary of Analysis of Variance (ANOVA) of the Difference in Immediate and
Delayed Posttest Scores o f f upils in the experimental (CAM. AOM & ITM)
and Control (CTLM) Groups classified by Model categories with
ANOVA for difference in Immediate and Delayed Posttest Scores-Classified by
Learning Environment as Covariate
Model Categories with Learning Environment as Covariate
Source of variation
Environment (Covariate)
Between groups
Within groups
The scores of 638 students wet-e divided into bur categories and
administered immediate and delayed posttests. The differences in their achieve~nent
* * S~~~llftc~rntr at (1 0 j Ir vrl
SS
2.230
1032580
12361.228
scores in irnnlediate and delayed posttests were subjected to Analysis of C'oiariance
tu find out whether there existed any significarii difkrence between the students
df
1
-7
633
taught in four different methods by taking learning environment as covariate
MS
2 230
344193
19528
F
114
1 7 h 2 6
--- -
I Significance
--
*

Before proceeding to ANCOVA. the scores were sub,jected to
ANOVA. The total sum of squares, mean square variances and 1; ratio were
computed for the experimental (CAM, AOM, 1TM) and control (CI'1.M) groups
Table 5 . . . shows the data and result of analysis of variance
From Table F, for df I/3
F at 0 05 level - - 10.13
F at 0.01 level - - 34.12
The ANOV.4 results reported in Table 5-89 shows significant
difference in mean scores among the four model categories (F value = 17.63. pd:
0 05) So it may be concluded that there is a significant eft'ect of Learning
Environment on Achievement scores.
Since the F value i s siynificant, the means scores of difkrences in
achievement must be adjusted for the Learning Environment scores and only then can
one say whether the yroups differ significantly. So further analysis is necessary
The total sum of squares, adjusted mean square varlance and F ratio
were computed They are presented in Table 5 . 90 along with the result of Analysis
of Covariance.
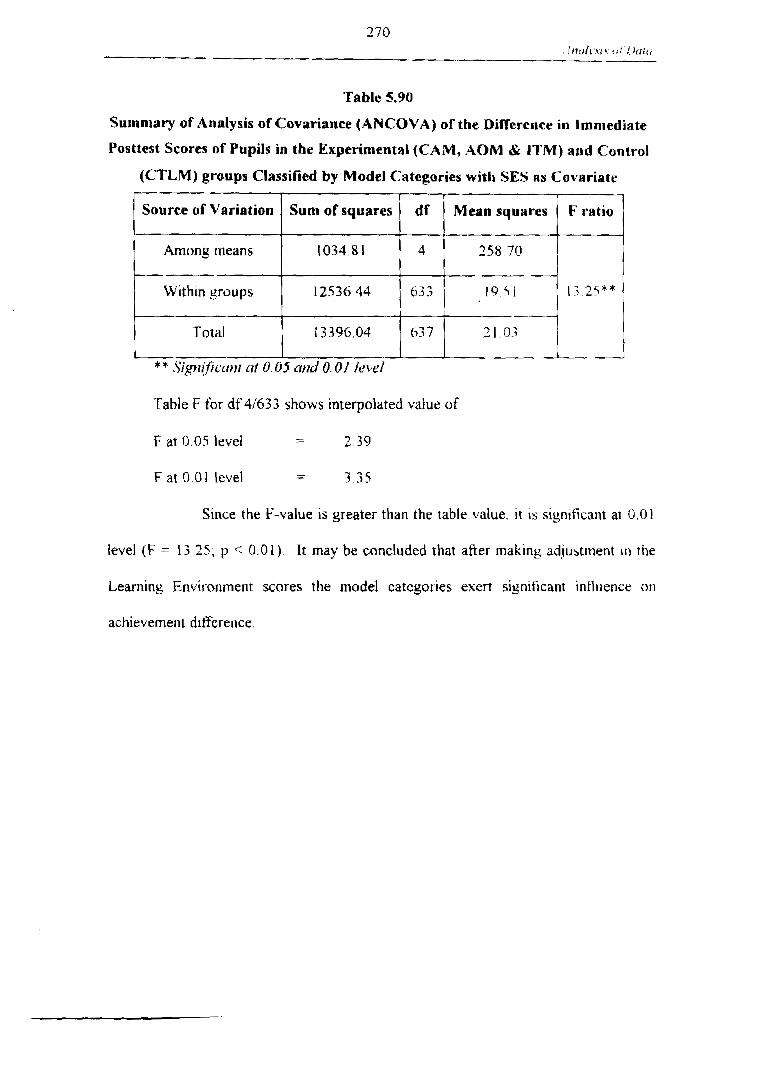
Table 5.90
Summary of Analysis of Covariance (ANCOVA) of the Difference in Immediate
Posttest Scores of Pupils in the Experimental (CAM, 40M & ITM) arid Control
Table F tbr df 4/633 shows interpolated value of
(CTLM) groups Classified by Model Categories with SES as Covltriate
F at 0.05 level - - 2.39
Source of Variation
Among tneans
Within yroups
Total
F at 0 0 1 level - - 3 35
Since the F-value is greater than the table value. i t is signrficant at 0.0 1
* * Sip~j$ficcnlr ol 0.03 mlcj 0. OI Ievrl
Sum of squares
1034.81
12536 44
1 3396.04
level (F = 13 25; p < 0.01 1. It may be concluded that after making adjustment in the
Learning Environment scores the model categories exert significant influence on
df
4
633
63 7
achievement difference.
T
Mean squares
258 70
19 51
-- 2 1 0.;
F ratio
I i 25**
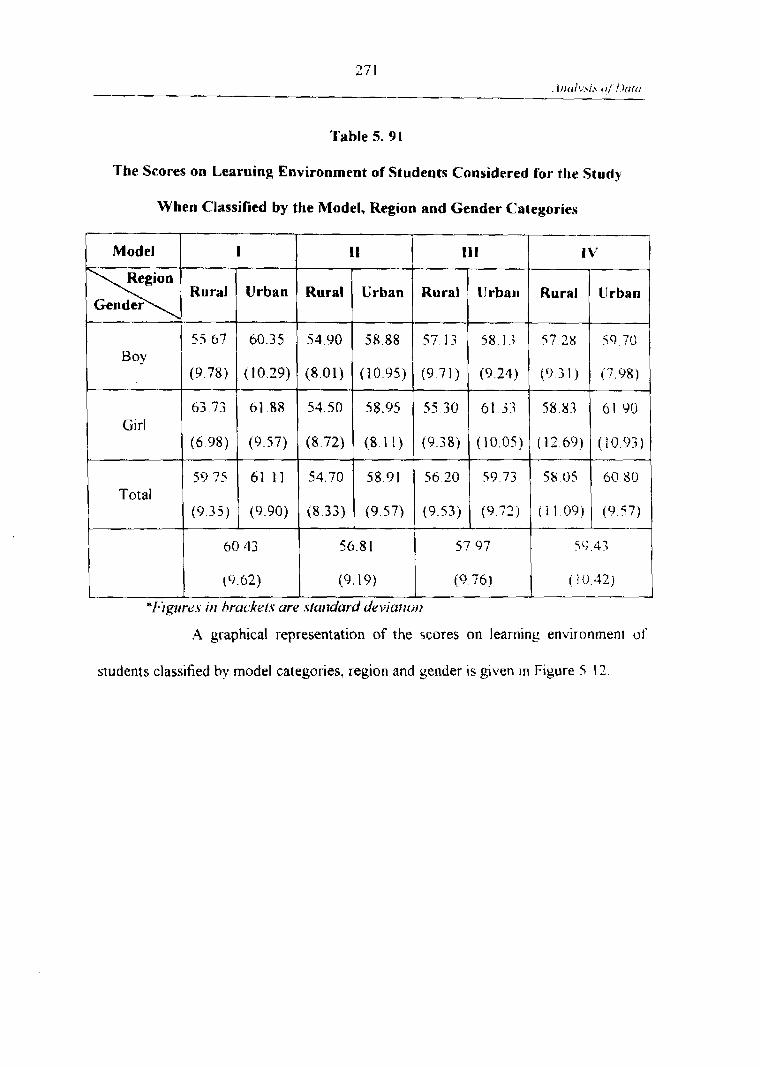
Table 5. 91
The Scores on Learning Environment of Students Considered for the Study
When Classified by the Model, Region and Gender Categories
*J'iffrtrt..s / ) I brackets ure .r.fandard devil t i i o11
A graphical representation of the scores on learning environment of
Rural Urban Rural Urban Rural Urban Rural Urban
students classified by model categories, region and gender is given In Figure 5 12
Boy
Girl
Total ( 9 3 5 ) (9.90) (8.33) (9.57) (9.53) (9 .72) (1109) ( 4 5 7 )
60.43 56.8 1 57 97 5'1 43
55-67
(9.78)
63,73
(6 98)
59 75
60.35
(10.29)
61.88
(9.57)
61 l l
54.90
(8.01)
54.50
(8.72)
54.70
58.88
(10.95)
58.95
(8.11)
58.91
57 13
(9 71)
55.30
(9.38)
56.20
58.13
(9.24)
6 . 3
(10.05)
59.73
57 28
( 9 3 I )
58.83
(12.69)
58 05
59 70
(7.98)
61 90
(10 93)
60 80

r ---- - - -
ALL
I : RURAL
I IOURBAN '
I
MODEL MODEL MODEL MODEL 1 2 3 4
i -.
t
BOYS !
MODEL MODEL MODEL MODEL 1 2 3 4
r - - . -. . . -- - ,
I GIRLS r
I
MODEL MODEL MODEL MODEL 1 2 3 4
Figure 5.12
Learning Environment Scores-C:lassitied by Model
C'ategorics, Region and (iender

Table 5.92
The Scores an Learning Environment of Students Coasidered for t h t
Study. when C:lassified by the Region and Model C:ategories
The Scores on Learning Environment of Students Considered for the Study,
when Classified by the Gender and Model Categories
1 6033 5681 1 5 7 9 7 <(I 43 Total I 19b11 1 (9 9 ) I ( 0 7b) 1 i I 0 4 2 , 1
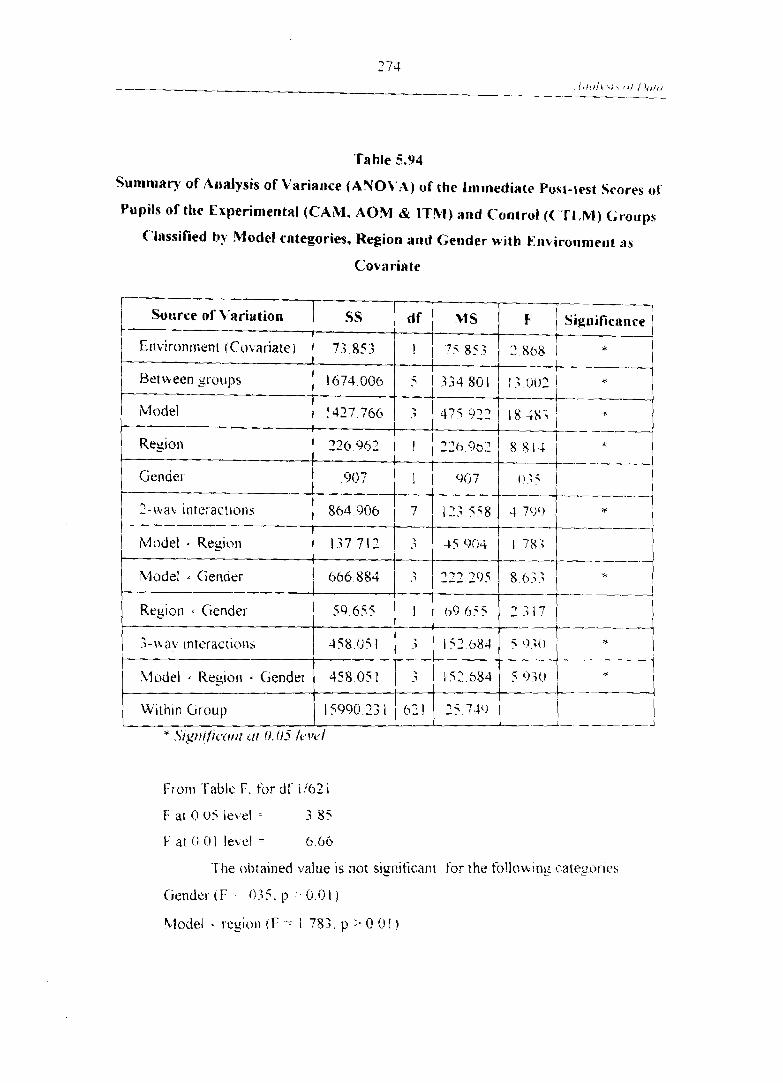
2 71 - --- l l ! f > l \ >;\ (dl / ~ , / I , ,
- - - _ -- -
Table 5.94
Summary of ,4arlysis o f Variilrlce (ANOVA) of the Imnlediate Posl-test Scores of.
Pupils of the E~prrinie~ital (CAM. AOM & ITM) and Control (( 'T1.M) G r ~ u p s
(--'lassified by Model categories, Regiom ;rod Gender with E~lviro~lrnerlt 21s
The ohta~ned value 1s not signiticant for the follo~king categor~eh
(~endcI' (F- ().;3. p . o ( j I )
i " ' Y Z % i r a r i a t i o n
' - [%a ~nter-actions -.- - k
Model - Regirw
Model (iender
Reyiorl - Gender
; -nay interactions
L2..lodel Keyiori . Gender
Within Group
* ~ ; ~ ~ ) ~ / / c Y I I u LU 0.03 /LVLJ/
-I--
F 1 Siguifirn~lrc 1 I I -4
2 8 6 8 1
i;oo21 I A - -----f I
l $ 4 X i , -i.
-7-- --- I
8 81.4 1 1
I .+
-- ---I
(I.:? I I -- - I
4 700 7
MS
7 5 8 %
3-34801
4 7 i 0 2 2
716 361
SS I d f
7; 853
1674006
1427706
226.962
137 712
666.884
59 655
-158.01
458 0 1
15990 2; 1
1
5
.:
I
907
863 906 --
3
.
1
; .
.
b 2 1
I \ c107
7 -i w I
4.5 I ? 1 783 I
12.; i F g
222 2'f i
( 5
152 684
157.684
25 7-40
8 63.; I I 7---- ----
-1 7 , 3 1 7 1 1 - -7- -- * - --
5 k?.;O 4
I 5 0;o
i ! -2- ------_I

Regon - gender ( F -- 3 3 17. p -, 0 0 1 )
The adjusted mean squares among the means. w~tl'tin grnul, and k I a t lo
were calculated b\ using .AUCOV:I The data and I-esults are y ~ e n rn Table 0;
Table 5.95
Summary of Analysis of Covariarlce ( ANC'OVA) of the Immeriiate
Posttest Scores of Pupils of the Experimental (CAM. AOM # I T W )
and C'oatrol (CTLM) Groups Classified by Model C'ategories.
'The siy~lificant F ratio indicates that while thu mean 3qilar.es art.
Region and Gender with Environment as Cuvariate
adjusted by using 4NCOVA. the experi~nental and control Froups showed mashed
source o f k ' a r i a t io~
means .A~non,
Within yl-oups
Tnta t
-
diff'erence in their inlnlediate achievement So it car1 be legitimatelv concluded that
Infurmarion Processins Models exens significarlt intluerict. o r 1 ~mmudiatt.
*' , ~ / ~ ! I I # I C L I ~ I I 0. O j L I ~ I ~ 0, 0 1 /LJ \ I > /
A
s u m q Y I s ~ ~ ratio
3070.82
15990 23
19061 05
I (3 1 I 0 3 -----
h l l
63 7
2 5 75
- '0 cj1_

'I'able 5.96
Sumrna~r: of .Andpis of Valiance (ANOVA) of the Delayed Posttest Scores of Pupils
of the Expel-imental (C'AM, AOM & ITM) and Control (C'T1.M) Groups Classified
by Model C:atego~-ies, Region and Gender with Envil-onment as <'ova~*iate
Keglon Gender 00 1 1 00 I
.;-ha!, interactiur~s 423.461 i I l l 7 980
1 Model Keyion Gender 423 462 :i I 4 1 1 5 4 7 v X c ) ;
Withi11 Ciroup 10972.879 621 17670
* L5'ig/tl/t~.(l!~f ( [ I 0.0-5 /L>\ILJ/
I- Source of \'ariati011
Eii\.ironment (('ovariate) -
Hetiwen yroup:,
Model
1 Kegiorl I 1 Gender
2-n-a\ ir~teractiur~s
Fr-0111 the above I'able. it is ebidenr that except tijr region and ser~der
all other \,ariablcs are si~nificant. The F ratio regtun gender I S tivt .;ignilicanr
SS
l O I 7.52
5546578
4849108
4 5 . j 18
03 550
8 . 9 0
I i -- Mudel a Region
Sigaifirance
.< I 0 9 0 2 7 8 1 , - ..
.i , 11163h9 91-177
I 5-45 .: I 8 - 7 0 8 0 2
1 u j 5 5 0 5 2 0 4 ! - - -- 7
155995
7 7 0 7
2lodel Cie~lder -353 166
-- -. - --1 3 1 17 7 2 2 6 hh2 i
-1 . I iI3Crh
-- -. -, .
2 0 1 3

The ad,justed mean squares among the nlearls. bi~hin yroul, a ~ ~ c l 1: t;tt~n
\+ere calculated hv using ANNOVA The data and I-csults art. y ~ c r l in -1'ahli. ~7
Table 5.97
Summary of .Analysis of Covariance (ANCOC'A) of the Delayed Pusttest
Scores o f Pupils o f the Experimental ('.AM, AOM d4 ITM) and
C'otltrol (C'TLM) Groups Classified by Model C';ttegories.
Region a ~ l d Gender with E I ~ iro~~nlent as C'ol ariatv - -
I 1 1 Source o f Variation I Sun, o f squares I d l I Venn squarrs C ratio 1
10972 84 i Within groups
4mong means
The significant F ratio indicates that uhile the Illcan srlilare.; arc
adjusted b?, usins 4hCOL'A. the experitnental and control groups shoucd niarlied
dittieret~cc in tbeir delaved achievement So 11 can be legiti~~lateli concluded thar
Int'ormar~on Processing Alodels exerts si~nificanr ~nfluence 011 delatid ;ii.hieicnlent
(l: i,alue 21 28. p 0 01)
- - - bS80 74
I -- I 0 41 l 30

Table 5.98
Summary of .4nalysis o f Variance (ANOVA) of the Difference i l l Achievemet~t
Scores of Pk~pils of the Experimental (C.431, AOM & ITM) and
C'ontrol (CTLM) Groups Classified by Model Categories.
Region and Gender with Enviru~inlei~t as Covariate
;- i \aj ~nteract~ons 650 297 216 766 1 I SL)2 ! 1 ], J = Reyon Gender 650.297 3 16 706 1 I 832 , .-
U'ithm Group 11319925 421 18730 i -
- + .Y~g~r~f !ct i t t~ l f ( 0.0j Iel~t31
Fin111 Table F. for df 1 6 2 I
Source of \:ariation
F at 0 Of; lecel - - 3 8 5
SS df'
The obtained value is not significant tor' the follo\\ing categtmes
En\ i~-otlnlerit (C'uvariate) --
I Ber~been ~ruul?s
J
Region
Gender
11 ode I - gender (F - 2 . 3 2 3 , p * - 0 01)
h.1S A -
F
2.230
1711110
I01 7 288
68 671
112876
17' - - -1 0
342713
.330 OQb
68671 --
I1187h
.- - --
Significance
I
3
3
1
1
7 1 1 -- ."
\;?XK
18.602
3 7 h 7
61(!1
-4
. -.
- .. -. - - : 7 - -. Y -1
--p --Pi

[-he ad j i~s ted meat1 squares anlong the means. M ~t IIIII ~ i ~ o u p arid 1' I at i t )
\rt.~-c. calculated hy us ing 4LC'OVA The data anci result> arc gr\ en 111 1 nhlc i l ' ( J
Sumalaq of h~lalysis o f Covariance (,4NCO\-A) of the 1)ifferetlce io
.4chievemeat Scores of Pupils of the Experinierltal C'AM. .\O!bI iY: ITM)
and Control (CTLM 1 Groups CIlassified b?- Nlodel C'ategories.
T i le s~gt i i f icant F ratto ~ndlcates that irhilc tlie tilean hclual.c.3 arc
Regiorl and Gender with Et~vironn~er~t as Covariate
a(!iiisted b\ usiny .+ZNTO\,'.4. the experi!ilei~tal and con1 red yroups hhoii eci 11iarked
di t tk~-enze i n t tleii. a c h w e~nen t So ~t can t ~ e l e g ~ t 1111a1el~ c o ~ ~ c l u c l c d t har I r~fi>r lnatlon
?
Source of Variation
-
Amon? mean3
Pt occss~ t lg Models exerts slgniticant i n t l i~e i i cu r j i l a c h ~ t v e ~ i ~ e n t ( I \ ;~ luc 7 -! 1 -.
Sun1 o f squares ,
--- 2076.1 I
5.4.0 .\cademic .4chievement and Socio-Ecotloo~ic Status
- 1 - h ~ students 111 a ~iormally distributed class be long l r ) d ~ t f i.er11 \rlcic\-
ectmconlic statila levels Generally. the maioriti ht ~ident s helull9 to I tie a \ t.r;lgt. 01
beion a\;erage socio-economic status Students in rhe high ~ o c i o - ~ . c t ) n o t l l ~ ~ stat115
-. .-A - ! F ~.atio
- - -1
wit t1i11 ~ i - o i i p s
I - -,.- - -l-r>ral
--.
(if
t 0: 1
I 21 O <
-- . .-...A -
%lea 11 SttuiIres
* * .St ,yt t / f j i ' i r t t / rrl O. 03 r l t l d 0.01 / c ~ l . ( ~ /
.--+--
1 h 1 2 ~ 1 ?h

usualb gel adequate home environment and necessary learning ~naler~als l-fence the
art. fourld to score hiyb in achievement tests
1'0 lest the efTectiveness nf 1nf~~r.marion Processing Models owl thc
rraditio~~al teacher centred method. the effect ut' socio-rconomlc status nn the pr-ctest
and posttests ot'tht. pupils ill their achievement i s also t o be consider.ed
FOI- this. the Socio-Economic Status Scale developed and standardised
h!, .A %air (updated in 1998) was administered to the total sample helon~~r ls r t ) I hc
four model ca~egories
The scores on SES of students cor-isidel-ed fim the stud\,. ishen
classified by the school and rnodei categories provide the ti)llouincr surnl-nar\
statist ics

Table 5* 100
Mean and Variance for SES Scores-Classified b?. School and Model {'ategories
1. I ~ I I ~ V 5 \ I ,~r/?ow h~+( ~ e k ~ ~ 1 I ~ I L / I L J L ~ ~ c t t ~ ~ t t t \ I I /W \
1, /g{t/.rJ r \ I ~ I / ~ I I I hrctc,krr$ ~ ~ t ~ l r c ~ r l e 1 I C I I ~ ~ / ~ I I . L / ~ / L ' ~ ' / L I I I I ) I I
4 y.aph~cal representation ot' rlle 111ean scores of Sf-.S classified b!
I 1
-
7
I 'L
I- i
k-
I otal
L
school and model cate~ories is presented in Figure 5 I3
CAM
(Exptl, I )
54 75
( 13 00)
4-3 25
(9 500
5 1 10
(13 00
57 50
(13 52)
47 50
( I I 30)
51 25
AOM 7- 1
IThl I (.I.L,51
(9 -58)
5 1 25
(9 5 5 )
59 50
( 1 5 12)
5 1 24
(12 95)
1.59
(Exptl. I I ) (Exptl. i
5 I bL1 4h 2 5 1 I 7 1
44 I t ,
( I 4 0 7 ) ( 7 711)
; I 7 5 47 2 5
( 6 4 I14 )
36 7 5
( 4 (14)
46 00
(16c) I )
FJ 75
( t l 5 8 )
l t30
4c) 21
( I I 04)
58 00
( 111 5 6 )
58 75
( I i 38)
61 25 F 8 7;.
1 1 1 5 3 )
5 0 7<
(1495 )
47 6 i
,,,,I I ( 1 1 7 4 1 i 159 L i O U _ 1
---
11020) 1 -
( 7 121 I ( I 4 0 S ) 1 40 so

AOM
t - ;m:t]-o; 1. -.- ...,-, " ' -'I '- --- -- ,-
I l i 111 IV v VI VII Vlll
ITM
-7-
L 1V V VI VII Vtll
Figure 5.13
SES Scores-Classified by School and Model Categories

Comparison o f SES Scores Classified b?. Schools atld Model C'ateguries in the
C:AVl (exptl. I ) Group and CTLM (control) Group
The nlean and standard dev~ation of the SES scor.e> of t 50 ptlpils III tht,
('.AM (ekptl I) and IhO pupils In the CTLXI .~coritrol s ruupj \%ere calculated T l ~ t .
C'r~tical Ratlo found our and tested for slgnificarlce The data arid r e~u l t s ot' test3
of hiyniticance uf ditference between means are yi\ en III 1 able 5 I 0 I
Table 5.101
Data and Results of Test of Significance of Difference between klenn SEh
Scores of Pupils io the CAM (exptl. 1) group and C'T1,M (control) Group
1-he cntical ratio obtained 1s siynlticant at 0 0 5 I e i c l So i t i a n lit.
cc-hncluded that there is significant difl-eretlce betnee11 ('?\I t n p 1 1 1 1 and I I'Lhl
{ cvntr ol ) yroup 111 te! ms of' SES scores
C'ompnrison of SES Scores Classified by Schools and Model C'ateguries in the
hOM (exptl. 11) Group and CTLM (Control) Group
'fhc itlean and standard dellation of the SEA scorch oi' tile ~ 4 0 4 1
(esprl 11 ) SI-oup and CTLM (control) ~ r o u p ~~c1.t. calculated -1'hc siynificance of'
ditference b e t w e n the means is given in Table 5 I 0 2
C; rou p i N Mean
51 24
47 88
( ' A M
(exptl 1 )
CTI .M
(C'ontrol group)
s. n C'ritical Ratio
1 2 0 5
2 4.;
159
160
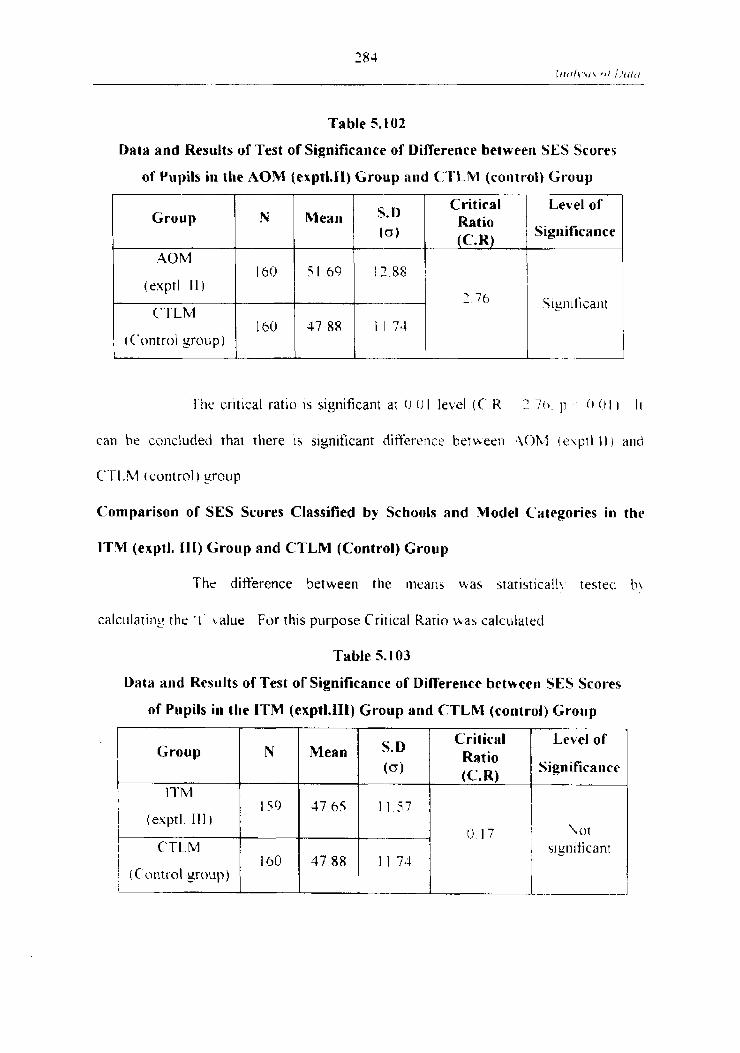
Table 5. I02
Data and Results of Test of Significance of Difference between SES Scores
of Pupils in the AOM (exptl.11) Group and C:'I'LM {co~ltrol) Group
l'hc cntlcal ratio i s significant ar 0 0 I 1ect.l ( C ' K 3 70 p 0 I ) I (
Group
.4OM
(euptl 1 1 )
C'TLM
, (C'ontrol yroup)
can be concluded that there is significant dif'ference betheen ,'iOhl cexptl \ I ) and
Level of N Mearl
Sig~lificance
- -
C"l-1. hl (control) yroup
Comparison o f SES Scores Classified by Schools and Model Categories io the
ITM (exptl. i l I ) Group and CXLM (Control) Group
The difference between the ~neans h a s .itar~sticall\ testeci b i
ca lcu la t i~~y the * t ' I alue For this purpose Critical Ratio ih,as calculated
Table 5.103
Data arid Kesults of Test of Significance o f Difference between SES Scores
of Pupils in the ITM (exptl.1Il) Group and CTLM (cootro!) Group
1 Group N
j i (C‘ontrol ~ r u u p ) I I b o
Critical 1 Level o f

The critical ratio obtained i s not si~niticant at O 0 l Ic\ cl ( ( ' R - o 17. 1:
[ I O l ) Su i t c;i11 be concluded that tl~ert. i s nu sis~iiticat~t ditt i .re~\cc t w t \ \ c c ~ l llic
esperiniental star ux of the group and remo~ ed the irlitial ditfer.encu i ) t - the youp5
Uetijre that I he 1: ratios of the imtnediatt: postrest scnr.es it ere zo~nputed ~ s ~ t y
AhO\ 4 wrrh SE.5 as a co~ar la te The data and I-esultb are ylvetl 111 1 ahle i 104
Table 5.1 OJ
Summar?, of .4tlalysis of Variance (ANOVA) of the lnlnlediate Posttest Scores ol'
Pupils ill the Esperimeatal (CAM, AOM d;: 17'Rl) ;tiid ('oatrol (C'TI,Yl) C;ro~~l)s
C'lassified by Model Categories with Sk:S as C'o\ iiriatr - -- -
- Source o f variatio~l , s S ~ . G T G g 1 i i c i ~ 7 -- --
S I,: S ( ('01 m a t e ) 134-1 179 1.344 I70 i 1 3Ji. x h
I I
F r . o n ~ ' I able 1.'. filr df I !j. t.' at 0 05 lewl - 10 13 anti
1: at 0 0 I level t:
The F r.atios bere tested fclt s~yliticance I 'hu tablc \.itlue\ of' I: aftel.
itlterpolation Ibl- dl' 1 i 3 arc 10 13 at 0.05 lei,el atuf 3-1 12 at 0 !) 1 I t . \ el Tilt. ob~ained
F\ ~ .a lue 1s s~snlficant at 0 0 1 level (Fu = 5 1 ;q. p . (1 01 ) I'h13 .choi\c that a1 least
o n c c\i' the groups anon2 C A M , .40M and C'1'1-JI of' the lnocicl iatttyol-ic.\ d~flkr-\

sign~iicantl:, 111 the inmediate pvsttest scores S111ce t l~e FL ~ a l iltb IC. \1ynlfi~a111 tht'
Ineaii ot' the immediare posttest scores rnusr be ad,jus~ed for the dityel-e11c.c i n socio-
ecotlornic status scores. then onl! one can sa? ichethel- the mc~del ~ r - n ~ l p s d~tYet \cr\
111uch ill the itnrnediate posttest scores in acli~evenient Su ti111 he1 anal!,si 5 is
11ecessar.J. to tind 011t which 111eans differs significantly tium the others
'The total sums of squares. adjusted 111ean squarc \.ar.iancc till- the
i i i ~ ~ ~ ~ e d i a t e post-tes~ scores and F ratio were calculated The? ;ire ~~reset~ted in .I'ahlr
Table 5.IO5
Summa? o f Analysis of Covariance (ANC:O\,'A) o f the Immediate
Posttest Scores of Pupils in the Experimental (CAM, AO'M & ITM) and
Control (UTLM) Groups Classified by Model C:ategories with SES as (.'ovariate
The obtair~ed value is Sreater than the table u l u u ( 1- - - 2 ; 78.
p 0 0 5 ) Hence it can be concluded that the - Informati011 Prucessiny h;ludt.ts ut'
reachirlg- is Inore eficctive than conventional neth hod of teacl~ing
Source of Variation
4moi13 rliean>
Sun1 of squares
2489 63
df
-1
U ithin sl.oup:,
t T'c~tal I
-- TFr;ZJ YIeaa squ;rres -I--+ 612 4 1
16571 40 h ; i .-- -
3h I3 i , 2.; 7 X " =
I I -- -1
19061 05 0.; 7 '9 0 2 I
I - I i
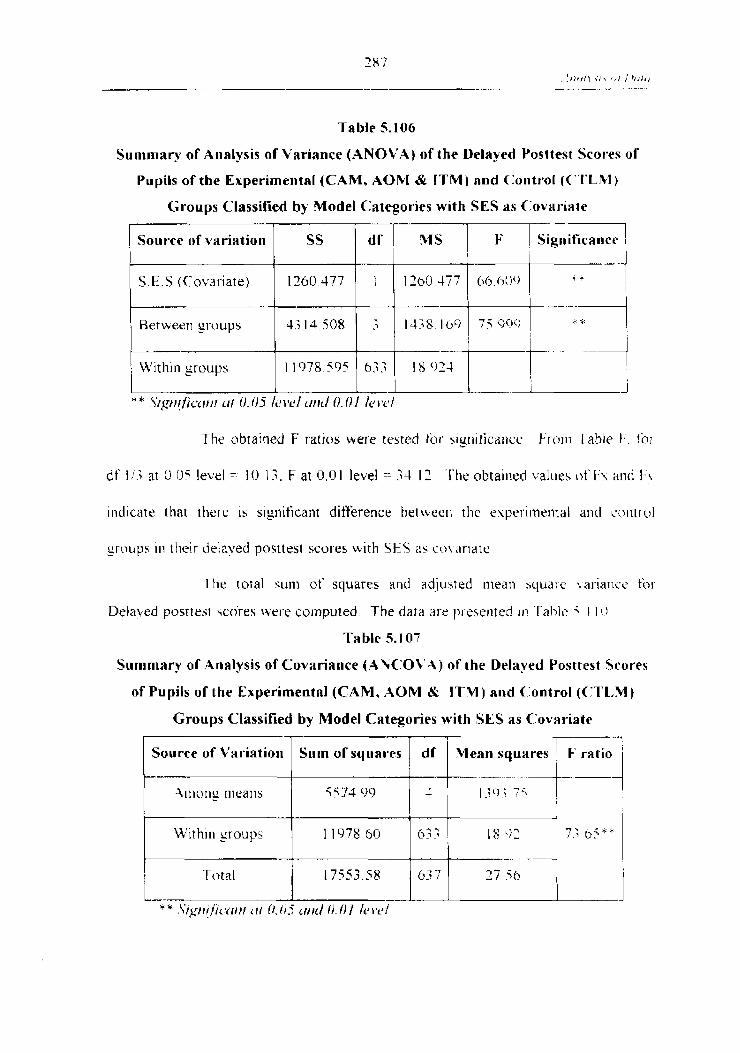
Table 5.106
Summary of Anrrlysis of Variance (ANOVA) of the Delayed Posttest Scores of
Pupils of the Experimental (CAM, AORI & ITM) and C:ontrol (<"i'Lkl)
The obtained F ratios were tested t i ~ sigt~iticaliu~ f r o m I-able 1, lbr
Groups Classified by Model Categories with SES as C obariate
dt' l i; at 0 O 5 level = I0 1.:. F at 0.0 1 level == -34 I 2 'l'tle obtained \!alucs of F\ arid f . \
ir ld~cate that therc is significa~it difTerence bet iceet~ thc t lsper~~~nental and con~rv l
Source of \ ariatiotl
S E S (C'ova~ iate)
Retheen gi.oup\
, U'l th~n groups
groups ill their delayed posttest scores with SES a3 co! arlatc
* S I ~ ~ U ~ I C I I ~ I I ~ f t 0 03 /LJI-CI L ~ I I L I (1 01 / ~ > \ ? L ~ I
SS
1260 477
43 14 508
1 1978 595
I Sigu~firaece I
The total sum of squares and adjusted nleari hcluarc \ar ianut till-
I
Deia\,ed posttest scores were cornputed The data al-e presented In 'fablc < I I 0
Table 5.1 07
Summary of Arlalysis of Covariance (A\C7OV.4) of the belaved Posttest Scores
of Pupils o f the Experimental (CAM, AOM & ITM) and ('oatral (C'I'L,Yl)
.
6.;;
1260 477 06 C>UcJ Y X - -I
Groups Classified by Model Categories with SES as C:ov;lriate
Source uf variation
4111c>r1g nieans
With111 g o u p s
Tota l
* * , Y / g t t t / ~ ~ ~ t t t t ( [ I 0.0-7 ~ 1 t t i 1 U.01 i t ~ \ ~ / J
. .,
Slim o f
5 f; 34 9cl
1 1978 60
17.53 58
63.;
6; 7
, 1 S 0 2 7 ; 6 5 + ~
. . . -1 27 .St>
I

From 'l'ablc F. fur d f 4/63;.
F at 0.05 level 3 37
F at 0 O l level -, 7 " .- .>?
'Thc F ratio I S significant at O 0 1 le\,cl (I-' -= 7.; 6;. 17 0 o l ) Herice ~t
i s c~bv~ous that the t h o final means difFer sigllificanrly bet* eel1 t hc expcr.~mental alld
cu~~t t -01 groups
Table 5.108
Summary of Analysis of \:ariance (ANOVA) of the Difference in Immediate and
Detayed Posttest Scores of Pupils in the Experimeatat (CAM. .4OM & ITM) and
Control (C'TLM 1 Groups Classified by Model Categories with SES as C'uv;lriate
kr01~i Table F. for df 1:;.
F at 0 05 level - - 10 1.; and
F a1 0 0 1 level - - .?4 12
I'lic s~gnlficant F-ratio (F-calue 1; 10. p . 0 0 5 re\ ealed that nrle ot
Source of variation I SS
the rrlodel caleguries difiered. but further analysis 15 necessar?-
* S I ~ I I I ~ ~ L I I ~ I I C I I 0. 0-5 It) \t~/
- df
I
3
6
S E S (C'ovariate)
, Between groups i
Withi11 grc>ups
1.345
1029 03C
13.365.662
..- 7-- >
YlS F I Sigaifica~~ce I !
- .. ' - i 1 .;-I5
4 1 I
10 5 . P
060 I I
17 55c)
" . .-
I 3 10
I - - -- - 1

'Jhr t o ta l sum of squares. adjusted Illeat1 square i,ar.lancc t i>[- dltti-~,er~ct.
In iinti~ediate and delayed posttest scores anci I-' I-ario %err calculated 'l'lie\ arc
presented In Table 100
Table 5. t 09
Surnmaq o f 14~~alysis o f CIovariance I.4NCOV.A) of the Difference in
Immediate and Delayed Posttest Scores of Pupils in the ExperimentaI
(CAM. AOM & ITM) s ~ l d Control (CTLM) Groups Ckissified b~
Model Categories with SES as C okariate
r- Source o f \ ariation Sum of squares
- --
I030 38
12365 66
Total I .3396 04
v * $ I ~ I / ~ / L L [ / ~ ! c{( 0 Oj (iud 0 01
F at 0 0 1 level -, * - - .7 .> ?
']'he I; ratio is significant at (1 0 1 1ei.t.l (1; 1 I 0 0 I ) Hence 11
cat1 be concluded that the lnfornlation Processiny Model i s more t.f-Yecrile ] t i reach~ng
C;ecryraph?- than the C'onventional Vethod
The scores obtained in the SES scale of students \\ere consolidated and
calc~ilattd the I1iean 3rd variance The data and I-esults arc given 1 1 1 1-ahlc. 5 1 I 0
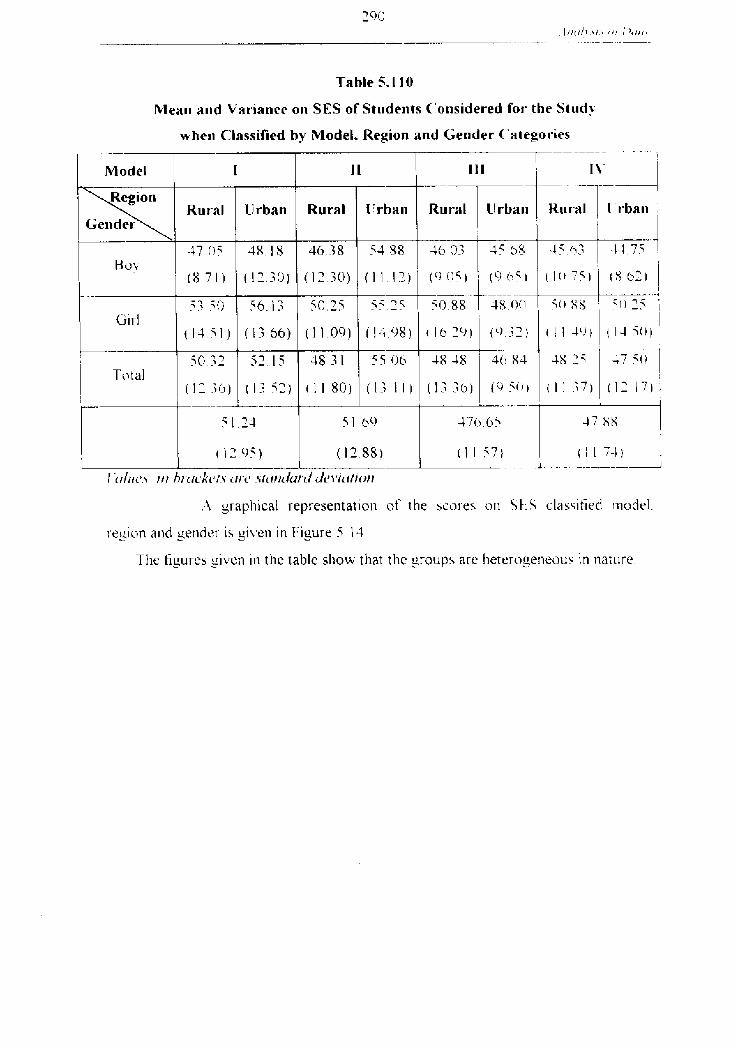
Table 5.1 10
Mean HIMI Variarice on SES of Students C'oasidered for the Study
whe11 Classified by Model. Region and Gender <:ategories , - - .
I I I I I I
Rural lirbati Rural Urba~l
47 o3 -
38 18 46 38 54 88 -16 0; 45 h8 4 3 44 7<-
I X 71) ( 1 2 .;0) (1230) ( I I
{ 13 $ 1 ) ( I ; 66) ( 1 l 09)
5 1 74 5 1 69 470 63 47 X S
(11 0 5 ) ( 12 88) ( I 1 i 7 ) ( I 1 7-41 1 1. . . . -..I
' I I / I h t . i r ~ ' k r * ~ . i rr1.c .\tiu~~krt.d ~ L ~ \ ' I L I ~ I ( N I
..I Srapliical representatio~l of the hcores on StIS zlassif ied nod el.
r,esiun and serldet- is ~ i \ , e ~ l in Figure 5 14
The tigures yiven in the table show that the yroupa a1-u heteroyeneou!. i l l nat 1ir.e

I- -- t
ALL
. . 1 l l RURAL ,
IPURBAN I - I
1 MODEL 1 MODEL2 MODEL 3 MODEL 4
r - BOYS 1
MODEL I MODEL 2 MODEL 3 MODEL 4
GIRLS
I MODEL 1 MODEL 2 MODEL 3 MODEL 4 I
Figure 5.14
SES Stores-Classified by Mudel Categories. Reghkn and Gender

Table 5.1 1 1
Mean and Variance o n SES of St~lderlts Collsidered for thv
Table 5.1 12
Study, when Classified by Region arid Model C ategoriex
1 I I
Meat1 and Variance on SES o f Studerlts Co~isidered for thr
Kut al I
- -
I!rban
Potal
Study. when Classified by the Gender arid Model C:;ttegories
Girl
I C I / / I L J % t t l h t ~ ~ ~ * k i > t \ I I ~ L / ~ C Y ~ I L / %tL~tlcfilt-i/ L / L ~ I ~ I ~ I I I O ~ I )
57 I5
51 34 Total
(12 95)
(1.; 5 2 )
5 I .24
(1395)
'I-able 5 I 1 1 and Table 5 1 12 t v e the Inean and \,ariancu 01' SES .jcores
clabsified h! 1-erio11 and n~odel categories and yeiider and t~~ildel catcgu1.w.
( I ; 1 1 )
5 1 69
respectively They al-e subiected to funher a~ialysis Ii11- interpretat i o n
( 1 7 8 5 ) ( 1 1 5 7 ) ( I 1 74)
( 0 5 0 )
47 h5
I ( l ? 171
4'88 ,
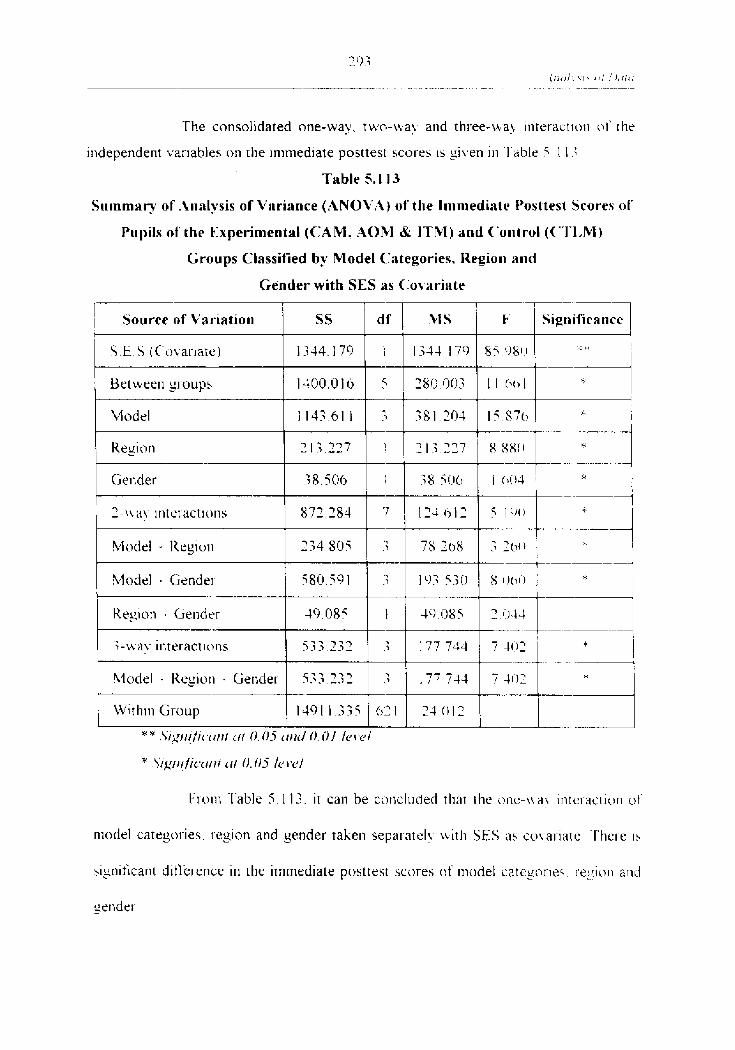
The consolidated one-way. t uo-ua! and three-w a Iiiteract 1011 ni' the
~ndependent variables o n the in~med~ate posttest scores is given 111 Table 5 1 I :
Table 5.1 13
S u ~ n m a v of ,411alysis o f Vnriarlce (ANOVA) uf the Immediate Posttest Scores oL'
Pupils uf' the CIxperimental (CAM. AONI &r ITM) and ( 'o l~ t ro l (("1'1,Nl)
Groups Classified by Model < 'a tepories. Heg io~ l and
Gender with SES as <:o\ariate
S E S ( C ' o ~ a r ~ a t e ) 1.344 I79
Bet~ ieen g~ oups 1300 016
1 4ludel - Keg~c.rtl Gender 1 533 7.37 i ~ l 1 7 7 7 4 4 1 7 4 ! ~ 1 *
U i t hil l Group I 9 1 5 631 7-1 012
* . ~ / ~ I I ~ ~ / ~ ~ ~ / I I I (11 0 . 0 - 5 ( f t l t l 0 01 /LJ\Y/
* S I ~ ~ I I # ~ C ~ I / ~ / L I I O . O j / P \ Y /
trow -[-able 5 1 13. it call be concluded tha t the onc-ir a \ irltei aclirlrl ut'
rnotiel categul-ies. t-egion and gender taken separately \tit11 SES ;IS ZUL ai-iat t' . l ' l~c~-t ' 1 5
siylif icarlt ditkrence in the immediate postrest scores uf nod el catcgot-ier. te91o11 atld
gerlder

In the t \YO-way interactions. there i s significant ciiit't.r.t.~lct. he1 \.~.et.i1 t hc
model categories arid region. nlodel categories and gender Hut the ditferenct.
bet w e n region and gender is tlot significant ( F u l u c - 7 04. p ( 1 ( I I )
Thc co~t lb~ned influence of nod el c a t e o r ies. I e y l o ~ l a11~1 gerldcht
immediate a c h i e ~ einent is significant ( F valuu --- 7 40. p . 0 0 l )
1 o get the adjusted sum of squal-es. niean variances and I.-\'iil~~e\ tilt'
,A~ialvsis of Co\.ariance was calculated The data and results are given 111 Table 5 I I4
Table 5.1 14
Summary of A~rnlysis of Covariance (ANC:OVA) o f the Immediate
Posttest Scores o f Pupils o f the Experimental (CAM, AOM & ITM )
and C'oatrol (CTLM) Groups classified by Model C'ategories.
The significant F ~ a l u e ( F value - I U 80. p 0 0 1 ~ n d ~ c a t e s that I P M 1 5
superior ro conveioional nler hod of Teaching
The corlsolidared one-wav. t t ~o -M a! a~ici three-M a\ Intt.racrlr>n o f the
indepelldent L arlable on the delaved posttest scores 1s siben irl Tahle I I
Repi011 and Gender with SES i i s C:o\;itriilte
df
10
Within groups 1491 1 34 021 i v
- -. - -. - -. .
Mearm squares F ratio -- -
I 3.50 30 t7 I
-+
24 0 1
h;7 - ' 0 07 I
-- - - - * , - ..
Total
* * .Y{g/~~ft~,~ft!t ill 0. 03 L - U I L ~ 0.~11 /L>\*L>/
i 19061 115
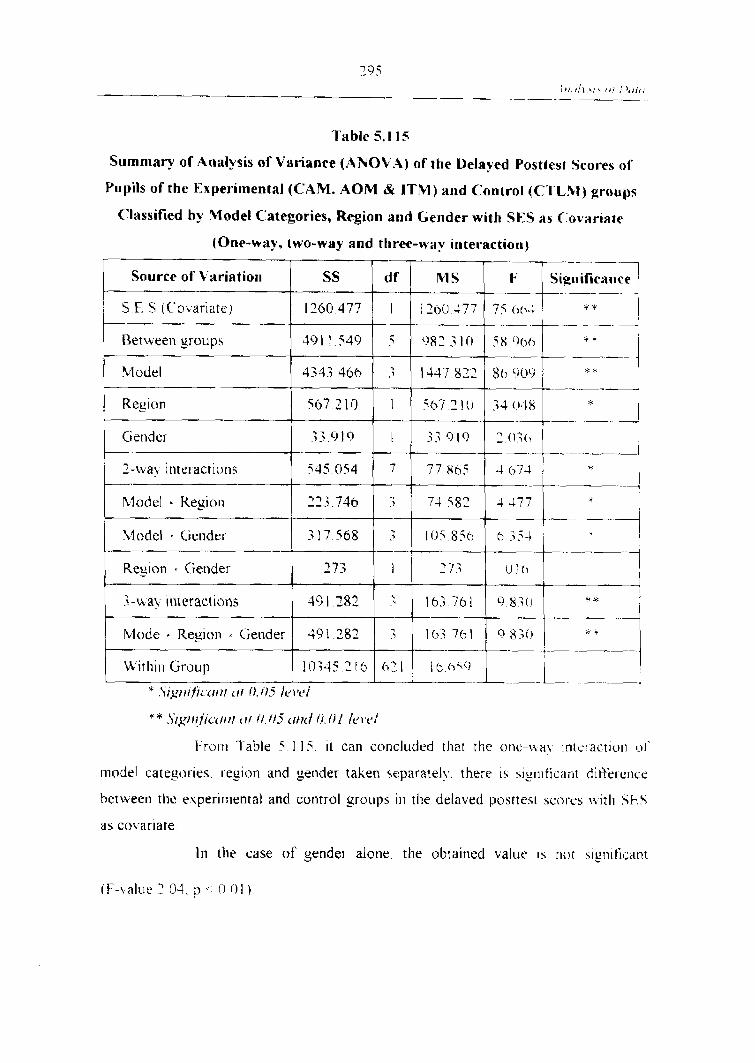
Table 5.1 15
Summary of Analysis o f Variance (ANOVA) of the Delayed Postiest Scores o f
Pupils o f the Experimental (CAM. .40M & ITM) and Control (C'1'L.V) groups
Classified by Model Categories, Region and Gender with S F S as C'ovariare
(One-way, two-way and three-way interactiorr) 1
Source o f b'itriation SS d f MS Sipni f ica~~ce - -.
r S F S (C 'o~ar ia te) I260 477 1 1260 477 75 ht~J X X
- - - +
B e t ~ e e n g o u p s 49,1549 5 082.<10 -- --
Model 4333 466 I447 822 $b LNO -- --
Reg~nn $67 210 1 q67 310 34048 -
;; 919 Gender I - ? j c )19 :o;t, - -----
2-\.i a\ ~tltzl-actions 545 054 7 77 865 4 (773 - . .-
hlodel Keylull 22-; 746
Zlodel bender 3 1 7 5 6 8 7 10585(2 h;5J -
Re910n Gendel 273 1 27; O I O , 1
U it hill Group
* . J ' i a y u i f ~ i x ~ ~ ~ t i t i [ j . 0-5 / L > I ~ L ~ /
I-roll1 '1-able 5 I 1 i. it can concluded that the onc-lid!. 1ntt.1-actior1 ut'
model categories. r.egion and gender taken separatel!,. there is s i~n i f i cant dif-%I-e~lce
between thc e\rperirnental and corltrol groups ill the delayed posttes~ scol-es 1% it11 SF.5
as covariate
In the case of gender alone, the obtained value 1s not sign~f icant

In tNo-wa!, analysis also. obtained F-\-,aluc for tht. 111tt.r-actrr,~~ c.tti.ct r r t '
region and :endel- raken together. i t is not siynificarlr t F-jralue - (12. o ( 1 1 1
Bur 111 the three-way analysis (models. resiun and yc1idt.r-1 F - \ i ~ l t ~ e I>
S o i t can be concluded that nirldel categories. r e y n n and gender- l a k o t ~
rogethet-. there IS significanr difierence between euperitiienral and sont1-ol Sl-rjup:,
1 he adlusted sums of squares. mean square \a]-iarlce and 1--ratio (~t ' the tielaved
poatrest \+el-t. cun~puteci The results 01' the allal! si> ar,c yii-en ill I ;ll)lt. + I I o
Table 5.1 16
Summat?: of Analysis of C'ovariance (ANC'OI'.4) of the Delayed Posttest Score< ut'
Pupils o f the Experimental (C'AM, AOM & ITM) and <'ontr+oI (C"r'1.W) Groups
Fro111 the above table. 1 1 call h r seen that the clhta1nc.d F - ~ a l i l u 15
Cylassified by nodel C:ategaries, Region and Geldel. with SES as C'uva~.iate
significant ar 0 01 lt.\.el ( F value = 27 04. p . 0 0 I ) I'he ~ i ~ n ~ f r c a r ~ t 1 ~ a l u e ~ndlintoh
fotal
thar ' Infor~nar~on Process~ng Models of teachir~~' i s supel.lor to L O I I \ e11t ional teachel--
r,~-ierlted method oKteach111g
* * . \ ' I ~ u / I ~ I / / I I 0. O j ~ U I J 0, 01 It>
The influence ot' model categories. regiot? and yt.ndt.1- t ) n tlie
%lean .-
450 q2
-- .
,
.-.-
i
achievement difference between pretest and posttest test SCOT-CA i i a a fr>und o t r r h\-
17553 58 27 5 0 !
-1-.
Sum of squares
7208 36
10.:45 22 --
i I - t i i o-u.a!. arid three-way interaction a ~ ~ a l y s i s ivith St, S ah COL ar-la\c
df
, I t~
0 2 I

The data are presented in Table 5 1 17
Table 5.1 17
S u n ~ m a ~ y o f Analysis o f Variance (ANOVA) of the Diffel-ewe ia Achievement scores
of Pupils o f the expetimental (CAM, AOM & ITM) and C:antrol (C'TL.M) Gr.oups
~'lassified by Model Categories, Region and Getldet. with S t 3 as C'o\'ar*iate
Model Gender 1 - - - - - . - - 1
I
- -- -
Source of l'ariation
S E S (Covar~ate)
Between groups . . -- -
Vodel
3-wav ~nteract ions 658,733 __C --..-
Model Region a l i e ~ ~ d e r 658.77; -, - -
Within Group 1 I
* * .Y~gt~ificirt~t (11 (1 0-7 ( { t d O . O / /c~\*c/
From Table 5 117. it is clear t\iat {he rota1 inflilencc r ) l ' 5 E \ on
acIlle\~enic.tlr diiYet-ence i s nor significant (F-value =- 0 X. p i) O I
-1'hu arlalysis of covariance for the achie\,elnenr d~f'erence heti\ ecn tlie
immediate and delayed posttest scores of rhr: experimental and contr-01 y.ol~p.; ar-c
rriveli in Table 5 1 18 -
.-- .
Reyon 84 895 1 84895 Ah74
Gender 144 704 I 1-44 704 7 967 1
. ,
I ?-&a\. interacnons 200 793 7 j 28 (785 1 5 7 0
-- _I.----
--
SS
1 345
1255 305
1046943
Df
I
5
3
I Sigoifica~lce I MS k'
1 -3.15
23 1 061
348981
074
1 3 872
1.121.;
i
--/
I X
I . - - -
X

Table 5.1 18
Sumniaq of A~lalysis of C:ovariance (.4NCO\:A) o l the Difference in
,Achievement Scores of Pupils of the Experin~erital (CAM. /.\0%1 bi IPbI 1
and Control (CTLM) Groups Classified by Model C:;ttegories.
Tot a1 13 ;96 04
... , --. .- . . . . - - - .
Kegion and Gender with SES as Covariate
'l'hc results of the arlalysis of cox al-iarlcct for the a c l i ~ e ~ elnenl d i f fe~- t . t~z~
Source of k'ariation
Among ~neans
j Withingroups
of esperin~ental and control yroups s h o ~ that the mean of' the ach~t.\~cti~t.rit drtt'erellcr
uf' t he IPM group 14a3 sisniticant ( F value - 7 28. p - 0 01 ) klcnct~ i r call be
Sum of squares
21 16 IS
1 I279 86
cot~cluded that the lr-itbrmation Processing (1Ph.l) appruach I S superior- to co~ive~lrlonal
approach in the teaching of Geography
cif
5.410 Observation Schedule for the CAM, A 0 3 1 &. I'I'M
- -7- Yleaa squares I- ratio
I-he InLest~gatur has taken classes tijr the IN''' b~d r l da t c i - r u i l e ~ ~ ~ > 1 r 1
Geuyraphy accord~rlg to the syntax and accepted procedure of Infor~ilat inn 1'1-ucessing
I h ! 137 3h
Models of Teaching Before starting the experiment. the authorities nt' the school
6 2 1
\\ere approached well in advance and the rlar111e and purpose o t ' t t ~ e \ ~ u t i \ \ < t l ~ c dul\
- -
18 1b
esplairled t o the111 'I'he teachers handl in~ Cieo~r-aph! classes in t lle 13'" <randa~,d
I---- 7 1 - X V X
were co~itacted before starting the experiment The lessor^ t~-a~~scr ip th . ~nst r~uct~or~al
materials prepared for each rnodel and the -1'eachin~ :Z~ialys~s C~u id t . ( 0bse1- i a1io11

Schedule) for the ('AM, .4OM and ITM were show11 to them and their suggestions
wel-e invited and doubts were clarified DitTeferellt phases of the model. syntas and
specific procedure and inst~uct ions were explained clearly to the111
The investigator herself handled all the lessons I he head ol' the
institutions and teachers of the subject concerned helped the lnvestigator to canducr
the experiment under ideal conditions
The observation schedule used fol- e v a l u a t i ~ ~ p the teacher's
performance. teaching skill, specific goal and assumptio~ls of each nod el i b a s sit en t cj
the concerned Geography teachers of each sctlool 'l'he 'reaching .411alysis Guide
(obser~ at ion schedule) comprising the Concept .Attainment Model ( C -4 hl 1. Ad\-ancc
Oryanlzer Vodel i.40M) and Inquiry Training Model ( ITM) corltalned 18.14 and 20
questions respectiimely Specific instructions to be fo l lo~ed in each ~nodel categol-!
were given in rhe observatiot~ schedule The quest iot~s were rated o t ~ a 4 point scale
of 4,"; , 7 and I indicatins 'Thoroughly, 'Partially'. 'Missing' and 'Yut needed' The
term *thoroughly signifies that the teacher engaged in the behaviour tu the point
where the students were responding cornfortabl! and tluently The tern1 -i>artially'
denotes some doubt in the students' response as the! respond fully 01- not The tern1
'missing- is used when the teacher did not engage 111 the behaviour. there appears to.
be a loss in students' response on the other hand the term -not needed' indicates r11a1
there is no need for the teacher to engage in appropriate behaviuur hecauxe the
students began t o respond appropriately wit hour beins
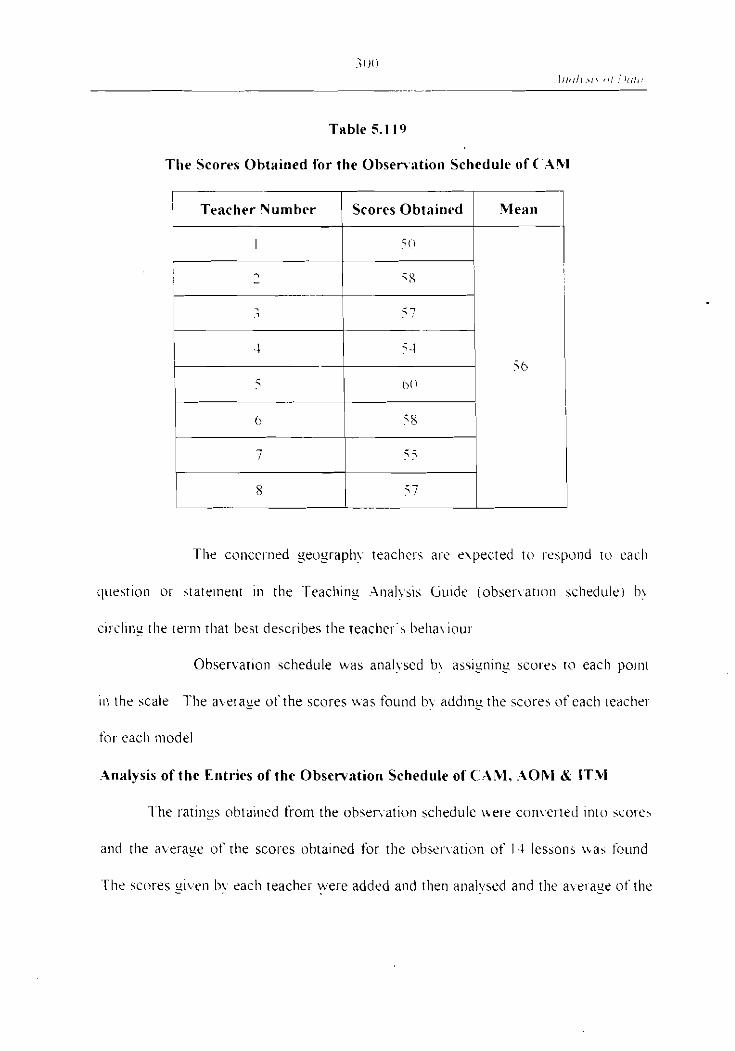
Table 5.1 19
The Scores Obtained for the Observation Schedule o f ('.Ar\.l
I I I i l l I
The conce~ned geuyraph! teacllel-.; ale e\pected to respond ru cacli
questiull or stateinelit ill the reacliins 1 1 s Guide (obser\atlnli sclledule) h)
c ~ r s l i ~ i s tlle rel-nl that best describes tlle reacllcls helm\ ioul-
Observarior schedule was analyscd h\ assignins scorch ro each poi111
i n the scale The a\erayt. ofrhe scores was found h\ adding the scol-es of each leacllr~
for eacli niodel
Analysis of the Entries of the Observation Sched~~le of (.AM. .AOR.I & I TV I
l ' he ratinss obtai~ied from the observatio~l sclledulc bere con\-erled into score5
and the averaFe of the scores ohtained for thc ohser\a~ion of I 4 lessons \La5 iourld
The scol-es gi\en b! each teacher were added and then analyscd and the a \ r l a s r ot'rhe
Mean 7 i Teacher Number Scores Obtained

scores v, as fou1id out t o set infor-mation about I he pl-ocedure ti~lloi+eci hi, the teiiulier
'l'lie results are si\ en in table h'o 5 1 10. 5 120 R 5 13 1
1 hc I-arise of possible scores hi. C'rlncrpr .4tta1111nctlt \lode1 ( I 4 \ I 1 I <
18-72 -i'ht. meall scores obtained at-e 5-5 This is much ~norli t h a n ~ h c ~ ~ l i d - p o l n t 01'
tlie ~-anse i c 45 f h i s indicates that the pl-ocedu~,e t'ollo\i-ed In rlic tcachct t~i i : , twetl
r-ared to be sa~isf'aitor.!, w i ~ h respect to the espeuteci p~.ncedur-t.
'The Scores Obtained for the Obsewatior~ Schedule uf .\O]\ll
The Scores Obtained for the Obsenation Schedule of .40%1
r------ --A 7- - - .-
reacher Number Scores Obtained --
1-he range of possible scores for the .Ad\,anct. 01.yar~ize1- +lode1 I -4C)hl) 1 5 14-
$0 I'hr rrlean scores obtained tbr the AOVl 15 45 The mld-pv~nr o t 11lc I-ilnyt. r ~ f '
- 1 I 5 Thc llleatl i alue obtairied from I hc bc.c!~-cb of' r-at~l lg tl\ teac.llc.~-5 r c i t.;iIcrf
tlie fact that the tcacller followed the accepted pl,c)cedu~-e 111 a sa~~stictc>r-\ Illanrler and

the teacher's pertimnanctt was in accordance N-ith tlit- syntax anil specitic goill anci
'l'he Scores Ohtained for the Observatiora Schedulc of ITM
The Scores Obtained for the O b s e l ~ a t i o ~ i Schedule l i ~ r I'I'M
']'be possible range of scores obtained ti>r the lnquin: ' l r - a i l i l ~ l ~ Xlodzl ( 1.1 hl r
is 31-80 '['he niean scores obtained for tT\l i s 0-1 -l-ht. inid-po~nt 01' thc r.aIlgc clt
1Thl i h 5 0 l ' l ~ t . rrluarl d u e obtained from tlw scores ot' ratin? I)\ teacher\ t-eieated
the fact [hat the procedure of the Inquin Tr.ainin2 is str-icrlv ficllo~~vcf ill ~ h c
eupe1.i men t
r 'I'ewcher Number
4
i
h
7 -.
8
Scores Obtained --
0 7
68
0 'l -- i i)
04
-1 (7 ; !
I..--

C:ONSOl,fDATED RES ti I,TS OF ANA I ,YSIS OF (:OVA RIANC:E (ANCIOVA) FOR
- - --- 7 - - -- - - - -- 7- - I -- -- - -- I Model I I Co- Mean
Test Categoq F- r l.cvel of 1
L. ~Q!e%E!!L &. -- - -- variate I variatiori +: " q u m I ratio 1 significance - +-d--
I I Among 7- I -I
I 50h7 i I 1266 78 IPM * Means ( Imrnedtate posttest 0 ( 3 1 i I
Groups Among
IPM x Means 1747 26
Delayed posttest CTLM 1 104 69
Groups 1 'g \ - - 1 - J.,
i 4chrevetnent difyirence 1; 1 I 118600 ' 4 ; 29607 i 1 I P M x I hetikeen itnrned~ate & , prelrst i--h!!?!!!!~ f -- - . - 1 - - 1 1 5 ; g 1 1 C'TLM
001 I 1 delayed posttest I Withfn 1 12?0q ;7 ' o;< 1 9 30
I Groups I - - - L - -- -- - -1 -- -- I - --- I- . :--- - - - L - - - 1 -I -- -- I lPhl *
I
! ! ! Among 1 0 0 ! 16 ' 4 1 4 4 ! , I C'TI,M Immediate pusttest , I Means 1 I - - I - -- ,
Model 1 One-way. trio-rvay 6 ' Pretest : 30 7C1 0 0 1 i
I Reginn three-ivav interact 1u1-15 I With in 12410 1 b 2 31 01 Gruups
Ciender : !
... . - - - ... a . . . - .. j . . .i --- I P M * I Airrnc . 851688 I < ; 2 3 1 \ I ( 'TI . A 1 Ilclaved posttest one-.r+a>. I hleans I
b -- -- I hlodel I iwo-way and three-way Prcrcsr - - -7 - --I i b 58 I 0 01 K e ~ i o n ! itlteractions ! q ~ i b 70 021 14 5 Groups : Gender 1
-. I - - . . . . . ... - .... - - _. - -1 ... -i .- -1 . . ..J
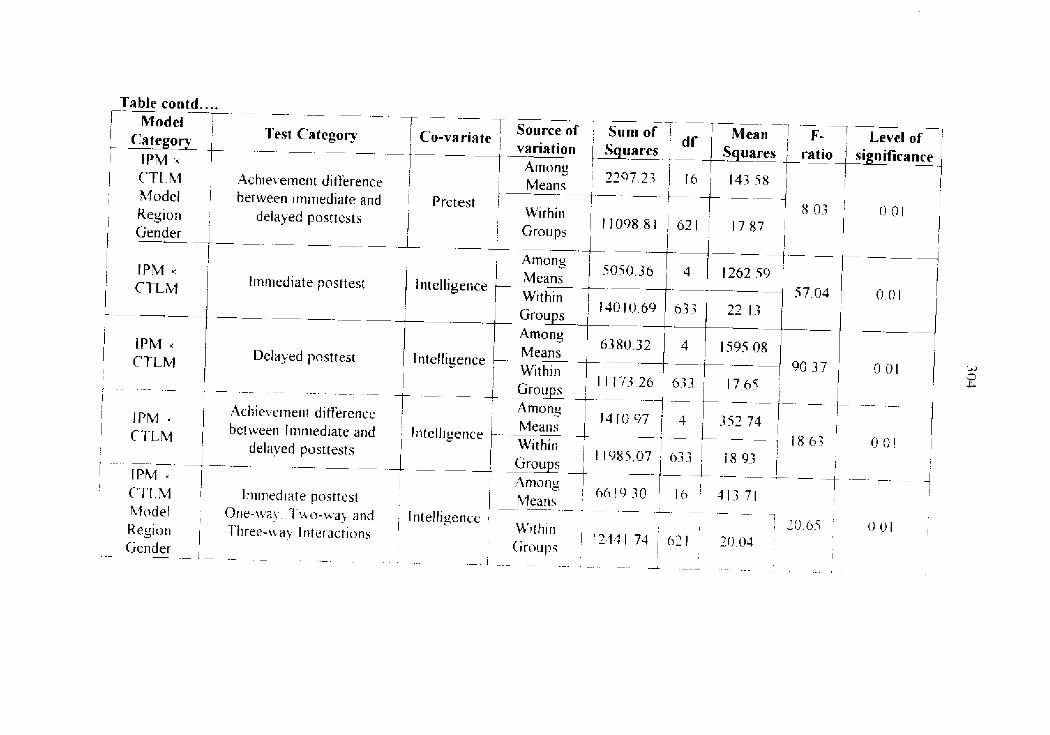
I P
l I
-:

I I
rr
t-
C
YC
,
1 .E
l P
I m
r'l
I r-1
7
j V
II
r'
l
X
,L ;I
w,
; r
l
1 L
I
rr
l
oo
I
I I
r,
- -
I J
--- -+---r-
t
1
i
I-
!
I
.. -
-
--I -
- I
i '-- t+ C
:. -- -+
--
!
i I
I I


TABLE 5.123 CONSOLl DATED DATA AND RESU Ll'S OF SIGNIFICANCE OF DIFFERENCE BETWEEN POSTTEST SCORES
r
Model Category
IPM * CTLM
IPM x C'TLM
lPhl CTLM
l Phl
I I PA1
r - I PA4
I
LJ 0 9
OF PI1PILS
Test Category
Inmediate posttest
Immediate posttest
Immediatt: posttest
l rrirnediate pc~sttest
Immediate posttesr
lrnmediate posttest
CONTROL GROl!PS
D
( M I - M ~ I
26.74 (MI)
24.66 (MI)
28.76 (MI)
24.66 (MI)
29. I 9 (MI)
24 66 (M2)
26 74 ( M I )
28 76 (MI)
26 74 (MI)
27 1 9 ( M z )
28 76 ( M I )
27 19 I M z j
IN THE EXPERIMENTAL
CIomparing Groups
C'AM (exptl.1) &
CTLM {control yroup)
AOM (exptl. I[) &
CTLM (control group)
[TM (exptl 1 1 1 ) &
CTLM (control yroup)
CAM (exptI.1) &
BtOM (euptl 11)
( 'AM lexptl t j Rr
1'I'M (evptl 1 1 1 ) j
CR
-3.25
6 72
2 53
3 73
0 70
2 '11
AND
N
159
1 60
160
IhO
159
I 00
1 5'1
1 60
I59
1 5 9
Level o f significance
0 01
0.0 1
0 01
0 01
Not sigrliticant
0 01 AOM ( e ~ p t l [ I) &
ITM (euptj 1 1 1 )
t (10
159


TABLE 5.124 CONSO1,IDATED RESIII,TS OF ANAI,YSIS OF \:ARI.-INC7E (ANOt'A) FOR POST TEST
SCORES OF PIJPILS IN T H E EXPERIMENT.41, A N D C'OIVTROL, CROIJPS
Model
I ! I 229 22 I 1 88
I 1
I I
diRerence I P A j - (' l l .hl ,Al~~clng rneans 1 44 I i l ~ I
I
Test C'a tegor?, Source af Variation
Amc~ng means
Arnung means
Within groups
Amnng means
Among rneans
LL'ith111 ~ I O L I ~ S
Sum of Sqrlares
3421 38
1h4S 75
l.?O9.< 04
1879 3.3
i 100 59
I0504 $6
(pretest as covariate)
IPM CTL,M
IPhl C'TLM
A~nong means 1 -- 779 22
d f
I
1 .)
633
I
-3 5
6.; .:
Pretest * Immediate pasttest
Models immediate achlevenient
Pretest Delaved posttest
Model * delilvsd a c h i e ~ erllerit
Pretest ach~cvement
Mean Squares
342 1 38
548 58
22 l l
i 579 4.3
17U.; 20
16 (19
F-ratio
154 76
24 81
I12 0 1
102. 0;
Level o f significance
0 01
0 01
0 I)!
0 01
c~~
L -


Table contd .....
Model
(with pretest as covariatej On lnlrnediate
posttest
Immediate posttest
Immediate posttest
1
Irnmediat e Onc-ikay. '1-wo-way and I pclsrtest Three-$tat. t i I j i l l i l j 46 1 111 1 1 2 0 1:) 2 I I
Test <:a tegory
lmnied~ate posttest
Three-wav in teractinn ~rnnlediate posttesr
Models gender
Region r gender (total)
Models Region
Models - gender
Source o f
Two-way Interaction
--
Reg~on Gender
Model Region Gender
Variation
Models * region
Among nieans
Among means
Among means
Sum o f
;Zrnon~ rnea 11s
Among means
Squares
798 63
95 98
594 16
d f
I Oh (If
40r) 80
Squares
7
3
3
significance Mean
I
3
1 14 09
31 09
198 05
F-mtio
J
100 611
176 (1.3
Level o f
5 70
1 60
0 01
Not srynificant
0 8 9 1 0 01
5 < 3
6 83
- 0
0 0 5
0 01
I


Table curitd
I Model Test <:ateeon: 1 Source o f 1 sun1 of 1 df I Mean
I 1 ., +
Categop Variation 1 Squares 1 1 Squares 1 I I I
Delayed I One-way. Two-way B I i i i i ~ i i l ~ groups ' ( 0 7 1 b l i 1 i ;i pustlest 1 Three-way interactions I I
One-way interaction Pretest F achievement
Amc)rly nieans 229.22 I -- 770 22 with pretest as difference covariate
One-way Model region & interaction gender * achievement Arnong means 1178 96 5 235.79
(total) diflerence I
One-way interaction Models * achievemen[ Among tneans i15.3 4Ll .) .;I783 1 (Models) dift'erence
I 4
One-way Region achievement
interactions Among rrieans 72 b1 I 72.6 1 diff'ererice
(Region) I 1
F-ratio ( Level of ] / significance

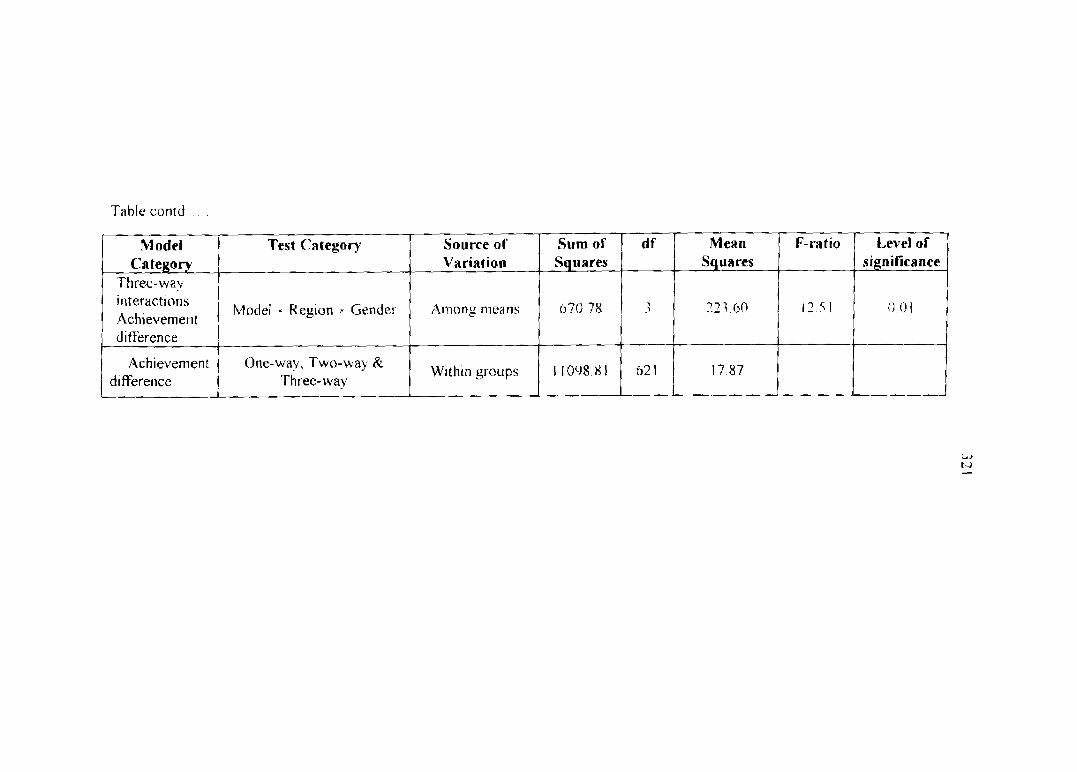
Table contd
F-ratio
12 51
d f
-1 1
621
Level of significance
0 01
1
Sum of Squares
6711 78
11098.X1
Mean Squares
7 2 3 (10
17 87
Source of Variation
Among nieans
Withitlgroups
M ode1 Category
Three-way interactions Achievement d i ffer-ence
Achievement difference
Test Categoiy
Model Regiun * Gender
One-way, Two-way Pr ~hree-way.
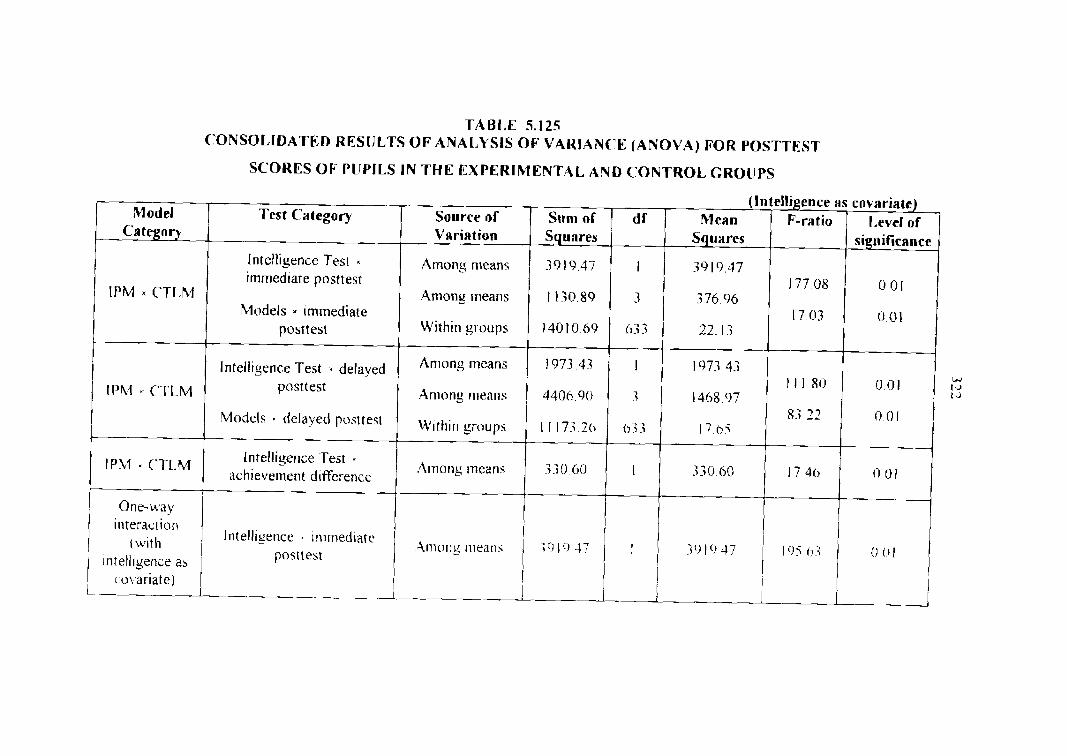
TABt,E 5.125 CONSOLIDATED RESULTS OF ANALYSIS OF VARIANC'E (ANOVA) FOR POSTTEST
SCORES OF PlJPILS IN THE EXPERIMENTAL AND CONTROL GROlJPS
~nteractian 1 lnielligencc - ~rnmediarr I I Ixvlth I -Inlong rnearlh 10; (13
posttest 0 ( I ( I I I ~ ~ I / I ~ ~ : C ~ as 1
ucn.arlate) I I r I L - I 1
- - - A --- 1- I
1 I I I I I 7 4 0 1
0 O l I
(Intelligeace as covarirte) Model Test C'aiegoq Source o f Sum of d f
Uategory Mean
Squares _ _ _ 1 1 -
3919 47
-3 76 96
22 13
1973 4.3
1468 97
17 (15
-330 00
IPM * C'TLM
IPM C'TLI1.1
1Ph.I C'TL.M ,
F-ratio
177 08
17 03
I 1 1 80
8 ; 22
Inteiiiyence 'rest rmrnediate posttest
Models ~rnrnediate posttest
Intelligence Test delayed posttest
Madcls * delayed posttest
Intelligence Test ach~evelnent difterence 1
1,evel of significance
0 01
0 01
0 01
0 01
Among rrieans
Arnong rneans
Within groups
Aniong means
Anlong means
Wll l l ln grc,ups
.4mong ~-neans
L> 14 1 4
3919 47
1130 89
140 I0 69
1973 43
4406 90
, 73 20
i 3 0 60
1
3
b33
1
3
I
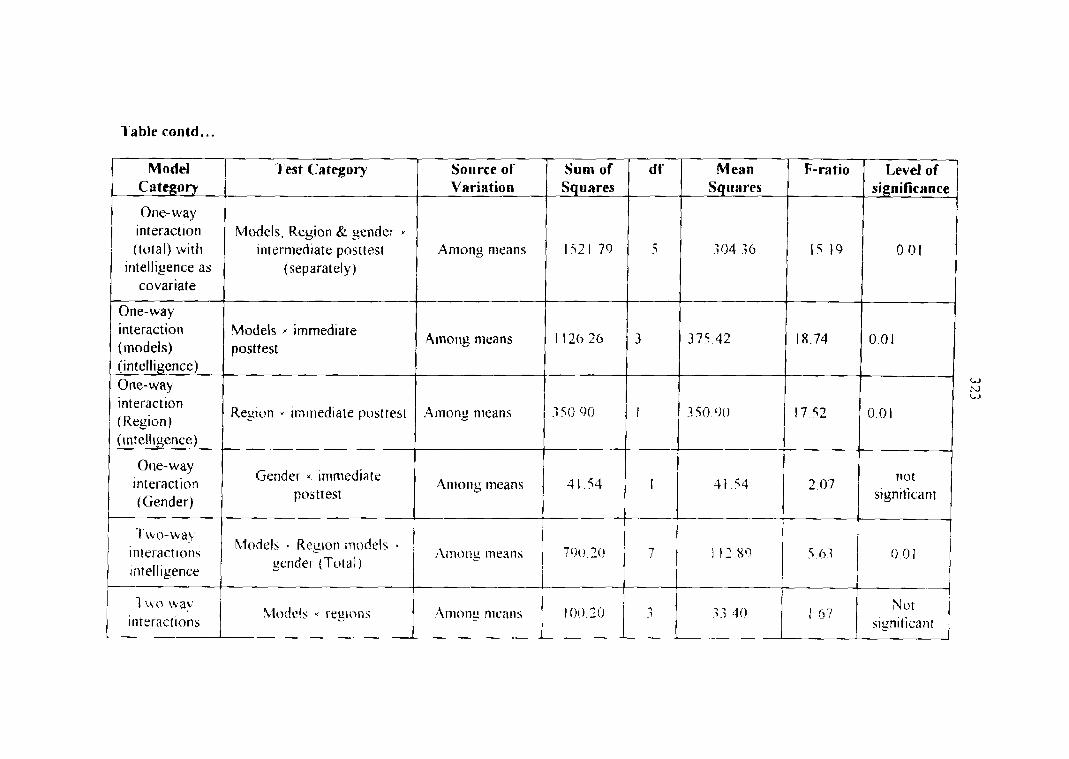
Table contd ...
;24a(tc.!s regions Arnony mcn~is I00 10 3.; 4 0 interactinns
Model Category
1 One-way interaction (total) with
intelligence as covariate
One-way interaction (models) (intelligence) One-way interaction (Region) (intell~gence)
One-way interaction (Gender)
Test (:a tegoq
Mudels. Region &r sender ~ntermediate posttest
(separate1 y )
Models H immediate posttest
Region irr~lnediate posttest
Gender x immediate posttest
df
ti
-3
I
f
S o ~ ~ r c e of Variation
Aniong rneans
Among means
.4mong means
,4111ong means
Mean Squares
304 36
3 7 1 42
3 50 <I0
3t 54
Sum o f Squares
152 1.79
1 126 26
.< 5(1 00
31 4
F-ra tio
I 5 19
18.74
17 52
2 07
Level of significance
0 01
0.01
0 01
1lOt
siynrticarlt
N f ~ J
'r l
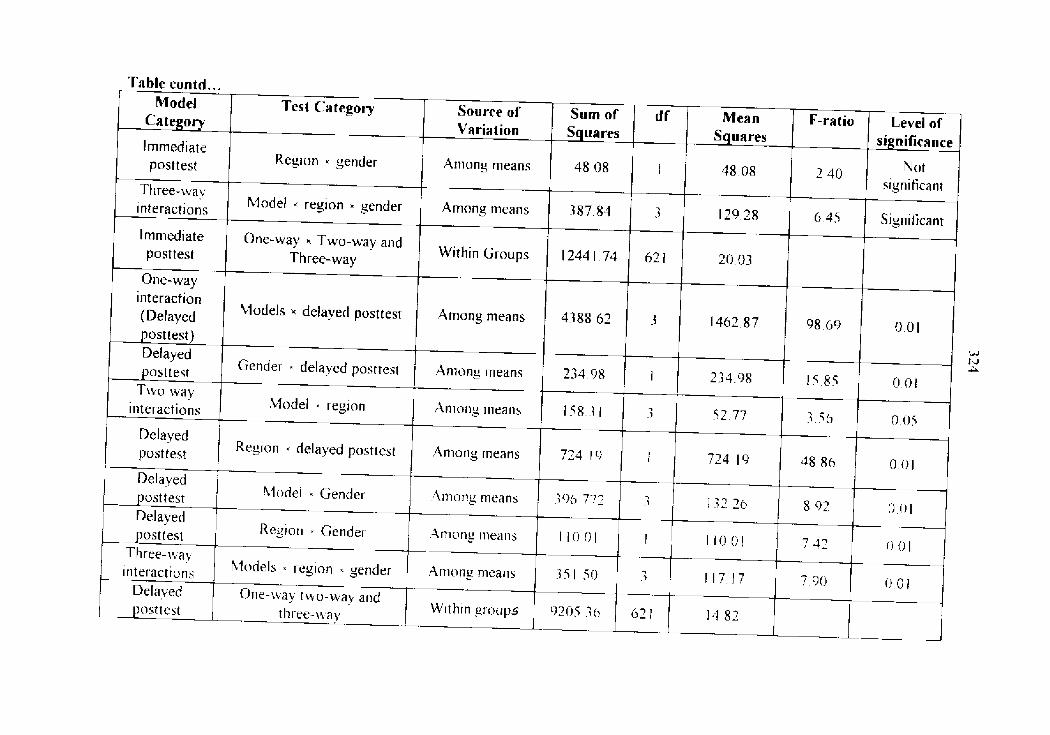


TABLE 5.126 C70NSOI,IDATED RESIILTS OF ANALYSIS OF V.4RIANC:E (ANOVA) FOR POSTTEST
SCORES OF PLJPILS IN THE EXPERIMENTAL AND CONTROL GROUPS
Model Category
One way interaction (Models)
Region
Gender
Two-way interactluns Models
region
Models gender I
1 Rcglon = 1 I mmed~at e posttest I gender 1
:Attitude as F-ratio
17 65
10 91
000
I X i
9 03
,Inlims nirins 0 1 i 1 lio 1 3 1 \n t I i
* -7 .) s~gn~ficant
Test Ca tegary
I mmedrate posttest
I n~mediate posttest
I nirnediate posttest
Inlrued~ate posttest
l mlnediate posttest
covariate) Level of
significance
001
0 01
Not significant
%Ot
s~gn~ticant
0 01
Source o f Variation
Aniong means
Among means
Among means .. -
.Anions inicarls
,41non~ means
'ad 1-1 D
Sum o f Squares
1366 71
281 47
000
141 9;
699 70
d f
3
1
I
1
1 1
I
Mean Sq~~ares
455.57
28 1 47
000
17 3 1
23.3 262


TABLE 5.127 C'ONS0I,IDd4TED RESCLTS OF A N A L Y S I S OF \'.4RIANC:E (ANOVA) FOR POSTTEST
SCORES OF PCJPILS IN THE EXPERIMENTAL AND CONTROL GROtJPS
I Region 1 Itnrnetliate post test 1 .\mans meal15 5 0 0 ( 1 I . I I I 50 (>(>
cender i
i - 1
(Environment as covariate)
84J
,
Level o f significance
0 01
0 01
Not significant
sign~ticant Yor
F-ratio
18 48
8 81
0 01
1 78
Mean Squares
475 92
226 96
0 91
45 90
d f
3
1
1
-1 1
Sum of Squares
1427 77
326 96
0 91
137 71
Source of Variation
Among means
Among means
Among nieans
.41nong means
Model Category
One way interaction
(total)
Region
Gender
Twu-wal iiiteractions -- -- Mudcls
region
Test C'ategoq
lnlnlediate posttest
lrnrnediate posttest
Immediate posttest
I~nniedrate pc~st test

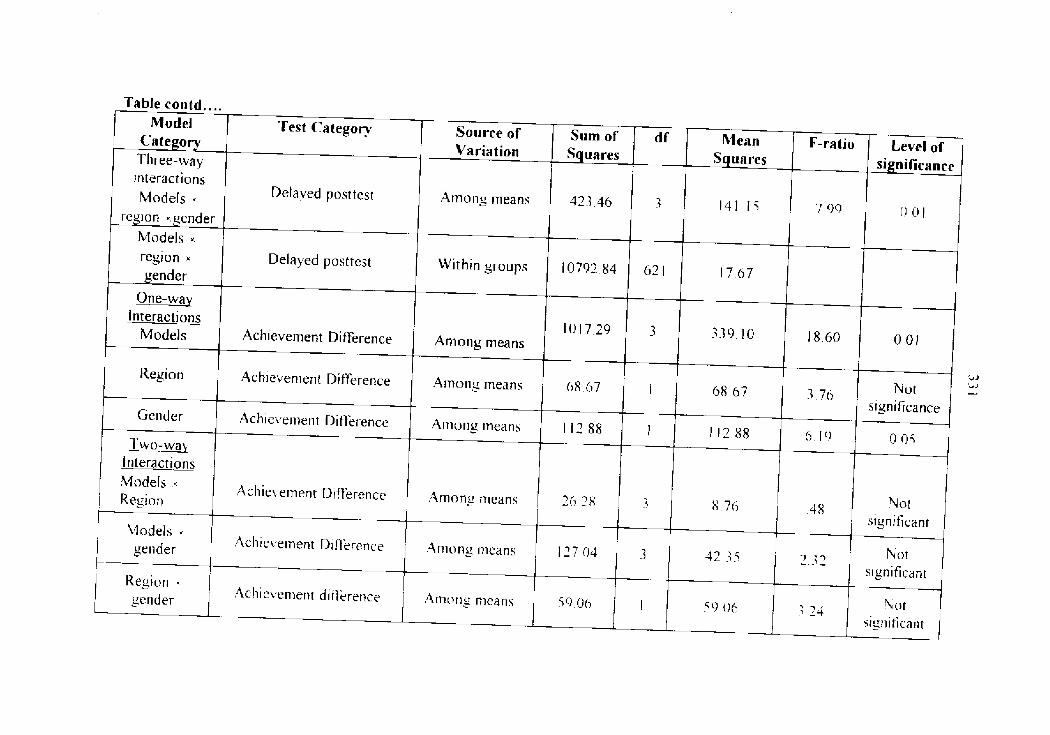


TABLE 5. i 28 ('ONSO1,IDATED RESIILTS OF ANALYSIS OF VA RIAN('E
( A N o V ~ ) FOR POST rEsT SCORES OF PIIP1I.S IN THE EXPERIMENTA j , a ~n ,.- - - -- . I q U twNT
Model Category
'01. CROIJPS
Test Ca tegor,
--- XI
- One waj:
interaction (Models)
Reyioti
Gender
T w o - r n --
interactions hlodels .:
region
Models gender
Soc~rce o f Vimria tion
Immediate posttest
lrrin~ediate posttest
lrnn~ediate posttest
I
t mniediate posttcst
Immediate posttest
ares
I
Sum of
F-mtio Level - -
1 Region - I
Squares
I 7----- -C-------
i Among means 1143 61
df ,/ p\lrsn (SES 3s F0Variste
I I i I I nimediatr postirsr 1 \ , ~ ~ ( x l ~ jl,ra,i,, / gendet, I 4 00 ; I I
I f r - , .... L.
7 .)
I
I
Among niearls
,4 171 u ri= nleans
I :11110ng 111eilrls 2-23 8 1
Aman? ~ncanx 1 5 x0 5,) I
213 23
38 51
I " y U
- i8 1-20
213 23
38 51 'Not
" ~ n i f i c ~ , ~ 2; 'LJ
0 05 I
, ( -; 1 i 9; 5.7
1 1 6 0
1
15 88
8 ,88
78 27
slRnifican ce
(201
0 01
-; 20

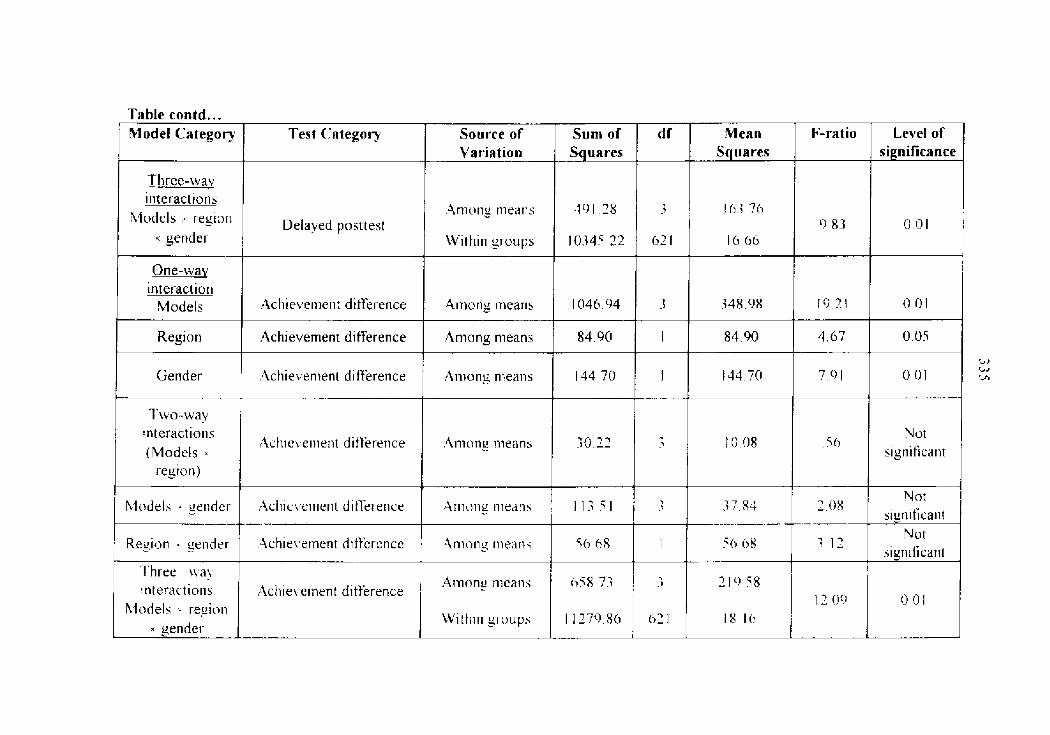

5.5 TENABILI'TY OF THE HYPOTHESES
The ma,jor objective of the study was to compare the efftctiveness 01'
Informatron Processing Models with that of the conventiollal 'I'eaching method in
teachtns C'Jeograpl~y The hypotheses fvrmulated for the study ar-e tested for tenabilir!
in relation to t h e tindinys
Hypothesis I
There i s no significant difierence between the achievement in
Geography oi'the pupils taught by t h e Infi7rmatir7n Processing hltodel (1Ph.l) and that
ut'the pupils taught by the Conventional Method ofteaching.
The result of the experiment clearly iridicated that tl-it. II'M is Inore
effective than C'onvenrional Teaching Method in teaching geugraphy The tindings
are yiven below.
1 Students taught tn the information Processing Models of teachins scored
higher in the immediate posttest In Geography t h a r ~ those under the
Conventiunal Teaching Learnins Method
The t; \,slue obtained from the analysis of cr~var iancc ( .INC'OL'.4) of the
llnmediate posttest scores of the pupils in the experimental (<'.AM. AOhl & ITM)
groups and control (CTLM) group with pretest as covariate is significant at O 0 1 level
(Fy w. for 4/h;.3 -= 57.30. p.-0 01 ) Hence I! can be concluded that Informaticln
Prtxessing Models nf Teaching is superior to Conventional Method of teachrns
2 Studer~ts raughr in the Information Processing Models of* Teach~ns scived
higher in the de la~ed posttest scores in Gengraphv that) those under the

Conventional Method of Teaching. The F ratio obtained In tlic analysis of'
covariance of the delayed post test scores of the pupils in the experiniental
(TAM. . 4 0 M & ITM) groups and control group (C"l'l .hl) with prelest as
cocariare is significant at 0 01 Level (Fy .x for 4/i133= 104 h0. p,- (3 0 1 ) \ v h ~ c h
may be due to higher achievement scores obtained fbr the expel-imental
group. I t was tested for significance of difference between the means of the
posttest scores (Delayed) of the pupils in the experimental Group (C'4M.
AOM & ITM) with control group (C'TL.M) and found to be s i ~ n ~ f i c a n t
.3 Students in the Information Processing Models of Teachin2 scored higher in
the ditt'erence in achievement scores between the immediate and dclaved
posttest scores In Geography than those under rhe C'onventlonal Method of
teaching The F value obtained froni the ar~alvsis of cuvar-1a11c.e ( ANC'O\'.4)
of the difference in achievement between the immediate and delaved posttest
scores of the pupils in the experimet~tal (CAM. . 4 0 M & ITM) group and
CTLM (control) group with pretest as covariate is srsniticatlt at 0 0 I level
(Fy u for 3!h;3= 15-38. p<0.01).
The null Hypothesis i s not accepted on the basis c ~ f the ahcwe t i n d ~ n ~ s
On the other hand the Information Processing hlodels i s fcj'ound be ven effective in
'reaching Geography
Hypothesis I I
There is no significant differerlce between thc adlievernent in
Geography of the pupils taught by three separate models betong~ng to the Infort~lation

Processing Modeis and that of the pupils taught by the (.o~~vent~onal Trach~ng
Learning Method
The result of the experiment clearly indicates that the p~iplls taughr
through Information Processrng Models scored higher than I 'onventlunal Teachlrl9
Learning Method In Teaching Geography
The tindings are given below
a The result of the test of significance of difference between the means of the
post test scores (Immediate) of the pupils in t h e CAM (evptl I ) and (' rL.hl
(control) groups was signrticant (C R value=; 25. pq-0 0 1 1
b The result of the immediate pnsttest scores of thc puptls ~n the AOh1
(exptl 1 1 ) and CTI,M (control) group %as siynlticant ( C' R tillue = 0 72.
p a 0 1 )
c Students under the Experimentai group 111 (1-JM} scored hyher In the
~rntned~ate achievement test in Geography than thust: under the c t~n ten t~c \na l
teach~ng Learning Method (C R va/ue=7 5 3 . p a O 0 5 )
d The result of the test of significance of ditfererlce between the l-nesns of the
delayed post test scores of the pup~ls In the C.4M (euptl I} a ~ l d I"P1,h.l
(control) group was significant (C R Value=7 38 . p. 0 O I
e The result oi' the test of s~gnificance of di tkrence between t h e delaved post
test scores nf the p u p ~ l s in the AOM (esptl 11) and C'?'l.hl (cor~trol) - rirvtip
was s~gnificant (C R value = 15 92, pc- 0 0 1
f The result of the delayed post test scores of the pupils in the 1Th.l (exptl 1 1 1 )
and CTIJM (ct~ntrol) gruup was slgnlficant ( C R l 'a lue-0 ;8 . 1). 0 0 I )
The nulI Hypotheses is not accepted on the basis ot'the above tindings 011 the
other hand the rnodel categories belonging to the Information Processing Models is
fbund tu be very etkctive in Teaching Geography
Hypothesis I l l
There i s 110 significant difference between immediate and delayed
achievement of the experimental and control groups
The results of the experiment clearly indicate that the perfurmar~ce in
Geogr-aphy of the experimental yroup rs siynificarltly higher than r h a ~ of' the control
groups in the immediate and delayed achievement The findings arc given belou
Students belonging to the Informatiun Processing Models of 'l'eaching
scored higher in the difference in achievement between the immediate and delaved
posttest scores In Geography than those under the conventional method of teaching
Students in the Information Process~r~y Models of Teaching scored
higher in the difference in achievement scores between the immediate and delayed
post test scores in Geography than those under the Conventional Method of teaching
The F value obta~ned from the analysis of covariance (.4NCO\;..2) of rhe d~fference in
achievement between t h e immediate and delayed post test scores of the pupils in the
experin~ental (CAM. AOM & ITM) group and CTLM (control) yroup with pretest as
cot,ariate is significant at 0 01 level (Fy.x for 41633- 15 38. p ~ - 0 0 1 )
The rlull Hypothesis is not accepted on the basis of the above findrng:,
O n the other hand the mean scores show that the expenmental gr-oul, 1s in an
advantageous pos~tion in the achievement of Geography that1 the control group
Hypothesis IC'
The main and interaction efyects of independent variables o n the
dependent variable are not significantly higher in the experimental yroup than that ot'
the control group
The results of the experiment clearly indicates that t!ic I K I ~ I I I artd
interaction effect of the independent variables on the dependent tariables are
sisnificantly higher in the experimental group than that of thc control group The
findings are given below,
Students belonging to the Infnrrnatlon Processit~g Models of Teaching
scored higher in the achievement difference between the immediate and delayed post
tesr scores 111 Geography than those under the conventional '1-cachins 1,earnlng
method (CTLM) group considering the combined intluence nt' model categol-ies.
region and sender with pretest as covariate
The F ratio obtained from the analysis of covariance (.4NSI?L'A) of the
difference in achievement scores of the pupils ITI the experimental (C'AII . .40U &
ITM) yroup and (Control) CTLM group by considering the combined infuence of
model categnrles. region and gender with pretest as covarlatt. is crynificant at 0 0 I
lei-el (Fv , x for 16i621 = 8 03. pd -0 01)
The null Hypothesis is not accepted on the bass of the a b o ~ x tindings
On the other hand the main and interaction effect of independent ~a r l ab le are higher
in the experimental Sroup than that of the control yroup