chapter two council activities - western bay of … · 34 | chapter two | council's group of...
TRANSCRIPT
32 | INTRODUCTION | OUR DISTRICT
CHAPTER TWOCouncil Activities

CONTENTS | CHAPTER TWO | 33
CHAPTER TWOCouncil's group of activities 34Council's business scorecard 36LeadershipRepresentation 38Planning for the future 45Building communitiesCommunities 51Recreation and Leisure 62Regulatory services 68Transportation 75Water supply 81Stormwater 91Protecting the environmentNatural environment 97Wastewater 103Solid waste 114Supporting our economyEconomic 120Support services 126

34 | CHAPTER TWO | COUNCIL'S GROUP OF ACTIVITIES
COUNCIL'S GROUP OF ACTIVITIES
GUIDE TO THIS SECTION OF THE ANNUAL REPORTChapter Two - Our achievements reports on how well Council’s activities performed during 2015/16 against the goals and targets set out in Chapter three of the 2015-25 LTP. The reporting covers how effectively services have been delivered to the community and financial results.
Reporting on service performance is provided for each activity group and includes the following information:
OverviewThis provides a high level overview or explanation of the activity and the outcomes agreed in Western Bay of Plenty District Council’s 2015-2025 LTP.
2015/16 highlightsHighlights can include key initiatives undertaken, projects completed, and milestones achieved for the activity. A graph will also be included to show the results and trends for Western Bay Council’s measures for performance and customer satisfaction.
Service performance results• Results trends for key measures• How we have tracked progress towards our goals• How we have tracked progress - levels of service
The 2015-2025 LTP identifies performance measures and targets to monitor Council’s achievement of the agreed outcomes and levels of service. This section reports the results and provides explanation for any significant variances. Results are classified as follows:
Target met
Partial met (within 5% of target)
Not met
Future initiativesThis section looks ahead and identifies key initiatives planned for the next 2-3 years.
Cost of service statementsThe cost of service statement shows financial information for that activity, comparing actual expenditure against budget and the previous year’s actual. The statements provide details of income and expenditure and, where relevant, capital expenditure.
Major variancesWhere there are major variances between actual expenditure and budget a further explanation is provided.
Customer satisfactionIn the statements of service performance there are references to an Annual Resident Survey.
This survey was undertaken by Key Research and the sample included all residents within the Western Bay of Plenty District Council area with a sample size of 726 and margin of error of +/- 3.6%, with a confidence level of 95%.
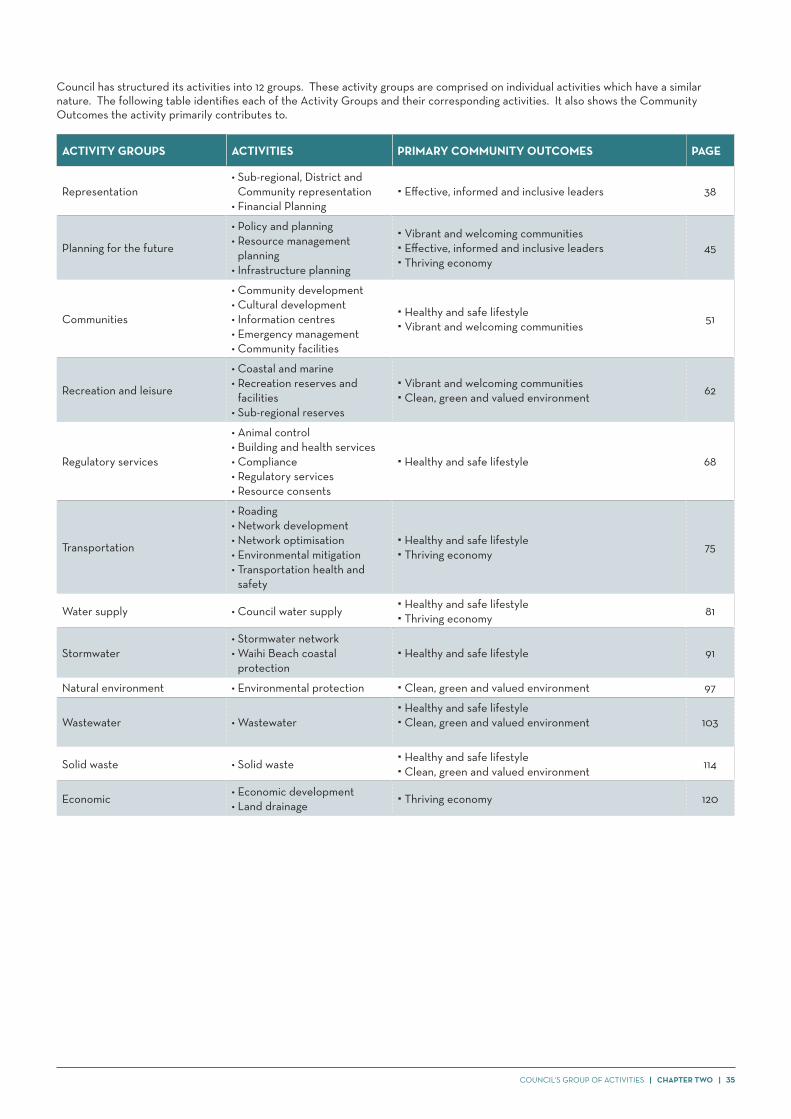
Effects on community wellbeingThe table overleaf identifies the activity groups and their primary contribution to the Community Outcome.
The Long Term Plan (LTP) has identified significant or potential negative effects that may occur as a result of providing the following activities:
• Wastewater• Solid waste• Communities (Interment)• Transportation• Water supply• Stormwater• Economic
COUNCIL'S GROUP OF ACTIVITIES | CHAPTER TWO | 35
ACTIVITY GROUPS ACTIVITIES PRIMARY COMMUNITY OUTCOMES PAGE
Representation• Sub-regional, District and
Community representation• Financial Planning
Effective, informed and inclusive leaders 38
Planning for the future
• Policy and planning• Resource management
planning• Infrastructure planning
Vibrant and welcoming communities Effective, informed and inclusive leaders Thriving economy
45
Communities
• Community development• Cultural development• Information centres• Emergency management• Community facilities
Healthy and safe lifestyle Vibrant and welcoming communities 51
Recreation and leisure
• Coastal and marine• Recreation reserves and
facilities• Sub-regional reserves
Vibrant and welcoming communities Clean, green and valued environment 62
Regulatory services
• Animal control• Building and health services• Compliance• Regulatory services• Resource consents
Healthy and safe lifestyle 68
Transportation
• Roading• Network development• Network optimisation• Environmental mitigation• Transportation health and
safety
Healthy and safe lifestyle Thriving economy 75
Water supply • Council water supply Healthy and safe lifestyle Thriving economy 81
Stormwater• Stormwater network• Waihi Beach coastal
protection Healthy and safe lifestyle 91
Natural environment • Environmental protection Clean, green and valued environment 97
Wastewater • Wastewater Healthy and safe lifestyle Clean, green and valued environment 103
Solid waste • Solid waste Healthy and safe lifestyle Clean, green and valued environment 114
Economic • Economic development • Land drainage Thriving economy 120
Council has structured its activities into 12 groups. These activity groups are comprised on individual activities which have a similar nature. The following table identifies each of the Activity Groups and their corresponding activities. It also shows the Community Outcomes the activity primarily contributes to.
36 | CHAPTER TWO | COUNCIL'S BUSINESS SCORECARD
1.
2.
3.
4.
5.
7.
6.
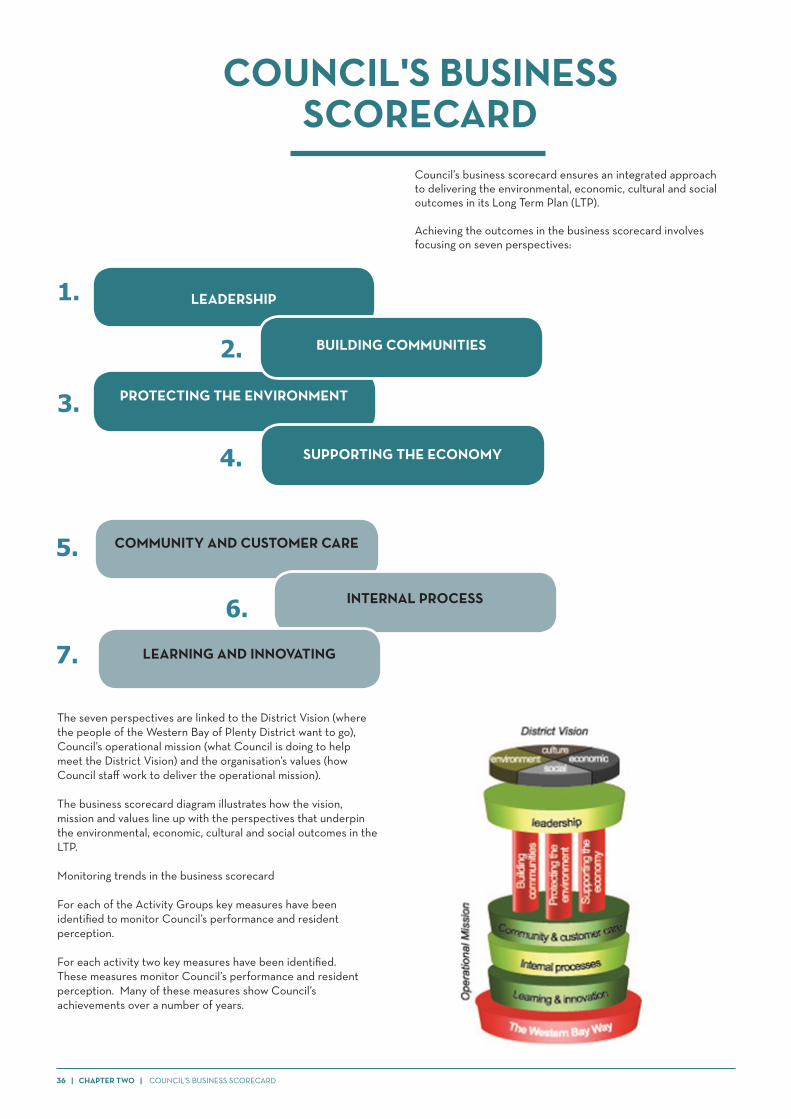
The seven perspectives are linked to the District Vision (where the people of the Western Bay of Plenty District want to go), Council’s operational mission (what Council is doing to help meet the District Vision) and the organisation’s values (how Council staff work to deliver the operational mission).
The business scorecard diagram illustrates how the vision, mission and values line up with the perspectives that underpin the environmental, economic, cultural and social outcomes in the LTP.
Monitoring trends in the business scorecard
For each of the Activity Groups key measures have been identified to monitor Council’s performance and resident perception.
For each activity two key measures have been identified. These measures monitor Council’s performance and resident perception. Many of these measures show Council’s achievements over a number of years.
Council’s business scorecard ensures an integrated approach to delivering the environmental, economic, cultural and social outcomes in its Long Term Plan (LTP).
Achieving the outcomes in the business scorecard involves focusing on seven perspectives:
PROTECTING THE ENVIRONMENT
BUILDING COMMUNITIES
LEADERSHIP
SUPPORTING THE ECONOMY
COMMUNITY AND CUSTOMER CARE
INTERNAL PROCESS
LEARNING AND INNOVATING
COUNCIL'S BUSINESS SCORECARD
XXX | CHAPTER TWO | 37
REPRESENTATION

38 | CHAPTER TWO | REPRESENTATION
OVERVIEW The Representation Strategy underpins Council’s democratic processes and provides the community and the organisation with leadership and direction. The Strategy informs decisions about our representation arrangements, for example, the number of wards and their boundaries, community boards and number of Councillors.
REPRESENTATION
WHY WE PROVIDE IT OUR COMMUNITY OUTCOMELeaders are informed by the views of residents to make effective decisions which improve our communities and environment, now and for the future.
OUR GOALS• We have effective representation arrangements for our communities
• We engage with our communities, listen well, lead effectively and make well informed decisions
• We actively seek and consider the full range of residents’ views on our plans, policies and projects
• We have strong relationships with Tangata Whenua and work together in a range of ways so that Tangata Whenua perspectives inform our decisions
• Our strategic relationships at all levels are maintained and strengthened
• Our financial management is prudent, effective and efficient.
2015/2016 HIGHLIGHTSGrowth has been the most pressing issue this year as the Western Bay has experienced an influx of permanent residents from Auckland and elsewhere. This is a complete turnaround from the dormancy of the previous six years during the Global Financial Crisis. We are in the fortunate position of having invested heavily over the past 15 years in wastewater, water and stormwater infrastructure to cater for future growth. While this investment put Council in considerable debt – it is now in a strong position to cope with development demand and in so doing reduce its debt through the increased income from development activity.
It has been a significant year for progressing longer term projects that provide major assets for our communities in the future. Population and development growth in the Western Bay has been escalating over the past year and elected members are continually lobbying the case of Western Bay with Central Government. Significant achievements include:
• The opening in August of the Tauranga Eastern Link. A $455 million NZ Transport Agency project of 21 kilometres, four-lane, median divided highway between Tauranga and Paengaroa. The Tauranga Eastern Link is the second of seven Roads of National Significance (RoNS)
• A $3.8 million funding boost from Central Government for the Urban Cycleways’. This was well-timed in the wake of our Council and Tauranga City agreeing to fund parts of the Tauranga Moana Cycleway over the next 10 years. Our Council decided to put $3m ($300,000 a year) in our Long Term Plan 2015-2025 toward the three planned cycle routes – Omokoroa to Tauranga, Maketu to Paengaroa and Waihi to Waihi Beach
• Launched the first section of Western Bay Cycleways in Paengaroa with Transport Minister Simon Bridges. This is the first section of the $600,000 Papamoa to Paengaroa Trail that will eventually run from Te Tumu Road and follow the Te Puke Highway into Paengaroa. Council also signed a Memorandum of Understanding with Hauraki District Council for a cycleway from Waihi Beach to Waihi to link with the Hauraki Cycle Trail
• NZ Transport Agency’s $591 million transport package for State Highway 2 between Te Puna and Katikati, to grow industry and jobs, improve safety and support economic development and population growth. Our Council is continually working with the Transport Agency to prioritise local projects that will improve the safety and travel times for our commuters
• Omokoroa has been designated as a Special Housing Area (SHA) under the Housing Accord. Council signed the Housing Accord with Government in August 2015. Omokoroa is one of the District’s growth areas in which Council has already invested substantial infrastructure to cater for a future population capacity of 12,000.
A recent change in the Local Government Act removed the requirement for councils to consult on their annual plan if there is no material or significant difference from the LTP. However elected members chose to hold numerous workshops and Annual Plan sessions leading up to the 2016/17 Annual Plan where the public were welcomed for round-the-table informal discussions. This was well received by our communities and resulted in constructive conversations with a wide range of people in our communities.

REPRESENTATION | CHAPTER TWO | 39
Maketu
WHAT WE PROVIDEREPRESENTATION IS PROVIDED BY:
11
Waihi Beach
Athenree
Katikati
Pukehina Beach
Paengaroa
TAURANGA CITY
OmokoroaTe Puna
Te Puke
1 MAYOR
COUNCILLORS
5COMMUNITY BOARDS
2Participation in a range ofCOMMUNITY ORGANISATIONS, BOARDS & CO-GOVERNANCE STRUCTURES within the Western Bay of Plenty District
PARTNERSHIP FORUMSComprising iwi and hapu representatives
40 | CHAPTER TWO | REPRESENTATION
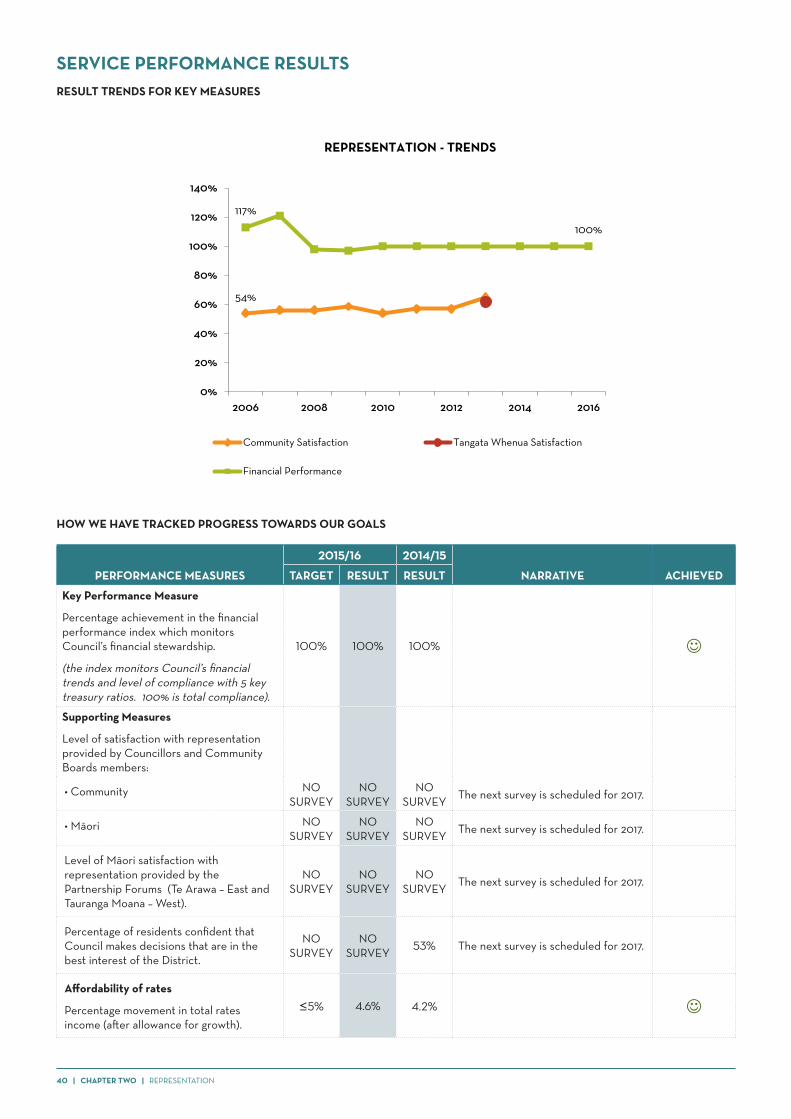
SERVICE PERFORMANCE RESULTSRESULT TRENDS FOR KEY MEASURES
HOW WE HAVE TRACKED PROGRESS TOWARDS OUR GOALS
PERFORMANCE MEASURES
2015/16 2014/15
NARRATIVE ACHIEVEDTARGET RESULT RESULT
Key Performance Measure
Percentage achievement in the financial performance index which monitors Council’s financial stewardship.
(the index monitors Council’s financial trends and level of compliance with 5 key treasury ratios. 100% is total compliance).
100% 100% 100%
Supporting Measures
Level of satisfaction with representation provided by Councillors and Community Boards members:
• Community NO SURVEY
NO SURVEY
NO SURVEY The next survey is scheduled for 2017.
• Māori NO SURVEY
NO SURVEY
NO SURVEY The next survey is scheduled for 2017.
Level of Māori satisfaction with representation provided by the Partnership Forums (Te Arawa – East and Tauranga Moana – West).
NO SURVEY
NO SURVEY
NO SURVEY The next survey is scheduled for 2017.
Percentage of residents confident that Council makes decisions that are in the best interest of the District.
NO SURVEY
NO SURVEY 53% The next survey is scheduled for 2017.
Affordability of rates
Percentage movement in total rates income (after allowance for growth).
≤5% 4.6% 4.2%
54%
117%
100%
0%
20%
40%
60%
80%
100%
120%
140%
2006 2008 2010 2012 2014 2016
REPRESENTATION - TRENDS
Community Satisfaction Tangata Whenua Satisfaction
Financial Performance
REPRESENTATION | CHAPTER TWO | 41
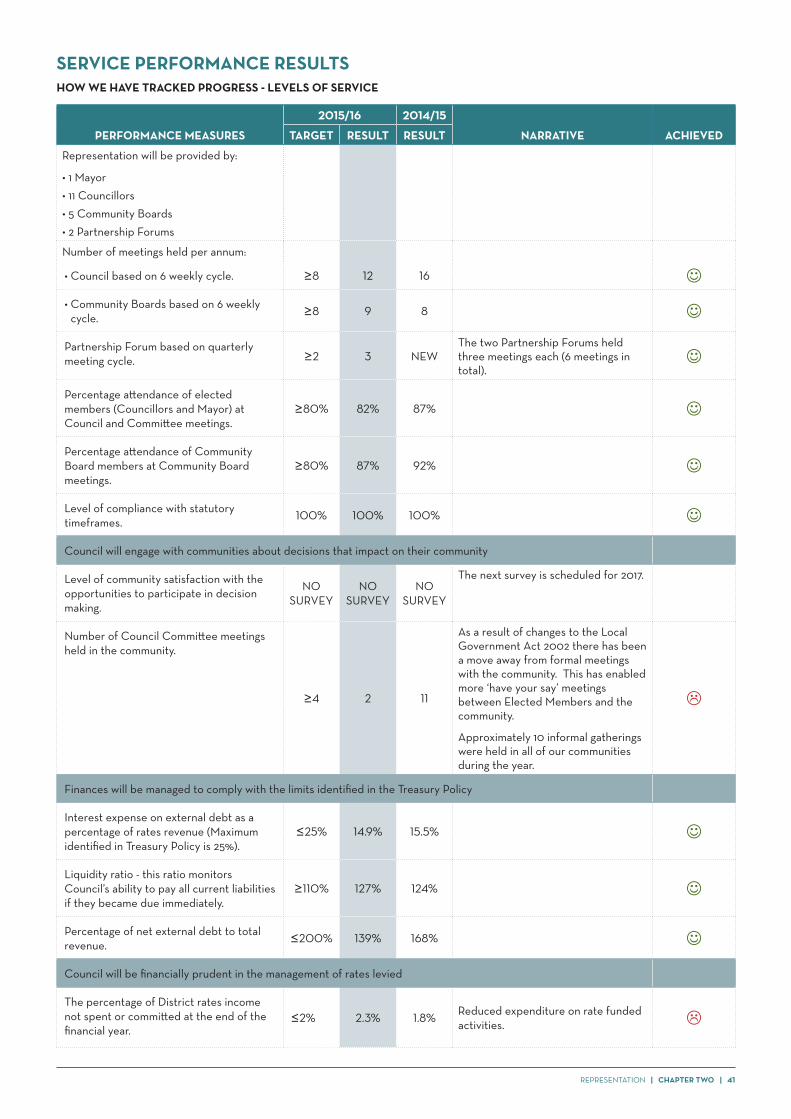
SERVICE PERFORMANCE RESULTSHOW WE HAVE TRACKED PROGRESS - LEVELS OF SERVICE
PERFORMANCE MEASURES
2015/16 2014/15
NARRATIVE ACHIEVEDTARGET RESULT RESULT
Representation will be provided by:
• 1 Mayor• 11 Councillors• 5 Community Boards• 2 Partnership Forums
Number of meetings held per annum:
• Council based on 6 weekly cycle. ≥8 12 16 • Community Boards based on 6 weekly
cycle. ≥8 9 8
Partnership Forum based on quarterly meeting cycle. ≥2 3 NEW
The two Partnership Forums held three meetings each (6 meetings in total).
Percentage attendance of elected members (Councillors and Mayor) at Council and Committee meetings.
≥80% 82% 87%
Percentage attendance of Community Board members at Community Board meetings.
≥80% 87% 92%
Level of compliance with statutory timeframes. 100% 100% 100%
Council will engage with communities about decisions that impact on their community
Level of community satisfaction with the opportunities to participate in decision making.
NO SURVEY
NO SURVEY
NO SURVEY
The next survey is scheduled for 2017.
Number of Council Committee meetings held in the community.
≥4 2 11
As a result of changes to the Local Government Act 2002 there has been a move away from formal meetings with the community. This has enabled more ‘have your say’ meetings between Elected Members and the community.
Approximately 10 informal gatherings were held in all of our communities during the year.
Finances will be managed to comply with the limits identified in the Treasury Policy
Interest expense on external debt as a percentage of rates revenue (Maximum identified in Treasury Policy is 25%).
≤25% 14.9% 15.5%
Liquidity ratio - this ratio monitors Council’s ability to pay all current liabilities if they became due immediately.
≥110% 127% 124%
Percentage of net external debt to total revenue. ≤200% 139% 168%
Council will be financially prudent in the management of rates levied
The percentage of District rates income not spent or committed at the end of the financial year.
≤2% 2.3% 1.8% Reduced expenditure on rate funded activities.

42 | CHAPTER TWO | REPRESENTATION
FUTURE INITIATIVESWe will continue to:
• Engage with ratepayers, residents and other stakeholders in each of our communities. This outreach is achieved through our Community Committee and has proven to be an extremely effective way of bringing elected members and their communities around the table to discuss issues of concern and interest
• Represent the District in regard to matters of sub-regional importance such as the growth management strategy SmartGrowth and the Bay of Plenty Regional Strategy (Bay of Connections)
• Work alongside the economic development agency Priority One and Bay of Plenty Tourism to promote the sub-region’s economic and tourism benefits
• Support economic and tourist organisations within our own District (Katch Katikati; Waihi Beach Events and Promotions, Te Puke Economic Development Group) to ensure there is synergy between all agencies promoting the economic and tourist benefits of the sub-region
• Progress initiatives with Central Government including transportation improvements; affordable housing programmes and the Government’s local government reform programme.

REPRESENTATION | CHAPTER TWO | 43
COST OF SERVICE STATEMENTREPRESENTATION
ACTUAL$’000
BUDGET$’000
ACTUAL$’000
2016 2016 2015
Analysis of expenditure by activity
Representation 2,834 2,943 2,395
Total operating expenditure 2,834 2,943 2,395
Analysis of expenditure by class
Direct costs 1,503 1,671 1,471
Overhead costs 1,323 1,264 912
Depreciation 8 8 12
Total operating expenditure 2,834 2,943 2,395
Analysis of funding required
Community Board 392 388 551
Other income 5 - 2
Total revenue 397 388 553
Net cost of service - surplus/(deficit) (2,437) (2,555) (1,842)
Capital expenditure - -
Total other funding required (2,437) (2,555) (1,842)
Other funding provided by
General rate 2,493 2,555 1,943
Reserves and future surpluses (56) - (101)
Total other funding 2,437 2,555 1,842
MAJOR VARIANCESAdditional General Rate to fund overhead allocation.

44 | CHAPTER TWO | XXX
PLANNING FOR THE FUTURE

PLANNING FOR THE FUTURE | CHAPTER TWO | 45
OVERVIEW The Planning for the Future activity includes policy and planning, resource management and infrastructure planning activities. These activities plan for the future guided by our sustainable development approach and the SmartGrowth Strategy.
SMARTGROWTH - AN OVERVIEWSmartGrowth is the growth management strategy for the western Bay of Plenty sub-region. The sub-region encompasses both the Western Bay of Plenty District and Tauranga City. This area has experienced rapid population growth since the 1950s.
PLANNING FOR THE FUTURE
WHY WE PROVIDE ITOUR COMMUNITY OUTCOMEIn consultation with our communities and guided by our sustainable development approach, we plan for the future.
OUR GOAL• Develop, monitor, review and advocate policy and plans that support the achievement of our vision for the District, our community
outcomes and the direction provided by SmartGrowth.
2015/2016 HIGHLIGHTSDuring the year the District experienced a significant level of growth. In response to this we completed a review of our structure plans for Waihi Beach, Katikati and Te Puke. These reviews ensured the plans were updated to respond to the growth and development in those areas. We also experienced a significant increase in the 'Package of Plan' meetings that we have with developers.
SmartGrowth is a key component in the management of growth within the Bay of Plenty sub-region. In collaboration with Tauranga City Council, Bay of Plenty Regional Council, Tangata Whenua and key agencies we continued to update the various strategy components in response to growth throughout the sub-region. The review of the SmartGrowth Settlement Pattern review resulted in an investigation into options for the Western Corridor and the Keenan Road urban growth area. We continue to work on this with our partners and once the areas are chosen structure plans will be prepared. We also provided input into the compact city and Te Tumu projects.
We are also involved with the establishment of the SmartGrowth Social Infrastructure Providers Forum which aims to improve coordination of social infrastructure planning amongst providers. We have also been involved in overseeing research undertaken to give voices to those not normally heard by local government and SmartGrowth i.e. Māori, youth and immigrants.
Housing affordability has become a significant issue. Government introduced legislation to facilitate Council’s ability to create Special Housing Areas (SHA). This initiative is progressing as we have identified a development partner and anticipate construction will commence in 2016/17. It is anticipated that this subdivision will ultimately provide 255 homes. SmartGrowth is also initiating an affordable housing pilot project within the Omokoroa special housing area to demonstrate to developers, the building industry, and the public good quality affordable housing.
In response to changes in Government legislation we continue to collaborate with Bay of Plenty Councils to represent the interests of the Bay. This includes the Resource Legislation Amendment Bill where we made a joint presentation to the Select Committee. We anticipate their decision will be released
in September 2016. We also made submissions to the National Policy Statement on Urban Capacity which will impact on our current monitoring activity and the SmartGrowth Settlement Pattern Review.
Other District Plan changes and planning reviews included:
• A private plan change for the Rangiuru Business Park• The Coastal Hazard review which resulted in plan changes to
reflect the requirements of the NZ Coastal Policy Statement and increased knowledge in regard to environmental changes. Our three partner Councils have developed an agreed charter and framework for programme alignment in our planning approaches to coastal hazards
• A review of Financial Contributions to achieve affordable smaller lots. This plan change has been notified and 14 submissions were received. Hearings will be held in August 2016
• Investigations commenced in the supply of accommodation for seasonal workers. In collaboration with industry, community and government departments we are currently identifying issues.
We are nearing the completion of the Te Ara Mua plan. This plan is being developed by the two Partnership Forums, Tauranga Moana and Te Arawa Ki Takutai. This plan will determine priorities for the Partnership Forum’s to work on with Council to better meet the needs of Māori in the District.
Our ‘Healthy Whare’ project continued. This is a three year pilot project where 89 homes were assessed in the Maketu area and resulted in major repairs to 14 homes, many homes have had insulation installed and minor repairs undertaken. This is another collaborative initiative in which Te Runanga o Ngati Whauae ke Maketu, Te Puna Kokiri, Bay Trust, the Bay of Plenty District Health Board, public health, sustainability options and Council have worked together and provided funding. Related to this is ‘Project Wai Ora’ which is an initiative to address water, wastewater and housing conditions in five highly deprived Māori communities in the District. We led a delegation including the Bay of Plenty Regional Council, Community Representatives, and Public Health to Wellington to meet with Ministers from Social Development, Māori Development, Ministry of Health and our local Members of Parliament.

46 | CHAPTER TWO | PLANNING FOR THE FUTURE
INFRASTRUCTURE PLANNING ACTIVITIES
RESOURCE MANAGEMENT
WHAT WE PROVIDEPLANNING FOR THE FUTURE INCLUDES:
POLICY & PLANNING
The focus being to identify solutions and work collaboratively with the communities involved. We continued to review our plans, policies and by-laws. This included:
• Freedom Camping Bylaw review. The focus was Anzac Bay to address tensions between freedom campers and locals/day visitors resulting from freedom camping
• Dog Control Policy and Bylaw – our community engagement resulted in successful ‘Dog Day Outs’ and a dog walk at Te Puna Quarry Park
• Liquor Ban Bylaw review which resulted in establishing a liquor ban in the Te Puke Town Centre
• Kaimai Reserves Management Plan review• Rates Remission Policy review.

PLANNING FOR THE FUTURE | CHAPTER TWO | 47
SERVICE PERFORMANCE RESULTSRESULT TRENDS FOR KEY MEASURES
HOW WE HAVE TRACKED PROGRESS TOWARDS OUR GOALS
PERFORMANCE MEASURES
2015/16 2014/15
NARRATIVE ACHIEVEDTARGET RESULT RESULT
Key Performance MeasurePercentage completion of the annual work programme as identified in the Leadership - Planning for the Future Strategy and Action Plan
≥90% 94% 96%
Key Resident MeasureResident satisfaction with the impact of growth on:
• Range of housing choices• Personal safety• Time taken to travel around their area• Employment opportunities• Road safety• Overall pleasantness.*Based on a two yearly surveys.
≥75% 66% 72%
The target and result were calculated excluding those surveyed who ‘don’t know’. The survey result including those that don’t know is 63%.
The survey revealed that growth has had a significant negative effect on the range of housing choices, travel time and road safety.
*Due to the 2015-2025 Long Term Plan there was a change of sequence. Surveys will be held on a two yearly basis.
77%
94%
79%
66%
0%
20%
40%
60%
80%
100%
120%
2006 2008 2010 2012 2014 2016
PLANNING FOR THE FUTURE - TRENDS
Actions Completed by Council Resident Satisfaction - Impact of Growth

48 | CHAPTER TWO | PLANNING FOR THE FUTURE
HOW WE HAVE TRACKED PROGRESS - LEVELS OF SERVICE
PERFORMANCE MEASURES
2015/16 2014/15
NARRATIVE ACHIEVEDTARGET RESULT RESULT
District Plan updated to meet the needs of our District
Number of sustained challenges by the Environment Court to District Plan changes.
NIL NIL NILPlan Change 65 Matakana Island decision ruled in Council’s favour.
Structure Plans are developed and reviewed to ensure there is ‘greenfield’ land to accommodate growth. ≥5
YEARS SUPPLY
11.5≥5
YEARS SUPPLY
During the year the Waihi Beach and Katikati structure plans were reviewed. The supply of greenfields remaining for each community:• Waihi Beach - 5.1 years • Katikati - 16.1 years• Omokoroa - 10.7 years• Te Puke - 14.6 years.
Our strategies are aligned with direction provided in SmartGrowth Strategy
Percentage of Council’s strategies aligned with SmartGrowth direction. 100% 100% 100%
We will work with communities to develop and review Community Development Plans. These detailed plans set the vision for the community and actions required to achieve it
The number of community plans developed or reviewed where Council has provided support to the community.
≥1 1 1The Te Puke Community Plan was completed and successfully launched in February 2016.
FUTURE INITIATIVESWe anticipate growth will continue within the district. As a result we will continue to review and update our plans, urban growth studies and structure plans. This will include the finalisation and implementation of the Settlement Pattern review (a SmartGrowth initiative), and the review of the Katikati urban growth study with the objective of providing more urban land.
We will be working through the Environment Court appeal process in regard to the Rangiuru Business Park private plan change and the Regional Coastal Environment Plan in regard to Matakana Island’s outstanding natural features and landscapes.
Work will continue with the implementation of Te Ara Mua as well as the development of a policy to define an approach for the transfer / co-management of Council land.
Other scheduled reviews include:• Seasonal worker accommodation – identification and
assessment of options to address issues
• Coastal and Harbour Erosion Policy
• Waste Management & Minimisation Plan
• Gambling Class 4 and TAB venues Policy review
• Long Term Plan 2018 – 2028, preparatory work on our Community Engagement approach.

PLANNING FOR THE FUTURE | CHAPTER TWO | 49
COST OF SERVICE STATEMENTPLANNING FOR THE FUTURE
ACTUAL$’000
BUDGET$’000
ACTUAL$’000
2016 2016 2015
Analysis of expenditure by activity
Policy and planning 1,017 1,140 1,405
Resource management 923 1,055 1,392
District development (27) (160) (27)
Total operating expenditure 1,913 2,035 2,770
Analysis of expenditure by class
Direct costs 1,233 1,329 2,073
Overhead costs 672 696 691
Depreciation 8 10 6
Total operating expenditure 1,913 2,035 2,770
Revenue
Target rates 13 - 13
Other income 1 - 20
Total revenue 14 - 33
Net cost of service - surplus/(deficit) (1,899) (2,035) (2,737)
Capital expenditure - - 12
Total other funding required (1,899) (2,035) (2,749)
Other funding provided by
General rate 1,939 2,195 2,349
Reserves and future surpluses (40) (160) 400
Total other funding 1,899 2,035 2,749
MAJOR VARIANCESExpenditure on strategic planning was $388k lower than last year which included two major projects - policy review and investigations for coastal erosion and land instability $92k, and expenditure associated with the Long Term Plan development and adoption $124k.
Expenditure on Resource management was $472k lower than last year which included $74k spent on coastal hazards line review.
Direct costs were lower than budget with salary savings of $183k due to resource reallocations.

50 | CHAPTER TWO | XXX
COMMUNITIES

COMMUNITIES | CHAPTER TWO | 51
OVERVIEW The importance of sustainable, resilient communities is paramount. In these communities residents feel included, support and look out for each other, influence decisions that affect them, collaborate to achieve the collective good and foster tolerance and acceptance of others.
Sustainable and resilient communities need strong social and cultural infrastructure to be able to respond to challenges and changes in society. We aim to ensure that the things needed for individuals, families, groups and communities to meet their social needs, maximise their potential for development and enhance their well-being are in place, such as community facilities, services and networks or social infrastructure. Not all social infrastructure in a community is provided by Council but we make a significant contribution to community well-being in the following ways:• Providing places to learn, meet and socialise, for example halls and libraries
(for further information see Libraries and Service Centres page 140 and Community Facilities page 149 in our Long Term Plan 2015-2025)• Supporting communities through a range of community building activities (for further information see the Community Building section
page 129 in our Long Term Plan 2015-2025)• Encouraging communities to be prepared and able to look after themselves in a civil defence emergency (for further information see the
Civil Defence and Emergency Management section page 162 in our Long Term Plan 2015-2025).
COMMUNITIES
WHY WE PROVIDE IT OUR COMMUNITY OUTCOMESocial infrastructure (community facilities, services and networks that help individuals, families, groups and communities) meets the diverse needs of communities; communities are strong and can influence their futures.
OUR GOALS• Communities are healthy and safe• Communities are vibrant and diverse• Communities participate in the development of their futures.
2015/2016 HIGHLIGHTSThe Katikati Library and Community Hub was an important focus for us this year. In year one of this project we undertook the necessary planning and initiated a community engagement process in order to identify and define what was required. A Community Reference Group has worked closely with us to identify requirements, assist with community engagement, and provide inputs to the concept plan.
Council has committed to funding the library development, but in order to fund a community hub we had to apply to other funding providers. NZ Lotteries provided a grant of $350k which was matched by the Katikati Community Board. This funding is for the development of a community hub. Key conditions of the grant is that it needs to be a technology enabled space which will fill a void for young people, provide an exhibition and display space as well as a community meeting space. The community hub is a flexible space for the community and there will be no one tenant.
Our libraries continued to develop programmes to respond to identified needs in communities. The Te Puke Library has extended their holiday programme to include other activities for all ages in our community. For example, a Lego club was established at the request of a young customer, and tablet classes held for the retired.
We continued to review and enhance the services provided. In collaboration with other Bay of Plenty Councils we outsourced the selection, cataloguing and processing of our collections including our e-collection and are working with consortium partners to be in a position to invite schools within our district to share our online content.
In May we launched our archive software, ‘Recollect’. This currently contains Katikati community archives, documents and images which are accessible to the community. There are plans to grow the database to include archives from the wider district; individuals are invited to add to the archives knowledge base.
This was the first year of our Community Matching Fund. This fund replaced the Community Grants and is designed to support communities and promote stronger community input in the development of their various projects and initiatives. Applications are considered on a 50:50 basis. In this first year, a process was developed to administer the fund and the allocation of the $99,000 budget. A total of 42 applications were received from throughout the district and 33 of these applications were successful in obtaining funds.
The review of the Te Puke Community Plan was completed and successfully launched in February 2016. The Te Puke Community Board led this project with support from us. The process engaged a wide and comprehensive list of participants and provided the opportunity for community led development and planning for Te Puke.

52 | CHAPTER TWO | COMMUNITIES
We continued our support and work in regard to community safety. Key initiatives included:
• A Youth in Emergency Services (YES) programme was launched in Katikati and Maketu. This engages all local emergency services and identifies 30 local youth to train in aspects of all emergency services. The purpose of this is to support building resilient communities and inspire youth leadership in the community. We were able to secure funding from the Ministry of Youth Development to make it happen
• The Katikati Resource Centre launched MPOWA a youth initiative to support youth development and encourage collaboration of local service providers. Council partnered with the Resource Centre and provided funding for the facilitation and advocacy support resulting in the development of a local Youth Action Plan. One of the main goals of this plan is to develop a local youth centre
• In Katikati the Māori Wardens are the Youth at Risk service provider. We are able to provide support and advice as well as advocacy for funding and funding grants. As a result the Māori Wardens are able to provide support to families and youth at risk
• Safer Community Forums have been operating since 2001. These forums provide the opportunity for community safety practitioners to meet and identify priorities. Council continued to provide a facilitation and advocacy role
• We partnered in the sub regional approach to the safer communities forum. The Tauranga Moana Safe City programme is a collaboration for those in community safety. The Emergency Services, Health, ACC and Councils are involved in the governance of this initiative.
The Special Housing Act 2013 was implemented to enhance housing affordability by facilitating an increase in land and housing supply in certain areas. Western Bay was highlighted in schedule one of the act as having significant housing affordability and supply issues. We commenced work on the development of a Special Housing Area on land owned by Council in Omokoroa. We have entered into a joint venture with a developer to build properties on Council’s land. During the year we completed the necessary planning stage and construction will commence in the new financial year. In conjunction with this we have allocated 4000m2 for the Housing Affordability Forum to develop a social housing pilot.
Due to the increased demand in rental property and for pensioner tenancy we have achieved near 100% of potential occupancy. The operation of the pensioner housing facilities has been impacted by the review of the Residential Tenancies Act 1986 which came into effect on 1 July 2016. Our Good Landlord Policy has ensured we have been proactive in upgrading the insulation of units where required, ensuring fire alarms are installed and implemented a methamphetamine testing regime which already meets the Act’s requirements.

COMMUNITIES | CHAPTER TWO | 53
SPORT BAY OF PLENTY
WHAT WE PROVIDE - COMMUNITY BUILDINGSERVICE DELIVERY CONTRACTS
OVERVIEWWorking with our communities and local organisations we achieve healthy, safe, vibrant and diverse communities. Our Community Development Team is fundamental to achieving this outcome.
Katikati DAVE HUME SWIMMING POOLTe Puke MEMORIAL SWIMMING POOL
Bay of Plenty SURF LIFESAVING
Te Puke SPORTS FIELD
CREATIVE TAURANGA

54 | CHAPTER TWO | COMMUNITIES
LOCAL HISTORY ARCHIVES
FREE WIFI
ONEHEAD OFFICE with service centre
91,500 ITEMS HELD IN THE FOUR LIBRARIES
FOURLIBRARIES and service centres
251,538LIBRARY ITEMS ISSUED during 1 July 2015 - 30 June 2016
SCHOOL HOLIDAY EVENTS, WEEKLY PROGRAMMES, INTERACTIVE SCHOOL PROGRAMMES
Funding to support KATIKATI RESOURCE CENTRE AND TAURANGA CITIZENS’ ADVICE BUREAU
INFORMATION AND ASSISTANCE TO
INTERNATIONAL AND LOCAL VISITORS from 1 July 2015 - 30 June 2016 at our visitor centres Katikati and Te Puke
12,244
WHAT WE PROVIDE
WHAT WE PROVIDE - LIBRARIES AND SERVICE CENTREOVERVIEWOur libraries fulfil an important community function across the District by informing and encouraging people to meet and socialise. Libraries have been described as well-insulated public squares or ‘community anchors’ demonstrating their value as important community assets. Libraries can contribute to a sense of belonging by collecting and displaying the history of an area.
27,107USERS OF FREE WIFI during 1 July 2015 - 30 June 2016

COMMUNITIES | CHAPTER TWO | 55
CEMETERIES
KATIKATI Cemetery
MAKETU Cemetery
OROPI Cemetery
TE PUKE Cemetery (and old Te Puke Cemetery where further plots are unavailable)
HOUSING FOR OLDER PEOPLE
34UNITS in Te Puke
17 19UNITS in Katikati
UNITS in Waihi Beach
TE PUNA COMMUNITY CENTRETE PUNA WAR MEMORIAL HALLTE RANGA HALLWAIHI BEACH COMMUNITY CENTREWHAKAMARAMA HALL
HELP SUPPORT COMMUNITY HALLSKAIMAI HALLKATIKATI WAR MEMORIAL HALLOHAUITI HALL OMANAWA HALLOMOKOROA SETTLERS HALLOROPI HALL
PAHOIA COMMUNITY HALLPAENGAROA HALLPUKEHINA BEACH COMMUNITY CENTREPYES PA HALLTE PUKE WAR MEMORIAL HALL & Settlers Lounge & Pioneer Room
WHAT WE PROVIDE - COMMUNITY FACILITIESOVERVIEWPublic spaces and community facilities enable recreation, bring people together and create a sense of belonging, all of which is essential for healthy and vibrant communities. We are a key provider of indoor and outdoor community facilities, for example libraries, parks, playgrounds and halls.

56 | CHAPTER TWO | COMMUNITIES
SUPPORT TO THE EMERGENCY OPERATIONS CENTRE
CIVIL DEFENCE WELFARE CO-ORDINATOR
RESCUE TEAM 2 VEHICLES
RURAL FIRE RESPONSE including for Matakana Island
COUNCIL STAFF trained to respond
WELFARE STAFF
BAY OF PLENTY CIVIL DEFENCE AND EMERGENCY MANAGEMENT GROUP and Plan
WHAT WE PROVIDE - CIVIL DEFENCE AND EMERGENCY MANAGEMENT
OVERVIEWGlobal natural disasters such as the Christchurch earthquakes and tsunami in Japan, combined with the increased frequency of extreme weather events have heightened awareness among Bay of Plenty communities to the risk of tsunami, earthquakes and floods in particular. It is vital that the community and Council are prepared to respond to, effectively manage and recover in emergency situations.

COMMUNITIES | CHAPTER TWO | 57
SERVICE PERFORMANCE RESULTSRESULT TRENDS FOR KEY MEASURES
HOW WE HAVE TRACKED PROGRESS TOWARDS OUR GOALS
PERFORMANCE MEASURES
2015/16 2014/15
NARRATIVETARGET RESULT RESULT
Key Performance MeasurePercentage completion of the annual work programme as identified in the Community Strategy and Action Plan. ≥90% 88% 90%
Target not achieved as works were delayed at Katikati Cemetary and the Marae Maintenance programme. At the District libraries the percentage of total loans that were virtual was 3%, the target was ≥5%.
Key Resident MeasureLevel of resident satisfaction with Community Services based on two-yearly survey. This includes community development, library services and cemeteries. (Monitored by the Annual Residents’ Survey, those that are ‘satisfied’ and ‘very satisfied’).
NO SURVEY
NO SURVEY 83%
The next survey is scheduled for 2017.
95%
88%
58%
83%
0%
20%
40%
60%
80%
100%
2006 2008 2010 2012 2014 2016
COMMUNITIES - TRENDS
Actions Completed by Council Resident Satisfaction
58 | CHAPTER TWO | COMMUNITIES
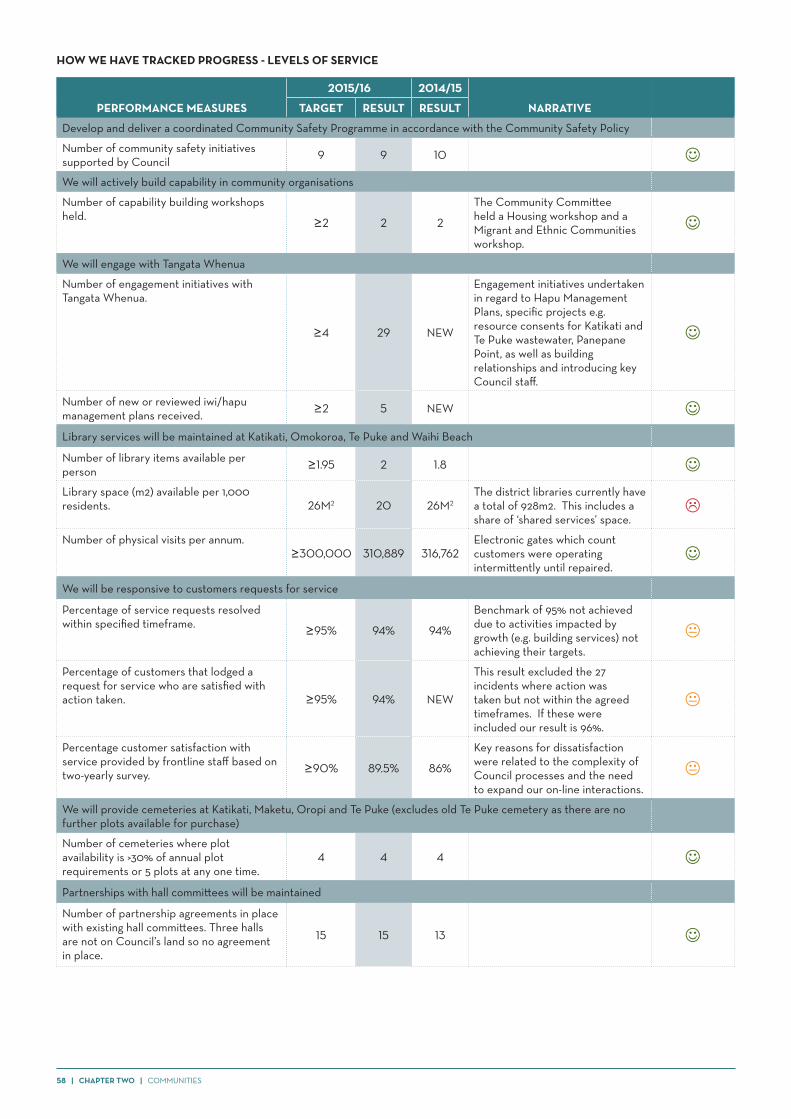
HOW WE HAVE TRACKED PROGRESS - LEVELS OF SERVICE
PERFORMANCE MEASURES
2015/16 2014/15
NARRATIVETARGET RESULT RESULT
Develop and deliver a coordinated Community Safety Programme in accordance with the Community Safety Policy
Number of community safety initiatives supported by Council 9 9 10 We will actively build capability in community organisations
Number of capability building workshops held. ≥2 2 2
The Community Committee held a Housing workshop and a Migrant and Ethnic Communities workshop.
We will engage with Tangata Whenua
Number of engagement initiatives with Tangata Whenua.
≥4 29 NEW
Engagement initiatives undertaken in regard to Hapu Management Plans, specific projects e.g. resource consents for Katikati and Te Puke wastewater, Panepane Point, as well as building relationships and introducing key Council staff.
Number of new or reviewed iwi/hapu management plans received. ≥2 5 NEW Library services will be maintained at Katikati, Omokoroa, Te Puke and Waihi Beach
Number of library items available per person ≥1.95 2 1.8 Library space (m2) available per 1,000 residents. 26M2 20 26M2
The district libraries currently have a total of 928m2. This includes a share of ‘shared services’ space.
Number of physical visits per annum.≥300,000 310,889 316,762
Electronic gates which count customers were operating intermittently until repaired.
We will be responsive to customers requests for service
Percentage of service requests resolved within specified timeframe. ≥95% 94% 94%
Benchmark of 95% not achieved due to activities impacted by growth (e.g. building services) not achieving their targets.
Percentage of customers that lodged a request for service who are satisfied with action taken. ≥95% 94% NEW
This result excluded the 27 incidents where action was taken but not within the agreed timeframes. If these were included our result is 96%.
Percentage customer satisfaction with service provided by frontline staff based on two-yearly survey. ≥90% 89.5% 86%
Key reasons for dissatisfaction were related to the complexity of Council processes and the need to expand our on-line interactions.
We will provide cemeteries at Katikati, Maketu, Oropi and Te Puke (excludes old Te Puke cemetery as there are no further plots available for purchase)
Number of cemeteries where plot availability is >30% of annual plot requirements or 5 plots at any one time.
4 4 4
Partnerships with hall committees will be maintained
Number of partnership agreements in place with existing hall committees. Three halls are not on Council’s land so no agreement in place.
15 15 13

COMMUNITIES | CHAPTER TWO | 59
PERFORMANCE MEASURES
2015/16 2014/15
NARRATIVETARGET RESULT RESULT
Minimum number of notifications (per year) each hall committee will receive regarding annual budget and policy changes.
2 3 1
We will provide and maintain 70 pensioner units in Katikati, Te Puke and Waihi Beach
Percentage of service requests actioned within agreed timeframes. ≥90% 100% 0 Pensioner housing occupancy rates. ≥90% 97% 97% Percentage of pensioner housing annual inspections completed. 100% 100% 73% Emergency Management services will be provided
Percentage of Emergency Operations Centre (EOC) staff trained to operate the emergency operations centre. ≥75% 134% 55%
More people have been trained that are required to operate an Emergency Operations Centre. This ensures there is capacity to manage staff turnover or absences.
Percentage of roles in the Emergency Operation Centre that are filled. ≥75% 75% NEW
The number of positions required for operation of the Emergency Operations centre is 32.
Number of community initiatives to promote emergency readiness and response (i.e. emergency plans and actions identified).
8 8 22
FUTURE INITIATIVESWe will support our communities as they develop their Community Plans. Te Puna and Omokoroa have indicated they will be reviewing their plans in light of the recent development and growth in their respective communities and in the sub region.
In collaboration with the Maketu community and key interest groups we are looking to assist the development of a community hub. We will also continue to provide support, advocacy and funding as we respond to a changing landscape in each of our communities.
Construction of the Special Housing Area will commence in the 2016/17 financial year. We will also continue to look at opportunities to develop land in response the significant growth in the District.

60 | CHAPTER TWO | COMMUNITIES
COST OF SERVICE STATEMENTCOMMUNITIES
ACTUAL$’000
BUDGET$’000
ACTUAL$’000
2016 2016 2015
Analysis of expenditure by activityLibraries, information and service centers 2,743 2,701 2,605
Community building and service contracts 1,268 1,253 901
Housing for older people 471 454 839
Cemeteries 156 157 190
Community halls 251 273 423
Civil defence emergency management 602 575 577
Gibralter water scheme - (1) -
Total operating expenditure 5,490 5,413 5,535
Analysis of expenditure by classDirect costs 3,736 3,680 3,212
Overhead costs 1,432 1,262 1,392
Interest (73) (47) (66)
Asset revaluation - - 539
Depreciation 395 518 458
Total operating expenditure 5,490 5,413 5,535
RevenueTargeted rates 1,846 1,780 1,629
User fees 75 75 71
Financial contributions - - -
Subsidies 37 - 37
Asset revaluation - - 512
Other income 522 458 540
Total revenue 2,480 2,313 2,789
Net cost of service - surplus/(deficit) (3,010) (3,100) (2,746)
Capital expenditure 342 2,818 324
Total other funding required (3,352) (5,919) (3,070)
Other funding provided byGeneral rate 3,288 3,098 2,687
Debt increase/(decrease) (4) 1,304 (29)
Proceeds from sale of assets 63 - -
Reserves and future surpluses 5 1,517 412
Total other funding 3,352 5,919 3,070
MAJOR VARIANCESCapital expenditure was $2,48m lower than budget with work re-budgeted to 2016/17. This includes the Katikati Library and community hub, and the Te Puke hall strengthening.
Depreciation was $123k lower than budget due to changes in the timing of capital works.
There were no revaluations in 2016. Revaluations are carried out every three years, the last revaluation being 2015, the next scheduled for 2018.
General rate allocation was $190k higher than budget, funding the increase in overhead costs allocated to this activity. General rate allocation was $601k higher than last year, funding $399k increase in salaries after reallocation of staff resources and $74k increase in payment of grants.
XXX | CHAPTER TWO | 61
RECREATION AND LEISURE

62 | CHAPTER TWO | RECREATION AND LEISURE
OVERVIEWA sustainable, liveable community is one which can draw on well-planned recreational opportunities which are part of the ‘live, learn, work, play’ SmartGrowth philosophy. Whether it’s fishing, hunting, swimming at the beach, river rafting, a concert in a park, strolling along the harbour edge, kicking a ball around, the outdoors is the place to do it.
WHY WE PROVIDE ITOUR COMMUNITY OUTCOMERecreation and leisure facilities are well planned and safe to meet the diverse and changing needs of our community.
OUR GOALS• Provide safe, healthy and appropriate facilities
• Provide a basic range of public facilities across our District
• Work and collaborate with the wider community including Tangata Whenua to provide and promote recreation and leisure facilities
• Support provision of sub-regional recreation and leisure opportunities
• Protect important natural environment, cultural and heritage values
• Ensure resources are secured to provide for future public recreation and leisure needs in response to population growth, changing recreational trends and the changing demographics of our communities.
2015/16 HIGHLIGHTSOur focus again this year was to work with community groups in the development of recreational facilities. This included:
• Omokoroa Skate Path – an environmentally sustainable skate path for the Omokoroa Community was opened in May 2016. This was a result of a very successful partnership with the Omokoroa Community Skate Group (OCSG), Council and the Omokoroa Community Board. The community raised nearly $100,000 towards this project while Council and the Community Board provided funding of $50,000 each
• Waihi Beach Wilson Road Toilets –increased capacity toilets were built (to replace existing facility) in response to local demand for better facilities.
In conjunction with other Bay of Plenty Councils we were involved with the development of the Regional Spaces and Places Plan. This plan is designed to focus our thinking at a network wide sport and recreation facilities level. It is intended that this plan provide a framework to help guide regional provision and individual Council’s levels of service for sport and recreation facilities. It is anticipated that this plan will be released for public consultation and final ratification later in 2016.
This year saw the commencement of the districts cycleway project. This was year one of a three year project. We are working in partnership with cycleway groups in Waihi Beach, Pukehina, Katikati and Te Puke.
Work continued at TECT All Terrain Park as user groups continue to develop their facilities. The dog ‘off leash’ area was completed and opened in September 2015. A ‘Dogs Breakfast’ event was held to mark the occasion, with approximately 100 participants with their dogs enjoying the facilities.
As part of our ongoing maintenance programme renewal work was completed on various seawalls and boat-ramps as well as our playgrounds through out the District.
RECREATION AND LEISURE

RECREATION AND LEISURE | CHAPTER TWO | 63
WHAT WE PROVIDE
METRES OF SEA WALLS
SQUARE METRES DISTRICT-WIDE* ROADS & PARKING *excludes sub-regional parks
5,835
176,396
20 BOAT RAMPS
6 CAMPING GROUNDS
41 KILOMETRES OF PATHS
1,326 METRES of boardwalks
11,765
69 PUBLIC TOILETS
2 SWIMMING POOLS
32 SPORTS FIELDS
27 PLAYGROUNDS
44 HARD COURTS
5 SKATE PARKS
2 SUB-REGIONAL PARKS
9 WHARVES AND JETTIES
5 PONTOONS
54,907 SQUARE METRES of roads and parking
7BUILDINGS
SQUARE METRES of walkway structures

64 | CHAPTER TWO | RECREATION AND LEISURE
SERVICE PERFORMANCE RESULTSRESULT TRENDS FOR KEY MEASURES
44.942.00
27.124.60
75%
83%
0%
20%
40%
60%
80%
100%
0
10
20
30
40
50
2006 2008 2010 2012 2014 2016
Resi
dent
sat
isfa
ctio
n
Hec
tare
s pe
r 1,0
00 re
side
nts
RECREATION AND LEISURE - TRENDS
Hectares per 1,000 people incl.sub regional
Hectares per 1,000 people excl.sub regional
Resident Satisfaction - Recreation Facilities
HOW WE HAVE TRACKED PROGRESS TOWARDS OUR GOALS
PERFORMANCE MEASURES
2015/16 2014/15
NARRATIVE ACHIEVEDTARGET RESULT RESULT
Key Performance MeasureTotal hectares of park land provided for recreation or conservation purposes per 1,000 residents. No new reserve land has been
developed. Due to the population growth in the District park land available per 1,000 residents is reducing.
• Excluding sub regional parks (TECT All Terrain Park and Huharua Harbour Park)
≥25.0 HA 24.6 26.6
• Including Council’s share of sub-regional parks. ≥40.0 HA 42.0 45.4
Please note: The decreasing trend is recognising population growth in the District and that facilities will be shared by more people.
Key Resident MeasureTwo-yearly survey of resident satisfaction with reserves and recreational facilities and amenities. Based on residents who are ‘very satisfied’ and ‘satisfied’.
≥75% 83% NO SURVEY
The target and result were calculated excluding those surveyed who ‘don’t know’. The survey result including those that don’t know is 58%.
Supporting MeasuresPercentage of recreational facilities that have a condition rating ≤ 3 (1 excellent, 5 very poor as defined in the NZ Park and Recreation Asset Grading Standard manual).
≥90% 94.7% 94%
Percentage of annual work programme completed as identified in the Recreation and Leisure Strategy and Action Plan. This identifies the total annual actions required for this strategy.
≥90% 97% 98%

RECREATION AND LEISURE | CHAPTER TWO | 65
HOW WE HAVE TRACKED PROGRESS - LEVELS OF SERVICE
PERFORMANCE MEASURES
2015/16 2014/15
NARRATIVE ACHIEVEDTARGET RESULT RESULT
We will provide a basic range of public facilities across our District
Number of community safety initiatives supported by Council,
• Actively maintained parkland (excludes sports parks) ≥5 5.0 5.4 No new reserve land has been
developed. The level of park land available per 1,000 residents has reduced due to the population growth throughout the District.
• Natural land ≥20 19.1 20.7 • Sports parks. ≥1.5 1.5 1.6 Please note: this excludes the joint sub-regional TECT All Terrain Park and Huharua Harbour Park.
Number of recreational facilities provided:
• Playgrounds per 1,000 children (under 15 years old) ≥3 2.9 3.1
Increased population has reduced the number of playgrounds available per 1,000 children.
• Skateparks/paths facilities 6 6 NEW • Boat ramps 18 18 NEW • All tide boat ramps. 2 2 NEW Number of Council funded swimming pools (Katikati and Te Puke).
2 2 NEW
Number of toilet facilities provided. 67 71 NEW Level of reserve-user satisfaction as monitored by the two-yearly intercept surveys (‘satisfied’ or ‘very satisfied’).
≥85% NO SURVEY
NO SURVEY
This intercept survey has been reconfigured to an on-line survey for more regular or target information. This will be operating in the 2016/17 year.
Please note: the decreasing trend is recognising population growth in the District and that existing facilities will be shared by more people.
We will provide sub-regional parks per the joint partnership with Tauranga City Council
Achieve Green Flag accreditation for the TECT All Terrain Park on a three yearly basis.
NO APPLICATION ACHIEVED NEW
Our accreditation has been reconfirmed by the Accreditation Authority through a mystery shopper visit.
FUTURE INITIATIVESWork will continue on our three year cycleway project. In 2016/17 the focus will be on the Omokoroa to Tauranga link.
The development and upgrading of facilities will continue. Key projects include the development of additional sports fields and facilities at Moore Park, the Jubilee Park Skate Path, infrastructure development at TECT All Terrain Park and new toilets at Digglemann Park.
We will continue to promote the collaborative model as we seek to work with community groups throughout the district to deliver local projects.
PERFORMANCE MEASURES
2015/16 2014/15
NARRATIVE ACHIEVEDTARGET RESULT RESULT
Percentage of reserve management plans that have been reviewed (3 yearly cycle) in accordance with the Reserve Management Act 1977.
100% 100% 100%

66 | CHAPTER TWO | RECREATION AND LEISURE
COST OF SERVICE STATEMENTRECREATION AND LEISURE
ACTUAL$’000
BUDGET$’000
ACTUAL$’000
2016 2016 2015
Analysis of expenditure by activity
District reserves 4,027 4,288 14,144
Motor camps 48 48 720
Swimming pools 377 292 310
Harbour structures 814 902 1,346
Sub-regional parks 689 920 972
Total operating expenditure 5,955 6,449 17,492
Analysis of expenditure by class
Direct costs 3,331 3,636 4,655
Overhead costs 931 865 831
Interest 9 60 81
Revaluation movement - - 10,479
Depreciation 1,684 1,888 1,446
Total operating expenditure 5,955 6,449 17,492
Revenue
Targeted rates - 170 122
User fees 28 24 26
Financial contributions 1,788 1,554 815
Subsidies 124 70 247
Vested assets 220 - 428
Asset revaluation - - 7,188
Forestry revaluation 847 - 355
Other income 750 687 1,219
Total revenue 3,757 2,504 10,400
Net cost of service - surplus/(deficit) (2,199) (3,945) (7,092)
Capital expenditure 1,979 2,102 1,564
Vested assets 220 - 428
Total other funding required (4,398) (6,047) (9,084)
Other funding provided by
General rate 4,329 4,986 4,425
Debt increase/(decrease) (10) (10) (10)
Reserves and future surpluses 79 1,071 4,669
Total other funding 4,398 6,047 9,084
MAJOR VARIANCESFinancial contributions were $235k higher than budget due to increased growth in the District.
Direct costs were $305k lower than budget due to reduced expenditure on site maintenance and plant and pest control.
Depreciation was $204k lower than budget due to changes in the timing of capital works.
There were no asset revaluations in 2016. Council assets such as road, reserves and utilities are revalued every three years, the last revaluation being 2015 and the next one due in 2018.
General rate allocation was $665k below budget due to $235k increase in financial contributions and $305k reduction in direct costs, primarily salaries $73k and site and plant maintenance $128k and maintenance $248k.

XXX | CHAPTER TWO | 67
REGULATORY SERVICES

68 | CHAPTER TWO | REGULATORY SERVICES
OVERVIEWAs a regulator we are required to take a balanced response to decision-making by considering the competing rights of individuals and groups to undertake particular activities. Our decisions on these activities are influenced by: • Legislation, regulations and national standards that we are required to comply with
• The opportunities we take to develop local policies, plans and by-laws to regulate local issues.
Our Regulatory Services Strategy includes activities which protect people and the environment by regulating and licensing aspects of commercial services and private behaviour where well-being issues arise. These activities include: • Animal control services
• Building services
• Resource consent services
• Community protection.
Overall we aim to provide high quality regulatory services in a fair and impartial manner, ensuring that customers are kept fully informed at key stages in the service delivery process.
WHY WE PROVIDE ITOUR COMMUNITY OUTCOMERegulatory services support community well-being.
OUR GOALS• Animal control services - provide a safe environment for the public taking into account the needs of animal owners
• Building services - building work is regulated to ensure the health and safety of people and sustainability in design and construction methods
• Resource consent services - the quality of the environment enjoyed by residents and visitors is maintained and enhanced
• Community protection - protect and preserve the environment and public health and safety by minimising risks from nuisance and offensive behaviour.
2015/16 HIGHLIGHTSANIMAL SERVICES
This year we have sought to increase dog owner engagement with a focus on dog and owner behaviour. To do this we have held two Dog Day Out events. The first was held in Te Puke (August 2015) which focused on dog registration through late registration amnesty, microchipping and dog owner education. The second in Omokoroa (March 2016) which focused on dog behaviour where owner education sessions were held with an internationally known behaviourist.
As well as these events we have also introduced a dog owner newsletter. This is designed to improve communication and engagement with dog owners, and provide behaviour tips.
Our dog adoption programme which focuses on rehoming of suitable dogs from our shelter, resulted in 57 dogs being rehomed. This initiative recognises the positive contribution of well behaved dogs in our community as well as enhancing our reputation of a ‘dog friendly’ council. A dog foster programme has been introduced to support the rehoming/dog adoption initiative.
COMPLIANCE AND MONITORING
This year we held two District Licensing Committee hearings for liquor licence applications that were opposed. One licence was approved with no variations, the other is currently under appeal at the Alcohol Regulatory Licensing Authority.
The Food Act 2014 came into force this year. As a result our focus has been on communication and education to ensure food operators understand how the new act applies to them. We also held a joint workshop with the Ministry for Primary Industries and Tauranga City Council for industry representatives.
The level of noise complaints increased 12% from the previous year as well as our District Plan compliance complaints which increased 440%.
BUILDING CONSENTS
In February 2016 we retained our Building Consent Authority (BCA) status as a result of a thorough audit by International Accreditation NZ (IANZ). This is required as only registered BCA are permitted to perform building consenting and certifying functions as required by the Building Act 2004. These audits are undertaken on a two yearly basis.
REGULATORY SERVICES

REGULATORY SERVICES | CHAPTER TWO | 69
The substantial growth in the District has had a significant impact on building consents. The number of building consent applications increased 66% from last year. The consequence of this was the challenge of obtaining suitably qualified staff to process consents and undertake the required inspections. At year end we have increased our staff numbers by 35% and managed to process 81% of building consents within the statutory 20 working day timeframe. In the last four months of the financial year 100% of building consents were processed within the statutory timeframes. Builders are also able to book inspections within four working days.
We continue to develop systems to enable an end to end online digital process. This means that building consents lodgement through to issue and inspection will be digital. Digital LIMs are also being developed and will be live by the end of 2016.
We participated in the ‘Go Shift’ cluster group which is an initiative between coalition Councils and the Ministry of Business, Innovation and Employment. The purpose of this is the standardisation of forms and processes to achieve national consistency with building consent processes.
The Papakainga Housing is a joint agency group which we chair. This is co-funded by our partner councils (Tauranga City and Bay of Plenty Regional) and Te Puna Kokiri. This year twelve trusts from our District participated and the two trusts selected to progress to design and build are from the Western Bay.
RESOURCE CONSENTS
This also has been impacted by growth in the District. As a result the number of subdivision applications received has increased by 17% and land use consents by 20%.

70 | CHAPTER TWO | REGULATORY SERVICES
NOISE CONTROL
WHAT WE PROVIDE
FOOD PREMISES INSPECTIONLICENSING - FOOD AND LIQUOR
MOBILITY CAR PARKS
PARKING WARDENS
BUILDING INSPECTIONS
RESOURCE CONSENT AND MONITORING
BUILDING CONSENT PROCESSING
ANIMAL CONTROL OFFICERSDOG POUNDS

REGULATORY SERVICES | CHAPTER TWO | 71
SERVICE PERFORMANCE RESULTSRESULT TRENDS FOR KEY MEASURES
HOW WE HAVE TRACKED PROGRESS TOWARDS OUR GOALS
PERFORMANCE MEASURES
2015/16 2014/15
NARRATIVE ACHIEVEDTARGET RESULT RESULT
Key Performance MeasureNumber of successful legal challenges or mediation settlements made as a result of Council staff error (excludes weathertightness claims).
0 0 0
Key Resident MeasurePercentage level of customer satisfaction based on customer survey of regulatory services.
(This survey includes resource consents, building and animal control services, liquor licencing and registered premises).
≥85% NO SURVEY 89%
The Animal Services survey was not completed before 30 June 2016. The survey format has been revised and will be completed in July 2016.
0
85%89%
0%
20%
40%
60%
80%
100%
0
1
2
3
4
5
6
2006 2008 2010 2012 2014 2016
REGULATORY SERVICES - TRENDS
Successful legal challenges or mediation settlements result Council error
Customer Satisfaction

72 | CHAPTER TWO | REGULATORY SERVICES
HOW WE HAVE TRACKED PROGRESS - LEVELS OF SERVICE
PERFORMANCE MEASURES
2015/16 2014/15
NARRATIVE ACHIEVEDTARGET RESULT RESULT
Resource consent applications will be processed within the statutory timeframe and their compliance monitored
Percentage of all resource consent applications processed within statutory timeframes.
100% 99% 98.8%A total of 565 applications were processed of which 5 were not within the statutory timeframe.
Percentage resource consents monitoring schedule completed to ensure compliance with consent conditions 100% 96% NEW
The coastal toe monitoring was not completed. As part of resource consent conditions houses must be more than 8m from the toe of the sand dune.
Number of successful resource consent appeals. 0 0 NEW Building and health applications and plan checking will be processed within statutory timeframes
Percentage of building and health applications and plan checking processed within the statutory timeframes 100% 81% 96.1%
Building consent applications increased by 51% from 2015 and new dwellings increased by 78%. Due to limited resources only 81% of processed applications were within statutory timeframes.
Land Information Memoranda (LIM) and Project Information Memoranda (PIM) will be processed within the statutory timeframe (10 days)
Percentage of LIM and PIM applications processed within the statutory timeframe (10 days). 100% 99.8% 99.6%
1 LIM and 5 PIM’s were not processed within statutory time. LIM’s received increased by 25% from previous financial year and PIMs 21%.
Known dogs in our District are registered
Percentage of known dogs in our District that are registered. ≥98% 98.4% 97.6%
We will respond to customer service requests in a timely manner
Percentage of service requests received that are actioned within specified timeframe.
Building consents exceeded timeframes due to resource constraints and staff turnover.
• Animal ≥90% 98% NEW • Building ≥90% 73% NEW • Health ≥90% 89% NEW • Resource consent compliance and
enforcement. ≥90% 99% NEW
FUTURE INITIATIVESWe will continue to respond to growth issues as we anticipate growth will remain strong for the next two years. This will also require the streamlining of our processes to ensure consent applications are processed and monitored in a timely and efficient manner. This will be achieved through the continual review, digitisation and standardisation of building and resource consent processes. We will also be developing on-line forms for liquor and food licensing.
The Resource Legislation Amendment Bill is currently being reviewed and we anticipate it will be enacted before the end of 2016. As Government is seeking to reduce the processing times and what requires a resource consent our current processes will be reviewed to ensure compliance with this new legislation. Alongside this we will be holding stakeholder workshops for building and resource consents. This is a two-way initiative to educate the building and development community and identify how we can work together to improve the process for all concerned.
We will continue our dog adoption initiative and the Dog Day Out events. New animal shelters are being built at both Te Puke and Katikati. These will be completed in 2017.

REGULATORY SERVICES | CHAPTER TWO | 73
COST OF SERVICE STATEMENTREGULATORY
ACTUAL$’000
BUDGET$’000
ACTUAL$’000
2016 2016 2015
Analysis of expenditure by activity
District Plan implementation 1,495 1,343 1,528
Building and health 3,709 2,688 2,072
Animal control 689 496 590
Compliance and monitoring 800 650 541
Total operating expenditure 6,693 5,177 4,731
Analysis of expenditure by class
Direct costs 4,899 3,553 3,081
Overhead costs 1,748 1,582 1,585
Interest (8) (10) 4
Depreciation 54 51 61
Total operating expenditure 6,693 5,177 4,731
Revenue
User fees 5,350 3,387 3,713
Interest - - -
Other income 72 37 70
Total revenue 5,422 3,424 3,783
Net cost of service - surplus/(deficit) (1,271) (1,753) (948)
Capital expenditure - -
Total other funding required (1,271) (1,753) (948)
Other funding provided by
General rate 1,938 2,025 1,261
Reserves and future surpluses (667) (273) (313)
Total other funding 1,271 1,753 948
MAJOR VARIANCESIncreased activity in the housing market has seen higher levels of expenditure as we expand to cope with the additional transactions. This cost increase has been more than offset by a rise in user fees.
User fees are $1.96m higher than budget. Resource consents have generated an additional $663k, and building services an additional $1.33m.
Direct costs were $1.35m higher than budget. This includes an additional $343k in salaries to handle the extra volume in transactions generated by the growth in the housing market, and a weathertight homes settlement.
Animal control costs have increased $192k over budget. $100k being increased overhead allocation and $57k increased dog control costs.

74 | CHAPTER TWO | XXX
TRANSPORTATION

TRANSPORTATION | CHAPTER TWO | 75
OVERVIEWProvision of a safe and effective transportation network contributes to the health and well-being of the community. An efficient transport network enables economic development that is of district, regional and national importance. The network provides strategic transport links to the major Port of Tauranga that has the largest maritime import/export freight volumes in New Zealand.
WHY WE PROVIDE ITOUR COMMUNITY OUTCOMETransportation networks are safe, affordable, sustainable and planned to meet our Community’s needs and support economic development.
OUR GOALS• Transportation networks support and promote economic development
• The impact on the environment of the transportation system is mitigated where practicable
• Transport systems enable healthy activity and reduce transport-related public health risks
• Transport systems improve access and mobility
• Land use and transportation network planning are integrated.
2015/16 HIGHLIGHTS
TRANSPORTATION
The One Network Maintenance Contract continues to operate successfully. We have enjoyed the continuation of significant savings of approximately $2m in the 2015/16 financial year without compromising service delivery.
In conjunction with NZ Transport Agency (NZTA) major works are being undertaken on the Te Puke Highway (revoked section of SH2). This work will bring the road up to the required standard and should address the poor safety record along this section of road.
Throughout the year maintenance and capital work is normally undertaken as part of the seal widening and seal extension programme.
This year no seal widening was completed as there were no rehabilitation projects undertaken that meet the width criteria for widening. There were also no seal extension projects due to delays caused by property issues on the intended project, the Burd Road seal extension. We are raising the level of service for footpaths with the aim of eliminating trip hazards and this work will be completed over the 2016/17 financial year.
We have commenced the development of a comprehensive programme of cycle-ways. The Tauranga Eastern Link to Paengaroa cycleway was completed in December 2015. We also completed a recreational walking and cycleway in Omokoroa.

76 | CHAPTER TWO | TRANSPORTATION
WHAT WE PROVIDE
of network with connections to state highways
Sealed roads:
Urban roads:Un-sealed roads:
Rural roads:
1,053KILOMETRES
METRES
862.07
154.9 190.53
897.7
KILOMETRES
KILOMETRES
KILOMETRES
KILOMETRES
2,591
80 160.636 1,371BRIDGES HARD SURFACED FOOTPATHS
CULVERTSgreater than 1.4m diameter
METALLED SURFACED FOOTPATHS
5,032STREETLIGHTS
ROAD SIGNS
KILOMETRES

TRANSPORTATION | CHAPTER TWO | 77
SERVICE PERFORMANCE RESULTSRESULT TRENDS FOR KEY MEASURES
HOW WE HAVE TRACKED PROGRESS TOWARDS OUR GOALS
PERFORMANCE MEASURES
2015/16 2014/15
NARRATIVE ACHIEVETARGET RESULT RESULT
Key Performance MeasureThe percentage of crashes caused by road-related factors compared to Council’s peer group. (Small–medium councils as grouped by the New Zealand Transport Agency). Note: (A lower percentage is a favourable result for us).
≤90% 62% 80%
Key Resident MeasureFacilities and services provide social benefits to the whole community. The level of satisfaction with our Transportation activities (roading, cycling and walkways) as monitored by the Annual Residents’ Survey, the percentage of residents who are ‘very satisfied’ and ‘satisfied’.
≥60% 59% 55%
The target and result was calculated excluding those surveyed who ‘don’t know’. The survey result including those that don’t know is 57%. Key reasons for dissatisfaction were related to road seal, pot holes and roughness.
Supporting MeasureThe change from the previous financial year in the number of fatalities and serious injury crashes on the local road network.
0 4 NEW
There were 15 fatal/serious injury crashes during the year compared to 11 the previous year.
79%
86%
46%50%
59%
0%
20%
40%
60%
80%
100%
2006 2008 2010 2012 2014 2016
TRANSPORTATION - TRENDS
Crashes caused by Road Related factors Resident Satisfaction
78 | CHAPTER TWO | TRANSPORTATION
HOW WE HAVE TRACKED PROGRESS - LEVELS OF SERVICE
PERFORMANCE MEASURES
2015/16 2014/15
NARRATIVE ACHIEVETARGET RESULT RESULT
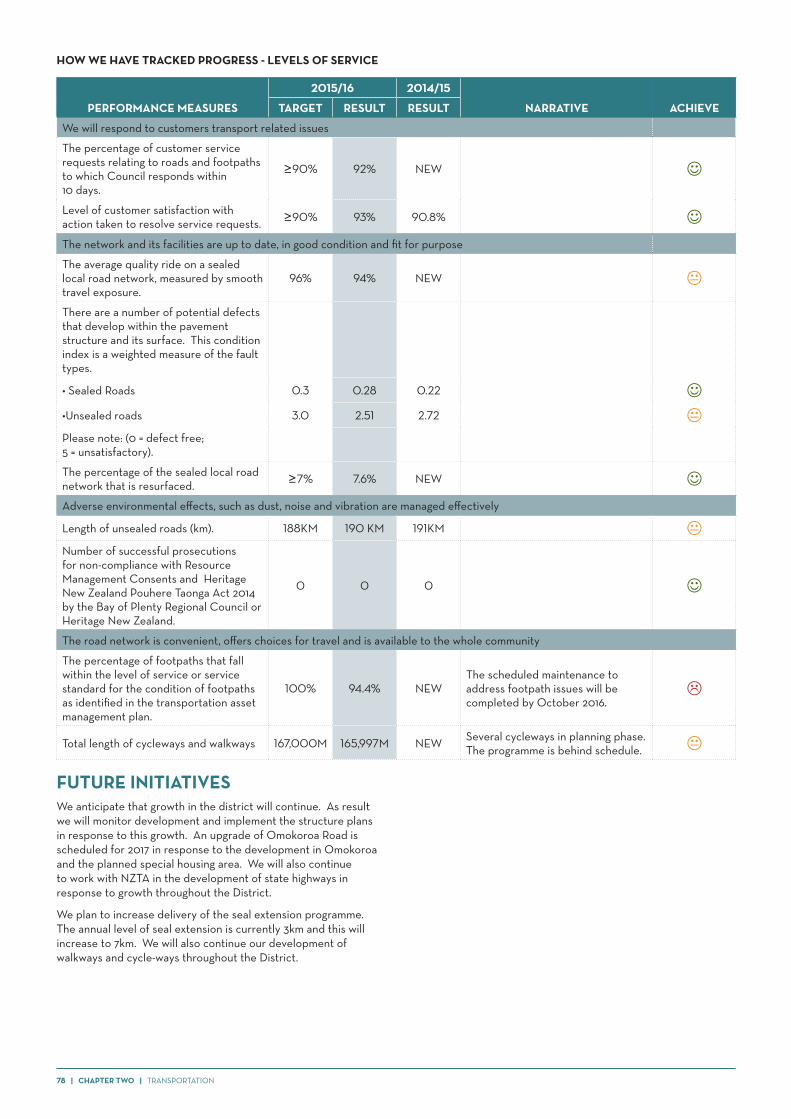
We will respond to customers transport related issues
The percentage of customer service requests relating to roads and footpaths to which Council responds within 10 days.
≥90% 92% NEW
Level of customer satisfaction with action taken to resolve service requests. ≥90% 93% 90.8% The network and its facilities are up to date, in good condition and fit for purpose
The average quality ride on a sealed local road network, measured by smooth travel exposure.
96% 94% NEW
There are a number of potential defects that develop within the pavement structure and its surface. This condition index is a weighted measure of the fault types.
• Sealed Roads 0.3 0.28 0.22 •Unsealed roads 3.0 2.51 2.72 Please note: (0 = defect free; 5 = unsatisfactory).
The percentage of the sealed local road network that is resurfaced. ≥7% 7.6% NEW Adverse environmental effects, such as dust, noise and vibration are managed effectively
Length of unsealed roads (km). 188KM 190 KM 191KM Number of successful prosecutions for non-compliance with Resource Management Consents and Heritage New Zealand Pouhere Taonga Act 2014 by the Bay of Plenty Regional Council or Heritage New Zealand.
0 0 0
The road network is convenient, offers choices for travel and is available to the whole community
The percentage of footpaths that fall within the level of service or service standard for the condition of footpaths as identified in the transportation asset management plan.
100% 94.4% NEWThe scheduled maintenance to address footpath issues will be completed by October 2016.
Total length of cycleways and walkways 167,000M 165,997M NEW Several cycleways in planning phase. The programme is behind schedule.
FUTURE INITIATIVESWe anticipate that growth in the district will continue. As result we will monitor development and implement the structure plans in response to this growth. An upgrade of Omokoroa Road is scheduled for 2017 in response to the development in Omokoroa and the planned special housing area. We will also continue to work with NZTA in the development of state highways in response to growth throughout the District.
We plan to increase delivery of the seal extension programme. The annual level of seal extension is currently 3km and this will increase to 7km. We will also continue our development of walkways and cycle-ways throughout the District.

TRANSPORTATION | CHAPTER TWO | 79
COST OF SERVICE STATEMENTTRANSPORTATION
ACTUAL$’000
BUDGET$’000
ACTUAL$’000
2016 2016 2015
Analysis of expenditure by activity
Transportation 21,451 19,767 19,104
Total operating expenditure 21,451 19,767 19,104
Analysis of expenditure by class
Direct costs 9,771 8,914 8,151
Overhead costs 1,161 1,215 1,186
Interest 1,066 1,369 1,134
Asset revaluation - - 758
Depreciation 9,453 8,269 7,875
Total operating expenditure 21,451 19,767 19,104
Revenue
Targeted rates 44 43 44
User fees 36 - 11
Subsidies 6,764 6,881 6,545
Roading rate 13,490 13,000 14,379
Financial contributions 2,542 2,791 1,023
Vested assets 40,936 1,400 8
Asset revaluation - - 16,440
Other income 1,440 262 594
Total revenue 65,252 24,377 39,044
Net cost of service - surplus/(deficit) 43,802 4,610 19,940
Capital expenditure 6,639 12,346 9,065
Vested assets 40,936 1,400 8
Total other funding required (3,773) (9,136) 10,867
Other funding provided by
General rate 50 50 -
Debt increase (decrease) (363) (363) (340)
Proceeds from sale of assets 4 - -
Reserves and future surpluses 4,083 9,449 (10,527)
Total other funding 3,773 9,136 (10,867)
MAJOR VARIANCESDirect costs are $857k higher than budget. Maintenance work is carried out as required and additional expenditure this year will be offset by reduced expenditure in future years under the One Network Maintenance Contract.
Vested assets includes Te Puke Highway (formally State Highway 2) vested from the New Zealand Transport Authority. This is a non cash transaction.
Other income was $1.18m higher than budget and includes $738k compensation from the New Zealand Transport Authority for the Tauranga Eastern Link (TEL) construction traffic effect on local roads, TEL cycleway contribution of $225k, and $237k bond retention for work not completed to standard.
Capital expenditure was $5.71m under budget with a number of projects rescheduled to 2017/18. These include work on the Omokoroa structure plan $3.60m and seal extensions $1.50m.
Depreciation was $1.18m higher than budget due to additional depreciation on the Te Puke Highway that was not budgeted for.
There were no revaluations in 2016. Revaluations are carried out every three years, the last revaluation being 2015, the next revaluation is scheduled for 2018.
80 | CHAPTER TWO | XXX
WATER SUPPLY

WATER SUPPLY | CHAPTER TWO | 81
WATER SUPPLYOVERVIEWWe supply potable (drinking) water to approximately 37,000 people in our District through the water infrastructure operating in the Western, Central and Eastern supply zones. We have a varied customer base including residential, commercial, horticultural and agricultural users.
WHY WE PROVIDE ITOUR COMMUNITY OUTCOMEWater supply is provided to our Community in a sustainable manner.
OUR GOALS• Provide potable water of an appropriate standard and quality to meet the needs of consumers within the three supply zones• Sustainably manage our water resource, water supply infrastructure and consumer use of water across the three supply zones.
2015/16 HIGHLIGHTSWork continued on the installation of water meters in the District. The eastern supply zone was completed and this will enable the implementation of a demand management programme which will lead to better water usage, identification of losses and supply information. It is envisaged that the real benefits will occur when the meters have been in place for at least two years as information gathered can identify key trends and provide history of water usage.
Our focus is to ensure customers have access to an adequate water supply. To achieve this a number of projects were undertaken. Key initiatives included:
• Tahawai - installation of a water line that links two major supplies in the western supply zone. This was a replacement of pipes that had failed prematurely
• Douglas Reservoir - installation of a pump station from the reservoir to Gnome water tanks to provide a supplementary supply. This will alleviate demand pressure on the bush supply scheme
• John Bird Road - installation of supply tanks to optimise pumping from the supply to John Bird Road
• Athenree – upgrade to supply pipeline from Athenree to the state highway, which remedied a number of significant breaks
• Manoeka Road – work commenced on a booster pump station to pump up Manoeka Road ensuring water is supplied to our customers living at the top of the road
• Maketu – installation of a booster pump station.
We continue to seek opportunities to educate our communities on water supply usage and conservation. In March we joined with the Regional Council in the ‘Hands on Water Expo’ in which 16 schools from across the region took part. Our interactive stand was focused on water leaks with key messages on water conservation, and the need to report/fix identified water leaks.
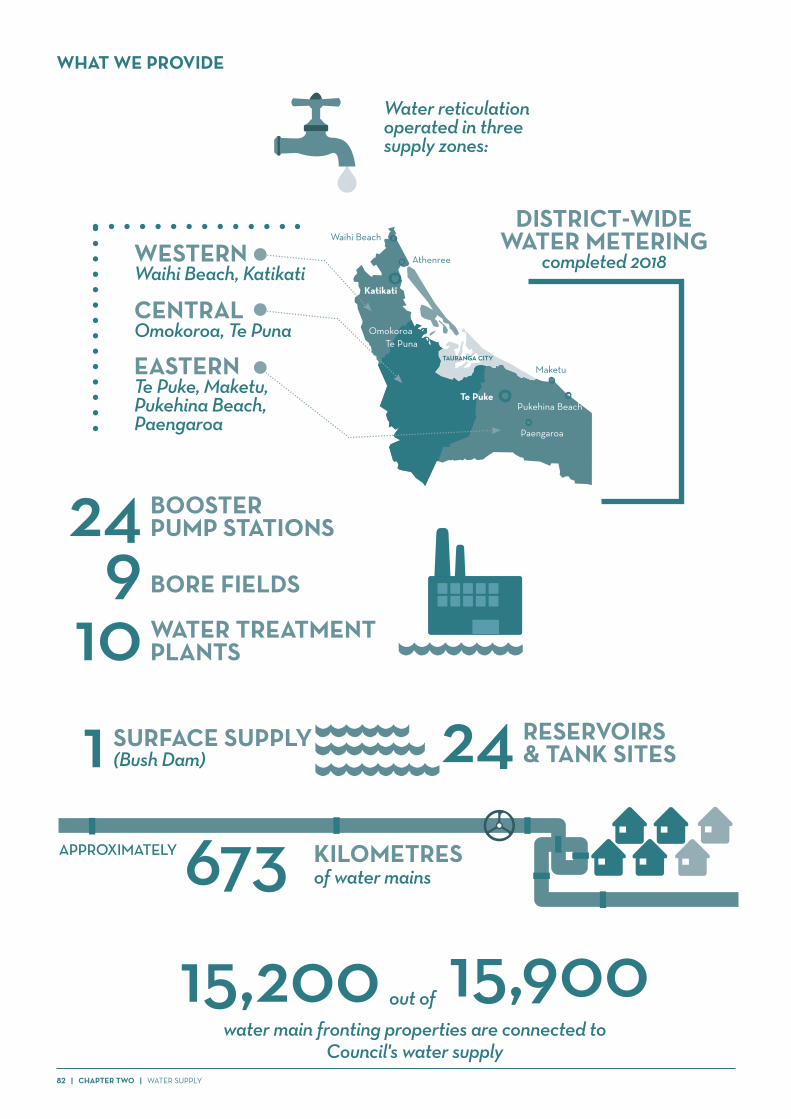
82 | CHAPTER TWO | WATER SUPPLY
WHAT WE PROVIDE
673
SURFACE SUPPLY (Bush Dam)
WESTERNWaihi Beach, Katikati
CENTRALOmokoroa, Te Puna
EASTERNTe Puke, Maketu, Pukehina Beach, Paengaroa
Water reticulation operated in three supply zones:
DISTRICT-WIDE WATER METERING
completed 2018
15,200 15,900
24
24
9
10
APPROXIMATELY
of water mains
out of
water main fronting properties are connected to Council's water supply
KILOMETRES
BOOSTER PUMP STATIONS
RESERVOIRS & TANK SITES
BORE FIELDS
WATER TREATMENT PLANTS
1
Waihi Beach
Athenree
Katikati
Maketu
Pukehina Beach
Paengaroa
TAURANGA CITY
OmokoroaTe Puna
Te Puke

WATER SUPPLY | CHAPTER TWO | 83
SERVICE PERFORMANCE RESULTSRESULT TRENDS FOR KEY MEASURES
HOW WE HAVE TRACKED PROGRESS TOWARDS OUR GOALS
PERFORMANCE MEASURES
2015/16 2014/15
NARRATIVE ACHIEVEDTARGET RESULT RESULT
Key Performance MeasureFor the three supply zones the percentage of Council’s treated water supply with a Ministry of Health grading as per the New Zealand Drinking Water Standards 2005 (amended 2008).
B or better for treatment 100% 100% 100% b or better for reticulation 100% 100% 100% Key Resident MeasureLevel of resident satisfaction with the quality of Council’s water supply as monitored by the Annual Residents’ Survey, percentage of residents who are ‘very satisfied’ and ‘satisfied’.
79% 75% 78%Three key reasons for dissatisfaction were taste, colour/cloudy and chemicals.
Supporting MeasureIn a one-in-50-year drought event the ability to supply water to meet the normal daily water demand (1,100 litres per person per day).
100% 100% 100%
Ability of reservoirs to provide a minimum of 24 hour average daily demand.
100% 100% 100%
67%
100%
100% 100%
58%
75%
0%
20%
40%
60%
80%
100%
2006 2008 2010 2012 2014 2016
WATER SUPPLY - TRENDS
B' Grading for Treatment
b' Grading for Distribution
Resident Satisfaction Council Supply

84 | CHAPTER TWO | WATER SUPPLY
HOW WE HAVE TRACKED PROGRESS - LEVELS OF SERVICE
PERFORMANCE MEASURES
2015/16 2014/15
NARRATIVE ACHIEVEDTARGET RESULT RESULT
We will provide good quality water to service growth within the three supply zones
Percentage of year where reservoirs are maintained at a minimum of 50% full, in accordance with Ministry of Health requirements.
100% 100% 98%
We will monitor sustainable delivery and effectively manage the risks associated with the quality and quantity of the public water supply
The extent to which Council’s drinking water supply complies with:• Part 4 of the drinking-water standards
(bacterial compliance criteria), and• Part 5 of the drinking-water standards
(protozoal compliance criteria).≥99% 100% NEW
Level of compliance by water supply area:Western - 100%Central - 100%Eastern - 100%
The Drinking Water Standards identify requirements for frequency of testing. While we achieved full compliance the Ministry of Health gave leniency to us as testing exceeded the required timeframe. There were enough samples taken to ensure compliance.
The percentage of real water loss from Council’s networked reticulation system.(this will be monitored through the water metering for the central supply area. Until water metering is completed in the eastern and western supply areas water loss will be based on a pre-defined calculation.)
≤25% 19% NEW
District results calculated using the Water NZ water balance calculation.
The average consumption of drinking water per day per resident.
≤270 LITRES
180 LITRES NEW
Respond to customer issues with the water supply
The median response time for Council to respond to a fault or unplanned interruption to the networked reticulation system.Attendance for call-outs: from the time notification is received to the time service personnel reach the site
• Urgent call outs ≤2 HOURS
38 MINUTES NEW
• Non urgent call outs ≤8 HOURS 6.2 HOURS NEW
Resolution of call-outs: from the time notification is received to the time service personnel confirm resolution of the fault or interruption.
• Urgent call outs ≤8 HOURS
2 HOURS & 46
MINUTESNEW
• Non urgent call outs ≤24 HOURS
24 HOURS & 11
MINUTESNEW

WATER SUPPLY | CHAPTER TWO | 85
PERFORMANCE MEASURES
2015/16 2014/15
NARRATIVE ACHIEVEDTARGET RESULT RESULT
Total number of complaints received by Council about drinking water: • clarity • taste • odour • pressure or flow • continuity of supply andCouncil’s response to any of these issues expressed per 1000 connections to the networked reticulation system.
≤40 21 NEW
FUTURE INITIATIVESThe final stage of the water metering project, Western Supply Zone will commence in the 2016/17 year. This is a two year project, and it is envisaged this will be completed in 2018.
We will continue water reticulation improvement programme in all three supply zones, as well as commission a second bore at Pongakawa and upgrade the Pongakawa treatment plant to ensure water supplied is compliant with water standards. We need to obtain a resource consent regarding the allocation of water and will focus on our role in the supply of water for the wider community. This complements the ongoing project, ‘Wai Ora’ which facilitates water supply to areas in the District that currently have sub standard water supply.
In conjunction with the Bay of Plenty Regional Council, we are involved in the Freshwater Future Community Groups initiative. The focus of this is to identify key stakeholders and determine what level of water quality and management is required to maintain future supplies. This is a two to three year programme.
Water metering will encourage the conservative use of water as all our customers will pay for the water they use. Water conservation will help ensure that sufficient water supply is available for all current users and provide for future generations.

86 | CHAPTER TWO | WATER SUPPLY
COST OF SERVICE STATEMENTWATER SUPPLY (DISTRICT-WIDE)
ACTUAL$’000
BUDGET$’000
ACTUAL$’000
2016 2016 2015
Analysis of expenditure by activity
Western water supply 3,494 3,462 3,583
Central water supply 2,521 2,573 2,586
Eastern water supply 4,068 4,380 4,057
Total operating expenditure 10,083 10,415 10,226
Analysis of expenditure by class
Direct costs 4,380 4,447 4,170
Overhead costs 1,398 1,446 1,493
Interest 1,476 1,594 1,641
Asset revaluation - - 160
Depreciation 2,829 2,929 2,762
Total operating expenditure 10,083 10,415 10,226
Revenue
Targeted rates 6,414 6,258 6,412
User fees 3,281 3,080 3,340
Financial contributions 1,277 820 389
Vested assets 236 200 10
Forestry revaluation 180 - 378
Other income 51 51 58
Total revenue 11,439 10,410 10,587
Net cost of service - surplus/(deficit) 1,356 (6) 361
Capital expenditure 4,142 5,559 2,081
Vested assets 236 200 10
Total other funding required (3,022) (5,765) (1,730)
Other funding provided by
Debt increase (decrease) (761) 253 (703)
Reserves and future surpluses 3,783 5,512 2,433
Total other funding 3,022 5,765 1,730
MAJOR VARIANCESFinancial contributions were $457k higher than budget due to increased growth in the District.
User fees were $201k higher than budget as a result of additional water meter connections throughout the district. User fees were $60k lower than last year, 2015 included a one off increased year end accrual.
Capital expenditure was $1.42m under budget with a number of projects rescheduled to 2017/18. These include western water reticulation improvements $862k and Pongakawa Water Treatment Plant enhancements $631k. This is consistent with Council's "just in time" delivery of infrastructure.
Depreciation was $101k lower than budget due to changes in the timing of capital works.
Targeted rates were $156k higher than budget, the extra revenue coming from increased properties in the District.
There were no revaluations in 2016. Revaluations are carried out every three years, the last revaluation being 2015, the next revaluation is scheduled for 2018.

WATER SUPPLY | CHAPTER TWO | 87
COST OF SERVICE STATEMENTWATER SUPPLY (WESTERN WATER)
ACTUAL$’000
BUDGET$’000
ACTUAL$’000
2016 2016 2015
Analysis of expenditure by activity
Western water supply 3,494 3,462 3,583
Total operating expenditure 3,494 3,462 3,583
Analysis of expenditure by class
Direct costs 1,600 1,481 1,535
Overhead costs 515 525 562
Interest 354 412 417
Asset revaluation - - 64
Depreciation 1,025 1,044 1,005
Total operating expenditure 3,494 3,462 3,583
Revenue
Targeted rates 2,787 2,684 2,693
User fees 925 889 1,067
Financial contributions 591 242 143
Vested assets 78 100 10
Forestry revaluation 180 - 227
Other income 19 - 16
Total revenue 4,580 3,915 4,156
Net cost of service - surplus/(deficit) 1,086 453 573
Capital expenditure 1,306 1,403 422
Vested assets 78 100 10
Total other funding required (298) (1,050) 141
Other funding provided by
Debt increase (decrease) (261) (268) (247)
Reserves and future surpluses 559 1,318 106
Total other funding 298 1,050 (141)

88 | CHAPTER TWO | WATER SUPPLY
COST OF SERVICE STATEMENTWATER SUPPLY (CENTRAL WATER)
ACTUAL$’000
BUDGET$’000
ACTUAL$’000
2016 2016 2015
Analysis of expenditure by activity
Central water supply 2,521 2,573 2,586
Total operating expenditure 2,521 2,573 2,586
Analysis of expenditure by class
Direct costs 1,115 1,153 1,117
Overhead costs 365 386 385
Interest 371 392 416
Asset revaluation - - 5
Depreciation 670 643 663
Total operating expenditure 2,521 2,573 2,586
Revenue
Targeted rates 1,073 1,058 1,015
User fees 962 858 1,089
Financial contributions 351 289 196
Vested assets 74 50 -
Asset revaluation - - 34
Other income 14 - 16
Total revenue 2,474 2,255 2,350
Net cost of service - surplus/(deficit) (47) (318) (236)
Capital expenditure 678 963 116
Vested assets 74 50 -
Total other funding required (799) (1,330) (352)
Other funding provided by
Debt increase (decrease) (168) 10 (152)
Reserves and future surpluses 967 1,320 504
Total other funding 799 1,330 352

WATER SUPPLY | CHAPTER TWO | 89
COST OF SERVICE STATEMENTWATER SUPPLY (EASTERN WATER)
ACTUAL$’000
BUDGET$’000
ACTUAL$’000
2016 2016 2015
Analysis of expenditure by activity
Eastern water supply 4,068 4,380 4,057
Total operating expenditure 4,068 4,380 4,057
Analysis of expenditure by class
Direct costs 1,665 1,813 1,517
Overhead costs 518 535 547
Interest 751 790 808
Asset revaluation - - 91
Depreciation 1,134 1,242 1,094
Total operating expenditure 4,068 4,380 4,057
Revenue
Targeted rates 2,554 2,516 2,704
User fees 1,394 1,334 1,185
Financial contributions 335 288 49
Vested assets 84 50 -
Asset revaluation - - 117
Other income 18 51 25
Total revenue 4,385 4,239 4,080
Net cost of service - surplus/(deficit) 317 (141) 23
Capital expenditure 2,158 3,194 1,543
Vested assets 84 50 -
Total other funding required (1,925) (3,385) (1,520)
Other funding provided by
Debt increase (decrease) (332) 511 (303)
Reserves and future surpluses 2,257 2,874 1,823
Total other funding 1,925 3,385 1,520

90 | CHAPTER TWO | XXX
STORMWATER

STORMWATER | CHAPTER TWO | 91
STORMWATEROVERVIEWStormwater systems are built to protect buildings and property from the effects of flooding and coastal erosion. These systems include watercourses, open channels, swales and structures that channel stormwater to a final discharge point. Our systems include primary and secondary overland flow paths, stormwater detention and stormwater treatment. There are legislative requirements regarding the quality and quantity of stormwater released and we must meet these statutory obligations. Under the Resource Management Act 1991 district councils must manage land use in a way that minimises environmental effects.
WHY WE PROVIDE ITOUR COMMUNITY OUTCOMEStormwater approaches are innovative, affordable and sustainable and lead to a reduction in flooding events. (Flooding events are defined as an overflow of stormwater from a stormwater system that enters a habitable floor).
OUR GOALSTo develop a catchment based flood risk management framework that recognises and allows for the nature and behaviour of surface water systems to improve community resilience from potential flooding; by ensuring that:
• There is a localised reduction of the risk of flooding events in existing floodable areas
• There is no increase in flooding event risk to existing development from new development or land use change
• Urban development is avoided in flood-prone areas unless mitigation measures can be provided that do not affect the capacity / effective functioning of existing downstream stormwater systems
• Communities are engaged and informed about various approaches to stormwater management and their views are sought and taken into account
• Compliance and monitoring activities are carried out
• Communities are engaged and informed about various approaches to coastal erosion management and their views are sought and taken into account.
2015/16 HIGHLIGHTSThis year there was a reduction in the number of stormwater / flooding issues during significant weather events. This is attributed to our proactive approach when significant weather events are forecast. This involved visiting known trouble spots and taking corrective and precautionary action before the event occurs.
We prepared the central catchment comprehensive stormwater consent application. This involved developing a catchment management plan for the Te Puna West Urban Zone and Minden. Pirirakau undertook a cultural impact assessment for the application and we held a number of meetings within the community to discuss stormwater issues for the Te Puna / Minden area. We will be lodging this consent in late 2016.
A stormwater model for Te Puke was completed and the flood hazard maps have been revised. Information from this will be used to inform our District Plan.
Significant stormwater works were completed in Waihi Beach to address flooding and erosion issues. This included:
• Obtaining resource consent for construction of bank protection works along Two Mile Creek down stream of Dillon Street bridge
• Working with community as part of resource consent process to undertake construction upstream of Two Mile Creek
• Installation of a rectangular boxed culvert to replace twin culverts to address the undersized flow restriction which caused flooding
Other protection works identified in our 2013/14 Annual Plan have been reprioritised as part of the bigger picture for Waihi Beach community. The planned expense will now occur over the next ten years.

92 | CHAPTER TWO | STORMWATER
WHAT WE PROVIDE
133 KILOMETRES of stormwater pipes
2,551 MANHOLES
1 DAM
13 SOAKHOLES
7 PUMP STATIONS
505 CATCHPITS
34.6 KILOMETRES of open drains
1.2 KILOMETRES of rising mains

STORMWATER | CHAPTER TWO | 93
1 DAM
SERVICE PERFORMANCE RESULTSRESULT TRENDS FOR KEY MEASURES
HOW WE HAVE TRACKED PROGRESS TOWARDS OUR GOALS
PERFORMANCE MEASURES
2015/16 2014/15
NARRATIVE ACHIEVEDTARGET RESULT RESULT
Key Performance MeasureThe number of times flooding occurs outside identified flood-prone urban areas during a one-in-50 year or less storm event.
This performance measure is assessed on a per event basis i.e. flooding in more than one location in a single event will be counted as 1.
≤3 EVENTS
0(EVENTS)
0(EVENTS)
There were no flooding events in the 2015/16 year.
Key Resident MeasureResident satisfaction level with stormwater systems, as monitored by the Annual Residents Survey; percentage of residents who are “very satisfied” or “satisfied”.
≥65% 73% 70%
The target and result were calculated excluding those surveyed who ‘don’t know’. The survey result including those that don’t know is 62%
53%
73%
0
0
1
2
3
4
5
0%
20%
40%
60%
80%
100%
2006 2008 2010 2012 2014 2016
Floo
d ev
ents
Satis
fact
ion
STORMWATER - TRENDS
Resident Satisfaction
Flooding events outside identified flood prone urban areas

94 | CHAPTER TWO | STORMWATER
HOW WE HAVE TRACKED PROGRESS - LEVELS OF SERVICE
PERFORMANCE MEASURES
2015/16 2014/15
NARRATIVE ACHIEVEDTARGET RESULT RESULT
We will provide stormwater assets to minimise risks of flooding events
Based on the number of flooding events that occur within the District.
For each flooding event (district wide), the number of habitable floors affected (expressed per 1000 properties connected to Council’s stormwater system).
≤30 (3%) PER EVENT
0 NEW There were no flooding events in the 2015/16 year.
For a one in ten year flooding event, the number of habitable floors affected. (Expressed per 1000 properties connected to Council’s stormwater system.
PER EVENT
There were no flooding events in the 2015/16 year.
Waihi Beach ≤60 (6%) 0 NEW Katikati ≤10 (1%) 0 NEW Omokoroa ≤10 (1%) 0 NEW Te Puke ≤30 (3%) 0 NEW Maketu ≤30 (3%) 0 NEW Compliance with Council’s resource consents for discharge from our stormwater system, measured by the number of:
• Abatement notices 0 0 NEW • Infringement notices 0 0 NEW • Enforcement orders, and 0 0 NEW • Convictions 0 0 NEW received by Council in relation to those resource consents
We will be responsive to customer’s stormwater issues
The median response to attend a flooding event, measured from the time that Council receives the notification to the time that service personnel reach the site.
≤120 MINUTES
NO EVENTS NEW
The number of complaints received by Council about the performance of its stormwater system, expressed per 1000 properties connected to the Councils stormwater system.
≤30 0.8 NEW
FUTURE INITIATIVESWe will complete the comprehensive District-wide (western, central and eastern) stormwater application with the exclusion of Omokoroa as a stormwater consent is already held for this community. The consent for the western area will be progressed through the Environment Court due to one appellant. The eastern area consent has been lodged and requires further consultation with Iwi. This is planned to occur in at the beginning of 2017.
A flood mapping exercise will be undertaken in conjunction with the Bay of Plenty Regional Council for Waihi Beach.
This entails the development of a stormwater model and a review and update of the flood hazard zoning required for our District Plan and for the Regional Council’s Regional Policy Statement.
As part of our stormwater maintenance and renewal programme there will be significant upgrades to the stormwater network in Te Puna and at Washer Place Te Puke to address flooding and erosion.
Apply for consent above Dillon Street bridge - to construct erosion control in Two Mile Creek at Waihi Beach.

STORMWATER | CHAPTER TWO | 95
COST OF SERVICE STATEMENTSTORMWATER
ACTUAL$’000
BUDGET$’000
ACTUAL$’000
2016 2016 2015
Analysis of expenditure by activity
Stormwater 3,882 4,082 4,618
Waihi Beach coastal protection 115 150 135
Total operating expenditure 3,997 4,232 4,753
Analysis of expenditure by class
Direct costs 643 752 882
Overhead costs 530 585 555
Interest 1,669 1,728 1,821
Asset revaluation - - 346
Depreciation 1,155 1,167 1,149
Total operating expenditure 3,997 4,232 4,753
Revenue
Targeted rates 3,681 3,696 2,742
User fees 1 - -
Financial contributions 551 733 65
Vested assets 629 300 10
Asset revaluation - - 76
Other income 2 160 3
Total revenue 4,864 4,890 2,896
Net cost of service - surplus/(deficit) 867 657 (1,857)
Capital expenditure 217 1,708 137
Vested assets 629 300 10
Total other funding required 21 (1,351) (2,004)
Other funding provided by
General rate 1,134 1,134 194
Debt increase/(decrease) (401) 103 (435)
Reserves and future surpluses (754) 114 2,245
Total other funding (21) 1,351 2,004
MAJOR VARIANCESFinancial contributions were $182k lower than budget due to distribution of growth in the District, however they were $486k higher than 2015 reflecting the upturn in growth around the District.
Vested assets were $329k higher than budget as a result of increased development growth in the District. These assets which include gravity mains, and manholes, are installed by developers and vested to Council on completion.
Other income budget of $160k includes subsidies and grants to fund capital expenditure. This capital expenditure was deferred.
An increase in the stormwater uniform annual charge and an increase in the number of rateable properties resulted in a $939k increase in targeted rates compared to 2015. This was consulted on as part of the 2015-2025 Long Term Plan.
Capital expenditure was $1.49m under budget. Waihi Beach Two Mile Creek downstream was $431k under budget pending further consultation with land owners and design finalisation, and Otawhiwhi Marae stormwater drain $400k was not started and is subject to external funding.
General rate contribution reflects the amended revenue and finance policy for stormwater, where 90% of rating income is provided by the stormwater UAC and 10% is contributed from the General rate.
There is also a contribution from the General rate to fund growth related debt. This was consulted on, and is incorporated in the financial strategy included in the 2015-25 Long Term Plan.
96 | CHAPTER TWO | XXX
NATURAL ENVIRONMENT
NATURAL ENVIRONMENT | CHAPTER TWO | 97
NATURAL ENVIRONMENTOVERVIEWThe natural environment of the Western Bay is one of our most valuable assets covering 212,000 hectares of coastal, rural and urban areas. The land of the Western Bay of Plenty faces north-east to the sea. To the West are the rugged bush-covered Kaimai ranges. Numerous streams drain the Kaimais, flowing down through the hills and coastal lowlands into the swampy estuaries and mudflats of the Tauranga Harbour.
The activities that are provided within the Natural Environment Strategy include:
• Environmental education programmes and initiatives delivered mostly through service delivery contracts with Wild About New Zealand and Coastcare
• Support for community based environmental projects provided by our Environmental Development Officer who helps communities to realise their capacity to drive and implement environmental projects
• Fencing subsidies to encourage the protection of important ecological areas on private land
• A small fund that can be used to support projects or initiatives that enhance the quality of the environment.
WHY WE PROVIDE ITOUR COMMUNITY OUTCOMEAreas of our natural environment with important environmental, cultural and heritage values are protected.
OUR GOALS• Support the provision of environmental education and information across our District
• Support community based environmental projects.
2015/16 HIGHLIGHTSDuring the year we continued to support and assist community based groups in their work on environmental projects. Our assistance ranged from administration support to helping to translocate endangered bird species.
To help stimulate environmental activity within the Te Puke area we sponsored the Te Puke Environment Expo. This expo was held on 2nd July 2016 and resulted in a number of people volunteering to assist various projects around Te Puke.
Through our Community Matching Fund the largest grant went to the Aongatete Outdoor Education Centre who were partnering with the Aongatete Forest Restoration Trust. They obtained funding to erect 29 interpretative panels covering geology, rongoa (medicinal plants); interesting aspects of the ecosystem; and conservation. This one grant answered the needs of several groups including Forest and Bird. The official unveiling of the nature trail is scheduled for September 2016.
We continued to support the Biodiversity Management Plans for environmental care groups. There are currently four plans in place. Our support involves a 25% cost share on many of the project costs. We also continued our support for private land owners with subsidies for fencing off and planting of ecological features and water ways and the rehabilitation of wetland remnants.
We supported various community projects by supplying plants. These projects included: Pongakawa School wetlands, Ngamuwahine School Camp, Te Arakahikatea walkway (Te Puke) and the Maketu Taiapure’s ‘Borrow Pits’ project on the Kaituna River that aims to restore whitebait habitat and populations.
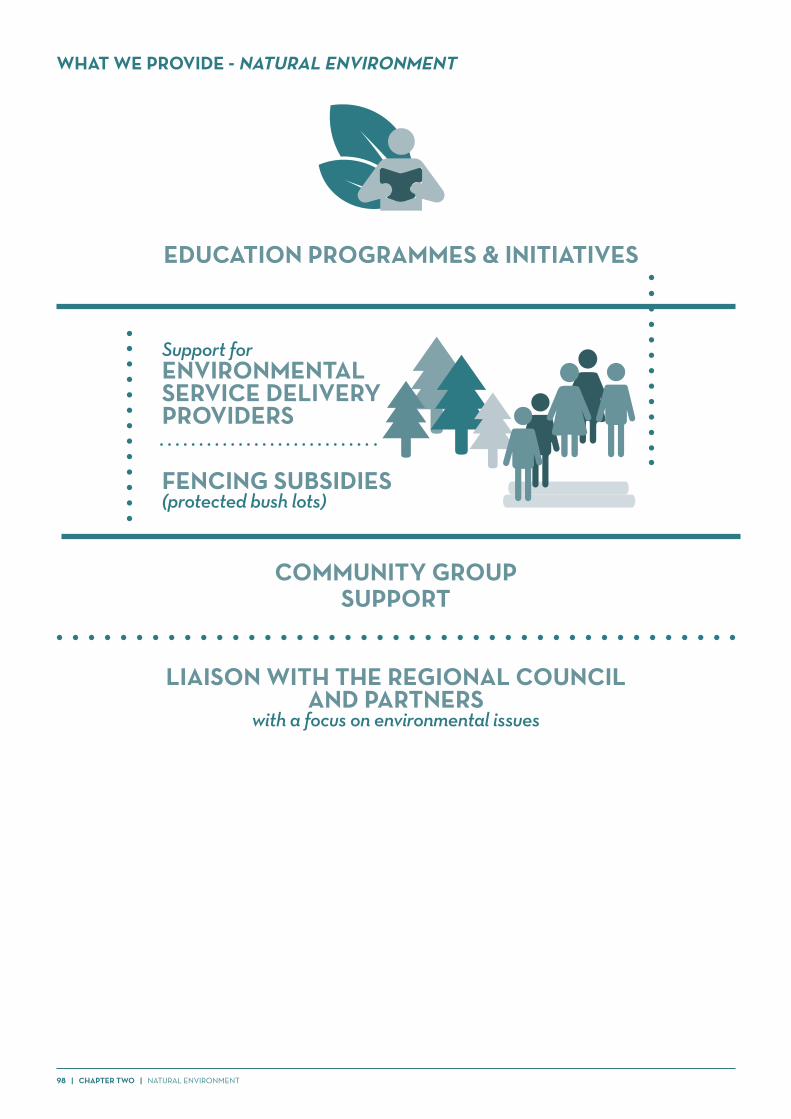
98 | CHAPTER TWO | NATURAL ENVIRONMENT
LIAISON WITH THE REGIONAL COUNCIL AND PARTNERS
with a focus on environmental issues
WHAT WE PROVIDE - NATURAL ENVIRONMENT
EDUCATION PROGRAMMES & INITIATIVES
Support for ENVIRONMENTAL SERVICE DELIVERY PROVIDERS
COMMUNITY GROUPSUPPORT
FENCING SUBSIDIES (protected bush lots)

NATURAL ENVIRONMENT | CHAPTER TWO | 99
HOW WE HAVE TRACKED PROGRESS TOWARDS OUR GOALS
PERFORMANCE MEASURES
2015/16 2014/15
NARRATIVETARGET RESULT RESULT
Key Performance MeasureNumber of protection lots monitored to ensure compliance with covenants.
≥40 100 NEW
Key Resident MeasurePercentage of residents surveyed who perceive the environmental attributes monitored have improved or being maintained.
Please note: the environmental features monitored include the quality of streams and rivers, harbours and estuaries, air quality, the amount of noxious weeds, protection of historic places, general level of cleanliness and the amount and quality of native plants and animals.
≥40% 81% 41%
This result exceeds the target as this measure now includes those who perceive the environmental attributes have been maintained i.e. it is neither better or worse.
The target and result were calculated excluding those surveyed who ‘don’t know’. The survey result including those that don’t know is 73%.
Supporting MeasureAnnual number of training initiatives supported.
≥5 5 NEW
HOW WE HAVE TRACKED PROGRESS - LEVELS OF SERVICE
PERFORMANCE MEASURES
2015/16 2014/15
NARRATIVE ACHIEVEDTARGET RESULT RESULT
Facilitate and support community involvement in protecting and enhancing the natural environment
Percentage of environmental groups that Council actively supports. ≥50% 37.5% NEW Only 15 groups are actively supported. Number of individual landowners actively supported to protect remnant bush and riparian zones.
≥50 21 30This result is dependent upon the number of contracts successfully negotiated by Regional Council.
SERVICE PERFORMANCE RESULTSRESULT TRENDS FOR KEY MEASURES
30%
81%
100
0
20
40
60
80
100
0%
10%
20%
30%
40%
50%
60%
70%
80%
90%
2006 2007 2008 2009 2010 2011 2012 2013 2014 2015 2016
Lots
mon
itore
d
Satis
fact
ion
NATURAL ENVIRONMENT - TRENDS
Resident perception Number of protection lots monitored
100 | CHAPTER TWO | NATURAL ENVIRONMENT
FUTURE INITIATIVESWe will continue to explore opportunities to increase the level of support provided to environmental groups particularly in relation to the completion of larger projects which often incur some project management costs.
We will assist the Otanewainuku Kiwi Trust in the second trans-location of Kokako from the Kaharoa forest in Rotorua. The Kokako is an endangered species and does not survive where there is no protection from pests. The Otanewainuku forest is pest free and the first introduction of the Kokako are now breeding successfully.
The Community Matching Fund continues to provide a valid option for funding of environmental projects with $39,000 allocated each year. This has been underspent for two years. More work will be done with environmental groups on promoting this fund.

NATURAL ENVIRONMENT | CHAPTER TWO | 101
COST OF SERVICE STATEMENTNATURAL ENVIRONMENT
ACTUAL$’000
BUDGET$’000
ACTUAL$’000
2016 2016 2015
Analysis of expenditure by activity
Environment protection grants 96 101 97
Natural environment support 271 235 274
Coastcare 46 55 36
Ecological impact fees 5 - -
Waihi District Drainage - drains 110 126 -
Waihi District Drainage - pumps 168 173 -
Total operating expenditure 696 691 407
Analysis of expenditure by class
Direct costs 646 639 361
Overhead costs 42 45 39
Depreciation 8 7 7
Total operating expenditure 696 691 407
Revenue
Targeted rates 316 313 15
Financial contributions 158 111 58
Other income - - -
Total revenue 474 424 73
Net cost of service - surplus/(deficit) (222) (267) (334)
Capital expenditure - - -
Total other funding required (222) (267) (334)
Other funding provided by
General rate 146 130 142
Environmental protection rate 45 45 30
Reserves and future surpluses 31 92 162
Total other funding 222 267 334

102 | CHAPTER TWO | XXX
WASTEWATER
WASTEWATER | CHAPTER TWO | 103
WASTEWATEROVERVIEWOur long term goal for wastewater is to ensure that wastewater treatment and disposal systems are sustainable and continue to meet environmental and health and safety standards. We will continue to encourage households to explore and implement measures that reduce wastewater volume per person.
We have five wastewater treatment plants at Katikati, Omokoroa, Maketu/Little Waihi, Te Puke and Waihi Beach.
WHY WE PROVIDE ITOUR COMMUNITY OUTCOMEWastewater services are well planned and maintained to ensure a clean and healthy environment.
OUR GOALS• All areas in our District served by reticulated wastewater disposal systems meet acceptable health, safety and environmental
standards
• Assist small urban communities along the Tauranga Harbour to ensure that the wastewater disposal options available to them meet health and safety requirements.
2015/2016 HIGHLIGHTSWe finished our pre-application work for our resource consent renewals for the Katikati and Te Puke treatment plants. These discharge consents have now been lodged with Regional Council and we are seeking a 20 year consent for Katikati and 35 year consent for Te Puke. Extensive community and iwi consultation has been undertaken in conjunction with the consent applications. We also applied for a 20 year resource consent to allow us to inspect the Katikati pipeline which goes through the harbour. The consent, if granted will allow us to gain a better understanding of the condition of the pipeline and its expected life.
This year in Katikati we monitored the wastewater flows to identify where stormwater may be entering the network. When stormwater gets into the network it increases the flow to the treatment plant, resulting in increased operating expenditure and the potential for wastewater overflows. Where issues are identified remedial action is taken or scheduled to address the problem. The Katikati treatment plant undertook a number of significant upgrades. In doing this the treatment plant discharge quality has been improved and the treatment plant meets resource consent conditions. Landscaping and fencing was also completed around the treatment plant.
At Waihi Beach we installed an additional sludge storage pond to address the sludge build up at the treatment plant. The ultra violet sterilisation scheme was also upgraded and riparian landscaping was completed at the treatment plant.
At the Maketu treatment plan we planted a buffer zone between the irrigation and the Hilltop Holiday Park. The decant pond was covered to prevent algal growth in the summer, and the sludge trailer was covered to control flies and odour in the summer months.
At Te Puke wastewater treatment plant netting was placed over the curation zone, to address health and safety issues. Other treatment plants are also being monitored in terms of the new health and safety legislation and issues identified are addressed on an ongoing basis.

104 | CHAPTER TWO | WASTEWATER
WHAT WE PROVIDE
MAKETU37.8 KILOMETRES
of pipes
522 HOUSEHOLD PUMPS
2 BOOSTER PUMPS
• treatment plant with two sequential batch reactor tanks and emergency pond
• discharge to land via subsurface drip irrigation
14 PUMP STATIONS
• sewage is pumped to the Tauranga City Chapel Street plant for treatment
7 PUMP STATIONS
• treatment plant with a sequentially activated sludge system, ultraviolet disinfection and wetland
14 PUMP STATIONS
• treatment plant with aerated lagoons, ultraviolet disinfection and wetland
23 PUMP STATIONS
• treatment plant with aerated lagoons, ultraviolet disinfection and wetland
OMOKOROA64.4 KILOMETRES
of pipes
TE PUKE71.5 KILOMETRES
of pipes
KATIKATI73.2 KILOMETRES
of pipes
WAIHI BEACH79.0 KILOMETRES
of pipes
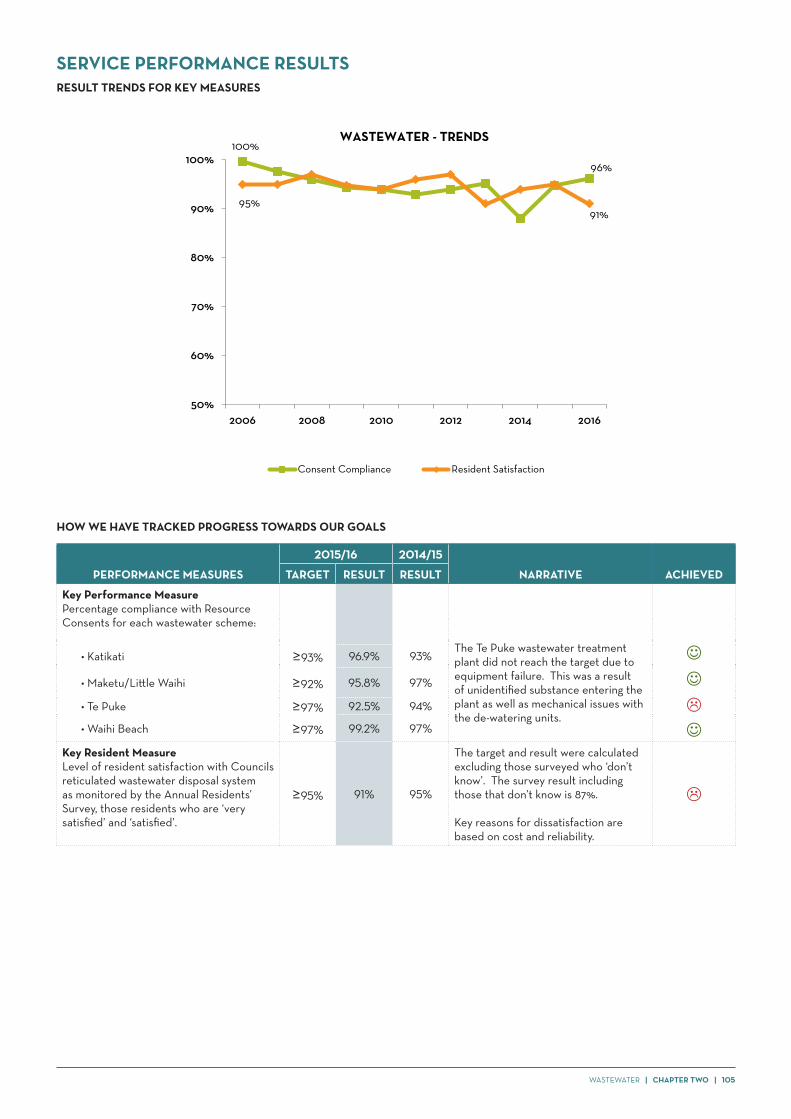
WASTEWATER | CHAPTER TWO | 105
HOW WE HAVE TRACKED PROGRESS TOWARDS OUR GOALS
PERFORMANCE MEASURES
2015/16 2014/15
NARRATIVE ACHIEVEDTARGET RESULT RESULT
Key Performance MeasurePercentage compliance with Resource Consents for each wastewater scheme:
The Te Puke wastewater treatment plant did not reach the target due to equipment failure. This was a result of unidentified substance entering the plant as well as mechanical issues with the de-watering units.
• Katikati ≥93% 96.9% 93%
• Maketu/Little Waihi ≥92% 95.8% 97%
• Te Puke ≥97% 92.5% 94%
• Waihi Beach ≥97% 99.2% 97% Key Resident MeasureLevel of resident satisfaction with Councils reticulated wastewater disposal system as monitored by the Annual Residents’ Survey, those residents who are ‘very satisfied’ and ‘satisfied’.
≥95% 91% 95%
The target and result were calculated excluding those surveyed who ‘don’t know’. The survey result including those that don’t know is 87%.
Key reasons for dissatisfaction are based on cost and reliability.
SERVICE PERFORMANCE RESULTSRESULT TRENDS FOR KEY MEASURES
100%
96%
95%91%
50%
60%
70%
80%
90%
100%
2006 2008 2010 2012 2014 2016
WASTEWATER - TRENDS
Consent Compliance Resident Satisfaction

106 | CHAPTER TWO | WASTEWATER
HOW WE HAVE TRACKED PROGRESS - LEVELS OF SERVICE
PERFORMANCE MEASURES
2015/16 2014/15
NARRATIVE ACHIEVEDTARGET RESULT RESULT
Maintain wastewater systems and have capacity to meet demand
The number of dry weather sewerage overflows from Council’s sewerage system, expressed per 1000 sewerage connections to that sewerage system.NOTE: only applies when, 1mm of rain has fallen in a 24 hr period.
≤2 3.3 NEW
Dry weather overflows occur where there is less than 1mm of rain. This is usually a result of system abuse where items that are not compatible (e.g. fat, clothing etc) are disposed of in the system.
Compliance with resource consents for discharge from the sewerage system measured by the number of; • Abatement notices • Infringement notices • Enforcement orders • Convictions.received in relation to those resource consents.
0 0 NEW
Provide wastewater services that meet customer needs
The median response time for Council to attend to sewerage overflows resulting from a blockage or other fault in the Council sewerage system.
• Attendance time: from the time that Council receives notification to the time that service personnel reach the site.
≤1 HOUR31
MINUTES NEW
• Resolution time: from the time that Council receives notification to the time that service personnel confirm resolution of the blockage or other fault.
≤24 HOURS
2 HOURS& 40
MINUTESNEW
The total number of complaints received by Council about: • Sewerage odour • Sewerage system faults • Sewerage system blockages • Council’s response to issues with
sewerage system.
≤45 22.6 NEW
Expressed per 1000 connections to the Councils sewerage system.
FUTURE INITIATIVESThe reticulation for the Te Puna West wastewater scheme will begin in November 2016. This will be linking into the Omokoroa pipeline to Tauranga. We will undertake the design and investigations for Ongare Point wastewater in 2016 with the aim of completing the reticulation in 2017.
We will continue to work with the iwi, community members and the working group in regard to the resource consent renewal discharge options for Katikati and Te Puke. Upgrade work will also be undertaken at the Te Puke treatment plant.
At Waihi Beach we will undertake an infiltration and inflow study as part of the wastewater treatment plant resource consent conditions. We will also complete a wastewater model to enhance our understanding of capacity issues.
We will be developing a District-wide bio-solids road map. This will enable us to understand how we manage bio-solids from the various wastewater treatment plants.
We will continue to work with the Bay of Plenty Regional Plan in the review of the On Site Effluent Treatment Plan. This is a 2 – 3 year project regarding property owners wastewater systems.

WASTEWATER | CHAPTER TWO | 107
COST OF SERVICE STATEMENTDISTRICT-WIDE WASTEWATER
ACTUAL$’000
BUDGET$’000
ACTUAL$’000
2016 2016 2015
Analysis of expenditure by activity
Waihi Beach wastewater 3,427 3,424 3,350
Katikati wastewater 1,856 1,900 1,708
Omokoroa wastewater 3,938 4,060 4,481
Te Puke wastewater 1,796 1,737 1,817
Maketu wastewater 1,291 1,190 1,168
Ongare wastewater 6 50 -
Total operating expenditure 12,314 12,360 12,524
Analysis of expenditure by class
Direct costs 3,981 3,915 3,375
Overhead costs 1,294 1,310 1,286
Interest 3,539 3,651 3,876
Asset revaluation - - 522
Depreciation 3,500 3,484 3,465
Total operating expenditure 12,314 12,360 12,524
Revenue
Targeted rates 9,323 9,338 8,819
User fees 5 2 2
Financial contributions 1,545 1,382 258
Vested assets 386 340 12
Asset revaluation - - 142
Other income 30 - 43
Total revenue 11,289 11,062 9,276
Net cost of service - surplus/(deficit) (1,025) (1,298) (3,248)
Capital expenditure 1,436 1,009 509
Vested assets 386 340 12
Total other funding required (2,847) (2,647) (3,769)
Other funding provided by
General rate 950 950 482
Environmental protection rate 444 468 476
Debt increase/(decrease) (803) (739) (1,141)
Reserves and future surpluses 2,256 1,969 3,952
Total other funding 2,847 2,647 3,769
MAJOR VARIANCESFinancial contributions were $163k higher than budget and $1.29m higher than 2015 due to increased growth in the District.
Capital expenditure was $426k higher than budget, including Katikati wastewater where timing has been brought forward from 2016/17.
Interest is lower than budget by $94k and lower than last year by $319k. This is a result of paying down debt more quickly than forecast and the contribution from the General Rate as set out in Council's Financial Strategy.
An increase in the wastewater uniform annual charge and an increase in the number of rateable properties resulted in an additional $504k being collected from wastewater targeted rates over last year.
General rate - Council policy is to fund from the general rate an average of $2.5m per year to cover the shortfall in financial contributions income that would have funded interest on growth related debt. Funding for wastewater was $950k.
There were no revaluations in 2016. Revaluations are carried out every three years, the last revaluation being 2015, the next revaluation is scheduled for 2018.
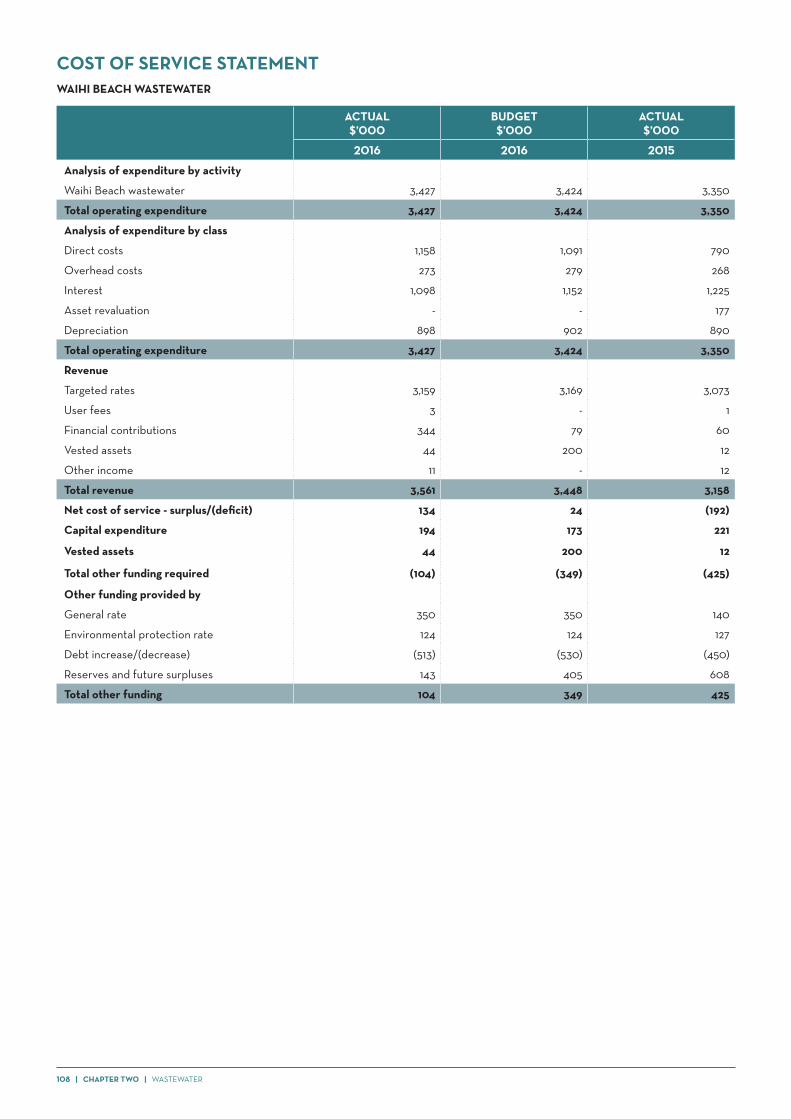
108 | CHAPTER TWO | WASTEWATER
COST OF SERVICE STATEMENTWAIHI BEACH WASTEWATER
ACTUAL$’000
BUDGET$’000
ACTUAL$’000
2016 2016 2015
Analysis of expenditure by activity
Waihi Beach wastewater 3,427 3,424 3,350
Total operating expenditure 3,427 3,424 3,350
Analysis of expenditure by class
Direct costs 1,158 1,091 790
Overhead costs 273 279 268
Interest 1,098 1,152 1,225
Asset revaluation - - 177
Depreciation 898 902 890
Total operating expenditure 3,427 3,424 3,350
Revenue
Targeted rates 3,159 3,169 3,073
User fees 3 - 1
Financial contributions 344 79 60
Vested assets 44 200 12
Other income 11 - 12
Total revenue 3,561 3,448 3,158
Net cost of service - surplus/(deficit) 134 24 (192)
Capital expenditure 194 173 221
Vested assets 44 200 12
Total other funding required (104) (349) (425)
Other funding provided by
General rate 350 350 140
Environmental protection rate 124 124 127
Debt increase/(decrease) (513) (530) (450)
Reserves and future surpluses 143 405 608
Total other funding 104 349 425
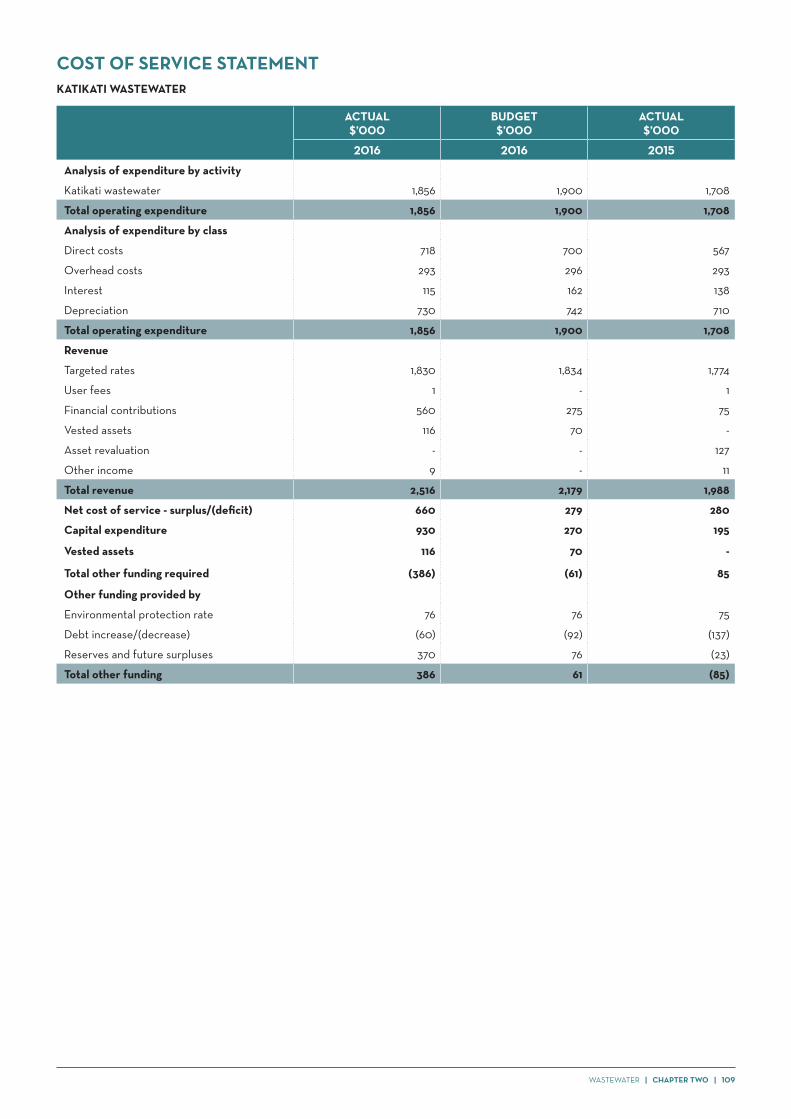
WASTEWATER | CHAPTER TWO | 109
COST OF SERVICE STATEMENTKATIKATI WASTEWATER
ACTUAL$’000
BUDGET$’000
ACTUAL$’000
2016 2016 2015
Analysis of expenditure by activity
Katikati wastewater 1,856 1,900 1,708
Total operating expenditure 1,856 1,900 1,708
Analysis of expenditure by class
Direct costs 718 700 567
Overhead costs 293 296 293
Interest 115 162 138
Depreciation 730 742 710
Total operating expenditure 1,856 1,900 1,708
Revenue
Targeted rates 1,830 1,834 1,774
User fees 1 - 1
Financial contributions 560 275 75
Vested assets 116 70 -
Asset revaluation - - 127
Other income 9 - 11
Total revenue 2,516 2,179 1,988
Net cost of service - surplus/(deficit) 660 279 280
Capital expenditure 930 270 195
Vested assets 116 70 -
Total other funding required (386) (61) 85
Other funding provided by
Environmental protection rate 76 76 75
Debt increase/(decrease) (60) (92) (137)
Reserves and future surpluses 370 76 (23)
Total other funding 386 61 (85)

110 | CHAPTER TWO | WASTEWATER
COST OF SERVICE STATEMENTOMOKOROA WASTEWATER
ACTUAL$’000
BUDGET$’000
ACTUAL$’000
2016 2016 2015
Analysis of expenditure by activity
Omokoroa wastewater 3,938 4,060 4,480
Total operating expenditure 3,938 4,060 4,480
Analysis of expenditure by class
Direct costs 685 806 760
Overhead costs 283 280 270
Interest 2,230 2,264 2,376
Asset revaluation - - 335
Depreciation 740 709 739
Total operating expenditure 3,938 4,060 4,480
Revenue
Targeted rates 1,464 1,473 1,406
User fees 1 -
Financial contributions 557 779 122
Vested assets 161 70 -
Other income 2 - 9
Total revenue 2,184 2,322 1,537
Net cost of service - surplus/(deficit) (1,754) (1,737) (2,943)
Capital expenditure 2 100 -
Vested assets 161 70 -
Total other funding required (1,917) (1,907) (2,943)
Other funding provided by
General rate 600 600 342
Environmental protection rate 118 118 169
Debt increase/(decrease) (181) (82) (153)
Reserves and future surpluses 1,379 1,271 2,585
Total other funding 1,917 1,907 2,943

WASTEWATER | CHAPTER TWO | 111
COST OF SERVICE STATEMENTTE PUKE WASTEWATER
ACTUAL$’000
BUDGET$’000
ACTUAL$’000
2016 2016 2015
Analysis of expenditure by activity
Te Puke wastewater 1,796 1,737 1,817
Total operating expenditure 1,796 1,737 1,817
Analysis of expenditure by class
Direct costs 838 810 814
Overhead costs 299 301 298
Interest (49) (52) (9)
Asset revaluation - - 10
Depreciation 708 678 704
Total operating expenditure 1,796 1,737 1,817
Revenue
Targeted rates 2,422 2,456 2,124
Financial contributions 82 237 -
Vested assets 65 - -
Asset revaluations - - 15
Other income 7 - 9
Total revenue 2,576 2,693 2,148
Net cost of service - surplus/(deficit) 780 957 331
Capital expenditure 217 366 62
Vested assets 65 - -
Total other funding required 498 591 269
Other funding provided by
Environmental protection rate 102 102 89
Debt increase/(decrease) (49) (35) (401)
Reserves and future surpluses (551) (658) 43
Total other funding (498) (591) (269)
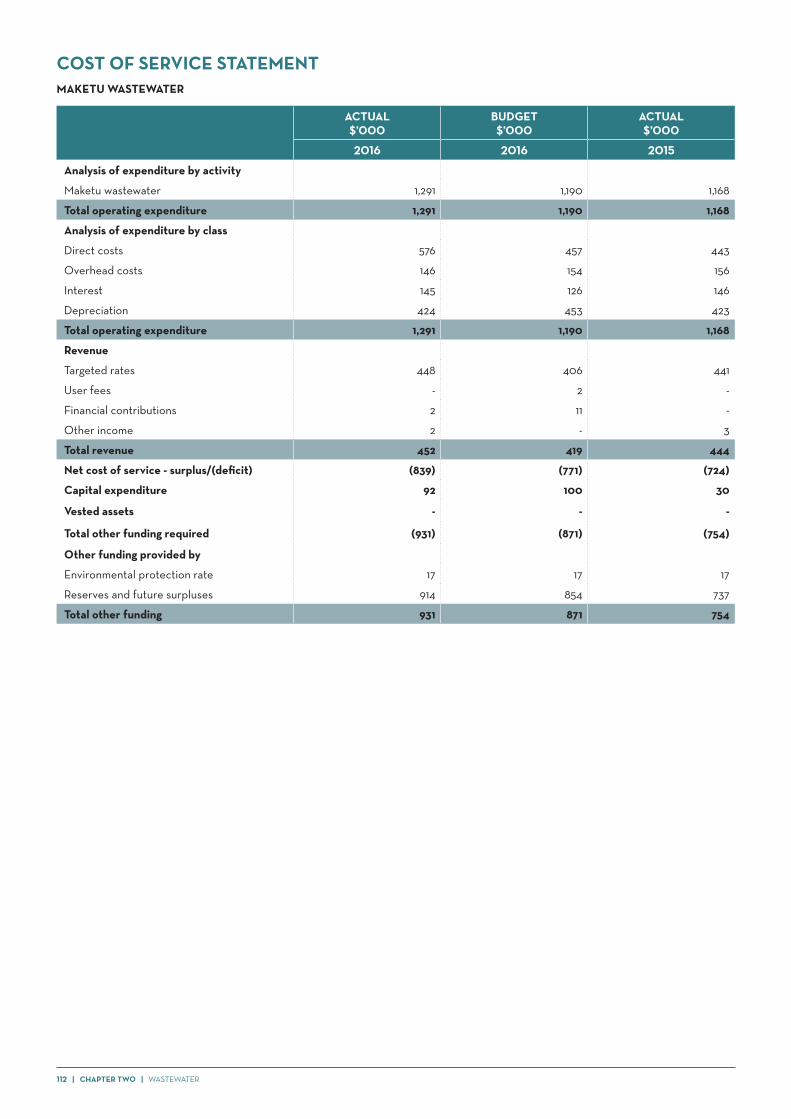
112 | CHAPTER TWO | WASTEWATER
COST OF SERVICE STATEMENTMAKETU WASTEWATER
ACTUAL$’000
BUDGET$’000
ACTUAL$’000
2016 2016 2015
Analysis of expenditure by activity
Maketu wastewater 1,291 1,190 1,168
Total operating expenditure 1,291 1,190 1,168
Analysis of expenditure by class
Direct costs 576 457 443
Overhead costs 146 154 156
Interest 145 126 146
Depreciation 424 453 423
Total operating expenditure 1,291 1,190 1,168
Revenue
Targeted rates 448 406 441
User fees - 2 -
Financial contributions 2 11 -
Other income 2 - 3
Total revenue 452 419 444
Net cost of service - surplus/(deficit) (839) (771) (724)
Capital expenditure 92 100 30
Vested assets - - -
Total other funding required (931) (871) (754)
Other funding provided by
Environmental protection rate 17 17 17
Reserves and future surpluses 914 854 737
Total other funding 931 871 754

XXX | CHAPTER TWO | 113
SOLID WASTE

114 | CHAPTER TWO | SOLID WASTE
SOLID WASTEOVERVIEWHuman activity is inextricably linked to the health of our natural environment. A healthy environment is essential for overall well-being and prosperity. With our population growing, so demands on our natural resources will increase. The challenge is to lessen our impacts on the environment and reduce consumption and waste. Our Solid Waste Strategy sets out our sustainable development approach to the management of solid waste activities across our District.
The primary aim of this Strategy is to reduce the amount of waste produced by reducing, reusing, recycling and recovering.
WHY WE PROVIDE ITOUR COMMUNITY OUTCOMEEfficient waste management practices minimise environmental harm and waste.
OUR GOALS• Minimise the total quantity of residual waste for disposal through effective planning, education and enforcement so people reduce,
reuse and recycle
• Provide good information so people dispose of residual waste in an environmentally acceptable manner
• Work with our communities to create a clean environment by encouraging and recognising innovative solutions to waste problems.
2015/2016 HIGHLIGHTSThis year we have enjoyed a 20% increase in usage of our recycling centres, with over 200 vehicles using the centre every three hours. In recognising the increased usage we have continued to refine our processes and modify our facilities. This includes the upgrade of the Athenree recycling centre to increase storage area available for product. At Katikati we have investigated a new system to receive glass and cardboard, in order to comply with the new Health and Safety Legislation. This will be rolled out to all the recycling centres in the New Year. New product signage has also been installed at the centres.
The Matakana Island community in conjunction with the Ministry of Environment have established a recycling facility on Matakana Island. It has been a challenge for them to move product off the island. However, by utilising the trucks to deliver compost to the island for their nursery we are able to backload recycling product back to Katikati for processing. We have also arranged with the metal recycler to remove the metal collected at the recycling centre off the island.
Our first Waste Management & Minimisation Plan (WMMP) was completed jointly with Tauranga City Council in 2010. This plan must be reviewed every six years as a legislative requirement under the Waste Minimisation Act 2008 that requires Councils to promote effective and efficient waste management and minimisation within its district. The review of this plan has commenced and while a joint vision, objectives and goals were agreed by the Joint Governance Committee in May 2016, the plan will be developed separately. As a result we won’t meet the deadline and our waste levy will be retained until the plan is reviewed.
The number of abandoned vehicles we are required to dispose has increased and this has been attributed to the decline in metal prices. We anticipate this trend will continue.
To discourage the disposal of household waste on the road side a ‘sting’ operation was undertaken on Te Matai Rd. Based on the evidence found this provided the opportunity to identify and fine the offenders.
Other initiatives undertaken include:• A rural waste survey to find out how rural properties and farms
dispose of their waste• Supporting the national ‘Love Food, Hate Waste’ initiative
which commenced in June 2016. This is a three year initiative to reduce the amount of household food waste
• Provision of recycling facilities at key events held in the district. This includes the Summer Fair in Waihi Beach, the Wine and Avocado Festival in Katikati and the Kaimoana Festival in Maketu.
Our sponsorship and/or support for waste minimisation programmes extend to:• The Enviro challenge for Bay of Plenty secondary schools• ‘Waste free Parenting’ workshops by the Nappy Lady• Paper 4 Trees and Zero Waste Education for pre-school to
secondary schools• Para Kore – implementation of recycling systems on marae in
the District• Business waste minimisation which is a free programme to
businesses in how to reduce waste and increase recycling through Waste Watchers.

SOLID WASTE | CHAPTER TWO | 115
WHAT WE PROVIDE
Waihi Beach
Athenree
Katikati
Maketu
Pukehina Beach
Paengaroa
TAURANGA CITY
OmokoroaTe Puna
Te Puke
EDUCATION PROGRAMMES
RECYCLING & GREENWASTE CENTRESKatikati, Te Puke, Athenree
GREENWASTE DROP-OFFOmokoroa
CLOSED & CAPPED LANDFILLS
ILLEGAL DUMPING (FLY-DUMPING)
ONGOING MONITORING OF
MONITOR
Athenree, Te Puke, Waihi Beach
across our District

116 | CHAPTER TWO | SOLID WASTE
HOW WE HAVE TRACKED PROGRESS TOWARDS OUR GOALS
PERFORMANCE MEASURES
2015/16 2014/15
NARRATIVETARGET RESULT RESULT
Key Performance Measure Percentage of actions, identified in the Solid Waste Action Plan for the year that have been completed. This identifies the total annual actions required for this strategy. Actions are required within specification and budget.
97% 100% 100%
Key Resident Measure Percentage level of customer satisfaction with household rubbish disposal methods. As measured through our Annual Residents’ Survey, those customers who are ‘very satisfied’ and ‘satisfied’.
78% 80% 79%
The target and result were calculated excluding those surveyed who ‘don’t know’. The survey result including those that don’t know is 59%.
Supporting Measures Percentage of waste recycled or recovered as estimated and reported by licensed operators (excludes waste disposed of privately).
We include estimates because we do not have weighbridges.
36% NOT REPORTED 25%
Due to the delay in the review of the Waste Management & Minimisation Plan (WMMP) the relicensing of trade waste operators has also been delayed. The review of the plan will be finalised early 2017 and then relicensing of waste operators will occur.
Number of initiatives funded by the Ministry for the Environment Waste Minimisation Scheme.
1 1 1
SERVICE PERFORMANCE RESULTSRESULT TRENDS FOR KEY MEASURES
100%100%
64%
80%
0%
20%
40%
60%
80%
100%
2006 2008 2010 2012 2014 2016
SOLID WASTE - TRENDS
Work programme completion
Resident Satisfaction
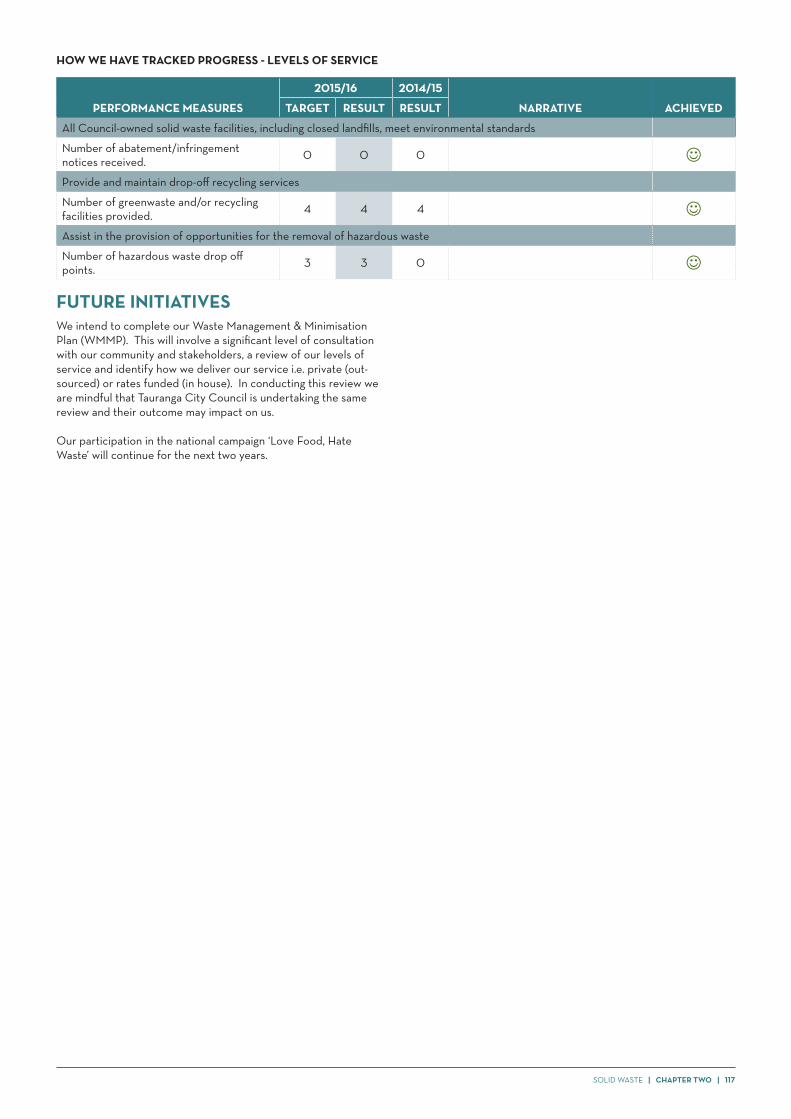
SOLID WASTE | CHAPTER TWO | 117
HOW WE HAVE TRACKED PROGRESS - LEVELS OF SERVICE
PERFORMANCE MEASURES
2015/16 2014/15
NARRATIVE ACHIEVEDTARGET RESULT RESULT
All Council-owned solid waste facilities, including closed landfills, meet environmental standards
Number of abatement/infringement notices received. 0 0 0 Provide and maintain drop-off recycling services
Number of greenwaste and/or recycling facilities provided. 4 4 4 Assist in the provision of opportunities for the removal of hazardous waste
Number of hazardous waste drop off points. 3 3 0
FUTURE INITIATIVESWe intend to complete our Waste Management & Minimisation Plan (WMMP). This will involve a significant level of consultation with our community and stakeholders, a review of our levels of service and identify how we deliver our service i.e. private (out-sourced) or rates funded (in house). In conducting this review we are mindful that Tauranga City Council is undertaking the same review and their outcome may impact on us.
Our participation in the national campaign ‘Love Food, Hate Waste’ will continue for the next two years.

118 | CHAPTER TWO | SOLID WASTE
COST OF SERVICE STATEMENTSOLID WASTE
ACTUAL$’000
BUDGET$’000
ACTUAL$’000
2016 2016 2015
Analysis of expenditure by activity
District solid waste 349 682 289
Western solid waste 479 465 352
Eastern solid waste 348 461 370
Omokoroa greenwaste 129 155 140
Total operating expenditure 1,305 1,763 1,151
Analysis of expenditure by class
Direct costs 789 1,216 576
Overhead costs 463 490 445
Interest 22 30 19
Asset revaluation - - 83
Depreciation 31 28 28
Total operating expenditure 1,305 1,763 1,151
Revenue
Targeted rates 1,069 1,055 1,023
User fees 93 67 52
Subsidies 168 65 151
Asset revaluation - - 82
Other income 119 10 52
Total revenue 1,449 1,197 1,360
Net cost of service - surplus/(deficit) 144 (566) 209
Capital expenditure 118 - -
Total other funding required 26 (566) 209
Other funding provided by
Environmental protection rate 271 617 289
Debt increase / (decrease) - - -
Reserves and future surpluses (297) (51) (498)
Total other funding (26) 566 (209)
MAJOR VARIANCESDirect costs were $427k lower than budget and includes savings on maintenance cost of $249k, waste eradication program $36k and consultants $29k.
Reduction in the Environmental Protection rate funding reflecting reduced operating expenses of $458k.

XXX | CHAPTER TWO | 119
ECONOMIC

120 | CHAPTER TWO | ECONOMIC
OVERVIEWEconomic development focuses on promoting the standard of living and economic health of a specific area. This strategy focuses on Councils role in supporting economic development, tourism, promotions, events and town centre development.
At a more strategic level Council is also a funder of Priority One, the Western Bay of Plenty subregion economic development agency who is focused on attracting businesses to the subregion and has been instrumental in progressing the development of a university campus in the central business district of Tauranga. Tourism Bay of Plenty, to which Council provides funding, has been instrumental in increasing the number of tourists to the District.
WHY WE PROVIDE ITOUR COMMUNITY OUTCOMETo encourage the sustainable use of local resources in a way which strengthens economic opportunities and improves social outcomes.
OUR GOALS• Foster partnerships between organisations, including local and central government and businesses to support economic, social,
cultural and environmental development
• Council services are committed to being business friendly to encourage and enable businesses to flourish and contribute to building vibrant communities
• Enable an environment where community groups and business can collaborate and work together on shared outcomes for communities.
2015/2016 HIGHLIGHTSThe Government is seeking to expand access to broadband to 75% of all New Zealanders. In March 2015 they announced three funding initiatives available – Ultra-Fast Broadband, Rural Broadband and a Mobile Black Spot Fund. We lodged a Registration of Interest for these three initiatives. As part of this we identified gaps in supply throughout the District and surveyed residents on various connection issues. The next phase was the creation of a Digital Enablement Plan to leverage this broadband infrastructure. This plan contains proposed actions to address issues identified as part of our community engagement process and aims to help the sub-region reach its full potential using digital technology to improve business productivity and people’s lives. In conjunction with Tauranga City Council we submitted a sub-regional plan to the Ministry of Business Innovation and Employment in September 2015.
We also approved funding in next year’s annual plan and budget for projects that will assist business, industry and community groups with improved access to and utilisation of digital technology.
The Service Delivery Contracts (SDC) enable specific organisations to focus on economic development in our respective communities, the District and the sub-region on our behalf. Katch Katikati, Te Puke EDG and Waihi Beach Events and Promotions all work within their communities to promote economic development and facilitate events and promotions.
In Te Puke a ‘M’ pilot, was run for six months by Shop Te Puke. The purpose was to deliver events and promotions in alternative ways. Due to its success this is now a permanent initiative.
In Katikati the refurbishment and earthquake strengthening of the old first station was completed. This enabled the building to house the very successful Unexpected Heroes exhibition from April – June 2016.
For the Waihi Beach Town Centre we are still looking to progress sale of land and construction of a footbridge across Two Mile Creek. This work is on hold, subject to the flood control works on Two Mile Creek being completed.
ECONOMIC

ECONOMIC | CHAPTER TWO | 121
WHAT WE PROVIDE
TOWN CENTRE PROMOTIONTe Puke, Katikati Waihi Beach
FOCUSED ON STRENGTHENING
ECONOMIC DEVELOPMENT & TOURISM
SUPPORT FOR EXTERNAL ORGANISATIONS
SUPPORTING
our local economics

122 | CHAPTER TWO | ECONOMIC
HOW WE HAVE TRACKED PROGRESS TOWARDS OUR GOALS
PERFORMANCE MEASURES
2015/16 2014/15
NARRATIVE ACHIEVEDTARGET RESULT RESULT
Key Performance Measure Percentage completion of the annual work programme as identified in our Economic Strategy and Action Plan.
≥90% 100% 92%
Key Resident Measure Level of resident satisfaction with our role in promoting employment, tourism and business opportunities within the sub-region. Monitored by the Annual Residents’ Survey, those residents that are ‘satisfied’ and ‘very satisfied’.
≥60% 60% 62%
The target and result were calculated excluding those surveyed who ‘don’t know’. The survey result including those that don’t know is 45%.
SERVICE PERFORMANCE RESULTSRESULT TRENDS FOR KEY MEASURES
100% 100%
37%
60%
0%
20%
40%
60%
80%
100%
120%
2006 2008 2010 2012 2014 2016
SUPPORTING THE ECONOMY - TRENDS
Actions Completed by Council Resident Satisfaction

ECONOMIC | CHAPTER TWO | 123
HOW WE HAVE TRACKED PROGRESS - LEVELS OF SERVICE
PERFORMANCE MEASURES
2015/16 2014/15
NARRATIVE ACHIEVEDTARGET RESULT RESULT
Council will support external organisations tasked with developing economic activity in the District
Level of resident satisfaction with the promotion of town centres and events in Katikati, Te Puke and Waihi Beach. Monitored by the Annual Residents’ Survey, those Residents that are ‘satisfied’ and ‘very satisfied’.
≥65% 65% 68%
Number of service delivery contracts related to economic development activity. 4 7 4 Percentage of economic contracts where contract requirements have been achieved. ≥90% 90% NEW
Number of joint economic initiatives identified in the service delivery contracts that have been implemented.
2 4 NEW
Council will facilitate economic development through the community development plans that have been developed for the District’s urban growth node towns or communities
Satisfaction of businesses with Councils role in economic development (two yearly survey).
≥60% 69% NEW
Number of economic action plans derived from our Community Development Plans. 6 8 7
FUTURE INITIATIVESWe are awaiting a response from Ministry of Business Innovation and Employment (MBIE) to our Digital Enablement Plan. In the meantime we will continue to progress this initiative.
The new service delivery arrangement in Te Puke will take effect in the 2016/17 financial year. This will enable one agency to focus on economic development while the other agency focuses on events and promotions.
We will continue to collaborate with TCC in the economic development of the sub-region. This includes the development of a Sub-Regional Art and Culture Strategy which is an overarching plan for the sub-region. Arts and culture are seen as drivers of economic development, promoting social good as well as promoting the identity of the sub-region. This process will be led by Creative Tauranga through our existing service delivery contract.

124 | CHAPTER TWO | ECONOMIC
COST OF SERVICE STATEMENTECONOMIC
ACTUAL$’000
BUDGET$’000
ACTUAL$’000
2016 2016 2015
Analysis of expenditure by activity
Economic support 383 424 487
Visitor information 63 58 60
Town centre promotion 372 163 234
*Waihi Land Drainage Society - - 290
Total operating expenditure 818 645 1,071
Analysis of expenditure by class
Direct costs 802 603 996
Overhead costs 101 124 147
Interest (85) (83) (72)
Depreciation - - -
Total operating expenditure 818 645 1,071
Revenue
Targeted rates 259 276 581
Interest - - -
Other income 46 2 40
Total revenue 305 278 621
Net cost of service - surplus/(deficit) (513) (367) (450)
Capital expenditure (266) 1,151 151
Total other funding required (247) (1,518) (601)
Other funding provided by
General rate 675 715 801
Interest in associates (25) - (69)
Reserves and future surpluses (403) 802 (131)
Total other funding 247 1,518 601
*Waihi Land Drainage Society has been moved to Natural Environment.
MAJOR VARIANCESDirect costs were $218k higher than budget with $216k of operational expenditure on the Katikati town centre development brought forward from future years.
Capital expenditure on the Katikati town centre development was $1.42m underspent, work now being scheduled for 2016/17.

XXX | CHAPTER TWO | 125
SUPPORT SERVICES
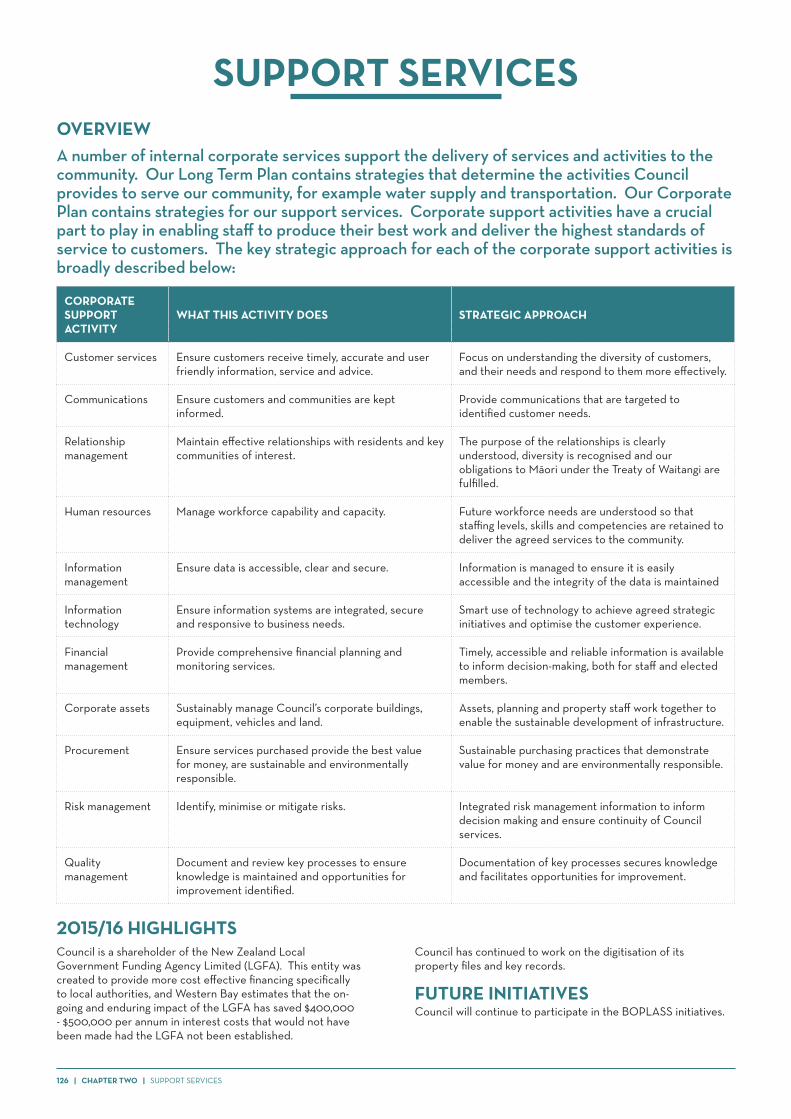
126 | CHAPTER TWO | SUPPORT SERVICES
OVERVIEWA number of internal corporate services support the delivery of services and activities to the community. Our Long Term Plan contains strategies that determine the activities Council provides to serve our community, for example water supply and transportation. Our Corporate Plan contains strategies for our support services. Corporate support activities have a crucial part to play in enabling staff to produce their best work and deliver the highest standards of service to customers. The key strategic approach for each of the corporate support activities is broadly described below:
CORPORATE SUPPORT ACTIVITY
WHAT THIS ACTIVITY DOES STRATEGIC APPROACH
Customer services Ensure customers receive timely, accurate and user friendly information, service and advice.
Focus on understanding the diversity of customers, and their needs and respond to them more effectively.
Communications Ensure customers and communities are kept informed.
Provide communications that are targeted to identified customer needs.
Relationship management
Maintain effective relationships with residents and key communities of interest.
The purpose of the relationships is clearly understood, diversity is recognised and our obligations to Māori under the Treaty of Waitangi are fulfilled.
Human resources Manage workforce capability and capacity. Future workforce needs are understood so that staffing levels, skills and competencies are retained to deliver the agreed services to the community.
Information management
Ensure data is accessible, clear and secure. Information is managed to ensure it is easily accessible and the integrity of the data is maintained
Information technology
Ensure information systems are integrated, secure and responsive to business needs.
Smart use of technology to achieve agreed strategic initiatives and optimise the customer experience.
Financial management
Provide comprehensive financial planning and monitoring services.
Timely, accessible and reliable information is available to inform decision-making, both for staff and elected members.
Corporate assets Sustainably manage Council’s corporate buildings, equipment, vehicles and land.
Assets, planning and property staff work together to enable the sustainable development of infrastructure.
Procurement Ensure services purchased provide the best value for money, are sustainable and environmentally responsible.
Sustainable purchasing practices that demonstrate value for money and are environmentally responsible.
Risk management Identify, minimise or mitigate risks. Integrated risk management information to inform decision making and ensure continuity of Council services.
Quality management
Document and review key processes to ensure knowledge is maintained and opportunities for improvement identified.
Documentation of key processes secures knowledge and facilitates opportunities for improvement.
2015/16 HIGHLIGHTSCouncil is a shareholder of the New Zealand Local Government Funding Agency Limited (LGFA). This entity was created to provide more cost effective financing specifically to local authorities, and Western Bay estimates that the on-going and enduring impact of the LGFA has saved $400,000 - $500,000 per annum in interest costs that would not have been made had the LGFA not been established.
Council has continued to work on the digitisation of its property files and key records.
FUTURE INITIATIVESCouncil will continue to participate in the BOPLASS initiatives.
SUPPORT SERVICES

SUPPORT SERVICES | CHAPTER TWO | 127
COST OF SERVICE STATEMENTSUPPORT SERVICES
ACTUAL$’000
BUDGET$’000
ACTUAL$’000
2016 2016 2015
Analysis of expenditure by activity
Support services 912 1,420 1,948
Corporate assets 2,006 1,447 2,715
Treasury 6,953 1,359 7,795
Total operating expenditure 9,871 4,226 12,458
Analysis of expenditure by class
Direct costs* 13,651 13,450 14,353
Overhead recoveries (11,095) (10,885) (10,562)
Interest** 6,020 680 6,904
Depreciation 1,295 982 1,102
Asset revaluation - - 661
Total operating expenditure 9,871 4,226 12,458
Revenue
Targeted rates 153 (229) 496
General rate 3,717 2,062 3,595
User fees 13 14 16
Vested assets - - 253
Interest** 1,087 1,100 1,068
Asset revaluation - - 1,920
Other income including General Rates 1,337 892 1,196
Total revenue 6,307 3,838 8,544
Net cost of service - surplus/(deficit) (3,564) (388) (3,914)
Capital expenditure 2,541 1,376 1,795
Vested assets - - 253
Total other funding required (6,105) (1,764) (5,962)
Other funding provided by
Debt increase / (decrease) (2,993) (75) (232)
Proceeds from sale of assets 89 85 254
Reserves and future surpluses 9,009 1,754 5,940
Total other funding 6,105 1,764 5,962
*Net direct cost of support services after overhead recoveries** Net interest income/expense after internal interest recoveries
MAJOR VARIANCESInterest expense of $6.02m was $5.35m higher than budget. This includes $4.85m of unrealised hedging movement which is a non-cash accounting cost and when removed interest expense was $1.17m.
Depreciation was $313k higher than budget and includes an additional $237k computer software amortisation not budgeted.
Capital expenditure was $1.16m higher than budget and includes strategic and corporate property purchases not budgeted.
General Rate of $3.72m includes unallocated rates transferred to the General Rate reserve.
There were no revaluations in 2016. Revaluations are carried out every three years, the last revaluation being 2015, the next revaluation is scheduled for 2018.