chapter three summary - cegacega.berkeley.edu/assets/miscellaneous_files/wgape/10_york.pdf · 1...
TRANSCRIPT

1
Chapter Three Summary: Chieftaincy as Rival Governance in Ghana
Note: This is a summary/outline of a dissertation chapter I am currently writing. The dissertation argues that state weakness in Sub-Saharan Africa is, to a large extent, caused by the survival of hierarchical – as opposed to non-hierarchical/stateless – traditional institutions. The hierarchy of a traditional institution is measured as the number of levels of jurisdictional hierarchy beyond the local community (ICJH). A chiefdom, for example, is a traditional institution with a hierarchy of at least 3 levels (ICJH =3). A stateless traditional institution has a hierarchy of only one level (the village or sub-clan). I term level two traditional institutions semi-hierarchical (ICJH =2).
In this summary, I present: 1. The introduction to the chapter, which briefly reiterates the logic of the hypothesis I am
testing. Please note that the logic of the hypothesis is three-fold and I divide a test of this hypothesis into sections 2, 3 and 4 of the chapter, each section corresponding with one aspect of the three-fold logic.
2. A very brief description of section 1 of the chapter, which codes the ICJH of 4 ethnic and ethnolinguistic groups in Ghana with at least ten percent of the country’s total population. In the chapter, this section is over thirty pages, describing and coding the pre-colonial, colonial and post-colonial hierarchy of these 4 ethnic/ethnolinguistic groups.
3. A brief outline of section 2 of the chapter. This section is an analytic narrative of colonial and post-colonial Ghanaian history, focusing on the dual-principalship of Ghana’s hierarchical traditional leaders (agents of the state and their local communities). The section tests the first, and to some extent the second, aspect of the hypothesis’ logic.
4. A brief outline of section 3 of the chapter. This section describes the public goods and services traditional leaders/institutions provide their communities. It is a test of the second aspect of the hypothesis’ logic.
5. A presentation of section 4 of the chapter. This section examines individual preferences for governance by traditional institutions, and is a test of the third aspect of the hypothesis. While not yet complete, I present the stats that I have completed.
6. Some potential questions for discussion. Any and all comments are welcome. Peter A. York Ph.D. Student University of California, San Diego Department of Political Science 9500 Gilman Drive, #0521 La Jolla, CA 92093-0521 [email protected]

2
The hypothesis I developed in chapter two predicts that as the number of hierarchical
ethnic and ethnolinguistic groups within a state’s territory increases, state weakness increases.
The logic of this hypothesis is based on three reasons. First, because institutions within a
hierarchical ethnic and ethnolinguistic group screen, select, monitor, and check their agents, their
traditional leaders have greater incentives to respond to the preferences of their communities:
traditional leaders are not solely agents of the state. Second, leaders of hierarchical institutions
have greater capacity to respond to community preferences, and in doing so, leaders of
hierarchical groups obtain authority that can be leveraged against the authority of the state.
Third, if the territory of the state encompasses multiple hierarchical ethnic and ethnolinguistic
groups, as opposed to a single hierarchical ethnic or ethnolinguistic group, it is disadvantaged
with respect to the provision of public goods that satisfy preferences across all groups. In
responding to the preferences within a group, leaders of hierarchical traditional institutions
provide local-public goods that compete with the public goods of the state. Since the first and
second reasons are inter-related, the theory I develop in chapter two can be reduced to a two-by-
two table.
Table 1: The Theory
Hierarchical Traditional Institutions
Non-Hierarchical Traditional Institutions
Divergent Preferences (proxied by the number of ethnic/ethnolinguistic groups over 10% of the population)
Greater State Weakness (Ghana)
Less State Weakness (Case not determined yet)
Non-Divergent Preferences (proxied by the number of ethnic/ethnolinguistic groups over 10% of the country’s population)
Less State Weakness (Botswana)
Less State Weakness (case in this cell not examined in the dissertation)
With four hierarchical ethnic and ethnolinguistic groups with at least ten percent of the
country’s population, comprising roughly 64 percent of the total population, Ghana should be a
case of state weakness. To test this hypothesis, I separate my analysis of the Ghanaian case into
four sections. In the first section, I explain the independent variable of my analysis by describing

3
the distribution and institutional organization of Ghana’s ethnic and ethnolinguistic groups
during the pre-colonial, colonial and postcolonial period. Four hierarchically organized1 ethnic
and ethnolinguistic groups with at least ten percent of Ghana’s total population2 are identified:
the Akan, Ewe, and Mole-Dagbani ethnolinguistic groups; and the Asante (Ashanti) ethnic
group. Furthermore, I show that the hierarchy of these groups has remained relatively constant
from the pre-colonial to the contemporary period.
In section two, I employ an analytic narrative to examine the first two aspects of my
hypothesis. Emphasis is placed on the delegation relationships between the state, traditional
leaders, and their communities from the extension of colonial rule in the late 19th century to the
present. As agents of the state and their local communities, I examine the incentives hierarchical
traditional leaders have to respond to the preferences of their communities, against those of the
state. Furthermore, I examine the authority traditional leaders can leverage to resist state attempts
at control, including the formation of alliances across traditional leaders.
In section three, I examine the public goods hierarchical traditional leaders provide their
communities. In other words, I examine how hierarchical traditional leaders obtain authority by
providing tangible benefits to their communities. Emphasis is placed on the governance – the
public services and public goods – traditional leaders actually provide.
In section four, I examine micro-level evidence to assess individual preferences for
governance by chiefs. After presenting the results of a survey by Abotchie (1997), who finds that
Ewes prefer policing by traditional institutions over state institutions, I utilize Afrobarometer
survey data to examine preferences for governance by traditional institutions. I first examine
preferences for governance by chiefs. Then I examine preferences and preference divergence
across ethnic and ethnolinguistic groups for a specific public good provided by traditional
leaders, the administration of property rights in land.
Ghana is an ideal – though not necessarily a most-likely – case to examine the effects of
traditional institutions on state weakness for two reasons. First, our historical, anthropological,
and political knowledge of traditional institutions in Ghana is unprecedented on the African
continent. The advanced state of scholarship is also supplemented by the fact that chieftaincy is
actively debated throughout Ghanaian society. Therefore, additional information, primarily in the
form of newspaper articles, is readily available to test my model’s predictions. 1 See chapter 3. The hierarchy of a traditional institution is measured through ICJH, which measures the number of levels of legal hierarchy beyond the local community (village or sub-clan). It is an ordinal variable ranging from 0 (no political authority) to 3 (three levels of legal hierarchy; for chiefdoms this would correspond to three administrative levels of chieftaincy, with a king or paramount chief at the apex). 2 As I explain in chapter 3, I only code ethnic and ethnolinguistic groups with at least ten percent of a country’s total population.
4
Second, Ghana’s political history is marked by two periods where the state actively
sought to increase its hegemony by eliminating the authority of traditional leaders, as well as
replacing traditional institutions with regional and local administrative units. From the 1950’s to
1966, Kwame Nkrumah and the Convention People’s Party (CPP) sought to reduce the authority
of chiefs and expand the authority of a centralized, Ghanaian state. During this period, the issue
of cheiftaincy constituted a fundamental cleavage in national politics. Jerry Rawling’s
Provisional National Defense Council (PNDC), which ruled from December 31, 1981 to the
elections of 1992, was less explicitly hostile to chiefs. However, the regime actively sought to
reform local-level governance. This constituted an attempt to administratively undermine the
authority of traditional institutions. The variation in state preferences in the post-colonial period
allows us to examine how chiefs reacted to hostile regimes and employed strategies of survival.
I. The Pre-Colonial, Colonial and Contemporary Hierarchy of Ethnolinguistic Groups in Ghana
In this section I explain the coding of my independent variable, the number of
hierarchical ethnic and ethnolinguistic groups with at least ten percent of a country’s total
population, in Ghana. The classification of an ethnic or ethnolinguistic group is exceedingly
difficult and inevitably involves some arbitrary decisions (Alesina et al. 2003, Roeder 2001,
Laitin 2000, Morrison et al. 1989 and 1972). My research is no exception and readers should
take note of the fact that I utilize the category of ethnolinguistic group or ethnic group based on
circumstances surrounding the ICJH3 scores of the respective group’s traditional institutions. The
Ewe, for example, share similar ICJH scores across the individual ethnic groups, and I therefore
code them as a hierarchical ethnolinguistic group. The Mole-Dagbani, on the other hand, do not
share similar ICJH scores across the ethnic groups within the ethnolinguistic group, but as I
explain below, a large share of the Mole-Dagbani peoples are members of the hierarchical
chiefdoms of Dagomba, Mamprussi, Mossi, Wala, and Nanumba. I therefore code the Mole-
Dagbani as a hierarchical ethnolinguistic group. Finally, I separate the Asante from the Akan
ethnolinguistic group even though they have similar traditional institutions. The reason for this is
the fact that the Asante was, and is, a polity distinct from other Akan polities, due to its history as
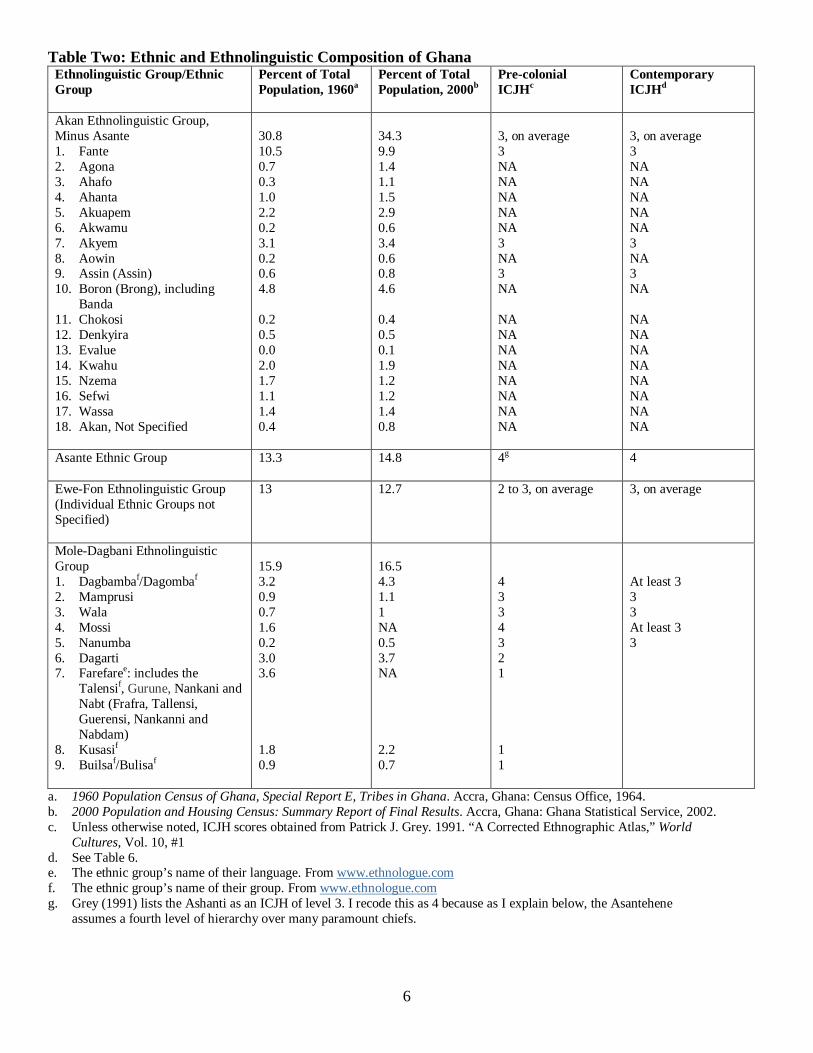
an empire and confederation of chiefdoms. Table 4 presents the ethnic and ethnolinguistic
3 See chapter 2, section 2. The Institutional hierarchy of a traditional institution is measured through ICJH, which measures the number of levels of legal hierarchy beyond the local community (village or sub-clan). It is an ordinal variable ranging from 0 (no political authority) to 3 and 4 (three to four levels of legal hierarchy; for chiefdoms this would correspond to three administrative levels of chieftaincy, with a king or paramount chief at the apex).
5
composition of Ghana, along with pre-colonial and contemporary hierarchy scores. Ethnic and
ethnolinguistic groups with less than ten percent of the total population are not presented.
Subgroups of an ethnolinguistic group are listed only if population data for them are available.
6
Table Two: Ethnic and Ethnolinguistic Composition of Ghana Ethnolinguistic Group/Ethnic Group
Percent of Total Population, 1960a
Percent of Total Population, 2000b
Pre-colonial ICJH c
Contemporary ICJH d
Akan Ethnolinguistic Group, Minus Asante 1. Fante 2. Agona 3. Ahafo 4. Ahanta 5. Akuapem 6. Akwamu 7. Akyem 8. Aowin 9. Assin (Assin) 10. Boron (Brong), including
Banda 11. Chokosi 12. Denkyira 13. Evalue 14. Kwahu 15. Nzema 16. Sefwi 17. Wassa 18. Akan, Not Specified
30.8 10.5 0.7 0.3 1.0 2.2 0.2 3.1 0.2 0.6 4.8 0.2 0.5 0.0 2.0 1.7 1.1 1.4 0.4
34.3 9.9 1.4 1.1 1.5 2.9 0.6 3.4 0.6 0.8 4.6 0.4 0.5 0.1 1.9 1.2 1.2 1.4 0.8
3, on average 3 NA NA NA NA NA 3 NA 3 NA NA NA NA NA NA NA NA NA
3, on average 3 NA NA NA NA NA 3 NA 3 NA NA NA NA NA NA NA NA NA
Asante Ethnic Group
13.3 14.8 4g 4
Ewe-Fon Ethnolinguistic Group (Individual Ethnic Groups not Specified)
13 12.7 2 to 3, on average
3, on average
Mole-Dagbani Ethnolinguistic Group 1. Dagbambaf/Dagombaf 2. Mamprusi 3. Wala 4. Mossi 5. Nanumba 6. Dagarti 7. Farefaree: includes the
Talensif, Gurune, Nankani and Nabt (Frafra, Tallensi, Guerensi, Nankanni and Nabdam)
8. Kusasif 9. Builsaf/Bulisaf
15.9 3.2 0.9 0.7 1.6 0.2 3.0 3.6 1.8 0.9
16.5 4.3 1.1 1 NA 0.5 3.7 NA 2.2 0.7
4 3 3 4 3 2 1 1 1
At least 3 3 3 At least 3 3
a. 1960 Population Census of Ghana, Special Report E, Tribes in Ghana. Accra, Ghana: Census Office, 1964. b. 2000 Population and Housing Census: Summary Report of Final Results. Accra, Ghana: Ghana Statistical Service, 2002. c. Unless otherwise noted, ICJH scores obtained from Patrick J. Grey. 1991. “A Corrected Ethnographic Atlas,” World
Cultures, Vol. 10, #1 d. See Table 6. e. The ethnic group’s name of their language. From www.ethnologue.com f. The ethnic group’s name of their group. From www.ethnologue.com g. Grey (1991) lists the Ashanti as an ICJH of level 3. I recode this as 4 because as I explain below, the Asantehene
assumes a fourth level of hierarchy over many paramount chiefs.

7
II. Macro-Analytic Narrative
In section two, I utilize an analytic narrative to examine the delegation relationships between the
state, traditional leaders/institutions and their local communities from the establishment of colonial rule in
the late 19th century to the present. The analysis asserts that chiefs are agents of two principals, the state and
their community. Furthermore, it asserts that the institutions within a hierarchical chiefdom screen, select,
monitor, and check their agents. These institutional mechanisms generate incentives for traditional leaders to
respond to community preferences. In responding to those preferences, leaders of hierarchical traditional
institutions can leverage a great deal of authority against the state. This section is the most underdeveloped
of the chapter. What I present here should be taken with a grain of salt, because I have not verified all the
statements I make below. The analysis will include a discussion of:
1. Colonial rule. Britain minimized the costs of colonial rule by nesting traditional institutions into the
colonial state. To control chiefs, it asserted the right to dismiss traditional leaders who did not comply
with the colonial state. Monitoring was poor, though, and traditional leaders during this period did
accommodate community preferences: institutions within these chiefdoms, such as Asafo companies,
provided mechanisms to check and remove unpopular traditional leaders, which generates incentives
to comply. When coca prices fell in the late 20s and 30s, for example, chiefs sided with community
preferences and organized mass hold-ups of the crop. When younger, more educated individuals
agitated against various aspects of colonial-chiefly rule, many chiefs, threatened with dismissal
(destoolment or deskinment), accommodated at least some of their demands. Overall, traditional
leaders had substantial authority over their respective areas, rather than Britain.
2. CPP and Nkrumah era (1950’s to 1966). Because socialism heavily influenced Nkrumah and the
CPP, they were hostile to chiefs, labeling them as feudal. CPP support came from “youngmen.” The
term refers to several things. According to modernization scholars, youngmen means younger, more
8
educated, less traditional, more individualistic people. In Ghana, however, the term has special
significance, as it is a rough translation of Akan terms which refer to individuals who are not part of
the royal clan (chiefs are selected from members of the royal clan). During this period, a fundamental
cleavage in Ghanaian politics developed which pitted most chiefs (and traditionalists) against the
CPP. The Asantehene (paramount chief of the Asante confederation of chiefdoms) and others
organized a party, the National Liberation Movement (NLM), to oppose the CPP in elections. They
were especially critical of CPP plans to indirectly tax the export of cocoa. The NLM formed alliances
across other hierarchical traditional leaders in the country, such as other Akan chiefdoms and the
Mole-Dagbani chiefdoms. When the NLM lost the elections, the Asantehene pressed Britain and the
CPP for a federal constitution. Activism in the Ashanti region forced a compromise, in which
Regional Houses of Chiefs were established. Once Ghana became independent, Nkrumah quickly
moved to suppress the NLM and the authority of chiefs. He was, to a large extent, successful. The
bargain established to set up Houses of Chiefs was revoked, and Nkrumah intimidated and dismissed
non-compliant chiefs.
3. (1966 to 1982). My knowledge of chieftaincy during this period is somewhat spotty, but following
the coup which removed Nkrumah, chiefs threw their support behind the National Liberation Council
(NLC), headed by Kofi A. Busia. The Regional Houses of Chiefs were again implemented. The
constitution to return Ghana to democratic rule guaranteed the institutions of chieftaincy.
Government still asserted authority over the recognition of chiefs by requiring official gazetting of
traditional leaders elected by their communities. Busia set up the Progress Party (PP), which was the
successor to the NLM. He won the elections, largely with the support of chiefs - the party carried all
the seats in the Ashanti region.

9
4. The Rawlings regime (1982-1992). Jerry Rawlings was, like Nkrumah, a leftist. He attempted to
generate grassroots participation through the reform of local-level governance. Peoples Defense
Committees (PDCs), Citizens Vetting Committees (DVCs), Regional Defense Committees (RDCs)
and National Defense Committees (NDCs) were established to encourage participation. This
threatened the authority of traditional leaders. Most of these committees were hostile to traditional
leaders and their respective chiefdoms.
5. 1992 to Present. Traditional institutions are still powerful. The 1992 Constitution again guarantees
chieftaincy, has provisions which allow chiefs to mobilize communal labor, continues the Regional
Houses of Chiefs, and grants chiefs sole authority over “customary” issues. This means several
things: government no longer has the right to interfere with the selection and recognition of a chief;
chiefs control property rights to communal land; chiefs are law-makers with respect to customary
law; chiefs can effectively block the actions of District Councils and District Assemblies, which are
the local-level state institutions. The National and Regional Houses of Chiefs are powerful
institutions which the state has little control over. In essence, as other scholars have pointed out,
Ghana has divided sovereignty, and traditional institutions now parallel state institutions up to the
national level (the National House of Chiefs). Table three presents the membership, and territorial
extent of the Regional Houses.

10
Table 3: Regional Houses of Chiefs in Ghana
a. Ghana High Commission in Ottawa, Canada. http://www.ghanahighcommission-canada.com/corp-e-land-people.html b. Another Source lists 20 Traditional Councils and 20 Paramount Chiefs for the Volta Regional House of Chiefs.
Because these claims were made by activists of the Konkomba ethnic group in the north, I am inclined to discount them in favor of http://www.ghanadistricts.com/. Pul, Hippolyt A. S. 2003. “Exclusion, Association and Violence: Trends and Triggers in Northern Ghana's Konkomba-Dagomba Wars,” The African Antrhopologist, Vol. 10, #1, pp. 39-82.
c. http://www.ghanadistricts.com/ d. Ghana News Agency (GNA). 12/20/2003. “Minister Advises Chiefs on Issue of Elevation.”
http://www.ghanaweb.com/GhanaHomePage/regional/artikel.php?ID=48614 e. Another Source lists 30 Paramountcies for the Ashanti Regional house of Chiefs. Because these claims were made by
activists of the Konkomba ethnic group in the north, I am inclined to discount them in favor of http://www.ghanadistricts.com/. Pul, Hippolyt A. S. 2003. “Exclusion, Association and Violence: Trends and Triggers in Northern Ghana's Konkomba-Dagomba Wars,” The African Antrhopologist, Vol. 10, #1, pp. 39-82.
f. Pul, Hippolyt A. S. 2003. “Exclusion, Association and Violence: Trends and Triggers in Northern Ghana's Konkomba-Dagomba Wars,” The African Antrhopologist, Vol. 10, #1, pp. 39-82.
g. As of the 1994-5 Konkomba-Dagomba war, 13 (mainly acephalous) ethnic groups were not given paramount status and were thus excluded from the Northern Region House of Chiefs (Pul 2003). Following this war, the House agreed to expand membership (i.e., give paramount status) to some of these ethnic groups. As of 2004, this reconstitution of membership was still in process. Ghana News Agency (GNA). 8/4/2004. “ Pass LI reconstituting NR House of Chiefs - Yagbon-wura.” http://www.ghanaweb.com/GhanaHomePage/NewsArchive/artikel.php?ID=63261. Ghana News Agency (GNA). 8/12/2003. “GTZ organizes alternative conflict resolution workshop for Northern Chiefs.” http://www.ghanaweb.com/GhanaHomePage/regional/artikel.php?ID=41038&nav=next.
Region Area (km2) Membership Avg. Area Represented by a Member (km2)
Ashanti 24,390 36 traditional councils, each headed by a paramount chief (omanhene)ec
The Asantehene is the permanent president of the House
678 Asantehene: 24,390
Brong-Ahafo 39,557 43 members (not clear if these are Paramountcies)a 920 Central 9,826 32 traditional areas/paramountciesa 307 Eastern 19,223 11 traditional areas (not clear if these are
paramountcies)a 1,748
Greater Accra 3,245 NA Northern 70,384
(34,000 is inundated)
5 paramount chiefsg. Four are the paramounts of the hierarchical chiefdoms: the Nayiri (Mamprusi), the Ya Na (Dagomba), the Bimbilla Na (Nanumba), and the Yagbumwura (Gonja). The Mo ethnic group obtained Paramount status just before the 1992 Constitution went into effectf.
7,277 (non-inundated area)
Upper East 8,842 6 paramount chiefs 1,474 Upper West 18,476 NA Volta 20,334 15 traditional councils, represented by 15
paramount chiefs, with 17 rotating members from 17 rotating groups (a traditional council is composed of several traditional areas)bc 118 traditional areasd
Traditional Councils: 1,356 Traditional Areas: 172
Western 23,921 21 traditional councils, each headed by a paramount chief (omanhene)a
1,139

11
III. Public Goods Provision by Traditional Institutions In Ghana
In section three, I examine the range of local-public goods provided by traditional institutions. Some
of these that I will address are:
1. Local policing. Punishment for minor offenses, especially those violating customary laws, is meted
out, while serious crimes, such as murder, are handed over to the state police.
2. Fire protection. Chiefs organize protection from bush fires and fires within the village.
3. Village infrastructure and upkeep. Chiefs organize communal labor for the cleaning and repairing of
village and town infrastructure. This is especially common before religious festivals, when
purification of the village is called for.
4. Maintenance of local roads, wells and sanitation. Chiefs organize the maintenance of non-paved
roads and footpaths, local wells and watering holes, and pit latrines. The Asantehene negotiated with
the World Bank for a grant of 20 million dollars, and technical assistance, for water and sanitation
under the Bank’s traditional authorities program.
5. Education infrastructure. A large number of schools in Ghana are built using communal labor
mobilized by the chief. Traditional councils collect contributions to provide scholarships for gifted
individuals. For example, the Asantehene negotiated with the World Bank for a donation of five
million dollars (30 billion cedis) to the Otumfuo Education Fund. Founded in 1999 by the
Asantehene (Otumfuo Osei Tutu II), it has since 2001 spent about 184 million cedis ($62,372)4 on
scholarships for over 300 basic school pupils from the Ashanti region. The fund has also spent over
591 million cedis ($200,339) on scholarships for approximately 900 senior secondary school students
and about 100 students in tertiary institutions. The Fund also provides money for school construction
and supplies like desks: 2000 have been provided since 2001. All of this money is distributed only in
the Ashanti region.
6. De facto but not de jure judicial adjudication. While chiefs are not formally part of Ghana’s judicial
system, a very large number of cases (probably the plurality, if not the majority) are adjudicated by
chiefs. Traditional adjudication can competes with the state courts primarily due to cost, but also due
to the legitimacy of traditional leaders and customary law. Most individuals cannot afford the fees,
4 The US Dollar – Ghanaian Cedi exchange rate was 2,360 on January 1, 1999 and 3,540 on December 31, 1999. I average these two figures, reaching a rate of 2,950 Cedis to the Dollar. All subsequent conversions are based on this rate. However, the Cedi has depreciated considerably from 1999 to the present – using an average of exchange rates for 2006, this sum is only $20,000. http://www.oanda.com/convert/fxhistory

12
fines and lawyers associated with state courts. Chiefs are also law-makes with respect to customary
law.
7. Property rights in land. While the ownership and sale of land is increasingly commercialized, chiefs
still own and allocate property rights in land. Land sales are typically approved by the traditional
leader of the region, and a small fee is paid to him. For the Asantehene, as Berry notes (2001), this
includes the town of Kumasi, the capital of the Ashanti region and the capital of the Asante
confederation. Kumasi is an urban city with a population of roughly 2.5 million.
8. Traditional religious functions, including annual religious and harvest festivals, witchcraft
adjudication, and rituals associated with ancestral rites. This is the core basis for the legitimacy of
traditional institutions, and it is a sector that the state cannot compete with.
9. Activism against foreign mining. Many chiefs in the Akan regions mobilize community activism
against mining operations because of the environmental damage, state appropriation of communal
land, and potentially adverse health effects. I’m slowly going through the data on this, but it seems
that many chiefs are successful. One report I read indicated that the chiefs and the community
successfully prevented a company from occupying its concession several years ago, with no
resolution at present.
In addition to these public goods and services, traditional institutions also perform other tasks that are
associated with governance:
1. Taxation. Data on this is spotty, but chiefs obtain revenue through the collection of fees and fines for
the services provided above, as well as voluntary contributions (Englebert 2002, Trager 2001). They
also assess tribute, most often in the form of a share of a farmer’s crop. According to Ray (2001), a
region of the Gonja Chiefdom (not part of the 4 ethnic/ethnolinguistic groups I analyze in the
chapter) in the 1980’s collected from one twelfth to one sixteenth (8.3% to 6.25%) of farmer’s crops.
By contrast, the state’s collection of direct taxes (income, profits, and capital gains) was an average
of 2.03% of GDP from 1972 to 1993.
2. Coercion. While my theory emphasizes the benefits chiefs provide their members in exchange for
authority, coercion is also levied. Villages in Gonja that did not comply with demands for tribute
were razed to the ground by traditional leaders. While traditional leaders cannot threaten the coercive
capacity of the state, they do threaten the state’s monopoly over coercion in their respective areas.

13
IV. Micro-Evidence of Preferences for Governance by Traditional Institutions
In this section, I examine the third aspect of my hypothesis by examining individual preferences for
governance by chiefs, and by examining preference divergence across Ghana’s ethnic and ethnolinguistic
groups. According to the logic of my hypothesis, individuals living under hierarchical traditional institutions
should prefer governance by chiefs, and they should do so more than individuals living under non-
hierarchical traditional institutions. Additionally, where traditional leaders are particularly vigorous in
providing services to their communities, such as the subsistence farming sector, we should observe greater
preferences for governance by chiefs. Finally, we should observe preference divergence across Ghana’s
ethnic and ethnolinguistic groups for specific public goods, after controlling for other socio-economic factors
such as age, gender, education, etc., thereby indicating the difficulty a state has with respect to competing
with an ethnic or ethnolinguistic group’s provision of that specific good. I examine preferences for
governance by chiefs using the survey results of Abotchie (1997), and by using the 1999 Ghana
Afrobarometer Survey data. I examine preference divergence of a specific public service – administration of
property rights in land – across ethnic and ethnolinguistic groups in Ghana, again using the 1999 Ghana
Afrobarometer Survey data.
Abotchie (1997) surveyed 335 southern Ewe to examine individual assessment of the efficacy of
traditional versus modern methods of crime control. Southern Ewe’s are largely represented by the Anlo
chiefdom (ICJH =3), as I explained in section one of this chapter. His results are presented below in Table
four.
Based on the results of this survey, we can conclude that southern Ewe prefer traditional methods of
crime control versus modern, state methods. Eighty-six percent of male adults aged 35 to 55 years and 88
percent of females aged 35 to 55 years favor traditional methods over modern methods. Among individuals
aged 18 to 30, 65 percent of males and 73 percent of females favor traditional methods over modern
methods. Age plays a role in favoring traditional over modern methods: while only six percent of individuals
(males and females) aged 35 to 55 prefer modern methods, 19 percent of individuals aged 18 to 30 prefer
modern methods. It is important to note that the entire sample is Christian, given the fact that traditional
methods of crime control rest largely on traditional Ewe religious precepts. While this evidence does not
directly test my theory, it does indicate that many individuals prefer traditional governance over state
governance, at least with respect to crime control among the southern Ewe. In other words, Abotchie’s
survey indicates that the state faces difficulties in competing with traditional institutions for preferred

14
provision of public goods and services. To more directly test these indications, I now to turn to an analysis of
Afrobarometer survey data.
Table 4: The Distribution of Respondents in their Comparative Assessment of the Efficacy of the Traditional and Modern Methods of Crime Control
Age Group of Respondents Adult 35 to 55 Youth 18 to 30
Attributes
Male Female Male Female
Total
Percentage
In Favor of Traditional Methods
88 (86%)
73 (88%)
57 (65%)
45 (73%)
263 80
In Favor of the Modern Methods
8 (8%)
4 (5%)
19 (22%)
10 (16%)
41 11.5
Traditional and Modern
6 (6%)
6 (7%)
12 (14%)
7 (11%)
31 9.5
Total 102 83 88 62 335 100 Note: All respondents are Christian (Catholic and Protestant) Due to rounding, percentages may not total to 100% Source: Table Reprinted from Chris Abotchie, Social Control in Traditional Southern Eweland of Ghana. 1997. Accra: Ghana
Universities Press. P. 122.
The 1999 Ghana Afrobarometer survey includes a question concerning individual’s preferences for
governance by chiefs, with responses ranging from zero (worst kind of government) to ten (best kind of
government)5. Table 5 presents descriptive statistics for this question. I utilize this question as my dependent
variable (LikeGovtByChiefs). It is an excellent proxy for my theory, yet it is only a proxy, for two important
reasons. First, the survey question does not ask individuals their preference for governance by chiefs rather
than by the state. The survey, however, does include a question asking individuals if chiefs and the
government are the same or different. A large majority of the sample (76%) responded that chiefs are
different from the government.6 I include this dichotomous variable, ChiefsDifferent (0 = same, 1 = different)
as a control.
5 Question 27D of the survey asks: “We are now going to discuss how much you like different kinds of government. I would like you to give marks out of ten. Let us say that the best government gets 10 out of 10 and the worst kind of government gets a mark of only one. What grade would you give to: the traditional system of government by chiefs?” For the codebook to the 1999 Ghana Survey, see Butler and Nadeau, 1999. 6 Question 18a of the survey specifically asks: “In Ghana, is there a difference between the following organizations or are they the same thing? The chiefs and the government.”

15
Table 5: “What grade would you give to: the traditional system of government by chiefs?” LikeGovtByChiefs Frequency Percent Cumulative Percent 1 (worst kind of
government) 322 16.23 16.23
2 185 9.32 25.55 3 156 7.86 33.42 4 238 12.00 45.41 5 385 19.41 64.82 6 201 10.13 74.95 7 114 5.75 80.70 8 126 6.35 87.05 9 60 3.02 90.07 10 (best kind of
government)
197 9.93 100.00
Total 1,984 100.00 100.00
Second, the construct of the survey question does not distinguish between paramount chiefs
(ICJH=3), divisional chiefs (ICJH=2) or village chiefs (ICJH=1). Non-hierarchical (stateless) traditional
institutions do have chiefs at the village level (ICJH=1), and members of these traditional institutions may
prefer governance by tem. To test my theory, we need to compare the magnitudes of the regression
coefficients to assess if hierarchical ethnic and ethnolinguistic groups prefer governance by chiefs more than
non-hierarchical groups.
I proxy the hierarchy of traditional institutions by using a combination of regional dummies and the
language respondents use most often7. My reasons for doing so are based on an attempt to minimize, as
much as possible, the ecological inference problem. While Ghana’s ethnic and ethnolinguistic groups are
highly concentrated in many of the country’s ten regions8, no ethnic or ethnolinguistic group forms the entire
population of a region. Responses of individuals from a different ethnic or ethnolinguistic group sampled
from the region may bias the aggregate effects of a regional dummy that proxies the hierarchy of the
dominant ethnic or ethnolinguistic group’s traditional institutions. Additionally, the hierarchical Mole-
7 Question 1 of the survey asks: “Which Ghanaian language do you speak most often?” The variable Region is coded by the interviewer. 8 According to the 2000 census, 71% of the Western region’s population is non-Asante Akan (7.3% of the region is Asante); 79.5 percent of the Central region is non-Asante Akan (2.5% is Asante); 61.5% of the Ashanti region is Asante (16.4% of the region is non-Asante Akan); and 68.5% of the Volta region is Ewe. See Ghana, 2002.

16
Dagbani and the stateless ethnic and ethnolinguistic groups of Ghana cannot be proxied by regional
dummies, as they do not form large majorities of a specific region9.
On the other hand, using the respondent’s language is also problematic because the language spoken
most often may not accurately identify the ethnic or ethnolinguistic group the respondent is a member of.
Language is especially suspect with the government-sponsored10, hegemonic, trade language of Akan, which
constitutes 60% of the survey’s sample. Many non-Akan, living in regions where the Akan language is
predominant, may speak Akan most often. This is especially problematic considering the fact that Ghana’s
most important export crop, cocoa, is produced in regions where the Akan language often predominates.
Cocoa draws a large amount of migrant and settlement labor from non-Akan areas, especially from the north.
Thus respondents who indicate Akan as their language spoken most often may not actually be members of
the Akan ethnolinguistic group. Additionally, we cannot separate the Ashanti ethnic group from other Akan
ethnic groups based on language. Finally, a respondent’s language does not guarantee that (s)he is living
under the ethnic or ethnolinguistic group’s traditional institutions: (s)he may be living outside the area of the
traditional institution, such as the capital (Accra), or another region.
I have thus chosen to proxy the hierarchy of ethnic and ethnolinguistic groups utilizing a combination
of regional and language data. First, I assume that speaking a language that is not of an individual’s
respective ethnic or ethnolinguistic group is most likely for the hegemonic language of Akan. In other words,
the bias introduced from language identification is most likely one-way: an individual listing a language
other than Akan is more likely to be a member of the language’s ethnic and ethnolinguistic group. This is
especially true with respect to respondents whose reported language constitutes a small percentage of the
overall language population. It is unlikely that respondents whose ethnic or ethnolinguistic group differs
from these languages would primarily speak them.
Second, to identify individuals who live under their respective traditional institutions, rather than
other regions of Ghana, I create dummy variables for individuals who speak an ethnic or ethnolinguistic
group’s language and who were sampled in the region where that ethnic or ethnolinguistic group’s traditional
institutions are concentrated. For example, the dummy variable EweVolta (0 = no, 1 = yes) indicates Ewe
speakers who were sampled from the Volta region, where the Ewe chiefdoms are located. For the 9 Only 46% of the Northern region is hierarchical Mole-Dagbani (34.2% Dagomba, 7.6% Mamprusi, 2.6% Nanumba and 0.4% Wala). Likewise, only 17.8% of the Upper West region is non-hierarchical Stateless (57.5% Dagarti Semi-Hierarchical): (16% Sisala, 0.5% Kasena, 0.5% Nabdom, 0.3% Vagala, 0.2% Builsa, 0.2% Kusasi, and 0.1% Nankansi). 57.5% Dagarti and thus semi-hierarchical (ICJH =2). 78.6% of the Upper East is inhabited by non-hierarchical ethnic groups (30.5% Nabdom, 22.6% Kusasi, 9.2% Nankansi and Gurensi, 7.6% Builsa, 6.5% Kasena, 1.1% Vagala, 0.9% Dagarti, and 0.2% Sisala). See Ghana, 2002. 10 Ghana has nine national, “government-sponsored,” African languages: Akan, Daagare/Waale, Dangbe, Dagbane, Ewe, Ga, Gonja, Kasem and Nzema. See languages at www.Ghanaweb.com.

17
hierarchical Mole-Dagbani, the dummy variable HierarchicalMole (0 = no, 1 = yes) indicates Dagbane11,
Mampruli12, and Wali13 speakers who were sampled in the Brong-Ahafo, Northern, Upper East and Upper
West regions, where the Dagomba, Mamprusi, Nanumba and Wala chiefdoms are located14. For the non-
hierarchical Kusasi (ICJH = 1), the dummy variable KusasiUEUW (0 = no, 1 = yes) indicates Kusasi
speakers who were sampled in the Upper East and Upper West regions, where the ethnic group resides15. For
the non-hierarchical Frafra (ICJH =1), the dummy variable FrafraUE (0 = no, 1 = yes) indicates Frafra16
speakers who were sampled in the Upper East regions, where the ethnic group resides17. For the
nonhierarchical Konkomba (ICJH = 1), the dummy variable KonkombaNBA (0 = no, 1 = yes) indicates
Konkomba speakers who were sampled in the Northern and Brong-Ahafo regions, where the ethnic group
resides18.
To separate the Akan chiefdoms from the Asante confederation, the dummy variable AkanCentral (0
= no, 1 = yes) indicates Akan speakers who were sampled in the Central region. I have chosen this region to
represent the Akan chiefdoms, as opposed to the Western region, because it has the largest concentration of
non-Asante Akan residing in it. The Central region is 79.5% non-Asante Akan and 2.5% Asante, while 71%
of the Western region is non-Asante Akan and 7.3% Asante (Ghana, 2002). By coding for Akan-speaking
respondents from the Central region, the likelihood of sampling Asante Akan is minimized as much as
11 The codebook for the Ghana 1999 Afrobarometer lists the language of the Dagomba and Nanumba ethnic groups as Dangbane. According to Ethnologue, and the list of languages posted on Ghanaweb, this language is more appropriately spelled Dagbane/Dagbani. www.ethnologue.com and www.ghanaweb.com. 12 The codebook for the Ghana 1999 Afrobarometer lists the language of the Mamprusi ethnic group as Mamprulni. According to Ethnologue, and the list of languages posted on Ghanaweb, this language is more appropriately spelled Mampruli. www.ethnologue.com and www.ghanaweb.com. 13 The codebook for the Ghana 1999 Afrobarometer lists the language of the Wala ethnic group as Waale. According to Ethnologue, and the list of languages posted on Ghanaweb, this language is more appropriately spelled Wali. www.ethnologue.com and www.ghanaweb.com. 14 For the Dagomba, 79.6% reside in the Northern region, 3.7% in Brong-Ahafo, 0.9% in Upper East and 0.4% in Upper West. For the Mamprusi, 66.1% reside in the Northern Region, 7.7% in Brong-Ahafo, 7.5% in Upper East and 0.3% in Upper West. For the Nanumba, who also speak the Dagbane language, 57.6% reside in the Northern region, 7.4% in Upper East, 2.4% in Brong-Ahafo, and 1.8% in Upper West. For the Wala, 51.6% reside in the Upper West region, 17.2% in Brong-Ahafo, 4.5% in Northern, and 1.1% in Upper East. See Ghana, 2002. 15 50.8% of the Kusasi reside in the Upper East region and 22.6% in Upper West. See Ghana, 2002. 16 Farefare 17 The Frafra (Farefare) language is spoken by a number of ethnic groups (Talensi/Tallensi, Gurune/Guerensi, Nankani/Nankanni, and Nabt/Nabdom/Namnam). While the 1960 census lists the Frafra as a tribe, with 77.7% residing in the Northern region, the 2000 census breaks this category down into separate groups, yet only lists the Nabdom, and the Nankani and Gurense. Furthermore, the Northern region from the 1960 census now corresponds with the Northern, Upper West and Upper East regions. For the Nabdom (Namnam), 60.9% reside in the Upper East region, 4.9% in the Northern, and 0.6% in Upper West. For the Nankani and Gurense, 84% reside in the Upper East region, 1.9% in the Northern, and 0.6% in Upper West. I have thus decided to code this variable only for Frafra speakers in the Upper East region. Of 45 Frafra speakers sampled in the 1999 Ghana Afrobarometer survey, 34 were sampled from the Upper East, 0 from the Upper West and 1 from the Northern region. See Ghana, 1964 and 2002. 18 64.4% of the Konkomba ethnic group resides in the Northern region, and 11% in Brong-Ahafo. See Ghana, 2002.
18
possible. For the Asante ethnic group, the dummy variable AsanteAkan (0 = no, 1 = yes) indicates Akan
speakers who were sampled in the Ashanti region, where the Asante confederation of chiefdoms is located.
This variable potentially introduces the most bias with respect to ecological inference, as the survey provides
no way to separate the Asante ethnic group from Akan speakers. While 61.5% of the Ashanti region is
inhabited by the Asante ethnic group, an additional 16.4% of the region is inhabited by non-Asante Akan
(Ghana, 2002). The Asante confederation of chiefdoms, though, does encompass the entire region, with the
Asantehene as the permanent president of the Ashanti Regional House of Chiefs (see Table 6).
As I explain in sections two and three of this chapter, traditional institutions provide a large range of
goods and services to predominantly poor, rural individuals, especially farmers. They are also active in the
mining sector because foreign mining raises community concerns surrounding land ownership,
environmental degradation, and health. We therefore should observe greater preferences for governance by
chiefs amongst farmers and miners. I utilize six variables to measure these two sectors: urbanrural is a
dummy variable (0 = urban, 1 = rural), completed by the survey supervisor19, indicating whether the
respondent is from an urban or rural locale; farmer (0 = no, 1 = yes) indicates whether the respondent is a
farmer; and miner (0 = no, 1 = yes) indicates whether the respondent is a miner20. To target poor farmers, I
coded21 three dummy variables: farmer0 (0 = no, 1=yes) indicates farmers (and their spouses) whose
monthly earnings are reported as none22; farmer1 (0 = no, 1 = yes) indicates farmers (and their spouses)
whose monthly earnings are reported as less than 50,000 cedis ($17)23; farmer2 (0 = no, 1 = yes) indicates
farmers (and their spouses) whose monthly earnings are from 51,000-100,000 cedis ($17 - $34)24.
Additional variables are utilized to control for socioeconomic factors: gender is a dummy variable (0
= male, 1 = female), indicating the respondent’s sex; age is a continuous variable, ranging from 18 to 98;
yearseducation25 is a continuous variable, ranging from zero to 28; and EarningsPerMonth26 is an ordinal
variable, indicating the earnings of the respondent and his/her spouse: 0 = none; 1 = less than 50,000 cedis
19 The urbanrural corresponds with the variable urbrur2 in the dataset. I have chosen this variable over the variable urbrur1, which codes for urban/rural locales based on GSS data. See Butler and Nadeau, 1999. 20 Both variables were coded from Question 70 in the dataset, which asks respondents their occupation. Only three Miners are in the sample, one from the Brong-Ahafo region, one from the Ashanti region, and one from the Eastern region. All three are Akan-speakers. 1 Miner makes 51,000-100,000 cedis per month; 1 makes 101,000-300,000 cedis per month; and 1 earns nothing per month. 656 respondents list farming as their occupation. See Butler and Nadeau, 1999. 21 Codings based on Question Number 70 and 89 of the dataset. 22 83 out of 654 farmers (13%) reported their monthly earnings as none. 2 farmers did not report their monthly earnings. 23 260 out of 654 farmers (40%) reported their monthly earnings as less than $17. The US Dollar – Ghanaian Cedi exchange rate was 2,360 on January 1, 1999 and 3,540 on December 31, 1999. I average these two figures, reaching a rate of 2,950 Cedis to the Dollar. All subsequent conversions are based on this rate. http://www.oanda.com/convert/fxhistory 24 168 out of 654 (26%) farmers reported their monthly earnings as between $17 and $34. 25 Question Number 3 of the dataset. See Butler and Nadeau, 1999 26 Question Number 89 of the dataset. See Butler and Nadeau, 1999.

19
(<$17); 2 = 51,000-100,000 cedis ($17-$34); 3 = 101,000-300,000 cedis ($34 - $102); 4 = 301,000-500,000
cedis ($102 - $170); 5 = 501,000-700,000 cedis ($170 - $237); 6 = 701,000-1,000,000 cedis ($237-$339);
and 7 = 1-5 million cedis ($339 - $1,695)27. I recode this variable into a series of dummy variables, using 2
(51,000-100,000 cedis) as the reference category in my model (EarningsPerMonth2).
Table 6 presents the regression results of three models, using robust standard errors and a pweight for
gender. Across all three models, the constant is significant (p < .001), and is located approximately at the
median of the dependent variable. The coefficients for AkanCentral are slightly positive yet insignificant
across all three models. The coefficients for EweVolta are positive and significant (p < .05). On average,
members of the hierarchical Ewe chiefdoms prefer governance by chiefs by an additional .5, or an additional
5% of the dependent variable’s range. Coefficients for AsanteAkan are also positive across all three models,
yet only marginally significant at the 95% level (p = .055) in the third model. On average, members of the
Asante confederation appear to prefer chiefly governance by an additional third of a point, or 3%.
Coefficients for HierarchicalMole are positive and significant (p < .001) across all three models. On average,
members of the Mole-Dagbani chiefdoms prefer chiefly governance by an additional point, or 10%.
For the non-hierarchical proxies – KonkombaBAN, KusasiUEUW, and FraFraUE – all coefficients
are positive, yet significant only for KusasiUEUW (p < .05). The magnitude for KusasiUEUW is
approximately 1.5 points, or 15% of the dependent variable’s range. These results, however, are suspect due
to the fact that that only two Kusasi from the Upper East and Upper West regions were sampled. These two
observations exhibit high leverage and high influence.
Overall, my theory’s predictions with respect to the effect of hierarchy on preferences for chiefly
governance are confirmed, yet not strongly. Two of the four hierarchical ethnic and ethnolinguistic groups –
the Ewe and Mole-Dagbani – significantly prefer governance by chiefs greater than the average. Members of
the third hierarchical ethnic group, Asante, prefer governance by chiefs greater than the average, yet with
marginal significance. The third hierarchical group, the Akan, do not.
In sectors where traditional institutions are most active in the provision of public goods and services,
the evidence suggests that individuals in those sectors significantly prefer governance by chiefs. Once we
control for other socioeconomic factors, poor farmers significantly prefer governance by chiefs, while
overall, farmers do not. In the third model, farmers who reported earning nothing a month significantly (p <
.05) prefer chiefly governance by an additional .5 (1.075 for Farmer0 - .501 for Farmer), or an additional
27 The question has an eighth category (over 5 million cedis), but it is not present in the dataset. I Assume that no respondent in the survey listed earnings over 5 million cedis.

20
5% of the dependent variable’s range. These results seem especially strong given that non-farmers who
reported earning of nothing per month significantly (p < .05) dislike governance by chiefs by approximately
.6 of a point, or 6% of the dependant variable’s range. Farmers earning less than 50,000 cedis ($17) a month
significantly (p < .05) prefer chiefly governance by approximately an additional 2%. Farmers earning from
51,000-100,000 cedis ($17 - $34) a month prefer chiefly governance by approximately an additional an
additional 1.5%, and this result is significant at the 90% confidence level.
Likewise, miners significantly (p < .05 in model 3) prefer governance by chiefs, with a magnitude of
approximately 3.6 points, or 36% of the range of the dependent variable. The results, however, are suspect,
as only three miners were sampled in the survey. These observations have high leverage and high influence.
Overall, my theory’s predictions with respect to the effect of public goods and services provision on
preferences for chiefly governance are confirmed. While the Miner variable is highly suspect, the variables
for poor farmers are not. In areas where chiefs are most involved in providing public goods and services,
namely the subsistence agricultural sector, individuals prefer governance by chiefs.

21
Table 6: Preferences for Governance by Chiefs in Ghana Dependent Variable: LikeGovtByChiefs (0 = “Worst Kind of
Government, 10 = “Best Kind” Model 1 Model 2 Model 3 LikeGovtByChiefs LikeGovtByChiefs LikeGovtByChiefs ChiefsDifferent -0.544 -0.508 -0.446 (0.000)*** (0.001)*** (0.004)*** AkanCentral 0.099 0.060 0.058 (0.610) (0.759) (0.768) EweVolta 0.512 0.515 0.521 (0.040)** (0.041)** (0.041)** AsanteAkan 0.343 0.344 0.381 (0.082)* (0.085)* (0.055)* HierarchicalMole 1.027 1.026 1.017 (0.006)*** (0.006)*** (0.007)*** KonkombaBAN 0.386 0.248 0.283 (0.445) (0.637) (0.589) KusasiUEUW 1.479 1.594 1.523 (0.038)** (0.027)** (0.028)** FraFraUE 0.792 0.721 0.698 (0.082)* (0.120) (0.133) urbanrural 0.049 0.040 (0.730) (0.782) Farmer0 0.415 1.075 (0.305) (0.020)** Farmer1 0.682 0.730 (0.019)** (0.042)** Farmer2 0.563 0.653 (0.073)* (0.080)* Farmer -0.173 -0.501 (0.491) (0.066)* Miner 3.627 3.647 (0.009)*** (0.017)** gender -0.134 (0.311) age 0.011 (0.025)** yearseducation -0.021 (0.102) EarningsPerMonth0 -0.627 (0.013)** EarningsPerMonth1 0.016 (0.945) EarningsPerMonth3 0.131 (0.540) EarningsPerMonth4 0.003 (0.991) EarningsPerMonth5 -0.052 (0.927) EarningsPerMonth6 -1.037 (0.194) EarningsPerMonth7 -0.765 (0.078)* Constant 5.065 4.914 4.853 (0.000)*** (0.000)*** (0.000)*** Observations 1935 1935 1935 R-squared 0.016 0.024 0.036
Notes: * significant at 10%; ** significant at 5%; *** significant at 1% Robust p values in parentheses Model includes pweight for gender

22
Note: I have not been able to complete the final stats for this section. The survey asks individuals if land should be owned by the community and allocated by chiefs28. This ordinal variable (1 = strongly agree, 2 = somewhat agree, 3 = somewhat disagree, 4 = strongly disagree) will be used to test for preference divergence across Ghana’s 4 hierarchical ethnic and ethnolinguistic groups, and across the non-hierarchical Komkomba and Frafra. I tested whether the proportional odds assumption of ordinal logistic regression is met, and it is not. I’m currently learning how to compute and interpret a generalized ordinal logistic regression model (gologit2). The descriptive stats for the question are: Table Seven: Should Chief’s Own Land? Frequency Percent Cumulative Percent Strongly Agree 919 45.88 45.88 Somewhat Agree 297 14.83 60.71 Somewhat Disagree 235 11.73 72.44 Strongly Disagree 552 27.56 100.00 Total 2,003 100.00 100.00 Potential Questions for Discussion
1. The dependent variable of this case study is not precisely defined. While the large-n chapter of the dissertation will define state weakness as being an inability to directly tax, the case study implicitly has a broader definition of state weakness. As far as I know, I cannot obtain regional information on taxes in Ghana. I'd like input on whether or not you think this is a problem.
2. I’ve been trying to revise the theory into a parsimonious, coherent whole that can be summarized in a few sentences. The problem is that the theory relies on three different things: a principal-agent argument (hierarchies have incentives to respond to community preferences); a capacity argument (hierarchies can respond to community preferences, which gives them greater authority); and a preference-divergence argument (when preferences diverge across groups, the state has trouble providing preferred public goods/services). The intro to this chapter represents the latest revision to the theory. I have merged the first 2 arguments, and revised the theory into a two-way-table. Yet the chapter is organized according to the three-fold logic. I’d like some comments about any/all problems you see with this.
3. The stats I present assume that the dependent variable (LikeGovtByChiefs) is continuous, and it is not. I tested whether the proportional odds assumption of ordinal logistic regression is met, and it is not. I’m currently learning how to compute and interpret a generalized ordinal logistic regression model (gologit2). I know that the best model is generalized ordinal logistic regression, yet the interpretation of the results is less intuitive for the reader. In your opinion, can I present these stats as they are, or should I rerun the model using gologit2?
28 Question 43A of the survey asks: “I am now going to give you several pairs of statements. Please tell me which one you agree with most. Choose Statement A or Statement B. A. In rural areas, land should be owned by the community and allocated by the chiefs. B. People should be able to own their own land, including buying and selling it, even in rural areas.” Then, the enumerator probed, “Do you agree strongly or just somewhat?”