chapter seven practical investment management robert a. strong a 1 3 fundamental stock analysis
Post on 20-Dec-2015
213 views
TRANSCRIPT
CHAPTER SEVEN
Practical Investment Management
Robert A. Strong
A1 3
FUNDAMENTAL STOCK ANALYSIS
South-Western / Thomson Learning © 2004 7 - 2
Outline Valuation Philosophies
Investors’ Understanding of Risk Premiums The Time Value of Money The Importance of Cash Flows The Tax Factor EIC Analysis
Value vs. Growth Investing The Value Approach to Investing The Growth Approach to Investing How Price Relates to Value Value Stocks and Growth Stocks:
How to Tell by Looking
South-Western / Thomson Learning © 2004 7 - 3
The Price-to-Book Ratio The Price-Earnings Ratio Differences between Industries
Outline
South-Western / Thomson Learning © 2004 7 - 4
Outline
Some Analytical Factors Growth Rates The Dividend Discount Model The Importance of Hitting the Earnings Estimate The Multistage DDM Caveats about the DDM False Growth A Firm’s Cash Flows Small-Cap, Mid-Cap, and Large-Cap Stocks Ratio Analysis Cooking the Books
South-Western / Thomson Learning © 2004 7 - 5
Valuation Philosophies
Fundamental analysts believesecurities are priced according to fundamental economic data.
Technical analysts think investor behaviorand supply and demand factors play the most important role.
South-Western / Thomson Learning © 2004 7 - 6
Valuation Philosophies
Investors’ understanding of risk premiums:Investors are almost always risk-averse.
The time value of money: Everyone agrees on this basic principle.
The importance of cash flows:Most investment research deals with predicting future corporate earnings.
The tax factor:The tax code is complicated and not all investments are taxed equally.
South-Western / Thomson Learning © 2004 7 - 7
Valuation Philosophies
Economy, Industry and Company (EIC)analysis:
The analyst first considers conditions inthe overall economy (market risk),
then determines which industries are themost attractive in light of the economic conditions (using Porter’s competitive strategy analysis framework, for example),
and finally identifies the most attractivecompanies within the attractive industries.
South-Western / Thomson Learning © 2004 7 - 8
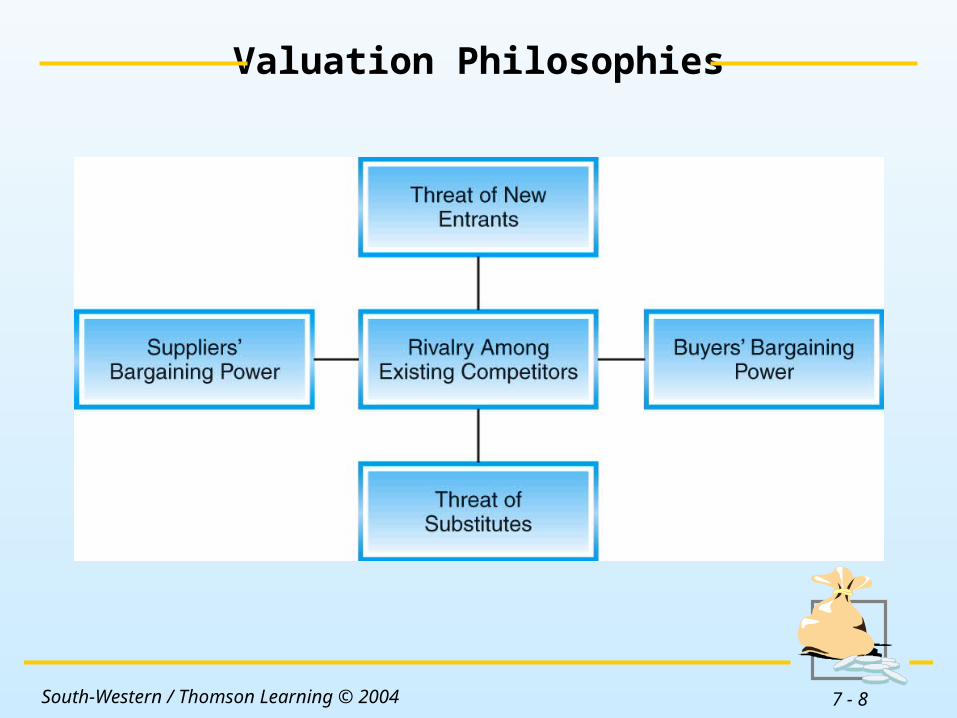
Valuation Philosophies
Insert Figure 7-1 here.
South-Western / Thomson Learning © 2004 7 - 9
Value vs. Growth Investing
A value investor believes that securities should be purchased only when the underlying fundamentals (macroeconomic information, industry news, and a firm’s financial statements) justify the purchase.
Value investors believe in a regression to the mean.
The Value Approach to Investing

South-Western / Thomson Learning © 2004 7 - 10
Regression to the Mean
Most of the time a security’s long-term return is consistent with its risk.
Over the long run, a security cannot survive with a cumulative return that is negative.
Cu
mu
lati
ve R
etu
rn
Time in the Long Term
0
+
-
xxx
x
x
x
xxx
xx
x
xx
xUndervalued stock: Buy
Overvalued stock: Sell

South-Western / Thomson Learning © 2004 7 - 11
Value vs. Growth Investing
Growth investors seek steadily growing companies. There are two factions:
Information traders are in a hurry; they believe information differentials in the marketplace can be profitably exploited.
True growth investors are more willing to wait, but they share the belief that good investment managers can earn above-average returns for their clients.
The Growth Approach to Investing
South-Western / Thomson Learning © 2004 7 - 12
Value vs. Growth Investing
In the early days of the market, before the Great Crash of 1929, price played a minor role: “A stock with good long-term prospects is always a good investment.”
How Price Relates to Value
The modern perspective is thatvalue is inextricably intertwined with price.
$ 8

South-Western / Thomson Learning © 2004 7 - 13
Value vs. Growth Investing
No precise definition exists.
Classification by Morningstar Mutual Funds:
Value Stocks and Growth Stocks: How to Tell by Looking
blend - otherwise growth - 2.25 value - 1.75 relative
price-to-bookratio
relativeprice-earnings
ratio+
South-Western / Thomson Learning © 2004 7 - 14
The Price-to-Book Ratio
Book value per share is an accounting concept synonymous with equity per share or net asset value.
Share price is not normally equal to book value because of
depreciation, uncollectible debts, goodwill, etc. economic obsolescence intangible assets
South-Western / Thomson Learning © 2004 7 - 15
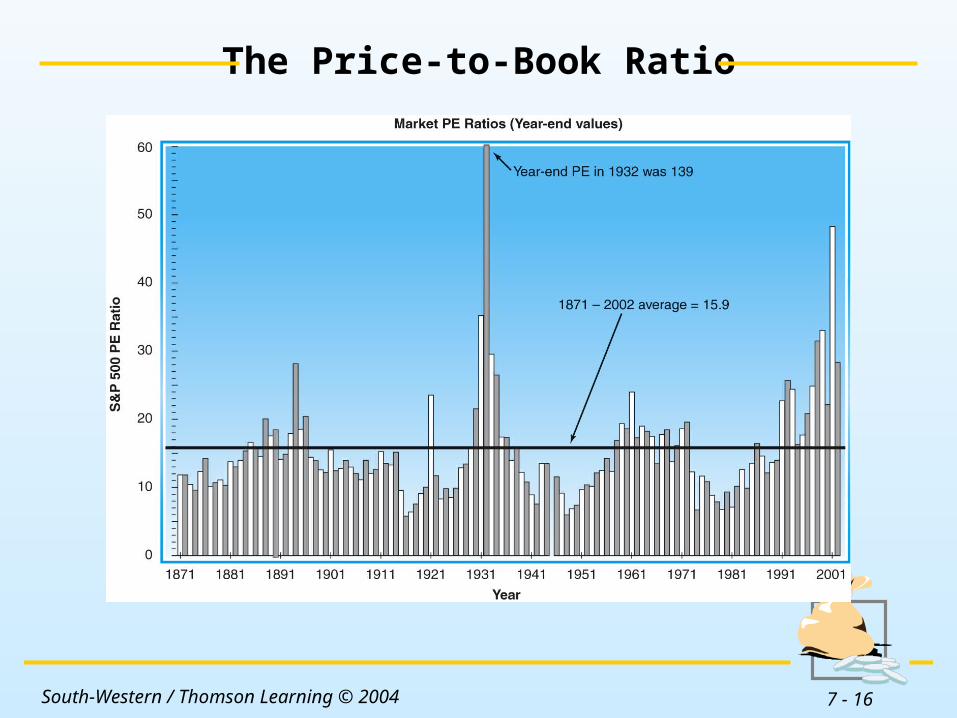
The Price-to-Book Ratio
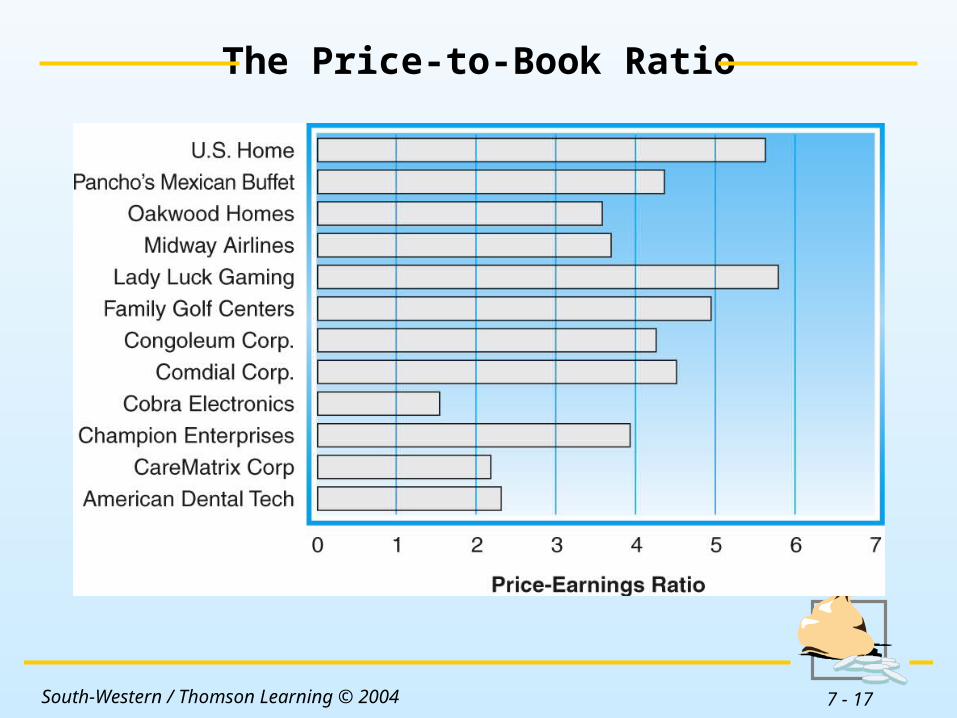
The price-earnings ratio (PE) is computedby dividing the current stock price by the firm’s earnings per share.
Because of differences among industries, relative ratios are commonly computed.
South-Western / Thomson Learning © 2004 7 - 16
The Price-to-Book Ratio
Insert Figure 7-3 here.
South-Western / Thomson Learning © 2004 7 - 17
The Price-to-Book Ratio
Insert Figure 7-4 here.
South-Western / Thomson Learning © 2004 7 - 18
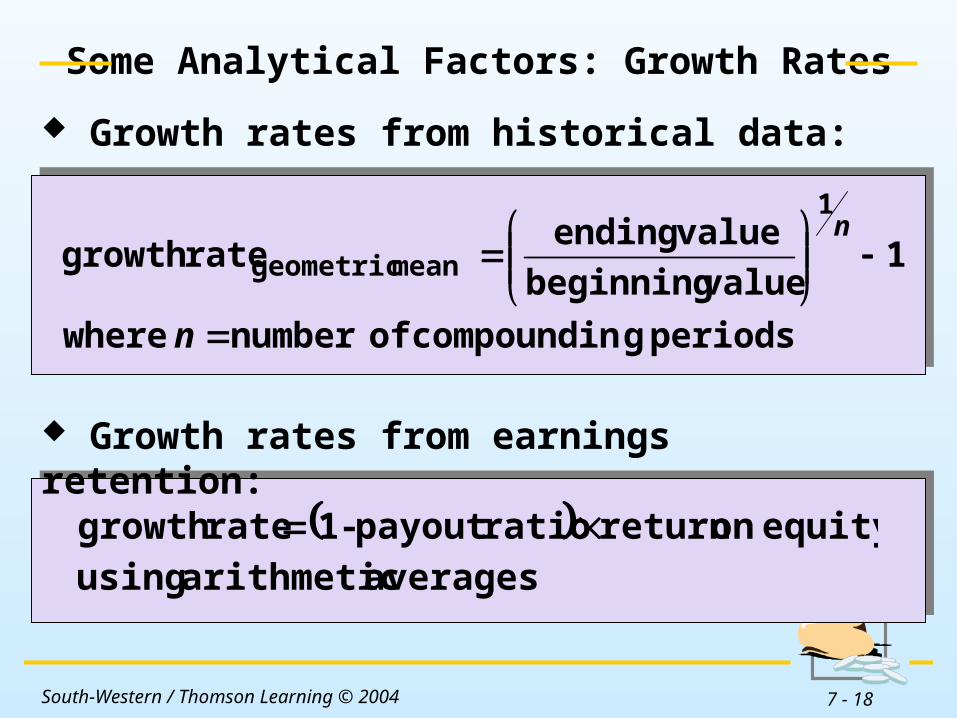
Some Analytical Factors: Growth Rates
Growth rates from historical data:
periods gcompoundin of number where
value beginning
value endingrate growth mean geometric
n
n1
1
averages arithmetic using
equity on returnratiopayout -1 rate growth
Growth rates from earnings retention:
South-Western / Thomson Learning © 2004 7 - 19
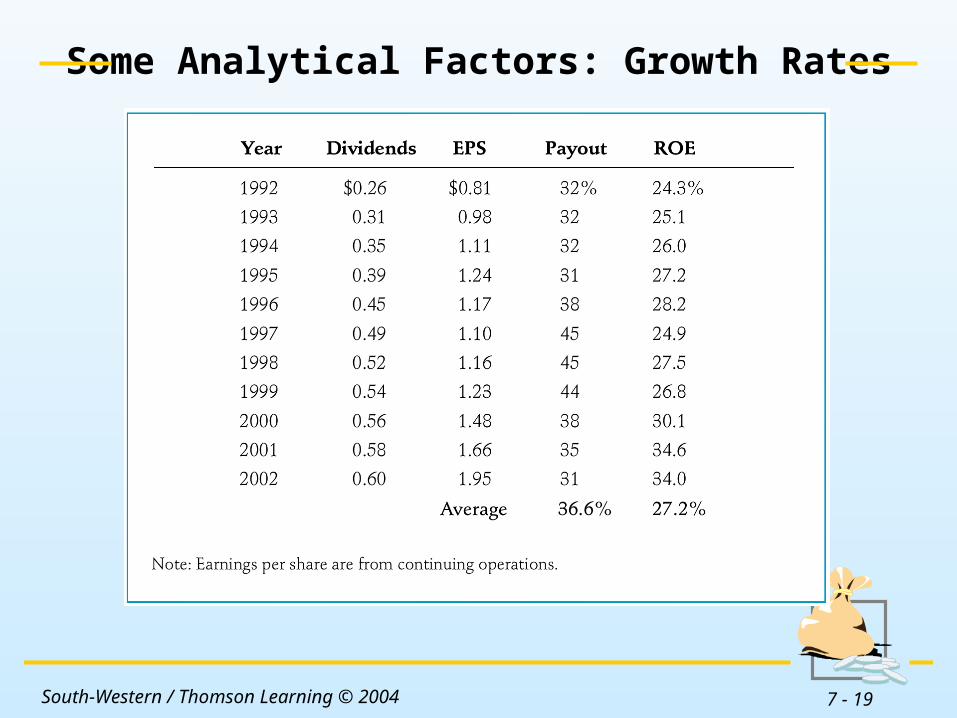
Some Analytical Factors: Growth Rates
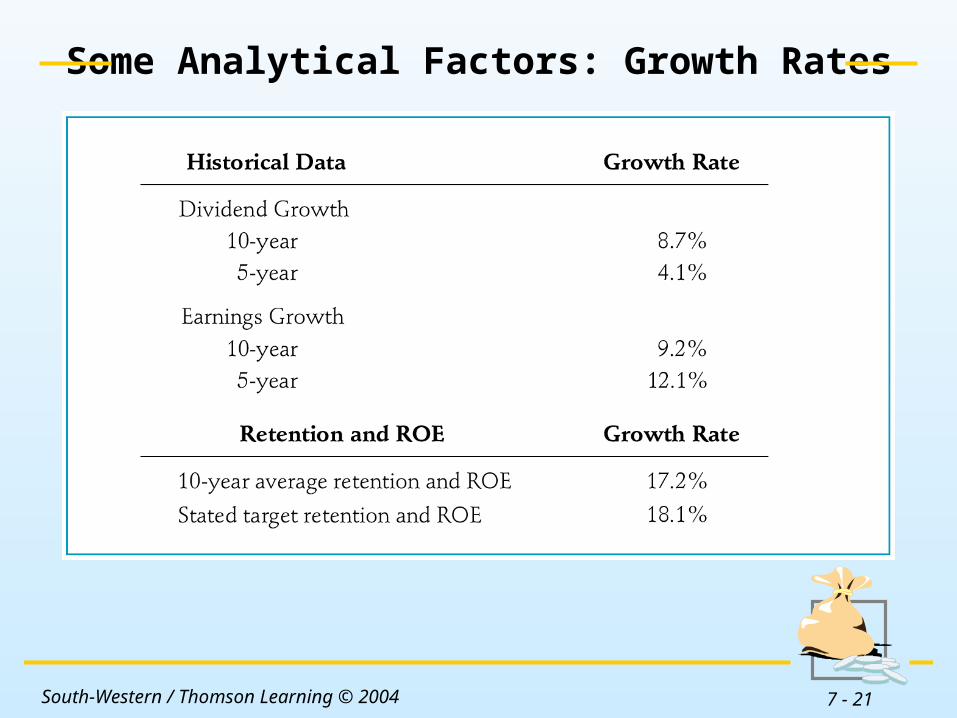
Insert Table 7-4 here.
South-Western / Thomson Learning © 2004 7 - 20
Some Analytical Factors: Growth Rates
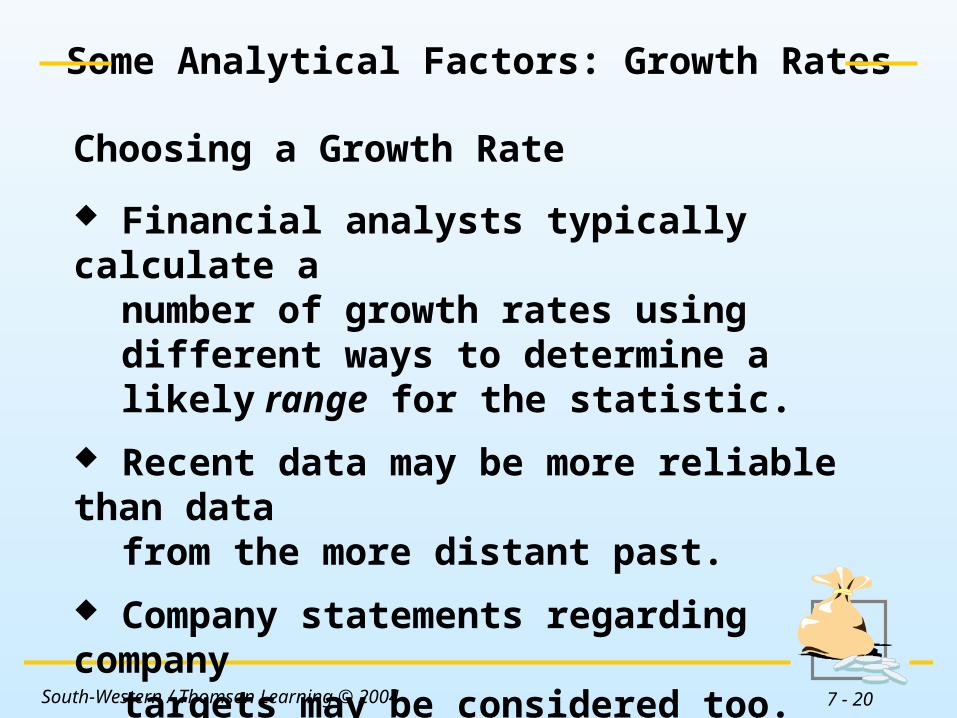
Financial analysts typically calculate a number of growth rates using different ways to determine a likely range for the statistic.
Recent data may be more reliable than data from the more distant past.
Company statements regarding companytargets may be considered too.
Choosing a Growth Rate
South-Western / Thomson Learning © 2004 7 - 21
Some Analytical Factors: Growth Rates
Insert Table 7-5 here.
South-Western / Thomson Learning © 2004 7 - 22
Some Analytical Factors: Growth Rates
Another important source of growth rate estimates is from other security analysts.
Three popular services that monitor and report these estimates are Zacks, First Call, and the Institutional Brokers Estimate System (I/B/E/S).
The term whisper number refers to what people really think the earnings will be, and not what the published estimate is.
Growth Rate Estimates from Other Analysts
South-Western / Thomson Learning © 2004 7 - 23
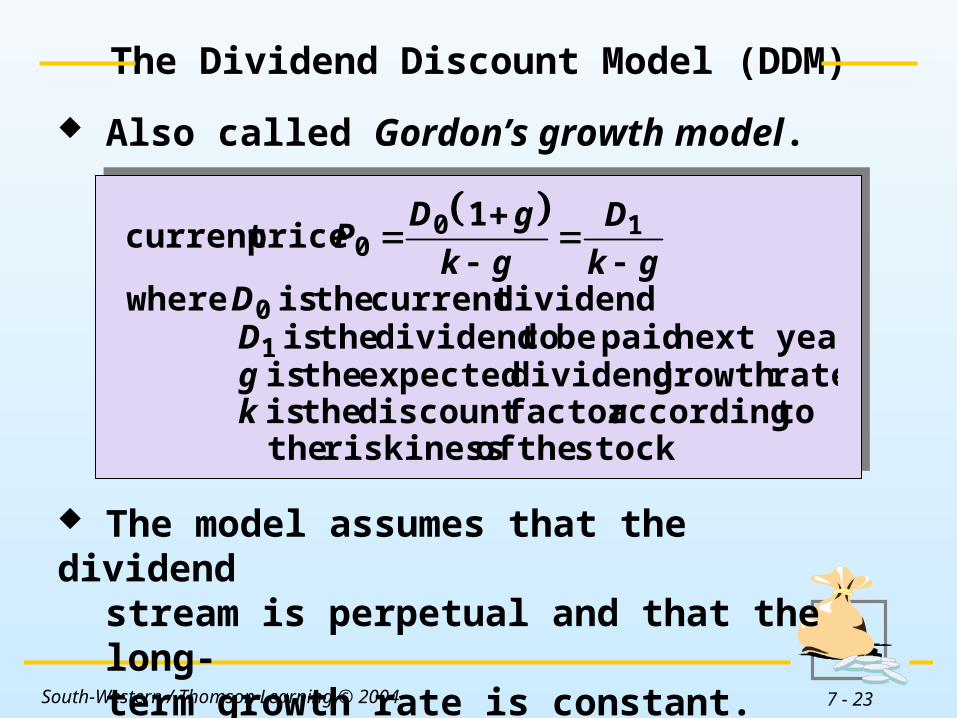
The Dividend Discount Model (DDM)
Also called Gordon’s growth model.
The model assumes that the dividendstream is perpetual and that the long-term growth rate is constant.
stock the of riskiness the to according factordiscount the is
rate growth dividend expected the is next year paid be to dividend the is
dividendcurrent the is where
pricecurrent
kgDD
gk
D
gk
gDP
1
0
100
1
South-Western / Thomson Learning © 2004 7 - 24
The Dividend Discount Model (DDM)
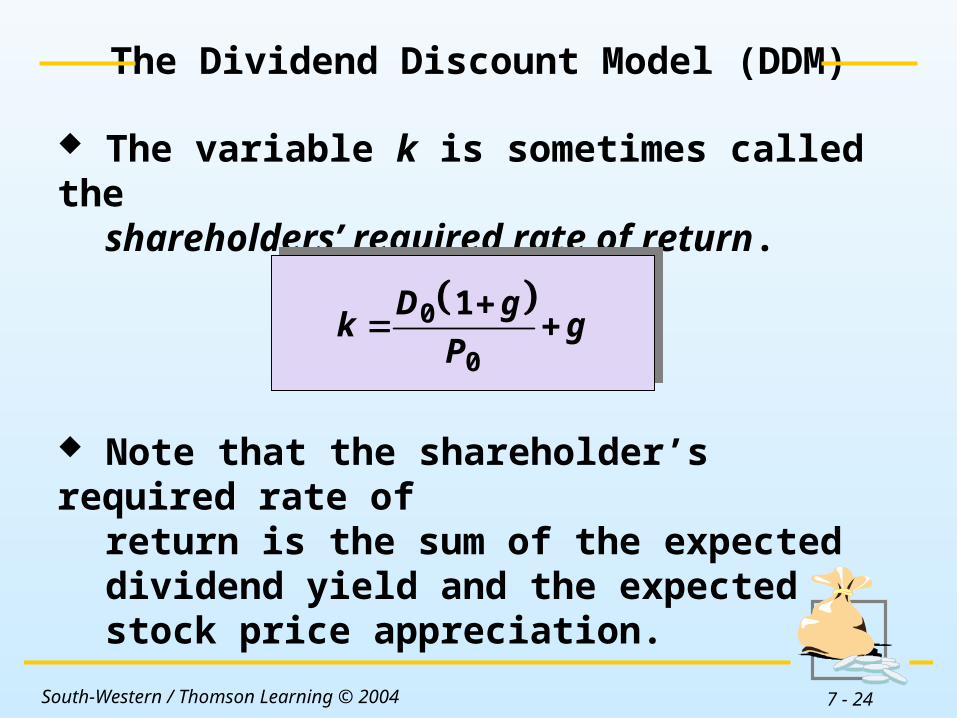
The variable k is sometimes called the shareholders’ required rate of return.
Note that the shareholder’s required rate ofreturn is the sum of the expected dividend yield and the expected stock price appreciation.
g
P
gDk
0
0 1

South-Western / Thomson Learning © 2004 7 - 25
The Importance of Hitting the Earnings Estimate
The market often penalizes a company’s stock substantially when the earnings report is disappointing.
This is especially true when the required rate of return and the estimated growth rate are high.
South-Western / Thomson Learning © 2004 7 - 26
The Multistage DDM
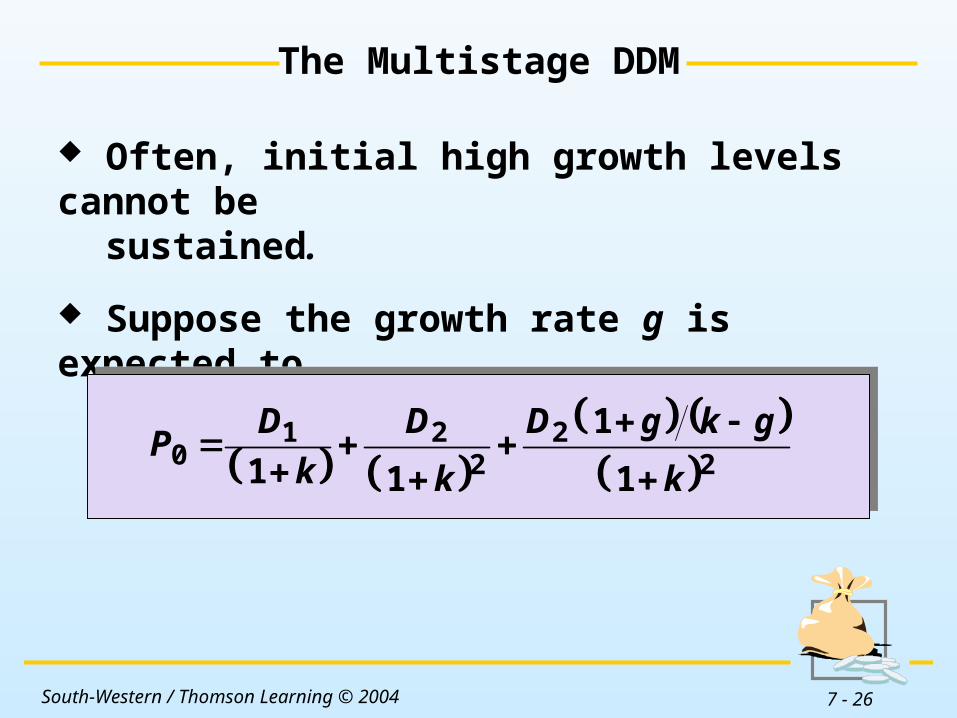
Often, initial high growth levels cannot be sustained.
Suppose the growth rate g is expected to persist from the third year:
2
22
210
1
1
11 k
gkgD
k
D
k
DP
South-Western / Thomson Learning © 2004 7 - 27
Some Analytical Factors
Caveats about the DDM: The DDM is at most a useful tool in security analysis - it requires certain assumptions and it has shortcomings.
False growth: False growth occurs when a firm acquires another firm with a lower price-earnings ratio - historical data should always be scrutinized carefully when used to determine a growth rate.

South-Western / Thomson Learning © 2004 7 - 28
False Growth
Insert Table 7-7 here.
South-Western / Thomson Learning © 2004 7 - 29
Some Analytical Factors
A firm’s cash flow: The statement of cash flows is a useful analytical tool - the cash flow from operations figures are widely used as a check on a firm’s earnings quality.
South-Western / Thomson Learning © 2004 7 - 30
Some Analytical Factors
Small-cap, mid-cap, and large-cap stocks: Another consideration in fundamental stock analysis relates to the size of the firm - for example, the small firm effect.
South-Western / Thomson Learning © 2004 7 - 31
Some Analytical Factors: Ratio Analysis
The fundamental analyst is necessarilyinterested in the firm’s accounting statements and in the prevailing general economic conditions.
To assist in the analysis, several organizations publish comparative statistics for industry groups.e.g. Dun and Bradstreet’s Industry Norms & Key Business Ratios, which includes solvency, efficiency and profitability ratios.
South-Western / Thomson Learning © 2004 7 - 32
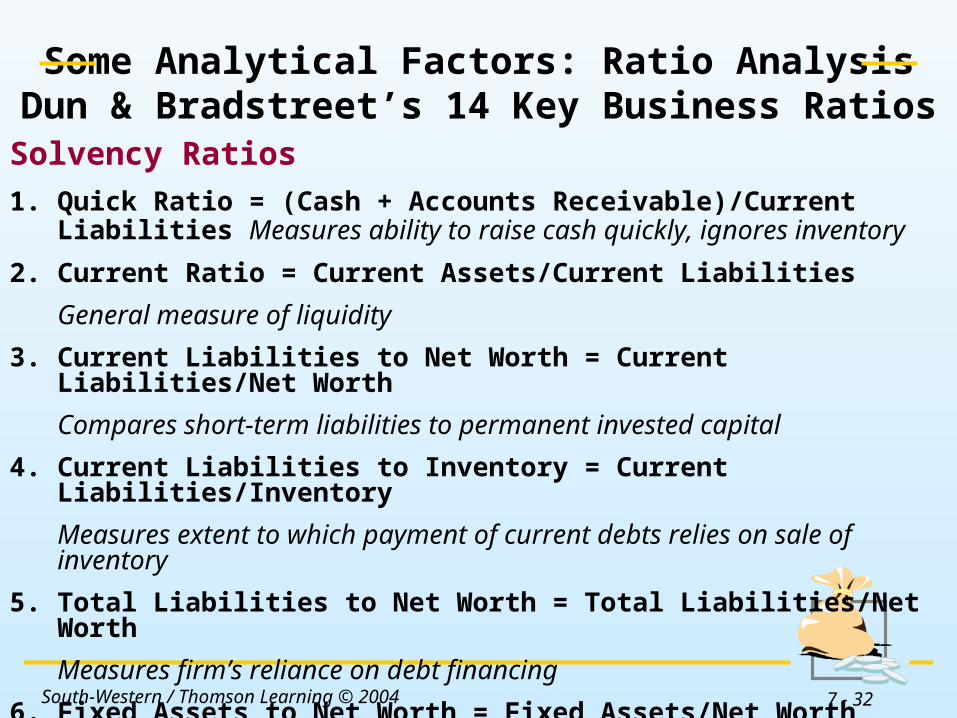
Some Analytical Factors: Ratio AnalysisDun & Bradstreet’s 14 Key Business Ratios
Solvency Ratios
1. Quick Ratio = (Cash + Accounts Receivable)/Current Liabilities Measures ability to raise cash quickly, ignores inventory
2. Current Ratio = Current Assets/Current Liabilities
General measure of liquidity
3. Current Liabilities to Net Worth = Current Liabilities/Net Worth
Compares short-term liabilities to permanent invested capital
4. Current Liabilities to Inventory = Current Liabilities/Inventory
Measures extent to which payment of current debts relies on sale of inventory
5. Total Liabilities to Net Worth = Total Liabilities/Net Worth
Measures firm’s reliance on debt financing
6. Fixed Assets to Net Worth = Fixed Assets/Net WorthMeasures proportion of firm’s equity tied up in long-term assets
South-Western / Thomson Learning © 2004 7 - 33
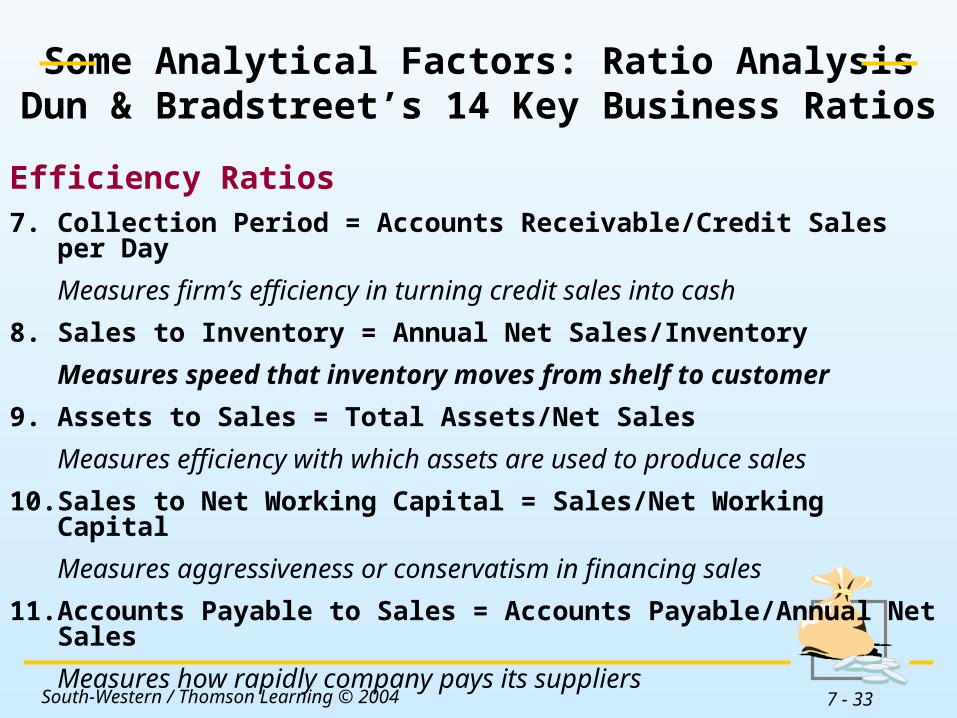
Some Analytical Factors: Ratio AnalysisDun & Bradstreet’s 14 Key Business Ratios
Efficiency Ratios7. Collection Period = Accounts Receivable/Credit Sales per Day
Measures firm’s efficiency in turning credit sales into cash
8. Sales to Inventory = Annual Net Sales/Inventory
Measures speed that inventory moves from shelf to customer
9. Assets to Sales = Total Assets/Net Sales
Measures efficiency with which assets are used to produce sales
10. Sales to Net Working Capital = Sales/Net Working Capital
Measures aggressiveness or conservatism in financing sales
11. Accounts Payable to Sales = Accounts Payable/Annual Net Sales
Measures how rapidly company pays its suppliers
South-Western / Thomson Learning © 2004 7 - 34
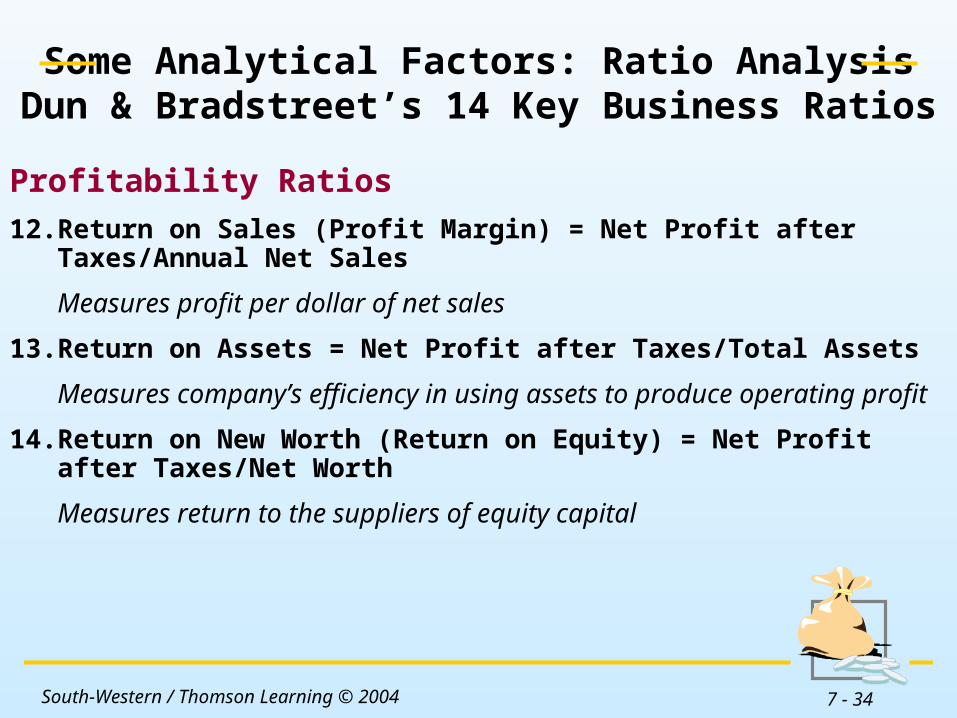
Some Analytical Factors: Ratio AnalysisDun & Bradstreet’s 14 Key Business Ratios
Profitability Ratios
12. Return on Sales (Profit Margin) = Net Profit after Taxes/Annual Net Sales
Measures profit per dollar of net sales
13. Return on Assets = Net Profit after Taxes/Total Assets
Measures company’s efficiency in using assets to produce operating profit
14. Return on New Worth (Return on Equity) = Net Profit after Taxes/Net Worth
Measures return to the suppliers of equity capital
South-Western / Thomson Learning © 2004 7 - 35
Some Analytical Factors: Cooking the Books
All publicly traded firms in the United Statesmust have their financial statements audited to ensure they fairly present the company’s financial position.
Still, every year, there is at least one story of accounting fraud at a major firm. Unfortunately, there is not much the analyst can do about fraud.

South-Western / Thomson Learning © 2004 7 - 36
Review Valuation Philosophies
Investors’ Understanding of Risk Premiums The Time Value of Money The Importance of Cash Flows The Tax Factor EIC Analysis
Value vs. Growth Investing The Value Approach to Investing The Growth Approach to Investing How Price Relates to Value Value Stocks and Growth Stocks:
How to Tell by Looking
South-Western / Thomson Learning © 2004 7 - 37
The Price-to-Book Ratio The Price-Earnings Ratio Differences between Industries
Review

South-Western / Thomson Learning © 2004 7 - 38
Some Analytical Factors Growth Rates The Dividend Discount Model The Importance of Hitting the Earnings Estimate The Multistage DDM Caveats about the DDM False Growth A Firm’s Cash Flows Small-Cap, Mid-Cap, and Large-Cap Stocks Ratio Analysis Cooking the Books
Review