chapter sample - j. ross publishing · 96 aircraft finance commercial aircraft, laying the...
TRANSCRIPT
Sample
Cha
pter
95
3
Aircraft Efficiency: Operating and Financial Metrics
The Wright Brothers created the single greatest cultural force since the invention of writing. The airplane became the first World Wide Web, bringing people, languages, ideas, and values together.
—Bill Gates, CEO, Microsoft Corporation
Like any other asset, aircraft values depend on two factors: technical efficiency and allocative efficiency. Technical efficiency in this context refers to the operating efficiency of the aircraft itself and operating metrics such as gross takeoff weight, convertibility, fuel burn, maintenance expenses per block hour, consumable parts expense, aircraft wear and tear, cruising speed, and landing distance. Aircraft efficiency can be measured by single factor or multifactor measures. Single factor measures are based on a single input and output including fuel burn, crew costs per block hour and average seats per aircraft. Single factor ratios can be broken down into three types: technical, operational, and financial.
In this chapter, several single factor ratios are outlined to benchmark aircraft financial and operational performance for both narrow- and wide-body aircraft. Four narrow-body and four wide-body aircraft were selected—the Boeing 737-700 and 757-200 and Airbus A319 and A320 in the narrow-body category; and the Boeing 767-200, 767-400, 777, and Airbus A330 in the wide-body category. Efficiency ratios are demonstrated that can be used to compare and benchmark
Sample
Cha
pter
96 Aircraft Finance
commercial aircraft, laying the foundation for use of these metrics as determinants of aircraft value in subsequent chapters. The chapter is organized as follows:
Airline Fleet Composition
Single Factor Ratios
• Aircraft Technical Performance Ratios• Operating Ratios
Financial and Operational Performance
Comparative Analysis of Efficiency
• Narrow-body: Boeing 737NG vs. Airbus A320• Wide-body: Boeing 777-200 vs. Airbus A330-300• Regional Jets: CRJ100/200 vs. ERJ 145
At the end of the chapter is a Summary for chapter review and References for further study.
Airline Fleet Composition
Technical metrics are aircraft characteristics that are considered fixed in the short term. Examples include average seats per airplane, cargo capacity, airspeed, and range. These are characteristics that influence an aircraft operator when purchas-ing the aircraft, but once determined are considered outside of airline operations. Operational characteristics impact aircraft value and are determined by the aircraft operators. Many factors further influence operational characteristics, of which aircraft utilization is considered the most important. Other factors include scheduled stage length and fuel efficiency.
Some operating procedures can affect fuel efficiency, but basic aircraft fuel characteristics are much more a determinant of overall efficiency than the airline’s patterns of use of the aircraft itself. The financial characteristics of an aircraft include crew costs, maintenance, depreciation, and other operating costs. In the 1960s, the three U.S. commercial aircraft manufacturers—Boeing, Lockheed, and McDonnell Douglas—had over 90% market share. Surprisingly, today Airbus has over 50% mar-ket share. Until 1980, the U.S. commercial aircraft industry enjoyed a monopolistic position in the world market, despite the European-based Airbus Industrie being founded in 1970. The entry of Airbus was one of the major factors leading to the demise of McDonnell Douglas. McDonnell Douglas had two families of aircraft, the DC-9, targeting the short-haul market with a low seating capacity, and the DC-10, a medium- to long-haul aircraft with a medium seating capacity.1
1 These aircraft were extended and updated with the MD-80 and MD-90 as derivatives of the DC-9, and the MD-11 as a derivative of the DC-10.
Sample
Cha
pter
Aircraft Efficiency: Operating and Financial Metrics 97
A summary of aircraft types in the United States is presented in Table 3.1. Boeing dominates the market, constituting over 50% of the U.S. commercial air-craft fleet. In contrast, Airbus Industrie has a market position that been growing steadily over the past decade. Another interesting feature is a 4.4% fleet reduction in 2008, primarily due to the economic recession. In order to counteract some of the severe losses experienced by North American carriers, massive fleet reductions were initiated. Fleet reduction continued into 2010 before returning to 1.5-2% growth per year. Due to the emergence of low-cost carriers and continuing com-petition in the airline industry, it is reasonable to surmise that the Boeing 737NG and Airbus A320 family of aircraft will continue to dominate the U.S. markets for the near future.
Next, general ratios for numerous wide-body and narrow-body aircraft are presented, including detailed financial ratio analysis for four narrow-body and four wide-body aircraft—the Boeing 737-700 and 757-200 and the Airbus A319 and A320 in the narrow-body category; and the Boeing 767-200, 767-400, 777, and Airbus A330 in the wide-body category.2 Efficiency ratios can be used to compare and benchmark commercial aircraft, and these same metrics can be used to determine aircraft value.
Single Factor Ratios
Ratios show a mathematical relationship between one variable over another vari-able. Suppose you have 100 aircraft and 500 pilots; the ratio of pilots to aircraft is 500/100 or 5:1. Single factor ratios can be extremely useful for comparing and benchmarking aircraft efficiency across aircraft types. However, they are limited to the consideration of one or two operational aspects at any given time and are unsuitable for comprehensive aircraft efficiency comparisons. For example, an aircraft with superior fuel efficiency and maintenance costs per block hour may be unsuitable for short-haul markets, if the depreciation per block hour is too high and hurts profitability. Multifactor productivity comparisons attempt to address this shortcoming by integrating several input and output measures into a single productivity measure.
This section essentially concerns the calculation of relationships between outputs and inputs to provide necessary information to management about the operations and financial performance of an aircraft. There are three operational indicators to use in evaluations: fuel efficiency or average fuel burn (per block hour), average aircraft utilization (in block hours), and average stage length.
2 On August 30, 2011, the Boeing Company announced that it would build the 737 MAX. The new family of aircraft—737 MAX 7, 737 MAX 8, and 737 MAX 9—built on the strengths of the Next Generation 737.
Sample
Cha
pter

98 Aircraft FinanceU
nite
d S
tate
s Fl
eet
Dat
a—B
oei
ng A
ircr
aft
Act
ual y
ear
end
fle
etP
roje
cted
yea
r en
d f
leet
2007
2008
2009
2010
2011
2012
2013
2014
2015
2016
737-
600
6969
6969
6969
6969
6969
737-
700
904
966
1,01
91,
046
1,13
61,
236
1,32
61,
406
1,47
61,
526
737-
800
1,31
21,
503
1,78
92,
113
2,37
82,
663
2,98
33,
313
3,63
33,
908
737-
900
6090
118
133
158
193
228
268
308
358
747-
400
669
682
690
690
690
690
690
690
685
672
747-
8–
––
–1
3055
8010
012
075
7-20
0/30
01,
027
1,02
11,
007
1,00
499
999
197
996
294
492
176
7-20
0/40
092
092
692
893
294
295
594
492
891
789
777
7-20
0/30
068
674
683
490
897
81,
063
1,15
81,
253
1,32
81,
378
787-
8/-9
––
––
190
190
320
460
605
Tota
l Boe
ing
5,64
76,
003
6,45
46,
895
7,35
27,
980
8,62
29,
289
9,92
010
,454
Uni
ted
Sta
tes
Flee
t D
ata—
Air
bus
Air
craf
tA
ctua
l yea
r en
d f
leet
Pro
ject
ed y
ear
end
fle
et20
0720
0820
0920
1020
1120
1220
1320
1420
1520
16A
300
412
402
387
381
374
366
358
349
345
340
A31
8 53
6672
7479
8484
8484
84A
319
1,03
41,
132
1,22
01,
271
1,33
61,
406
1,46
61,
516
1,55
61,
596
A32
01,
795
1,99
12,
194
2,49
12,
806
3,14
63,
496
3,84
54,
157
4,38
0A
321
421
487
574
625
665
705
755
805
855
905
A33
0-20
0/30
051
258
465
974
684
195
61,
056
1,13
11,
206
1,28
1A
380
113
2341
6696
131
166
201
236
Tota
l Airb
us4,
228
4,67
55,
129
5,62
96,
167
6,75
97,
346
7,89
68,
404
8,82
2U
nite
d S
tate
s Fl
eet
Dat
a—R
egio
nal A
ircr
aft
Act
ual y
ear
end
fle
etP
roje
cted
yea
r en
d f
leet
2007
2008
2009
2010
2011
2012
2013
2014
2015
2016
Bom
bar
die
r1,
405
1,46
01,
514
1,54
91,
594
1,63
41,
699
1,76
41,
849
1,93
9E
mb
raer
1,20
01,
362
1,48
21,
582
1,68
71,
757
1,82
71,
897
1,98
72,
077
Tota
l Oth
er2,
605
2,82
22,
996
3,13
13,
281
3,39
13,
526
3,66
13,
836
4,01
6
Sou
rce:
Com
pile
d f
rom
Airl
ine
Mon
itor
dat
a.
Tab
le 3
.1 B
oein
g an
d A
irbus
fle
ets
in t
he U
nite
d S
tate
s
Sample
Cha
pter
Aircraft Efficiency: Operating and Financial Metrics 99
The level and historical trends of those indicators can be used to make infer-ences about an aircraft’s operational performance and its attractiveness as an investment. Likewise, there are four financial indicators: crew cost per block hour; depreciation per block hour, fuel cost, and maintenance cost per block hour.
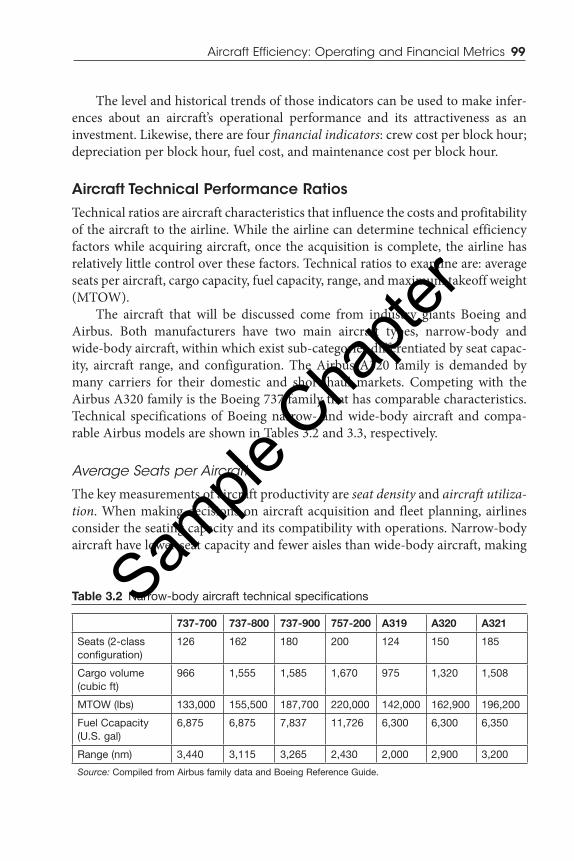
Aircraft Technical Performance RatiosTechnical ratios are aircraft characteristics that influence the costs and profitability of the aircraft to the airline. While the airline can determine technical efficiency factors while acquiring aircraft, once the acquisition is complete, the airline has relatively little control over these factors. Technical ratios to examine are: average seats per aircraft, cargo capacity, fuel capacity, range, and maximum takeoff weight (MTOW).
The aircraft that will be discussed come from industry giants Boeing and Airbus. Both manufacturers have two main aircraft types, narrow-body and wide-body aircraft, within which exist sub-categories differentiated by seat capac-ity, aircraft range, and configuration. The Airbus A320 family is demanded by many carriers for their domestic and short-haul markets. Competing with the Airbus A320 family is the Boeing 737 family that has comparable characteristics. Technical specifications of Boeing narrow- and wide-body aircraft and compa-rable Airbus models are shown in Tables 3.2 and 3.3, respectively.
Average Seats per Aircraft
The key measurements of aircraft productivity are seat density and aircraft utiliza-tion. When making decisions on aircraft acquisition and fleet planning, airlines consider the seating capacity and its compatibility with operations. Narrow-body aircraft have lower seat capacity and fewer aisles than wide-body aircraft, making
Table 3.2 Narrow-body aircraft technical specifications
737-700 737-800 737-900 757-200 A319 A320 A321
Seats (2-class configuration)
126 162 180 200 124 150 185
Cargo volume (cubic ft)
966 1,555 1,585 1,670 975 1,320 1,508
MTOW (lbs) 133,000 155,500 187,700 220,000 142,000 162,900 196,200
Fuel Ccapacity (U.S. gal)
6,875 6,875 7,837 11,726 6,300 6,300 6,350
Range (nm) 3,440 3,115 3,265 2,430 2,000 2,900 3,200
Source: Compiled from Airbus family data and Boeing Reference Guide.
Sample
Cha
pter
100 Aircraft Finance
them inherently ideal for thinner markers and short-haul segments. For a given seat capacity, the airline then decides on the aircraft seat configuration.
Seat configuration is a characteristic of an aircraft that is limited to the origi-nal decision; usually, there are three specifications in which seats are allocated:
• One-class configuration where all the seats are economy seats has become the mainstay of low-cost carriers (LCCs) such as Ryanair, Air Asia, JetBlue, EasyJet, Wizz Air, and Southwest Airlines. Interestingly, Etihad Airways introduced its first “all economy” class aircraft to its fleet in October of 2010. Etihad is the only non-LCC in the Middle East operating with such a configuration.
• A two-class configuration is used by many domestic network carriers and some LCCs. US Airways’ first class flatbed seats in its Airbus A330-300s have a seat pitch of 94 inches. A number of Asian airlines, includ-ing Air India, Jet Airways, Kingfisher Airlines, Mahan Air, Oman Air, Royal Jordanian, and Saudi Arabian Airlines, operate some economy services, as well as business and first class. AirAsia X has become the first LCC to offer flatbed seats on its long-haul route, which combines the comfort of premium travel with the affordability of no-frills flying.3
• The three-class configuration is in low use by North American carri-ers, but remains a popular choice for international hub-to-hub routes in Europe and Asia. For example, in the Swiss International Air Lines fleet of 88 planes, there are 10 A330-300s that each have a total seating capacity of 236 passengers in three-class layouts (8 seats in first class, 45 seats in business class, and 183 seats in economy).4
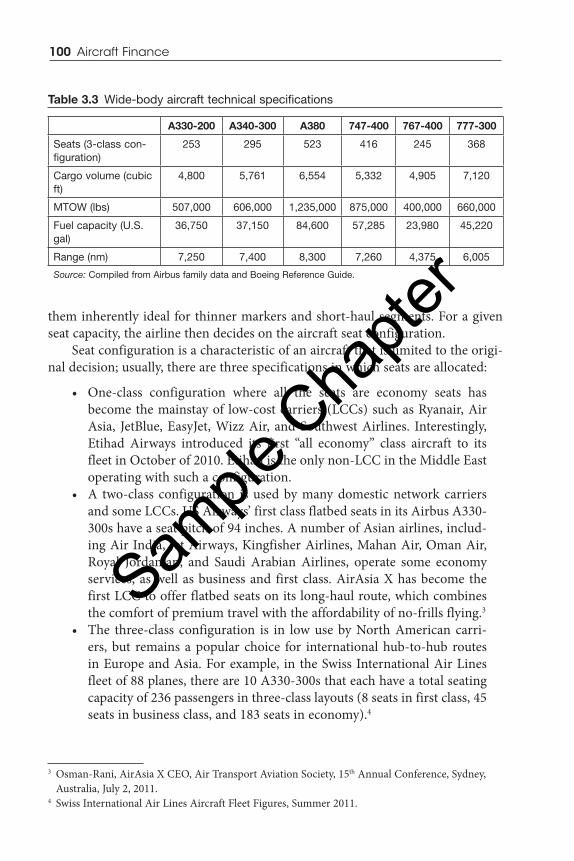
Table 3.3 Wide-body aircraft technical specifications
A330-200 A340-300 A380 747-400 767-400 777-300
Seats (3-class con-figuration)
253 295 523 416 245 368
Cargo volume (cubic ft)
4,800 5,761 6,554 5,332 4,905 7,120
MTOW (lbs) 507,000 606,000 1,235,000 875,000 400,000 660,000
Fuel capacity (U.S. gal)
36,750 37,150 84,600 57,285 23,980 45,220
Range (nm) 7,250 7,400 8,300 7,260 4,375 6,005
Source: Compiled from Airbus family data and Boeing Reference Guide.
3 Osman-Rani, AirAsia X CEO, Air Transport Aviation Society, 15th Annual Conference, Sydney, Australia, July 2, 2011.
4 Swiss International Air Lines Aircraft Fleet Figures, Summer 2011.
Sample
Cha
pter

Aircraft Efficiency: Operating and Financial Metrics 101
Seat pitch of a low-cost airline is usually 28 inches, compared to a traditional con-ventional economy class pitch with 32 inches.5 Lower seat pitch can mean more rows of seats and higher productivity, resulting in much lower cost per available seat mile (CASM). In Tables 3.2 and 3.3, all seat capacities are estimates based on a two-class (business and economy) configuration.
It should be stressed that seat capacity is a major indicator of the revenue capabilities of a particular aircraft. The Boeing 737-700 in a two-class configura-tion holds 126 passengers per aircraft, while its competitor, the Airbus A319, holds slightly less at 124 passengers per aircraft.6 As the number of seats per aircraft increases, the cost per seat for the airline is lowered. The higher the number of seats, however, the less the level of comfort that will be experienced by passen-gers, and subsequently the higher the possibility of revenue loss.7 Increasing the number of seats may potentially lower the price premium that can be charged because while cost per seat may decline, it may be offset by decreased yields per seat. Furthermore, certain seat configurations may require higher power plant requirements to counteract increased airplane weight, increasing seat costs in the process. Given its operating cost profile and product placement, an airline chooses an optimal seat configuration. Once this is determined, it remains invariant under normal operations.
Cargo Capacity
Cargo capacity is another important technical efficiency factor, not only to freight-ers, but also to passenger aircraft, which have to be able to carry passenger baggage and capitalize on cargo space as a good source of ancillary revenue. The aircraft identified in Tables 3.2 and 3.3 have two cargo spaces forward and aft in the belly of the aircraft. After filling the cargo spaces with passenger baggage, the remain-ing available space is used by carriers for commercial cargo. Most wide-bodies and the A320 family allow containerized cargo pallets called Unit Load Devices (ULDs). These devices allow an efficient turnaround time for an aircraft, increas-ing its cargo carrying capacity and, therefore, its value. The average revenue yield for cargo operations is six-fold that of passenger yield; air carriers place a high importance on cargo capacity as an important technical metric. Tables 3.2 and 3.3 show the cargo volumes that are available for Boeing and Airbus narrow- and wide-body aircraft products. From these tables, it can be seen that the A380 offers the most cubic feet of cargo at 8,300 ft3.
5 Measuring the distance between rows of seats (one behind the other).6 Seat capacity is taken from Airbus and Boeing aircraft technical specifications and dimensions
data.7 The biggest single cost advantage enjoyed by the LCC is seating density.
Sample
Cha
pter
102 Aircraft Finance
Range Capability
The range of an aircraft model is a balance between the MTOW and airspeed. With the expansion of international trade and the progress in trade liberalization, the aircraft with the longest range is preferred, since this gives the airline flexibility in fleet assignments. An aircraft with a 4,000-mile range can be used in short-, medium-, or long-haul markets, whereas an aircraft with a 2,000-mile range is restricted to the short-haul market. However, longer range implies higher operat-ing costs, since these aircraft require larger engines, consume more fuel, and have cost profiles that are efficient only if the range capability is fully utilized. Range often determines an aircraft’s deployment within the airline network. The narrow-body, short-range aircraft are suited for short-haul markets and are preferred by LCCs and domestic network carriers. Wide-body aircraft are suited for the long-haul market and are widely used by legacy carriers on international and long haul domestic routes.
Maximum Takeoff Weight
MTOW is literally the maximum amount of weight that the aircraft can carry and become safely airborne on a standard length runway. MTOW is highly regulated by national aviation authorities and explicitly stated by aircraft manufacturers. Regulatory agencies, including the Federal Aviation Administration (FAA) and Joint Aviation Authorities (JAA), specify rigorous structural and performance requirements, including various engine-out performance capabilities, structural integrity requirements in turbulent air and crosswind restrictions, all of which use MTOW as a key input. The MTOW restricts operations for certain aircraft, the number of passengers, and cargo that airlines can safely carry.8 This becomes an especially important consideration for freighters. The MTOW is influenced by these factors:
• Airfield altitude• Air temperature• Condition of runway• Length of runway• Obstacles and terrain beyond the end of the runway• Runway wind direction and velocity
Operating Ratios
Operating ratios are factors that an airline can influence by changing some aspect of its operations. These are variable in the short run and consist of metrics such
8 Bowers, 1989, pp. 516-517.
Sample
Cha
pter

Aircraft Efficiency: Operating and Financial Metrics 103
as aircraft utilization, fuel efficiency, and average stage length, although the lat-ter is an indirect function of aircraft range. In a sense, operating ratios present a mixed indication of efficiency since they are determined by the operating airline. However, operating ratios are an important determinant of aircraft value and have roots in technical and financial aircraft characteristics. Three ratios—fuel efficiency, aircraft utilization and average stage length—are discussed in detail.
Fuel EfficiencyFuel efficiency is determined largely by the fuel burn of the aircraft, the average speed, and other technical design factors. However, it can also be controlled by airlines by the flying techniques employed, the distance flown, and other vari-ables. Fuel efficiency is an important part of air carrier operations. Fuel cost is a top expense, accounting for more than 50% of operating costs for most airlines; reducing and optimizing fuel consumption may be central to the financial sur-vival of the airline. Fuel efficiency is calculated by dividing the gallons consumed per block hour by the average number of seats and average stage length for each aircraft category. For passenger aircraft, the cabin layout and the seating density are important factors in determining fuel costs. A high-density, one-class seat con-figuration used by LCC operators will have lower average fuel consumption than a legacy carrier with a three-class configuration. Another factor is the average stage length of the aircraft.
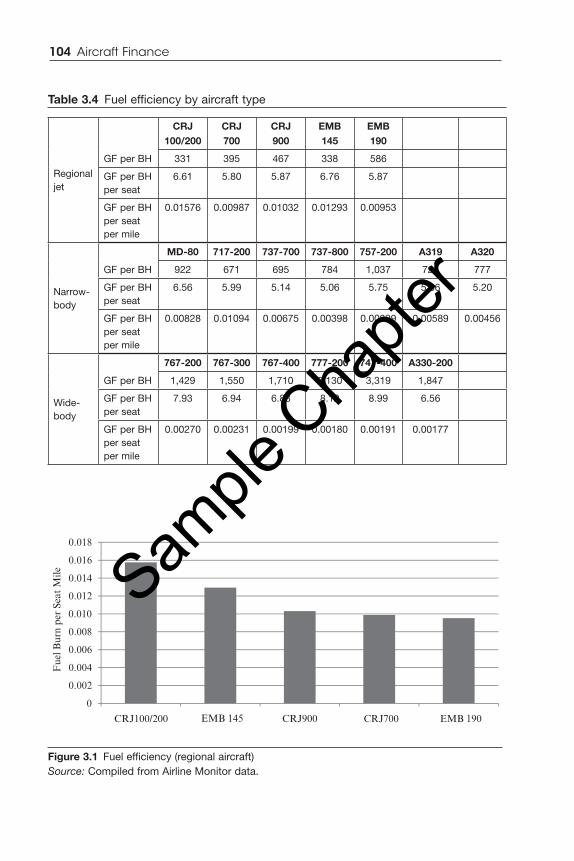
An aircraft has maximum fuel burn during takeoff and climbing to cruising altitude, as well during the descent and landing phase. Therefore, an aircraft with a high stage length would increase its efficiency, since it has lower landing and takeoff cycles. Aircraft with longer ranges are likely to have higher stage lengths, and thus are likely to be more fuel efficient. A longer range is often accompanied with higher airspeeds. Higher airspeeds that tend to increase fuel consumption, and thus decrease efficiency, are indicated in Table 3.4.
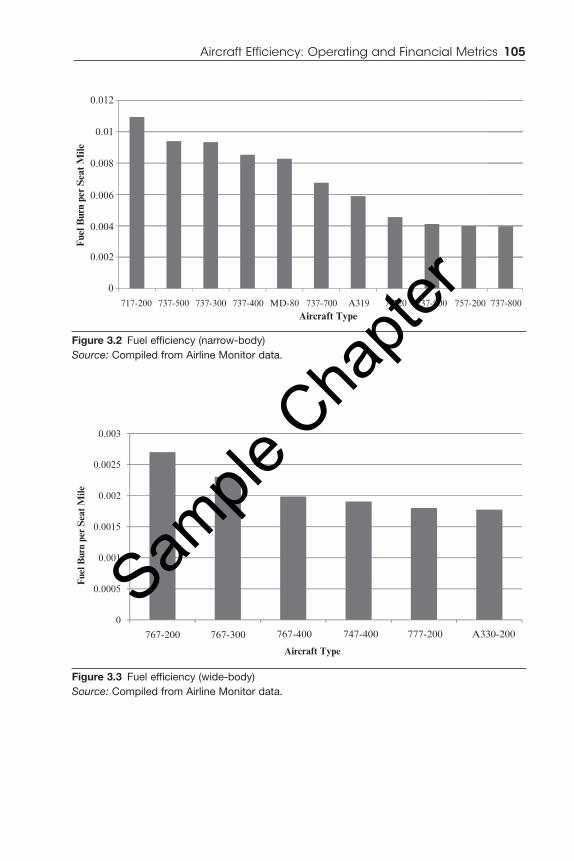
Figures 3.1, 3.2, and 3.3 depict the fuel efficiency of various regional jets, narrow-body aircraft, and wide-body aircraft in terms of gallons of fuel burned per seat mile. Table 3.4 also shows fuel efficiency by displaying the fuel consump-tion per block hour across the regional, narrow-body, and wide-body market. As the number of aircraft seats and the average stage length increase, the average fuel consumption (CASMfuel) decreases. Another trend that is visible is that efficiency has increased with newer models, which is attributable to aircraft manufacturers’ incorporation of aerodynamic and power plant efficiency with new technological innovations.
Aircraft UtilizationAircraft utilization is the number of hours an aircraft is used in a given day. This metric is looked at in conjunction with the average stage length. Airlines have a
Sample
Cha
pter
104 Aircraft Finance
Regional jet
GF per BH
CRJ 100/200
CRJ 700
CRJ 900
EMB 145
EMB 190
331 395 467 338 586
GF per BH per seat
6.61 5.80 5.87 6.76 5.87
GF per BH per seat per mile
0.01576 0.00987 0.01032 0.01293 0.00953
Narrow-body
GF per BH
MD-80 717-200 737-700 737-800 757-200 A319 A320
922 671 695 784 1,037 723 777
GF per BH per seat
6.56 5.99 5.14 5.06 5.75 5.66 5.20
GF per BH per seat per mile
0.00828 0.01094 0.00675 0.00398 0.00399 0.00589 0.00456
Wide-body
GF per BH
767-200 767-300 767-400 777-200 747-400 A330-200
1,429 1,550 1,710 2,130 3,319 1,847
GF per BH per seat
7.93 6.94 6.88 8.12 8.99 6.56
GF per BH per seat per mile
0.00270 0.00231 0.00199 0.00180 0.00191 0.00177
Table 3.4 Fuel efficiency by aircraft type
0
0.002
0.004
0.006
0.008
0.010
0.012
0.014
0.016
0.018
CRJ100/200
Fue
l Bur
n pe
r Se
at M
ile
CRJ700EMB 145 CRJ900 EMB 190
Figure 3.1 Fuel efficiency (regional aircraft)Source: Compiled from Airline Monitor data.
Sample
Cha
pter
Aircraft Efficiency: Operating and Financial Metrics 105
0
0.0005
0.001
0.0015
0.002
0.0025
0.003
767-200
Fue
l Bur
n pe
r S
eat M
ile
Aircraft Type
767-300 767-400 777-200747-400 A330-200
Figure 3.3 Fuel efficiency (wide-body)Source: Compiled from Airline Monitor data.
Figure 3.2 Fuel efficiency (narrow-body)Source: Compiled from Airline Monitor data.
0
0.002
0.004
0.006
0.008
0.01
0.012
Fue
l Bur
n pe
r S
eat M
ile
Aircraft Type717-200 737-500 737-300 737-400 MD-80 737-700 A319 A320 737-900 757-200 737-800
Sample
Cha
pter
106 Aircraft Finance
better chance of making a profit with higher aircraft utilization, since the fixed costs are spread out over a greater number of revenue hours. Efficient fleet utili-zation is one of the key factors in an airline’s efficiency, productivity, and profit-ability. While this is clearly a function of airline operations, the costs associated with high aircraft utilization can often become a factor in determining the optimal utilization rate for the airline.
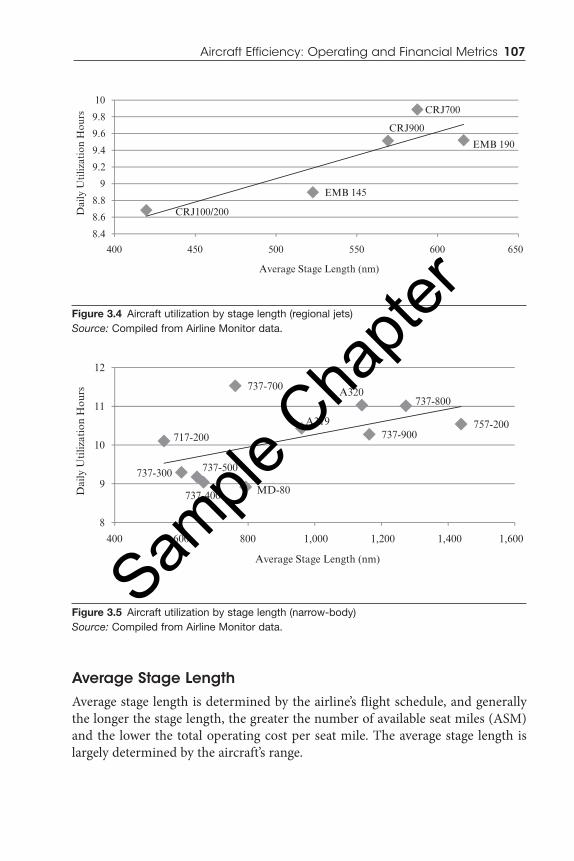
Aircraft utilization is a measure of productivity. To get an average number of block hours per day, divide the number of block hours flown per year by the service days per year. Aircraft utilization is determined by each carrier, as well as the costs and times associated with maintenance and other events. Aircraft utiliza-tion is an indicator of operational efficiency. Southwest Airlines uses its aircraft on many short hops per day, which leads to a high aircraft utilization. This creates a quick turnaround time, with little idle time being spent on the ground. Figures 3.4, 3.5, and 3.6 depict aircraft utilization by average stage length. If you were tak-ing a flight from Narita, Japan (NRT) to Shanghai Pudong International (PVG) with two stops along the way, then that flight would have three stage lengths. Note that, on average, higher stage length implies higher aircraft utilization because the longer the stage length, the longer the flight time for a given aircraft.
However, a significant anomaly exists in the utilization pattern of the Boeing 737-700 (Figure 3.5). This aircraft has a significantly higher utilization time com-pared to a short stage length due to the “Southwest Effect.”9 The Southwest busi-ness model is based on short stage length flights with low turnaround time, and efficient scheduling is the reason the Boeing 737-700 exhibits an above normal utilization given the relatively short stage length. Southwest’s average flight length of 643 miles is less than United (1,165), Delta (1,208), and AirTran (747). This means, with more than 10 hours of utilization, Southwest aircraft get more cycles each day.10
In the case of the Boeing 767-300, a below average utilization given stage length is shown, while the Boeing 767-400 has above average utilization. Delta operates the majority of 767-300s and -400s in the United States, and this effect may be partly attributable to the designated routes being served by these aircraft. International routes that involve an overnight stop at a foreign destination are likely to have lower aircraft utilization (due to the idle time experienced by the aircraft when the airport is inactive) compared with routes that do not involve overnighting.
9 The Southwest Effect is generally referred to as the downward pressure on fares when Southwest enters a market.
10 Boyd Group International, May 31, 2011.
Sample
Cha
pter
Aircraft Efficiency: Operating and Financial Metrics 107
Average Stage LengthAverage stage length is determined by the airline’s flight schedule, and generally the longer the stage length, the greater the number of available seat miles (ASM) and the lower the total operating cost per seat mile. The average stage length is largely determined by the aircraft’s range.
CRJ100/200
CRJ700
CRJ900
EMB 145
EMB 190
8.4
8.6
8.8
9
9.2
9.4
9.6
9.8
10
400 450 500 550 600 650
Dai
ly U
tiliz
atio
n H
ours
Average Stage Length (nm)
Figure 3.4 Aircraft utilization by stage length (regional jets)Source: Compiled from Airline Monitor data.
MD-80
717-200
737-300
737-400
737-500
737-700737-800
737-900757-200A319
A320
8
9
10
11
12
400 600 800 1,000 1,200 1,400 1,600
Dai
ly U
tiliz
atio
n H
ours
Average Stage Length (nm)
Figure 3.5 Aircraft utilization by stage length (narrow-body)Source: Compiled from Airline Monitor data.
Sample
Cha
pter

108 Aircraft Finance
Figures 3.7, 3.8, and 3.9 calculate the fuel efficiency and its correlation with the average stage length. Fuel efficiency was calculated by gallons consumed per block hour per seat per mile. Stage length is the number of miles an aircraft trav-els between a takeoff and landing. The average is a ratio between total distance travelled and the number of takeoffs (or landings). The graphs illustrate data for regional jets, narrow-body, and wide-body aircraft. The regional jet aircraft category has the least fuel efficiency due to the ratio of number of seats to stage length. The average seat capacity of a regional jet is between 50 and 100, and the stage length is approximately 500 nm. Regional jets are typically used as feeders and an important element of a hub-and-spoke network. Therefore, the additional costs are often guaranteed and subsidized by the legacy carriers and/or through higher fares.
The 737-800 and A320 have very similar operating characteristics as far as average stage length. Both aircraft burned about the same amount of fuel per block hour. The narrow-body aircraft depicted in Figure 3.8 have a better fuel efficiency profile than the regional aircraft, but lag behind wide-body aircraft on an ASM basis. This is because, on average, wide-body aircraft have a much higher ASM per block hour. Even with LCCs such as Southwest operating narrow-bodies, their ASM is likely to be lower than that of a legacy carrier operating wide-bodies over long transatlantic and transpacific routes.
One development in the operations of the 737-800 has been the increase in the average flight stage length in recent years. This increase in stage length may be due
767-200
767-300
767-400777-200
747-400
A330-200
11
12
13
14
2,400 2,900 3,400 3,900 4,400 4,900
Dai
ly U
tiliz
atio
n H
ours
Average Stage Length (nm)
Figure 3.6 Aircraft utilization by stage length (wide-body)Source: Compiled from Airline Monitor data.
Sample
Cha
pter

Aircraft Efficiency: Operating and Financial Metrics 109
CRJ100/200
CRJ700CRJ900
EMB 145
EMB 190
0.008
0.009
0.01
0.011
0.012
0.013
0.014
0.015
0.016
0.017
400 450 500 550 600 650
Fue
l Bur
n pe
r B
lock
Hou
r pe
r Se
at p
er M
ile (
gallo
ns)
Average Stage Length (nm)
Figure 3.7 Fuel efficiency by stage length (regional jets)Source: Compiled from Airline Monitor data.
MD-80
717-200
737-300
737-400
737-500
737-700
737-800
737-900
757-200
A319
A320
0.002
0.003
0.004
0.005
0.006
0.007
0.008
0.009
0.01
0.011
0.012
400 600 800 1,000 1,200 1,400 1,600
Fue
l Bur
n pe
r B
lock
Hou
r pe
r Se
at p
er M
ile (
gallo
ns)
Average Stage Length (nm)
Figure 3.8 Fuel efficiency by stage length (narrow-body)Source: Compiled from Airline Monitor data.
Sample
Cha
pter

110 Aircraft Finance
to the increasing use of the 737-800 for Extended-Range Twin-Engine Operations (ETOPS) performance standards.11 ETOPS operations require certification from the FAA, including the use of additional safety equipment, such as life rafts and/or vests, onboard the aircraft. Both American Trans Air (before its demise) and Alaska Airlines have used the 737-800 for flights from the West Coast to Hawaii.12
Finally, wide-body aircraft retain the most fuel-efficient position with a higher capacity of seating and longer stage lengths. For example, the Boeing 747-400 consumes 3,320 gallons of fuel per block hour and carries an average of 370 seats with an average stage length of 4,700 nm.
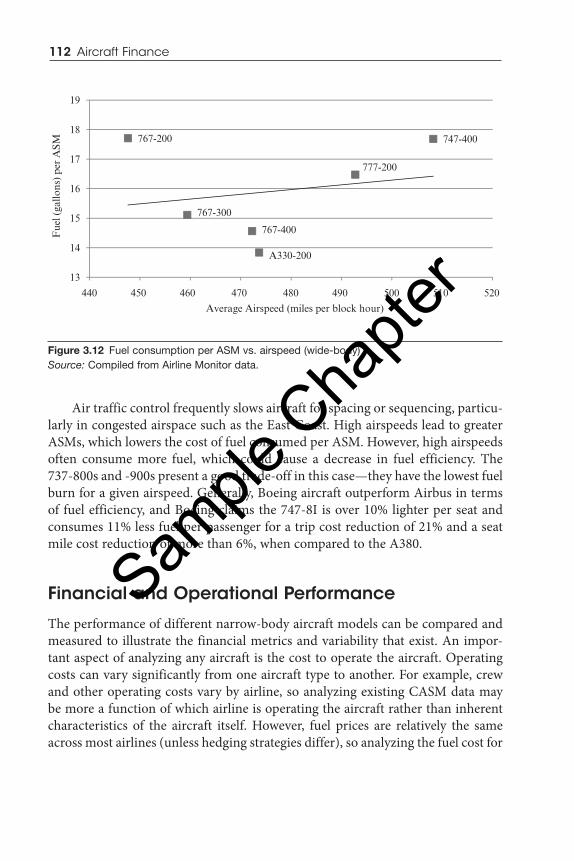
Figures 3.10, 3.11, and 3.12 show the fuel efficiency of the aircraft against air-speed per block hour. First, it is important to note that since a block hour starts at chocks-off time and ends with chocks-on, this calculation is influenced by taxiing time. The average speed shown in these figures is lower than the cruising speed of the aircraft and is a clear illustration of the economies of greater airspeed trad-ing off with the increased fuel consumption associated with high airspeeds. The
767-200
767-300
767-400
777-200
747-400
A330-200
0.0015
0.0017
0.0019
0.0021
0.0023
0.0025
0.0027
0.0029
2,500 3,000 3,500 4,000 4,500 5,000
Fue
l Bur
n pe
r B
lock
Hou
r pe
r Se
at p
er M
ile (
gallo
ns)
Average Stage Length (nm)
Figure 3.9 Fuel efficiency by stage length (wide-body)Source: Compiled from Airline Monitor data.
11 U.S. Dept. of Transportation, Federal Aviation Administration, Advisory Circular, AC No. 120-42B.
12 U.S. Dept. of Transportation, Federal Aviation Administration, Information for Operators. InFO 07004, January 26, 2007.
Sample
Cha
pter

Aircraft Efficiency: Operating and Financial Metrics 111
aircraft spends a great deal of its flight time below cruise speed for reasons other than fuel consideration. Takeoff and climb to cruise altitude are done at less than cruise. All times below 10,000 feet are restricted to 250 kts.
CRJ100/200
CRJ700
CRJ900
EMB 145
EMB 190
16
17
18
19
20
21
22
23
24
25
270 280 290 300 310 320 330
Fue
l (ga
llons
) pe
r A
SM
Average Airspeed (miles per block hour)
Figure 3.10 Fuel consumption per ASM vs. airspeed (regional jets)Source: Compiled from Airline Monitor data.
MD-80
717-200
737-300
737-400
737-500
737-700 737-800
737-900
757-200
A319
A320
10
11
12
13
14
15
16
17
18
19
20
300 320 340 360 380 400 420
Fue
l (ga
llons
) pe
r A
SM
Average Airspeed (miles per block hour)
Figure 3.11 Fuel consumption per ASM vs. airspeed (narrow-body)Source: Compiled from Airline Monitor data.
Sample
Cha
pter
112 Aircraft Finance
Air traffic control frequently slows aircraft for spacing or sequencing, particu-larly in congested airspace such as the East Coast. High airspeeds lead to greater ASMs, which lowers the cost of fuel consumed per ASM. However, high airspeeds often consume more fuel, which could cause a decrease in fuel efficiency. The 737-800s and -900s present a good trade-off in this case—they have the lowest fuel burn for a given airspeed. Generally, Boeing aircraft outperform Airbus in terms of fuel efficiency, and Boeing claims the 747-8I is over 10% lighter per seat and consumes 11% less fuel per passenger for a trip cost reduction of 21% and a seat mile cost reduction of more than 6%, when compared to the A380.
Financial and Operational Performance
The performance of different narrow-body aircraft models can be compared and measured to illustrate the financial metrics and variability that exist. An impor-tant aspect of analyzing any aircraft is the cost to operate the aircraft. Operating costs can vary significantly from one aircraft type to another. For example, crew and other operating costs vary by airline, so analyzing existing CASM data may be more a function of which airline is operating the aircraft rather than inherent characteristics of the aircraft itself. However, fuel prices are relatively the same across most airlines (unless hedging strategies differ), so analyzing the fuel cost for
767-200
767-300
767-400
777-200
747-400
A330-200
13
14
15
16
17
18
19
440 450 460 470 480 490 500 510 520
Fue
l (ga
llons
) pe
r A
SM
Average Airspeed (miles per block hour)
Figure 3.12 Fuel consumption per ASM vs. airspeed (wide-body)Source: Compiled from Airline Monitor data.
Sample
Cha
pter

Aircraft Efficiency: Operating and Financial Metrics 113
competing aircraft should reveal which aircraft is more fuel efficient. In addition, other factors to look at are seats per aircraft, stage length, and aircraft utilization. Comparisons will be made on aircraft which are currently in production that com-pete in the same segment. Furthermore, the comparisons will be broken down into an operating comparison and a financial comparison.
A comprehensive analysis of operating and financial performance of com-mercial aircraft is provided in this section. Financial performance evaluation has become increasingly important to airline managers due to recent global financial problems. Aircraft financial and operational performance allows the managers to plan for capital investment as efficiently as possible. Productivity measurements may be used as comparisons and guidelines in strategic planning, in the internal analysis of operational efficiency, and the competitive position of an aircraft in the air transportation market.
Aircraft Financial Performance through Financial Ratios AnalysisFinancial ratios are used to analyze aircraft efficiency. Financial ratios are an important tool for airline managers to measure the progress for achieving targeted goals. If an airline buys an aircraft from Boeing, the airline can compare the finan-cial performance of other aircraft produced by Airbus or other manufacturers. For example, the 787 is billed as the most advanced and efficient aircraft in its class, carrying 200 to 300 passengers, providing airlines with savings in fuel and operat-ing costs.13 The FAA’s Form 41 requires airlines to report aircraft operating costs in significant detail, providing an in-depth analysis of aircraft operating costs for airlines in the United States. Some of the important cost components and financial metrics that an airline would like to analyze prior to aircraft procurement are: crew costs, depreciation and leases, maintenance costs, and soft costs.
Crew Costs
Crew cost is defined as the costs attributed to pilots, flight attendants, test pilots, reserve pilots, trainee pilots, and instructors for that aircraft type. One of the most important developments in aircraft technology was the use of a two-man flight deck. This feature, coupled with advanced glass displays,14 made the third member of the crew, the flight engineer, redundant, and provided cost advantages.
13 Jane’s World Defense Industry, November 18, 2010.14 The third crew member was made redundant prior to the introduction of advanced glass displays.
Sample
Cha
pter
114 Aircraft Finance
Crew costs do not include maintenance or flight dispatch personnel, since these are allocated to the maintenance costs and administrative costs categories. A two-person cockpit crew reduced crew costs, and the aircraft’s common pilot type rating has ensured greater crew scheduling flexibility and efficiency to carriers that had operated multiple aircraft types.
The Airbus commonality of flight deck controls is why many airlines prefer Airbus aircraft over Boeing. Boeing adopted this technology with the 757 and 767. Cockpit commonality makes it easier for pilots to move across a full fam-ily of aircraft, saving time and money in training. In addition, a larger savings comes from eliminating the need for a completely separate group of reserve crews. Commercial airlines are particularly pleased with the use of fly-by-wire technolo-gies and the common cockpit systems in use throughout the Airbus aircraft. An analysis of crew costs and the relevant methodologies for calculating them is pro-vided in Chapter 6.
Depreciation and Leases
Two of the most important financial estimates that airline management teams must make are the aircraft depreciation rate and aircraft residual value assump-tions. Airlines review periodically whether the residual value attributed to their aircraft has been appropriately done. The tax system will generally stipulate the useful life of an aircraft and depreciation rate rather than leaving it to the imagina-tion of management for tax purposes. Depreciation and leases represent the capi-tal cost of aircraft ownership. A large part of an airline’s cost structure is aircraft depreciation. That amount will ultimately depend on what period of time the cost is spread over. Depreciation and leases proxy the financing and usage costs of aircraft ownership. Lease payments also represent significant expenditures, which can affect an airline’s free cash flow.
Airline financing is quite complicated, since companies have high financial and operational leverages. Since the Airline Deregulation Act of 1978, many major airlines have declared bankruptcy and have either ceased operation or reorganized under bankruptcy protection.15 The volatile demand, combined with increased fuel costs, and cost of capital and bankruptcies, led to anemic profit for the entire industry.16 While other industries generally have a significant advantage to owner-ship over leasing due to the tax shield offered by depreciation, the airline industry
15 U.S. Airline Bankruptcies and Service Cessations, Air Transport Association (ATA), 2011.16 Air Transport Association of America (ATA), Statement on the State of the Airline Industry,
Statement for the Record of the Sub-committee on Aviation, Transportation and Infrastructure Committee, U.S. House of Representatives, June 2004.
Sample
Cha
pter
Aircraft Efficiency: Operating and Financial Metrics 115
has typically experienced an extremely low corporate tax rate due to accumulated net operating losses (NOLs). NOLs can be utilized for up to 20 years after they are incurred, and, on average, the airline industry enjoys an effective tax rate of around 11.94%, whereas the corporate tax rate for similar-sized corporations is 35%.17
Depreciation policy varies from one airline to another. Airlines prefer to depreciate aircraft using different salvage value and depreciation lives because of their respective financial policies regarding the appropriate depreciation expense. For example, Thai Airways reduced its new aircraft depreciation rate from 20 years to 15 years.18
Maintenance Costs
Maintenance costs are defined as the costs of materials and labor that constitute routine and non-routine aircraft repair. Maintenance costs are measured, not maintenance expense, since maintenance costs contain accrued costs for periodic aircraft checks that will be expensed as a check is conducted. In general, there are two categories of aircraft maintenance costs. First, direct maintenance cost is the cost of materials, equipment, and workers directly related to maintenance as a whole. Second, indirect maintenance cost is the cost related more to the organiza-tion of an airline than to the design of the aircraft. In this section, maintenance cost is divided into the following general classes:
• Labor cost, usually one of the larger components of airframe mainte-nance cost, is comprised of inspection checks, removal, installation, and operational checks.
• Materials and parts, which include all consumable and non-consumable materials, component usage, and other material used in the aircraft maintenance process.
In 2009, the average direct maintenance cost per flight hour was $893, and the average direct maintenance cost per cycle was $2,091.19 The direct maintenance cost per flight hour varied according to the aircraft category, from an average of $682 per flight hour for narrow-body aircraft to $1,430 per flight hour for wide-body aircraft equipped with three or more engines and $1,204 per flight hour for wide-body aircraft equipped with two engines.
17 United States Department of the Treasury, Internal Revenue Service, 2011.18 Thai Airways Company Report, 2008.19 An exclusive benchmark analysis (FY2009 data) by IATA’s Maintenance Cost Task Force, 2010.
Sample
Cha
pter
116 Aircraft Finance
Soft Costs
Soft cost metrics capture airline management’s opportunity to select the right air-craft at the right time to support business objectives. Soft costs are defined as a catch all category. Soft costs capture aircraft insurance, navigation costs, and other miscellaneous operating costs:
Soft costs = Total operating costs − (Fuel + Maintenance + Crew + Depreciation and leases)
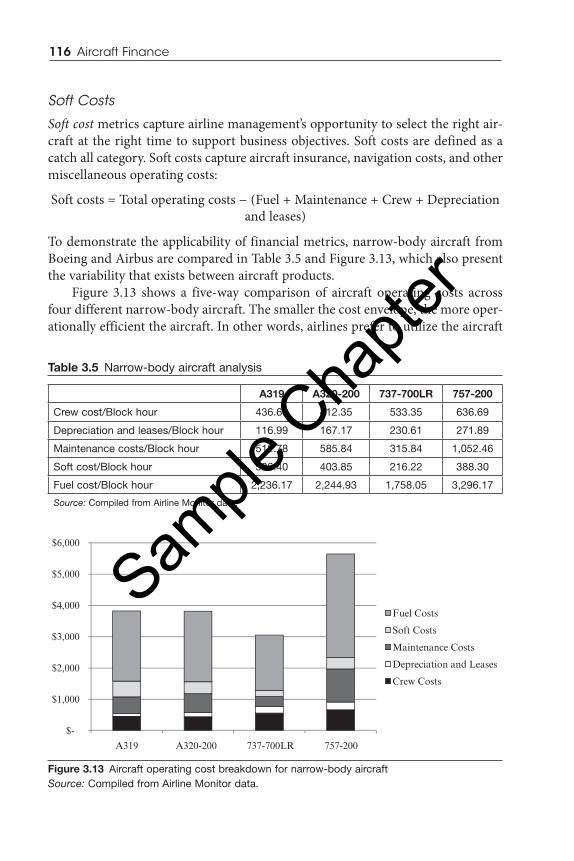
To demonstrate the applicability of financial metrics, narrow-body aircraft from Boeing and Airbus are compared in Table 3.5 and Figure 3.13, which also present the variability that exists between aircraft products.
Figure 3.13 shows a five-way comparison of aircraft operating costs across four different narrow-body aircraft. The smaller the cost envelope, the more oper-ationally efficient the aircraft. In other words, airlines prefer to utilize the aircraft
Table 3.5 Narrow-body aircraft analysis
A319 A320-200 737-700LR 757-200
Crew cost/Block hour 436.68 412.35 533.35 636.69
Depreciation and leases/Block hour 116.99 167.17 230.61 271.89
Maintenance costs/Block hour 512.78 585.84 315.84 1,052.46
Soft cost/Block hour 526.40 403.85 216.22 388.30
Fuel cost/Block hour 2,236.17 2,244.93 1,758.05 3,296.17
Source: Compiled from Airline Monitor data.
$-
$1,000
$2,000
$3,000
$4,000
$5,000
$6,000
A319 A320-200 737-700LR 757-200
Fuel Costs
Soft Costs
Maintenance Costs
Depreciation and Leases
Crew Costs
Figure 3.13 Aircraft operating cost breakdown for narrow-body aircraftSource: Compiled from Airline Monitor data.
Sample
Cha
pter

Aircraft Efficiency: Operating and Financial Metrics 117
with the smallest cost envelope. The disadvantages of the 757-200 are immediately apparent when compared to the 737-700LR and the Airbus A319 and A320. The 757-200 has the largest cost envelope of these narrow-body aircraft. In terms of fuel consumption, the 757-200 has the highest consumption by far, with $3,296.17 per block hour. The 737-700LR has half the cost of the 757-200 at $1,758.03 per block hour and the lowest among the four narrow-bodies, while also outperforming in terms of fuel efficiency on a block hour and ASM basis. The 757-200 underperforms in every category except soft costs. Its maintenance costs and crew costs are also significantly higher than the other narrow-body aircraft. However, the soft costs are lower than those of the A319 and A320, and the depreciation and leases costs are comparable. The trade-off for these lower costs of owning the 757-200 is the higher costs of operation. The cost envelope is higher overall than the other narrow-bodies, indicating that the 757-200 is more expensive to operate overall.
In contrast, the Boeing 737-700 presents the best cost profile. It is the most fuel-efficient aircraft among the four narrow-bodies shown, as well as the most inexpen-sive to maintain and lease. It is interesting to note that while Boeing aircraft appear to be more expensive to crew than Airbus aircraft, they are less expensive to insure (lower soft costs). This may be a function of Airbus’ higher degree of automation—crew training might be lower, but insurance costs and other soft costs are higher due to the greater degree of automated technology. In terms of total costs, the Boeing 737-700 dominates the profiles of the four aircraft shown.
The Airbus A320 and A319 present similar operating profiles to each other. The A319 is a shortened version of the A320. The A320 has seven more rows of seats than the A319. With the same fuel capacity and fewer passengers, the range with 124 passengers in a two-class configuration extends to 1,810 nm with shar-klets.20 They are both less expensive in terms of crewing, but more expensive in terms of soft costs. They also present a higher maintenance cost profile, indicat-ing that equipment upkeep is more expensive than the Boeing 737-800. This also could be a function of greater automation and the necessity for more extensive and expensive checks to ensure normal operation. The Airbus A320 and A319 are also less fuel efficient than the Boeing 737-700, since they have a higher fuel cost per block hour.
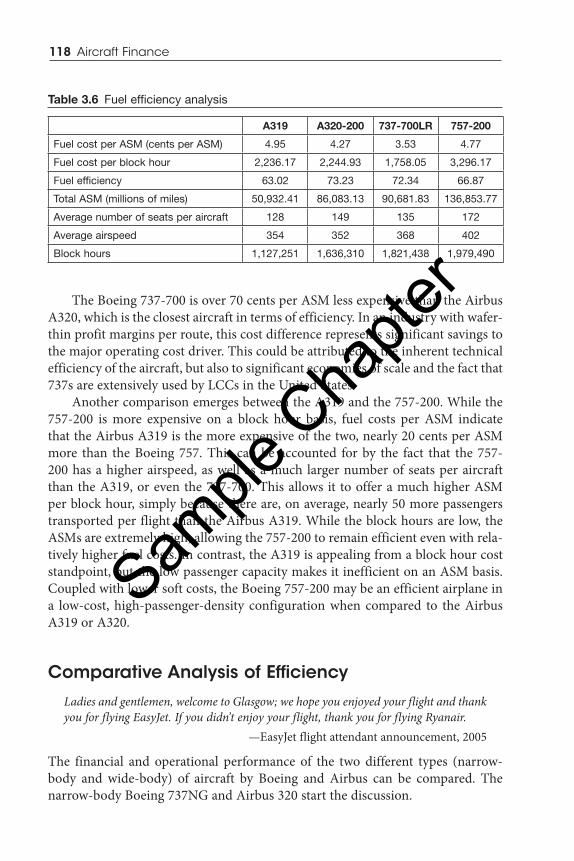
To build on the discussion of fuel efficiency as an operating ratio, additional analysis is warranted. Interestingly, all four aircraft have very similar depreciation and leasing expenses, indicating that they are all approximately in the same price range. Their vastly different operating cost profiles, however, point to significant differences in aircraft value. Fuel costs account for nearly 60% of the operating costs of an aircraft. Therefore, Table 3.6 presents a more detailed fuel efficiency analysis for each of the four narrow-body aircraft.
20 Meeting Demands, Flight International, August 30, 1995.
Sample
Cha
pter
118 Aircraft Finance
The Boeing 737-700 is over 70 cents per ASM less expensive than the Airbus A320, which is the closest aircraft in terms of efficiency. In an industry with wafer-thin profit margins per route, this cost difference represents significant savings to the major operating cost driver. This could be attributed to the inherent technical efficiency of the aircraft, but also to significant economies of scale and the fact that 737s are extensively used by LCCs in the United States.
Another comparison emerges between the A319 and the 757-200. While the 757-200 is more expensive on a block hour basis, fuel costs per ASM indicate that the Airbus A319 is the more expensive of the two, nearly 20 cents per ASM more than the Boeing 757. This can be accounted for by the fact that the 757-200 has a higher airspeed, as well as a much larger number of seats per aircraft than the A319, or even the 737-700. This allows it to offer a much higher ASM per block hour, simply because there are, on average, nearly 50 more passengers transported per flight than the Airbus A319. While the block hours are low, the ASMs are extremely high, allowing the 757-200 to remain efficient even with rela-tively higher fuel costs. In contrast, the A319 is appealing from a block hour cost standpoint, but the low passenger capacity makes it inefficient on an ASM basis. Coupled with lower soft costs, the Boeing 757-200 may be an efficient airplane in a low-cost, high-passenger-density configuration when compared to the Airbus A319 or A320.
Comparative Analysis of Efficiency
Ladies and gentlemen, welcome to Glasgow; we hope you enjoyed your flight and thank you for flying EasyJet. If you didn’t enjoy your flight, thank you for flying Ryanair.
—EasyJet flight attendant announcement, 2005
The financial and operational performance of the two different types (narrow-body and wide-body) of aircraft by Boeing and Airbus can be compared. The narrow-body Boeing 737NG and Airbus 320 start the discussion.
Table 3.6 Fuel efficiency analysis
A319 A320-200 737-700LR 757-200
Fuel cost per ASM (cents per ASM) 4.95 4.27 3.53 4.77
Fuel cost per block hour 2,236.17 2,244.93 1,758.05 3,296.17
Fuel efficiency 63.02 73.23 72.34 66.87
Total ASM (millions of miles) 50,932.41 86,083.13 90,681.83 136,853.77
Average number of seats per aircraft 128 149 135 172
Average airspeed 354 352 368 402
Block hours 1,127,251 1,636,310 1,821,438 1,979,490
Sample
Cha
pter
Aircraft Efficiency: Operating and Financial Metrics 119
Narrow-body: Boeing 737NG vs. Airbus A320The 737 series is the best-selling jet airliner in the history of the airline indus-try.21 There are on average 1,250 737 aircraft flying at any given time, with 24 departing or landing somewhere every minute, as of 2009. The Boeing 737-700, 737-800, and 737-900 compete directly with the Airbus A319, A320, and A321 in the narrow-body, short- to medium-haul commercial aircraft market. As of June 2011, a total of about 4,700 Airbus A320 family aircraft were delivered, of which 4,607 were in active service. These two families of aircraft are widely popular with LCCs. Southwest, Virgin Blue, and Ryanair use the 737NG while JetBlue, Virgin America, and AirAsia use the A320 family; EasyJet uses both. United, Delta, and American Airlines are legacy carriers that use the 737NG family. Of these, United and Delta also operate members of the A320 family. US Airways is the only U.S. legacy carrier that currently uses A320 aircraft but not any 737NG aircraft. Other users of the A320 family are Frontier and Spirit Airlines, both with over 25 A319s in their fleet.
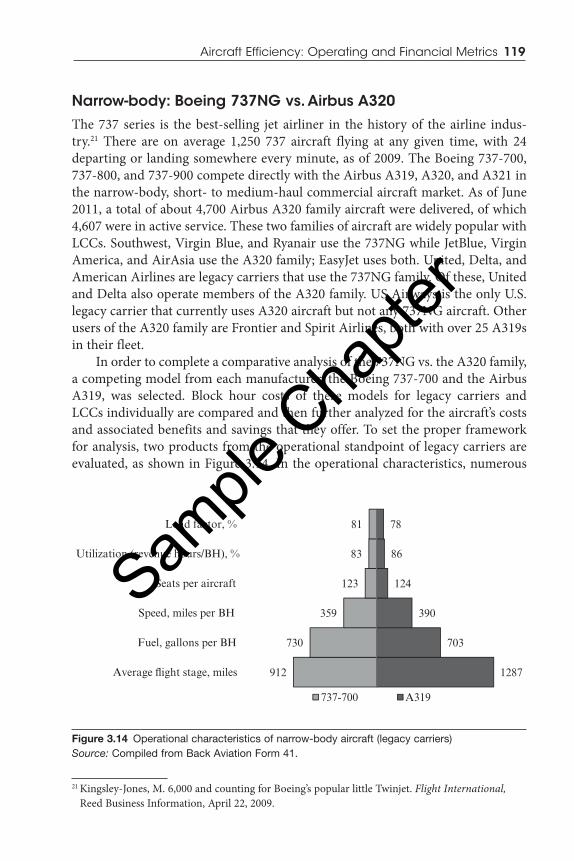
In order to complete a comparative analysis of the 737NG vs. the A320 family, a competing model from each manufacturer, the Boeing 737-700 and the Airbus A319, was selected. Block hour costs of these models for legacy carriers and LCCs individually are compared and then further analyzed for the aircraft’s costs and associated benefits and savings that they offer. To set the proper framework for analysis, two products from the operational standpoint of legacy carriers are evaluated, as shown in Figure 3.14. In the operational characteristics, numerous
1287
703
390
124
86
78
912
730
359
123
83
81
Average �ight stage, miles
Fuel, gallons per BH
Speed, miles per BH
Seats per aircraft
Utilization (revenue hours/BH), %
Load factor, %
737-700 A319
Figure 3.14 Operational characteristics of narrow-body aircraft (legacy carriers)Source: Compiled from Back Aviation Form 41.
21 Kingsley-Jones, M. 6,000 and counting for Boeing’s popular little Twinjet. Flight International, Reed Business Information, April 22, 2009.
Sample
Cha
pter

120 Aircraft Finance
similarities are shown in 737-700 and A319 operations with few significant dif-ferences. Both aircraft, with similar seat numbers and utilization per day, have significantly different average flight stage lengths. Legacy carriers that use the 737-700 compared to the A319 use it on a stage length that is 375 miles longer.
When examining these two aircraft from an operational and financial stand-point, it is important to realize that costs are dependent on the airline. Some costs are relatively invariant to airline operations; fuel burn, for instance, is invariant although it is indirectly affected by stage length and flight procedures. However, other costs, including crew costs, depreciation and leases, and soft costs, are all highly dependent on an individual airline’s operating characteristics.
Figure 3.15 highlights the advantages that the Boeing 737-700 offers to legacy car-riers in comparison to its competitor, the Airbus A319. The 737-700 presents cost sav-ings on all of the measured metrics. One of the most significant cost differences is in the flight crew costs of each aircraft. The 737-700 flight crew costs a significant $160.98 less per block hour than the A319. In terms of the biggest cost factor to airlines, fuel, the 737-700 also has the upper hand for legacy carriers by costing approximately $65 less per block hour. This number quickly translates into real savings when the fleet sizes and numbers of hours legacy carriers fly are taken into account.
The effect of airlines’ operational characteristics must be taken into account when interpreting this data. For example, if Southwest Airlines’ financial data was included in Figure 3.15, the fuel cost per block hour for the 737-700 would decrease from $2,241 to $1,758. In other words, the highly efficient operating characteristics of Southwest Airlines lower the overall fuel costs for the 737-700, but other carriers actually experience a much higher fuel cost.
$522.12
$2,306.46
$228.77
$594.00
$189.61
$266.66
$361.14
$2,241.39
$24.77
$528.91
$89.24
$214.67
Flight Crew Cost
Fuel Cost
Other Costs
Total Maintenance Costs
Depreciation
Aircraft Rent
737-700
A319
Figure 3.15 Block hour cost comparison (legacy carriers)Source: Compiled from Back Aviation Form 41 data.
Sample
Cha
pter
Aircraft Efficiency: Operating and Financial Metrics 121
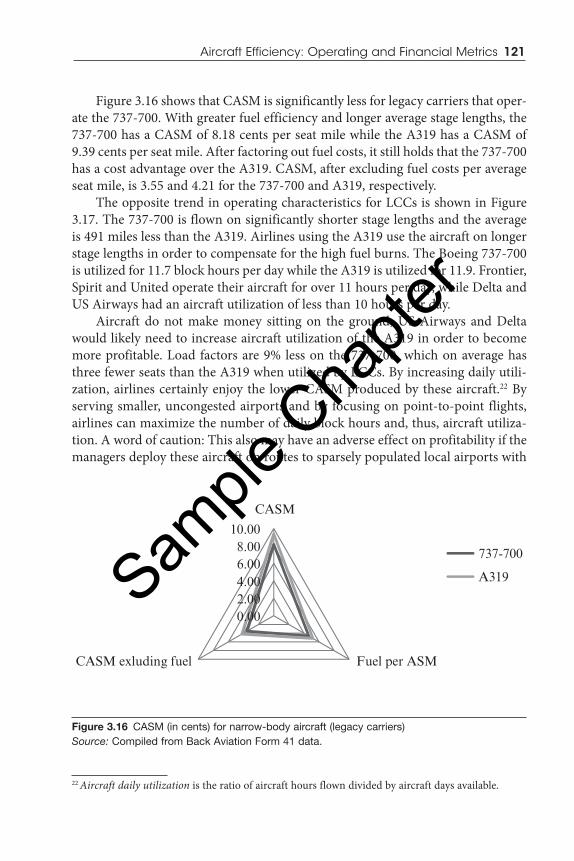
Figure 3.16 shows that CASM is significantly less for legacy carriers that oper-ate the 737-700. With greater fuel efficiency and longer average stage lengths, the 737-700 has a CASM of 8.18 cents per seat mile while the A319 has a CASM of 9.39 cents per seat mile. After factoring out fuel costs, it still holds that the 737-700 has a cost advantage over the A319. CASM, after excluding fuel costs per average seat mile, is 3.55 and 4.21 for the 737-700 and A319, respectively.
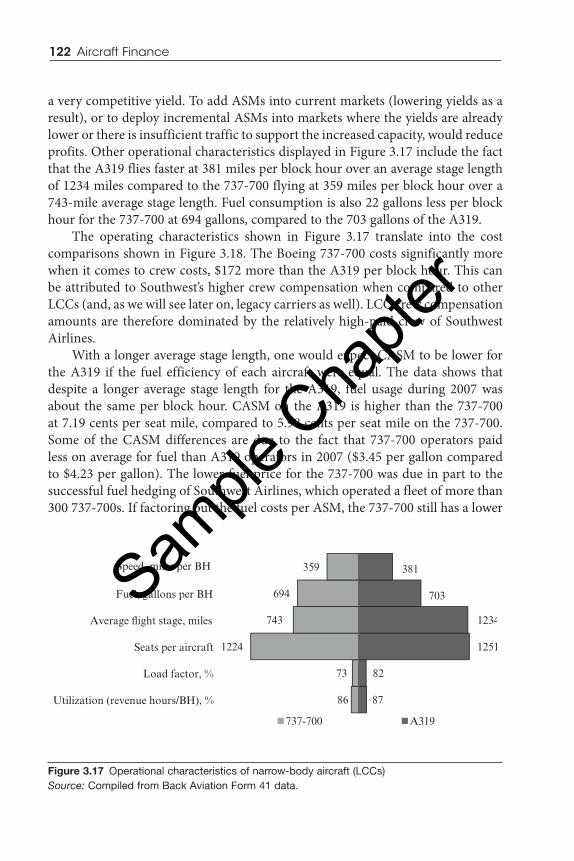
The opposite trend in operating characteristics for LCCs is shown in Figure 3.17. The 737-700 is flown on significantly shorter stage lengths and the average is 491 miles less than the A319. Airlines using the A319 use the aircraft on longer stage lengths in order to compensate for the high fuel burns. The Boeing 737-700 is utilized for 11.7 block hours per day while the A319 is utilized for 11.9. Frontier, Spirit and United operate their aircraft for over 11 hours per day, while Delta and US Airways had an aircraft utilization of less than 10 hours per day.
Aircraft do not make money sitting on the ground; US Airways and Delta would likely need to increase aircraft utilization of the A319 in order to become more profitable. Load factors are 9% less on the 737-700, which on average has three fewer seats than the A319 when utilized by LCCs. By increasing daily utili-zation, airlines certainly enjoy the lower CASM produced by these aircraft.22 By serving smaller, uncongested airports and by focusing on point-to-point flights, airlines can maximize the number of daily block hours and, thus, aircraft utiliza-tion. A word of caution: This also may have an adverse effect on profitability if the managers deploy these aircraft on routes to sparsely populated local airports with
22 Aircraft daily utilization is the ratio of aircraft hours flown divided by aircraft days available.
0.002.004.006.008.00
10.00
CASM
Fuel per ASMCASM exluding fuel
737-700
A319
Figure 3.16 CASM (in cents) for narrow-body aircraft (legacy carriers)Source: Compiled from Back Aviation Form 41 data.
Sample
Cha
pter
122 Aircraft Finance
a very competitive yield. To add ASMs into current markets (lowering yields as a result), or to deploy incremental ASMs into markets where the yields are already lower or there is insufficient traffic to support the increased capacity, would reduce profits. Other operational characteristics displayed in Figure 3.17 include the fact that the A319 flies faster at 381 miles per block hour over an average stage length of 1234 miles compared to the 737-700 flying at 359 miles per block hour over a 743-mile average stage length. Fuel consumption is also 22 gallons less per block hour for the 737-700 at 694 gallons, compared to the 703 gallons of the A319.
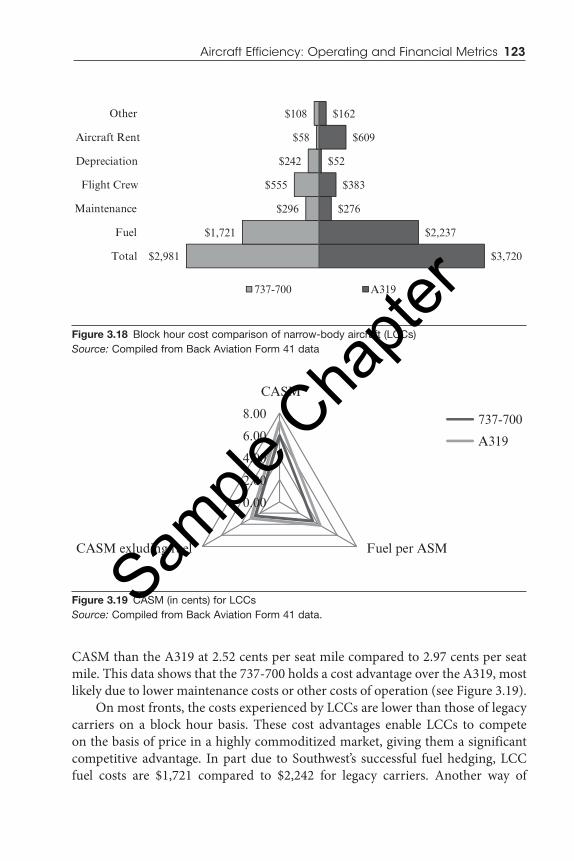
The operating characteristics shown in Figure 3.17 translate into the cost comparisons shown in Figure 3.18. The Boeing 737-700 costs significantly more when it comes to crew costs, $172 more than the A319 per block hour. This can be attributed to Southwest’s higher crew compensation when compared to other LCCs (and, as we will see later on, legacy carriers as well). LCC crew compensation amounts are therefore dominated by the relatively high-paid crew of Southwest Airlines.
With a longer average stage length, one would expect CASM to be lower for the A319 if the fuel efficiency of each aircraft were equal. The data shows that despite a longer average stage length for the A319, fuel usage during 2007 was about the same per block hour. CASM on the A319 is higher than the 737-700 at 7.19 cents per seat mile, compared to 5.98 cents per seat mile on the 737-700. Some of the CASM differences are due to the fact that 737-700 operators paid less on average for fuel than A319 operators in 2007 ($3.45 per gallon compared to $4.23 per gallon). The lower fuel price for the 737-700 was due in part to the successful fuel hedging of Southwest Airlines, which operated a fleet of more than 300 737-700s. If factoring out the fuel costs per ASM, the 737-700 still has a lower
Utilization (revenue hours/BH), %
Load factor, %
Seats per aircraft
Average �ight stage, miles
Fuel, gallons per BH
Speed, miles per BH
86
73
1224
743
694
359
87
82
1251
1234
703
381
A319737-700
Figure 3.17 Operational characteristics of narrow-body aircraft (LCCs)Source: Compiled from Back Aviation Form 41 data.
Sample
Cha
pter
Aircraft Efficiency: Operating and Financial Metrics 123
CASM than the A319 at 2.52 cents per seat mile compared to 2.97 cents per seat mile. This data shows that the 737-700 holds a cost advantage over the A319, most likely due to lower maintenance costs or other costs of operation (see Figure 3.19).
On most fronts, the costs experienced by LCCs are lower than those of legacy carriers on a block hour basis. These cost advantages enable LCCs to compete on the basis of price in a highly commoditized market, giving them a significant competitive advantage. In part due to Southwest’s successful fuel hedging, LCC fuel costs are $1,721 compared to $2,242 for legacy carriers. Another way of
$3,720
$2,237
$276
$383
$52
$609
$162
$2,981
$1,721
$296
$555
$242
$58
$108
Total
Fuel
Maintenance
Flight Crew
Depreciation
Aircraft Rent
Other
737-700 A319
Figure 3.18 Block hour cost comparison of narrow-body aircraft (LCCs)Source: Compiled from Back Aviation Form 41 data
0.00
2.00
4.00
6.00
8.00
CASM
Fuel per ASMCASM exluding fuel
737-700
A319
Figure 3.19 CASM (in cents) for LCCsSource: Compiled from Back Aviation Form 41 data.
Sample
Cha
pter
124 Aircraft Finance
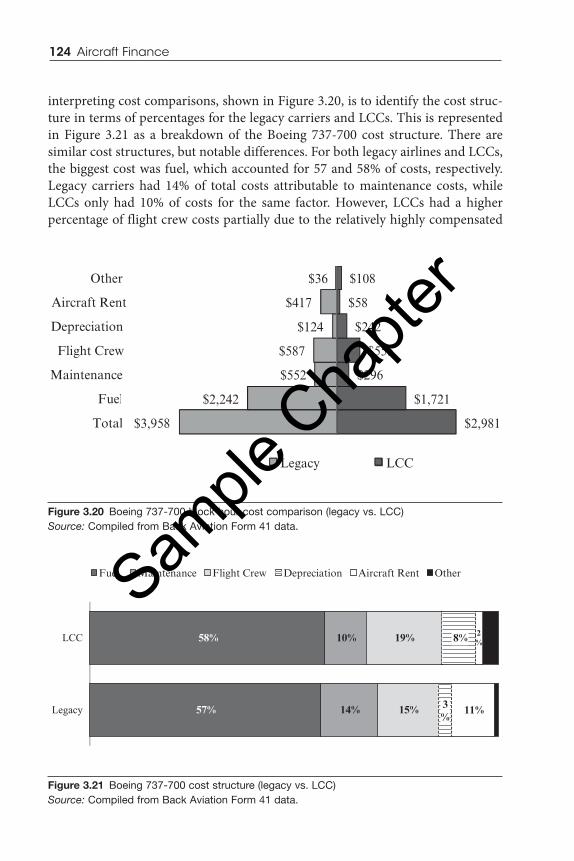
interpreting cost comparisons, shown in Figure 3.20, is to identify the cost struc-ture in terms of percentages for the legacy carriers and LCCs. This is represented in Figure 3.21 as a breakdown of the Boeing 737-700 cost structure. There are similar cost structures, but notable differences. For both legacy airlines and LCCs, the biggest cost was fuel, which accounted for 57 and 58% of costs, respectively. Legacy carriers had 14% of total costs attributable to maintenance costs, while LCCs only had 10% of costs for the same factor. However, LCCs had a higher percentage of flight crew costs partially due to the relatively highly compensated
$2,981
$1,721
$296
$555
$242
$58
$108
$3,958
$2,242
$552
$587
$124
$417
$36
Total
Fuel
Maintenance
Flight Crew
Depreciation
Aircraft Rent
Other
Legacy LCC
Figure 3.20 Boeing 737-700 block hour cost comparison (legacy vs. LCC)Source: Compiled from Back Aviation Form 41 data.
14%
10%
15%
19%
Legacy
LCC
57%
58% 2%
11%
Fuel Maintenance Flight Crew Depreciation Aircraft Rent Other
8%
3%
Figure 3.21 Boeing 737-700 cost structure (legacy vs. LCC)Source: Compiled from Back Aviation Form 41 data.
Sample
Cha
pter
Aircraft Efficiency: Operating and Financial Metrics 125
Southwest Airlines flight crews. A higher percentage of costs (8% compared to 3%) for LCCs in terms of aircraft depreciation was also determined. Legacy car-riers faced a significantly higher percentage of aircraft rent costs. This differential reflected the lease vs. buy decision, which was made by carriers that chose to work with operating lessors to rent aircraft vs. owning, and subsequently depreciating, their planes.
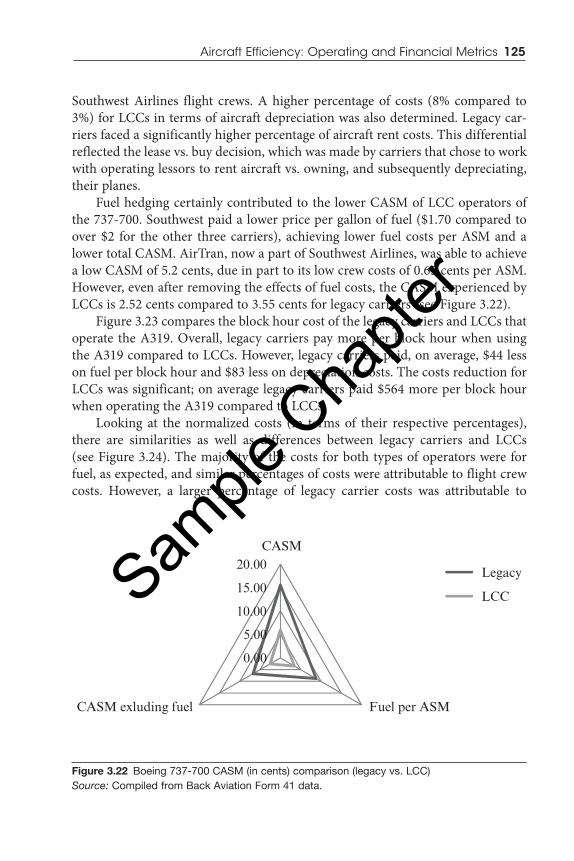
Fuel hedging certainly contributed to the lower CASM of LCC operators of the 737-700. Southwest paid a lower price per gallon of fuel ($1.70 compared to over $2 for the other three carriers), achieving lower fuel costs per ASM and a lower total CASM. AirTran, now a part of Southwest Airlines, was able to achieve a low CASM of 5.2 cents, due in part to its low crew costs of 0.65 cents per ASM. However, even after removing the effects of fuel costs, the CASM experienced by LCCs is 2.52 cents compared to 3.55 cents for legacy carriers (see Figure 3.22).
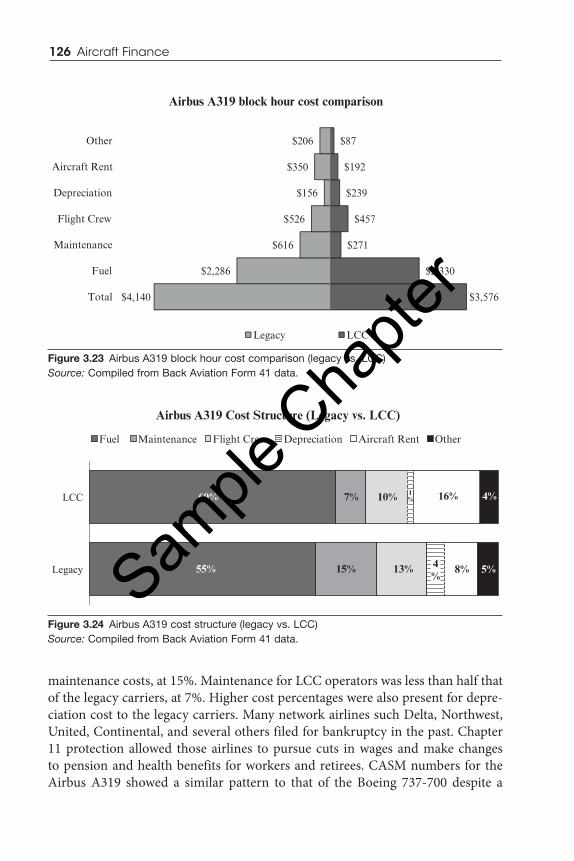
Figure 3.23 compares the block hour cost of the legacy carriers and LCCs that operate the A319. Overall, legacy carriers pay more per block hour when using the A319 compared to LCCs. However, legacy carriers paid, on average, $44 less on fuel per block hour and $83 less on depreciation costs. The costs reduction for LCCs was significant; on average legacy carriers paid $564 more per block hour when operating the A319 compared to LCCs.
Looking at the normalized costs (in terms of their respective percentages), there are similarities as well as differences between legacy carriers and LCCs (see Figure 3.24). The majority of the costs for both types of operators were for fuel, as expected, and similar percentages of costs were attributable to flight crew costs. However, a larger percentage of legacy carrier costs was attributable to
0.00
5.00
10.00
15.00
20.00CASM
Fuel per ASMCASM exluding fuel
Legacy
LCC
Figure 3.22 Boeing 737-700 CASM (in cents) comparison (legacy vs. LCC)Source: Compiled from Back Aviation Form 41 data.
Sample
Cha
pter
126 Aircraft Finance
maintenance costs, at 15%. Maintenance for LCC operators was less than half that of the legacy carriers, at 7%. Higher cost percentages were also present for depre-ciation cost to the legacy carriers. Many network airlines such Delta, Northwest, United, Continental, and several others filed for bankruptcy in the past. Chapter 11 protection allowed those airlines to pursue cuts in wages and make changes to pension and health benefits for workers and retirees. CASM numbers for the Airbus A319 showed a similar pattern to that of the Boeing 737-700 despite a
$3,576
$2,330
$271
$457
$239
$192
$87
$4,140
$2,286
$616
$526
$156
$350
$206
Total
Fuel
Maintenance
Flight Crew
Depreciation
Aircraft Rent
Other
Airbus A319 block hour cost comparison
Legacy LCC
Figure 3.23 Airbus A319 block hour cost comparison (legacy vs. LCC)Source: Compiled from Back Aviation Form 41 data.
Airbus A319 Cost Structure (Legacy vs. LCC)
15%
7%
13%
10%
Legacy
LCC
55%
60%
8%
Fuel Maintenance Flight Crew Depreciation Aircraft Rent Other
16% 4%
4%
1%
5%
Figure 3.24 Airbus A319 cost structure (legacy vs. LCC)Source: Compiled from Back Aviation Form 41 data.
Sample
Cha
pter
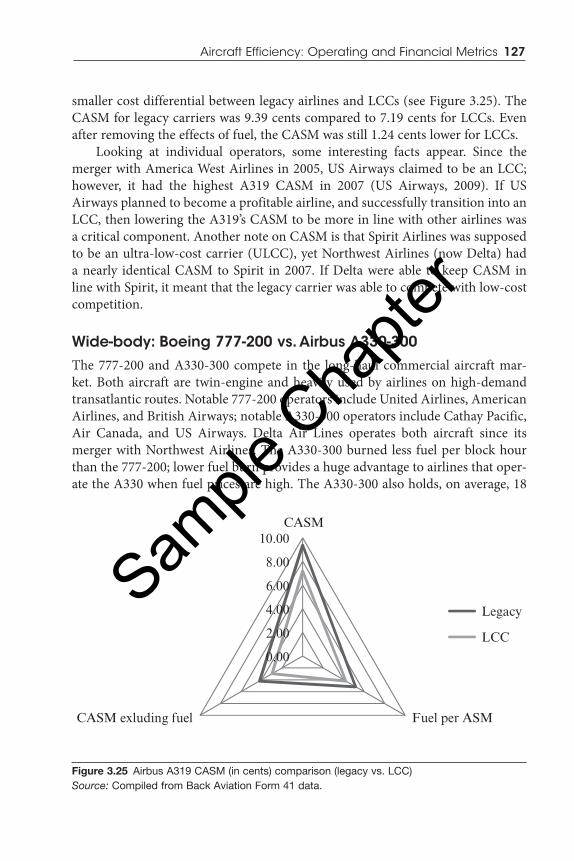
Aircraft Efficiency: Operating and Financial Metrics 127
smaller cost differential between legacy airlines and LCCs (see Figure 3.25). The CASM for legacy carriers was 9.39 cents compared to 7.19 cents for LCCs. Even after removing the effects of fuel, the CASM was still 1.24 cents lower for LCCs.
Looking at individual operators, some interesting facts appear. Since the merger with America West Airlines in 2005, US Airways claimed to be an LCC; however, it had the highest A319 CASM in 2007 (US Airways, 2009). If US Airways planned to become a profitable airline, and successfully transition into an LCC, then lowering the A319’s CASM to be more in line with other airlines was a critical component. Another note on CASM is that Spirit Airlines was supposed to be an ultra-low-cost carrier (ULCC), yet Northwest Airlines (now Delta) had a nearly identical CASM to Spirit in 2007. If Delta were able to keep CASM in line with Spirit, it meant that the legacy carrier was able to compete with low-cost competition.
Wide-body: Boeing 777-200 vs. Airbus A330-300The 777-200 and A330-300 compete in the long-haul commercial aircraft mar-ket. Both aircraft are twin-engine and heavily used by airlines on high-demand transatlantic routes. Notable 777-200 operators include United Airlines, American Airlines, and British Airways; notable A330-300 operators include Cathay Pacific, Air Canada, and US Airways. Delta Air Lines operates both aircraft since its merger with Northwest Airlines. The A330-300 burned less fuel per block hour than the 777-200; lower fuel burn provides a huge advantage to airlines that oper-ate the A330 when fuel prices are high. The A330-300 also holds, on average, 18
0.00
2.00
4.00
6.00
8.00
10.00CASM
Fuel per ASMCASM exluding fuel
Legacy
LCC
Figure 3.25 Airbus A319 CASM (in cents) comparison (legacy vs. LCC)Source: Compiled from Back Aviation Form 41 data.
Sample
Cha
pter
128 Aircraft Finance
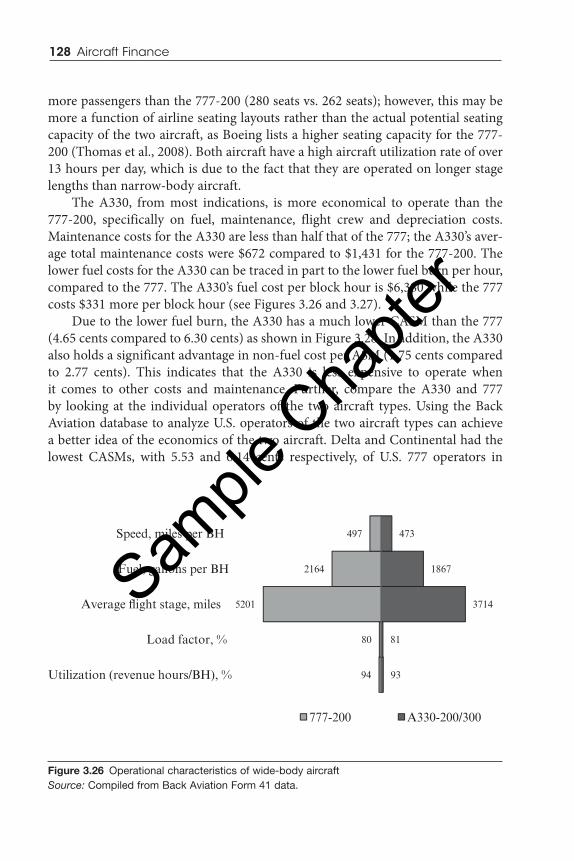
more passengers than the 777-200 (280 seats vs. 262 seats); however, this may be more a function of airline seating layouts rather than the actual potential seating capacity of the two aircraft, as Boeing lists a higher seating capacity for the 777-200 (Thomas et al., 2008). Both aircraft have a high aircraft utilization rate of over 13 hours per day, which is due to the fact that they are operated on longer stage lengths than narrow-body aircraft.
The A330, from most indications, is more economical to operate than the 777-200, specifically on fuel, maintenance, flight crew and depreciation costs. Maintenance costs for the A330 are less than half that of the 777; the A330’s aver-age total maintenance costs were $672 compared to $1,431 for the 777-200. The lower fuel costs for the A330 can be traced in part to the lower fuel burn per hour, compared to the 777. The A330’s fuel cost per block hour is $6,380 while the 777 costs $331 more per block hour (see Figures 3.26 and 3.27).
Due to the lower fuel burn, the A330 has a much lower CASM than the 777 (4.65 cents compared to 6.30 cents) as shown in Figure 3.28. In addition, the A330 also holds a significant advantage in non-fuel cost per ASM (1.75 cents compared to 2.77 cents). This indicates that the A330 is less expensive to operate when it comes to other costs and maintenance. Further, compare the A330 and 777 by looking at the individual operators of the two aircraft types. Using the Back Aviation database to analyze U.S. operators of the two aircraft types can achieve a better idea of the economics of the two aircraft. Delta and Continental had the lowest CASMs, with 5.53 and 6.14 cents respectively, of U.S. 777 operators in
93
81
3714
1867
473
94
80
5201
2164
497
Utilization (revenue hours/BH), %
Load factor, %
Average �ight stage, miles
Fuel, gallons per BH
Speed, miles per BH
777-200 A330-200/300
Figure 3.26 Operational characteristics of wide-body aircraftSource: Compiled from Back Aviation Form 41 data.
Sample
Cha
pter

Aircraft Efficiency: Operating and Financial Metrics 129
2007. This may go back to the aircraft utilization statistic; an aircraft that is being utilized more is spreading its costs out over a larger number of available seat miles.
One interesting point to note is how few A330-300s are in service with U.S. airlines. Despite having been in service for fifteen years around the world, there are only three operators of that aircraft type: Northwest Airlines (now Delta), US Airways, and Hawaiian Airlines. Delta operates 21 A330-300s and 11 A330-200s, while US Airways operates a meager 9; Hawaiian started operations of the type as a result of its refleeting program, replacing its Boeing 767-300ERs.
$9,019
$6,380
$672
$983
$468
$497
$18
$10,634
$6,711
$1,431
$1,122
$690
$224
$457
Total
Fuel
Total Maintenance
Flight Crew
Depreciation
Aircraft Rent
Other
777-200 A330-200/300
Figure 3.27 Block hour cost of wide-body aircraftSource: Compiled from Back Aviation Form 41 data.
0.002.004.006.008.00
10.00CASM
Fuel per ASMCASM exluding fuel
A330-200/300
777-200
Figure 3.28 CASM comparison (in cents) of wide-body jets (777-200 vs. A330-200/300)Source: Compiled from Back Aviation Form 41 data.Sam
ple C
hapte
r
130 Aircraft Finance
Another interesting note is the relationship between the aircraft’s average speed and fuel burn. Northwest Airlines steadily decreased the average speed of the A330 over the first five years of its operation (2003-2007), in order to achieve a lower fuel burn. Many airlines are implementing similar procedures to reduce the speed of aircraft while in flight in order to conserve fuel.23 Boeing uses a cost index in the flight computer to compute the best cruise speed for each flight given flight conditions, fuel, and block hour costs. The 777, on the other hand, has been popular with U.S. carriers since its introduction into service with United Airlines in 1995 (Eden, 2006). U.S. operators include American, Delta, and United, with United having the most 777-200s of all U.S. carriers.
The advantage of wide-body aircraft over narrow-body aircraft is in the CASM numbers. The A330 in particular has a very low CASM; the Northwest Airlines CASM was 4.49 cents in 2007, while the US Airways CASM was 5.15 cents for the aircraft type. This means that wide-body aircraft like the A330 and 777 aircraft compensate for a higher fuel burn by flying more people over longer distances, thereby reducing their CASM.
Regional Jets: CRJ100/200 vs. ERJ 145Bombardier and Embraer compete head to head for the regional jet market, offer-ing tremendously similar aircraft with similar capacities, ranges, and other oper-ating and financial specifications. To complete a regional jet analysis, competing models from each manufacturer were selected.
The CRJ program was launched in 1989, and with it, Bombardier became the pioneer of the 50-seat jet class aircraft. The CRJ100/200 family competes directly with the ERJ 145 for the niche 50-seat segment with unit costs of $24-$39 million. The CRJ200 provides 70 seats, the CRJ700 up to 78 seats, and the CRJ1000 more than 100 seats. As of July 2011, a total of 1,647 CRJ’s were delivered to the air-lines.24 The major operators of the CRJ100/200 include Comair, SkyWest Airlines, MexicanaLink,25 Pinnacle Airlines, and Atlantic Southeast Airlines.
The ERJ 135/145 family of commercial airplanes is composed of three variants with seating capacity varying from 37 to 50 seats. The ERJ 135 has 37 seats, the ERJ 140 has 44 seats, and the ERJ 145 has 50 seats. The Embraer ERJ 145 is a single-aisle, cabin-pressurized, twin-engine, regional jetliner with a price tag of $10-12 million. Operators of the ERJ 145 include ExpressJet,26 American Eagle, and Chautauqua27 Airlines. The
23 According to Airbus, the reduction from max. cruise to long-range cruise is 7%, which is the wid-est possible range.
24 Bombardier, 2011.25 MexicanaLink was a subsidiary of Mexicana Airlines and ceased operations on August 28, 2010.26 ExpressJet Airlines is an American regional airline based in the Greenspoint area of Houston, TX.27 Chautauqua is a subsidiary of Republic Airways Holdings based in Indianapolis, IN.
Sample
Cha
pter
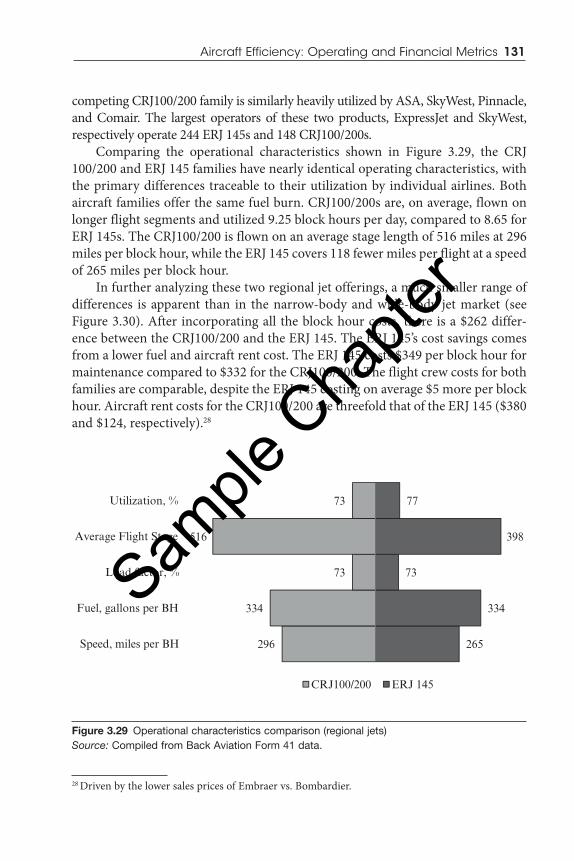
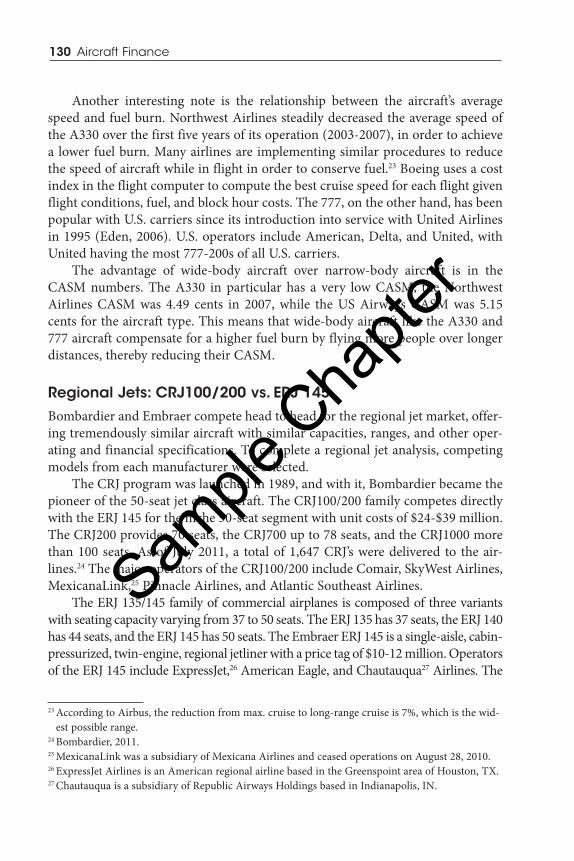
Aircraft Efficiency: Operating and Financial Metrics 131
competing CRJ100/200 family is similarly heavily utilized by ASA, SkyWest, Pinnacle, and Comair. The largest operators of these two products, ExpressJet and SkyWest, respectively operate 244 ERJ 145s and 148 CRJ100/200s.
Comparing the operational characteristics shown in Figure 3.29, the CRJ 100/200 and ERJ 145 families have nearly identical operating characteristics, with the primary differences traceable to their utilization by individual airlines. Both aircraft families offer the same fuel burn. CRJ100/200s are, on average, flown on longer flight segments and utilized 9.25 block hours per day, compared to 8.65 for ERJ 145s. The CRJ100/200 is flown on an average stage length of 516 miles at 296 miles per block hour, while the ERJ 145 covers 118 fewer miles per flight at a speed of 265 miles per block hour.
In further analyzing these two regional jet offerings, a much smaller range of differences is apparent than in the narrow-body and wide-body jet market (see Figure 3.30). After incorporating all the block hour costs, there is a $262 differ-ence between the CRJ100/200 and the ERJ 145. The ERJ 145’s cost savings comes from a lower fuel and aircraft rent cost. The ERJ 145 costs $349 per block hour for maintenance compared to $332 for the CRJ100/200. The flight crew costs for both families are comparable, despite the ERJ 145 costing on average $5 more per block hour. Aircraft rent costs for the CRJ100/200 are threefold that of the ERJ 145 ($380 and $124, respectively).28
265
334
73
398
77
296
334
73
516
73
Speed, miles per BH
Fuel, gallons per BH
Load factor, %
Average Flight Stage
Utilization, %
CRJ100/200 ERJ 145
Figure 3.29 Operational characteristics comparison (regional jets)Source: Compiled from Back Aviation Form 41 data.
28 Driven by the lower sales prices of Embraer vs. Bombardier.
Sample
Cha
pter
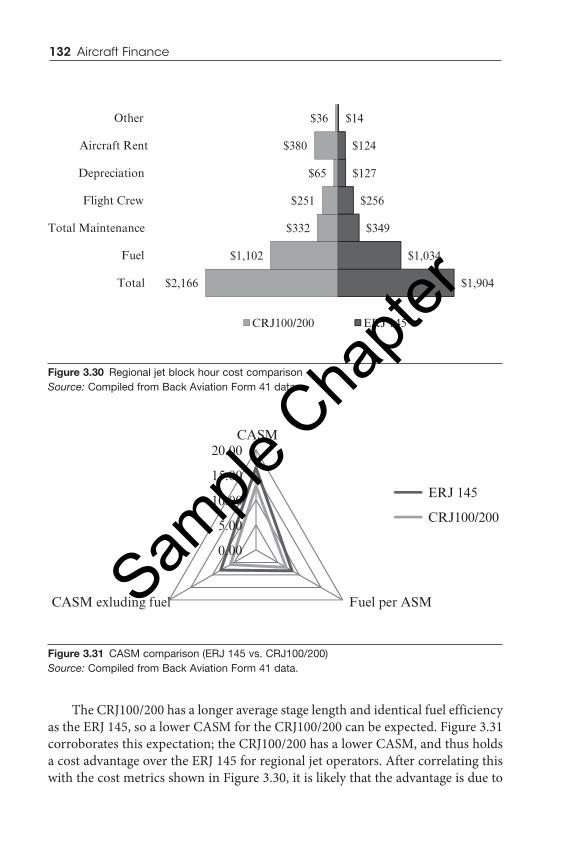
132 Aircraft Finance
The CRJ100/200 has a longer average stage length and identical fuel efficiency as the ERJ 145, so a lower CASM for the CRJ100/200 can be expected. Figure 3.31 corroborates this expectation; the CRJ100/200 has a lower CASM, and thus holds a cost advantage over the ERJ 145 for regional jet operators. After correlating this with the cost metrics shown in Figure 3.30, it is likely that the advantage is due to
0.00
5.00
10.00
15.00
20.00CASM
Fuel per ASMCASM exluding fuel
ERJ 145
CRJ100/200
$1,904
$1,034
$349
$256
$127
$124
$14
$2,166
$1,102
$332
$251
$65
$380
$36
Total
Fuel
Total Maintenance
Flight Crew
Depreciation
Aircraft Rent
Other
CRJ100/200 ERJ 145
Figure 3.30 Regional jet block hour cost comparisonSource: Compiled from Back Aviation Form 41 data.
Figure 3.31 CASM comparison (ERJ 145 vs. CRJ100/200)Source: Compiled from Back Aviation Form 41 data.
Sample
Cha
pter

Aircraft Efficiency: Operating and Financial Metrics 133
the lower maintenance costs and other operational efficiencies utilized by opera-tors of the CRJ100/200. The CRJ100/200 has a CASM of 12.42 cents, while the ERJ 145 has a CASM of 16.46 cents. After excluding the effects of fuel costs, the CRJ100/200 still has a lower CASM of 5.87 cents compared to 8.11 cents for the ERJ 145.
Summary
Aircraft efficiency can be examined from numerous perspectives: technical, operating, and financial. Technical efficiency is derived directly from an aircraft’s physical characteristics, over which the airline has relatively little control. This includes average airspeed, fuel burn, and available seats. Operating characteristics are those that an airline can influence during the course of normal operations. The most prominent among these are aircraft utilization and average stage length. Financial characteristics are the financial implications to an airline of an aircraft’s technical and operational characteristics, often expressed as fuel cost per block hour and fuel cost per available seat mile. Maintenance and depreciation charac-teristics are determined by the aircraft model and expressed in the form of main-tenance and depreciation costs. To illustrate these characteristics and efficiencies, competing narrow-body, wide-body, and regional jet aircraft models from major manufacturers can be analyzed by using the various operating, financial, and technical metrics.
References
Alaska Airlines. (August 28, 2008). Alaska Airlines completes transition to all-Boeing fleet. Retrieved from http://www.alaskasworld.com/Newsroom/ASNews/ASstories/AS_20080828_140339.asp.
Alaska Airlines. (2009). Route map. Retrieved from http://www.alaskaair.com/as/alaska/images/asqxroutemap.pdf .
American Airlines. (2008a). AMR Corporation reports second quarter 2008 loss of $284 million excluding special items, as record fuel prices drove $838 million in higher costs compared to a year ago. Retrieved from http://www .americanairlines.jp/content/jp/aboutUs_en/pr20080724.jhtml.
American Airlines. (2008b). 2008, 3rd quarter SEC filing. Retrieved from http://phx.corporate-ir.net/phoenix.zhtml?c=117098&p=irol-IRHome.
Bowers, P. (1989). Boeing aircraft since 1916. London: Putnam Aeronautical Books.
Sample
Cha
pter
134 Aircraft Finance
CH Aviation. (2009). Fleet lists. Retrieved from http://www.ch-aviation.ch/air-craft.php.
Delta Air Lines. (January 27, 2009). Delta Air Lines 2008 annual financial reports.Eden, P. E. (2006). Civil aircraft today: The world’s most successful commercial
aircraft. London: Summertime Publishing, Ltd.Snyder, B. (February 4, 2009). JetBlue pilots vote down union. Retrieved from
http://www.cbsnews.com/8301-505123_162-43640408/jetblue-pilots-vote-down-union/.
Thomas, G., et al. (2008). Plane simple truth: Clearing the air on aviation’s environmental impact. Perth, Australia: Aerospace Technical Publications International.
US Airways. (2009). US Airways chronology. Retrieved from http://www.usair-ways.com/awa/content/aboutus/pressroom/history/chronology.aspx.
Sample
Cha
pter