chapter one introduction 1.1...
TRANSCRIPT

1
CHAPTER ONE
INTRODUCTION
1.1 Introduction
Leeching or bloodletting has been long introduced since the ancient time as one
of method to cure several diseases believing that it could exonerate noxious substances
produced by these diseases. However it soon diminished around 20th
century in Europe
as antibacterial therapy takes place and soon becomes an unpopular until now. The
revived of leech therapy in modern medicine happens in 1970’s with limited application
in the usage of relieving venous congestion in microsurgeries. Up until now scientist
and medicine practitioner still making discoveries of this amazing ability of leech for
many more functions especially in therapeutic areas.
In Malaysia, Leech therapy is considered as alternative medication that believed
can cure or relieved some of the ailment that has been practiced since long time ago.
Therefore, the effect of body composition is one of the methods of assessment to
evaluate whether the therapy that has been practiced since their ancestor time is a
worthwhile tool for therapy in healing some said illness. Using impedance method for
body composition measurement can determine the constituent of body changes which
model as 2 important compartment that divides the body into fat mass and fat-free mass
(FFM). This measurement is normally used by nutritionist as this invasive method is
very suitable to determine the health of a person which directly affected by the
composition of the fat in the body that can be further subdivide into water, mineral and
protein constituents. The result could be used to measure the effectiveness of the leech
therapy treatment as the readings and changes are taken into consideration before and
after the treatment.

2
1.2. Research Problem and Problem Statement
1) The effectiveness of leech therapy used as medicinal treatment is not
quantitatively proven and thus need to be highlighted as the growing interest
towards the ability of leeching is widely explored.
2) Leech therapy need to be measure quantitatively using an engineering tool as
method of assessment of the effectiveness of the therapy.
1.3 Objectives
1) Measure and represent the data of the body composition of patient that undergo
leech therapy treatment
2) Analyse the result of body composition of the leech therapy patient using
statistical tool
1.4 Hypothesis
1) Leech therapy treatment will have some changes on body composition
2) Effectiveness of leech therapy treatment can be represented quantitatively.
1.5 Scope of the Study
Scope of this study is restricted to Malaysian patient that undergo the leech
therapy treatment and only immediate response of the treatment is measured.
1.6 Significance of the Study
Mere believe in the alternative medicine needs to be proven quantitatively so
that people can be convinced and not deceived by unsupported claims. As leech therapy
exist since long time ago, accreditation is necessary to assess the effectiveness of this
method.
3
CHAPTER TWO
LITERATURE REVIEW
2.0 Modern Medicine vs. Complementary and Alternative Medicine (CAM)
Modern medicine is view as a mainstream and conventional ways based on
scientific evidence while alternative medicine has been define in many terms like
holistic, traditional and mostly categorized as complementary and alternative medicine
(CAM). Treatment of diseases has been developed and modernized with a lot of new
tools, surgery and pills for either preventing or curing purposes. However, alternative
medicines is still being practice and recently have gain a lot of attention from all over
the world. It can be divided into diets and supplements, botanicals products,
unconventional agents, traditional medicine and energy healing (Cassieth et al., 2001).
If to compare both of these methods, modern medicine is still considered the main
method used for healing as the governments also in support of this kind of treatment as
it is based on scientific value and proven to save many life every day. However, CAM
is a minority but gaining its popularity day by day and it could be revive and used as
conventional medicine if scientific research can support the effectiveness of these
methods. Therefore, research such as changes in body composition to check the
effectiveness of the traditional medicine like leeching can contribute to the scientific
evidence CAM as a whole so that it could be accepted by the world community.
4
2.1. Modern medicine
2.1.1 Surgery
Surgery has been a mean of doctors in getting rid of or fixing out affected area
that has been diagnosed ‘ill’. From cosmetic surgery, teeth and transplantation or
removing any tumours has been common nowadays. This procedure has saved many
lives especially when it involves a vital organ like heart that has many possibilities for
getting weak or failed like due to multivessel disease suffered from the diabetic patients
(King, 2005). Bypass surgery or known as coronary artery bypass graft is normally
performed to reduce the risk of death from coronary artery diseases. At the same time,
injections and surgeries are inseparable combo a surgeon used as a tool in the operation.
Injections not only used as pain reliever it could also be used to inject certain serum or
protection agent to human body.
2.1.2 Pill/ tablets/ capsules
Pills, tablets or capsules that contain drugs to prevent or cure diseases are most
necessary thing that a doctor will prescribed to its patient. Thus, a lot of research on
drugs that can act on certain functions of our body has been actively pursued to treat
various different of illness. The modern practitioner believed that drug must be assesses
in the patient level. A report by WHO stated that drug utilization needs to have answer
to some assessment questions like why, who the prescriber and person been prescribed
also whether the patient medicine intake is in order and what are benefits and risk of the
drugs being used (WHO, 2003). In addition, these are all important since a strict
qualification by the food and drug administration always ensure that the drug used
comply with some basic rule for it to be used in public.

5
2.1.3 Medicine tools
Modern medicine is also in another level with the engineered equipment and
tools to assist the physician/ therapist and doctors in handling and diagnosing diseases.
Application of ultrasound, nuclear magnetic resonance or x-ray in imaging system
brings a great advancement to the modern medicine as a whole. These tools continue to
flourish along with the modern medicine as a lot of potential been put aside for the
scope of imaging in medicine. Besides that, tools like lasers not just benefit the
physicist but give advantage in medicine world with the new ways of making surgery
with lasers. Three basic laser principles that have been used in developing tools for
medicinal purpose are photochemical effects, absorption which converted into heat and
non-linear effect that can remove material fragment without heating the surrounding
tissue (Senz and Muller, 1989). These are already applied in recanalization of arterial
blood vessel, fragmentation of kidneys, bladder, lasik surgery and many more.
2.2 CAM
2.2.1 Diets and supplements
Some of the dangerous illness like cancer can actually be cure not just by the
means of conventional medicine. Therefore, there are some theories in healing the
cancer by using diet and eating supplements that is considered a natural way to fight
cancer. This is because some foods contain a lot of nutrients that can boost the immune
system. By eating the correct foods with a strict diet a person is believed to be able to
fight the non-rapid cancer tissue by slowing the progression of cancer and strengthen
the patient’s body (Miller et al., 2000). Moerman diet therapy is popular in Netherlands
with 2 important parts where the main diet involves a lot of organic product and also the
supplement foods. There are eight key nutrients in this diets namely Vitamin A, B
complex, C, E, citric acid, iodine, iron and sulphur (Kehr, 2011). This non-toxic method
6
receives a lot of attention as it can also be applied to healthy person to keep fit and
prevent cancer in a better way. Other types of diets available are Houtsmuller diet,
Macrobiotic diet, Gerson diet and a lot more.
2.2.2 Botanicals products
Besides diet and supplements, botanical products like herbs have been practice
since long time before especially Chinese herbal medicine products. Sometimes, old
generation will take the herbal medicine as a daily dose as raw or processed herbs with
variety mixture of ingredients that believed can bring good health and youth to them.
Malay herbs like kacip Fatimah, tongkat ali and hempedu bumi has even revolutionized
as a commercial product so that it can be find easily (Aziz et al., 2005). Chinese
traditional herbs also has been popular not in Asia but in western country and a lot of
research on natural products from these herbs is made for cancer therapy treatment.
Molecular target for the treatment are mostly signal transduction protein like kinases
which able to control the malignant processes in cancer cells (Efferth et al., 2005).
2.2.3 Unconventional agents
Some of the alternative medicine falls under the category of unconventional
agents such as shark cartilage, Ozone therapy, Hasumi vaccine, Di Bella therapy and
more of new method that is unconventional. Shark cartilage has been an interest since
research of glycoproteins that can extend the life in leukemic mice where extracted from
the hammerhead sharks (Petit G.R. and Ode R.H., 1977). Moreover, there is also study
done that shows that intraocular implantation of shark cartilage pallets can repressed
tumour (Gawler I., 1984). Besides that, ozone therapy is more popular in Malaysia
where the treatment could be used to cure external wound and even in dentistry. Since
ozone has various effects such as antimicrobial, analgesic, immune stimulating and a lot

7
more benefits, this treatment has a variety of way to be used as cure (Seidler et al.,
2008). However, some precautious actions need to be taken so that any complications
should be avoided.
2.2.4 Traditional medicine
Traditional medicine is one of the famous methods in CAM as it has been
practiced since ancient time and still has a demand from one generation to another.
Some of the famous traditional medicines used are Acupuncture, Hirudotherapy,
Ayurveda, Qi gong and others. Acupuncture works through the theory of healing the
“energy” called “Qi” inside the body via a network of pathways called “Meridian”. The
365 acupuncture points are assessed through the 14 primary meridians which
correspond to 12 different organ systems in our body. The mechanism is vague but
some explaining that placing needles in the acupuncture points will stimulates a signal
in the connective tissue. This signal will activate a biomechanical or biochemical
reaction that helps in healing of body (Povolny, 2008). Besides that, hirudotherapy or
leeching is a famous method in bloodletting and will be elaborate more in the next topic.
Hirudotherapy is one of the ways in balancing back the biological humour according to
the Ayurveda treatment in which there are three humours in the Indian traditional
medicine referred as vata, pitta and kapha.
2.2.5 Energy healing
The energy healing is another types of alternative medicine that could cure
illness. Some of the examples are homeopathy, bioresonance therapy, teletherapy, urine
therapy a much more methods. Homeopathy for example has been introduced since 200
years ago by a German physician by using the “Principle of Similar”. The principle
works by giving out medicine with matching drug symptom to the symptom in the

8
patient in the minimum dosage (Jonas et al., 2003). Bioresonance therapy is another
types of therapy that has been invented in Germany using an electromagnetic concept.
This therapy is believed to be able to stimulate a change of bioresonance in cell so that
the cells could be healthy again after affected by changes carried by the disease.
Therefore, the good energy is once restored and this claim is used for other types of
energy healing agent too.
2.3 Leeching/ hirudotherapy in ancient time
Leeching has been an old remedy since 1500 BC where it is found in the
painting in an Egyptian painting displaying the usage of leech as medicine. During the
Roman Era, leech has been promoted because they believed that bloodletting will clear
their bodies from the harmful substances produce by diseases. This faith of them is
performed so that they can restore the four humour of human body namely blood,
phlegm, yellow bile and black bile for proper balance (Munshi et al., 2008). Then, it
becomes extremely popular during the 18th
and 19th
century where indication of
leeching is used in acute laryngitis, nephritis, subacute ovaritis, epitaxis, ophathalmia
and brain congestion (Adams, 1988). Some prefer using leech than cupping as they can
be used in the delicate areas like eyes, gums, breast and testicles. Later it becomes less
popular as new modern medicine emerge until late 19th
and early 20th
century where
some scientific research has found some usefulness of leech. For example, Haycraft in
1880 discovered the antithrombotic properties of leech saliva and Jacoby in 1904 has
found the potential anticoagulant factor named Hirudin (Fields, 1991). This is expanded
to the usage of leech as hirudotherapy in plastic, reconstructive and trauma surgery.
Furthermore, nowadays leech is still on research to be used in many medicinal
applications as it has high potential in helping to cure variety of diseases.

9
2.3.1 Leeches
For about 650 species of leeches, only some are used in the therapies like
Hirudinaria medicinalis, Hirudinaria asiatica and Hirudinaria manellensis. Leech
normally can be found on the fresh water and feed on decaying plant material. Leech is
one of the animals under the category of hermaphroditic which has 2 reproduction
organs both male and female. However, leech requires another leech to reproduce and
lay egg in cocoons (Mory et al., 2000).
The leech can be categorized as annelids which looks like rings or segmented
body same as the ringworms or earthworms. The medicinal leech or scientifically called
as Hirudo medicinalis is quite special in which it can cause the deepest bite and eruption
of blood after treatment for a longer time than others (Irish et al., 2000). Being a Hirudo
medicinalis, this type of leech can expand themselves three times more than its resting
length. There are about five segments for each of the 102 annuli in this leech which has
a posterior sucker triradiate with three jaws to bite and smaller anterior sucker for
feeding (Valauri, 1991).
Figure 2.1: Leech
(Source: http://www.digitalmediatree.com/library/image/88/leech.jpg)
[Viewed : 12 September 2011]

10
Based on the picture, leech will use the jaw to bite and these jaws are connected
to the pharynx, esophagus and crop. Crop is where it is literally said as the leech
stomach that can be expanded during the feeding. The blood is store inside the crop and
can be maintain in fluid state inside their bodies. The crop is connected to gizzard that
finally connected to the intestenum and ends at the posterior sucker. The medicinal
leech is used for therapy as the therapeutic effect can be obtained from the continued
bleeding after the leech is removed. The amount of blood from the bloodletting process
is approximately 5-12 ml and the bleeding from patient shows a good sign where this
happen due to anticoagulant properties from the leech salivary gland secretion
(Engemann and Hegner, 1981). Some animals are actively synthesizing the salivary
anticoagulant to secure their nutritional requirements of the body which includes
leeches (Ribeiro and Garcia, 1981). Ribeiro, 1981 also state that the salivary active
compound could prevent blood finding or blood feeding in some animals.
The way the leech feeds is mostly stimulated by mammalian range temperature
and the content of sodium and arginine in blood (Lent, 1986). In general leeches do not
just feed on human blood. Some are actually able to consume small invertebrates and
some will suck blood using their strong attaching sucker to the host. They have some
preferential in blood from certain species and considered particular in feeding pattern.
Since not all leeches have jaws, some can secrete enzymes that help them attach to an
opening through the skin. In most of the cases, the host would not be able to realize the
leech attack until the end because the leech can produce natural anesthetic substance
emanate from the saliva of leech. The host will have bleeding for a period of time after
the process since the saliva also contains anticoagulants known as hirudin that catalysed
conversion of fibrinogen to fibrin and thus prevent blood clotting (Mory et al., 2000).
Blood remains in fluid state as the crop of leech is colonized by an endosymbiotic

11
bacteria like Aeromonas spp to help leech digest the blood that they feed (Eroglu et al.,
2001). Table 2.1 summarized the major enzymes that are important in leech:
Table 2.1: Major enzymes important in leech
Enzyme Function
Hirudin Act as anticoagulant
Bdellin Protease inhibitor thus act as anti- inflammatory
Apyrase Powerful platelet anti-aggregate to make blood flow more
fluid
Eglin Inflammation inhibitor and antioxidants
Destabilase Powerful platelet anti-aggregate to dissolve blood clot
Hyaluronidase For diffusion and antibiotic
Lipase and Esterases For hyperlipidemia
Anti-Elastase Degrade cutainous elastin particularly at the level of skin
Vasodilatory Similar to histamine (act as neurotransmitter)
Catacholamines Act on the nerve terminator (specifically at skin)
2.3.2 Mechanism of Hirudotherapy
The mode of action of hirudotherapy depends more on the secretion of enzymes
from the salivary glands of leech. The salivary glands produce a lot of active substance
that act as anticoagulant, anti-inflammatory, bacteriostatic and analgesic action.
Therefore, the effect of these could eliminate hypoxia, increase immunity, restore any
damaged vascular and reduce the blood pressure. In addition, the medicinal leech can
directly act upon cellular and plasma factors associated with blood clotting as it blocks
the attachment of thrombocytes and conversion of fibrinogen to fibrin.

12
2.3.2.1: Application in Soft Tissue Hematomas
Hematoma can be called as the phenomenon where collection of blood localized
outside the blood vessels. This could happen in any part of body including the oral
system in which macroglossia could happen due to seizure- related activity. The
extensive lingual swelling could also come from penetrating injuries from the lower
face or bleeding from the fracture site (Grossman and Karlovitz, 1998). To prevent
acute airway emergency, treatment should be done earlier to avoid worsening swelling
due to congestion in venous and lymphatic system. Thus, hirudotherapy has been
reported as one of successful method in handling post-traumatic lingual swelling.
Heckmann et al., reported that there is significant improvement over the subsequent 24
hours after the treatment of using 13 leeches sucking out about 145 ml blood
(Heckmann et al., 2005).
2.3.2.2: Application in Tissue Flap Reconstructions
Tissue flap reconstruction is one of the most popular applications of
hirudotherapy as it is effective in removing stagnant blood from a skin flap during
reattachment of limbs. The stagnant blood is necessary to be put out of the area affected
as pooling of blood will lead to the increases of venous pressure. If this is prolonging,
the wound will not be provided with oxygen and nutrients thus the injury will not heal.
So, in this case hirudotherapy come in handy because the leeches can absorb all the
stagnant blood and after 3-7 days the damaged veins will resume the normal colour and
pressure so that blood can flow to the affected area continuing the wound healing
process (Amrit, 2010). Figure 2.2 depicts the process of application, attachment and
satiation of leech in a facial flap reconstruction.

13
Figure 2.2: Application of hirudotherapy to tissue flap reconstruction
(Source: Porshinsky et al., 2011)
2.3.2.3: Application in the Setting of Severe Soft Tissue Injury and Surgical
Replantation
The venous disorder study has been made from 1995 to evaluate effectiveness
using hirudotherapy for patients that have difficulties due to venous obstruction after
head and neck tissue transfer (Chepeha D.B., 2002). All the flaps from the 8 patients
could not be saved using conventional surgical or thrombolytic therapy. Therefore, after
6.6 days for inosculation and duration in intensive care unit for 9.6 days, it bring
successful result where the flap is save by using about 215 leeches per patient.
In most of the reconstruction cases, the severe soft tissue injury are due to
venous congestion where this is detect from a few symptom like development of tissue
edema, purple discoloration and warmth of the reconstructed or replanted tissue (Hullet
et al., 2007). Applying leech to the affected area will reduce the swelling and
discoloration and thus venous congestion will decrease at the same time.
Yet, another procedure that has been using hirudotherapy which is suitable for
sensitive area is penile amputation. This has been a good alternative since penile
replantation requires adequate postoperative venous outflow (Mineo et al., 2004).
During the surgical procedure careful approximation of urethra and corporal bodies of
the dorsal vein plays an important role. Therefore, for non-microsurgical replantation
procedure, application of leech is one of the factors for the success of the replantation

14
(Mineo et al., 2004). Some of the common effects from this non microsurgery
procedure are skin loss, urethral strictures and fistulae, loss of glans penis also sensory
deficits (Bhanganada et al., 1983). So, hirudotherapy play important steps that take
place after the operation. In figure 3 the replantation is a success after using the leech
where from a to b the leeches are held until the attachment and c shows that leech
already attach and start to increase in size until it satiate from d to e.
Figure 2.3: Application of hirudotherapy in a case of digital replantation
(Source: Porshinsky et al., 2011)

15
2.4 Body composition
A body composition is the measures to describe compartments of our body that
consists of fat and non-fat component (water, protein, minerals). This measurement is
important as it can gives information on the components of human body due to nutrition,
diet, exercise, disease and even therapy activities. Some of the basic definitions that
must be known in body composition are:
1) Body density (Db) : total body mass expressed relative to total body volume
2) Body mass (BM) : Measure of the size of the body
3) Fat mass (FM) : All extractable lipids from adipose and other tissue in the body
4) Fat free mass (FFM): all residual lipid-free chemicals and tissues including
water, muscle, bone, connective tissue and internal organs.
5) Lean body mass (LBM) : Fat free mass plus essential lipids
6) Relative body fat (%BF) : Fat mass expressed as a percentage of total body
weight
7) Total body bone mineral (TBBM) : A measure of the osseous mineral content
of the body
8) Total body mineral (TBM) : A measure of the osseous and non-osseous
mineral content of the body
9) Total body water (TBW) : A measure of the intracellular and extracellular fluid
compartments of the body
In order to measure the body composition of human body, measurement should be
invasive and convenient where estimation can be done indirectly. Thus, early studies
have been developed to model the body composition that divide the weight into two or
more components. There are several applications of body composition:
1) To identify health risk due to extremely high or low level of total body fat
2) To monitor diseases by changes in body composition

16
3) To assess effect of nutritional intake, dietary, therapy and exercises to body
composition
4) To keep track of healthy body weight for athletes
5) To monitor children development from changes in body composition
Therefore, body composition is one of the methods that is convenient and used
frequently by many practitioner to see changes in body composition.
2.4.1 Body composition models
There are a few models that have been proposed since early studies in which
they are:
1) Two component model (2-C)
2) Three component model (3-C)
3) Four component model(4-C)
4) Six component model(6-C)
Out of these four models, the 2-C model has been generally used. However, by using
isotope dilution, dual energy x-ray and neutron activation analysis it is possible to
derive the other models which can quantify and accurately measures body composition
that divide fat free mass (FFM) into water, mineral and protein (Boileau, 1977).
2.4.1.1 Two component model
This model has been developed by Brozek and Siri where the model divides the
compartment of human body into FM and FFM. They find and formulate a relationship
to calculate the %BF. However, some assumptions are taken into account where:
1) Densities of FM and FFM are additive as well as constant for all people.
2) The content of FFM proportion is constant within and between all people.
3) Each different people only vary in term of fat and obesity tissue.

17
2.4.1.2 Three component model
This is enhanced from the two component model where body weight is the
summation of fat, water and solids which consists of mineral and protein. The model
developed is considering the hydration factor that is different from one individual to the
other. However, Lohman also proposing the three components model where body
weight is made of fat, mineral and protein with water. These two models are
representing the body composition on molecular level while there’s another three
component model which is on tissue/cellular level. This is done by using the dual-
energy X-ray absorptiometry that divides the body weight equation equal to summation
of bone, bone free lean tissue and FM. The model which develops by Ellis separates the
equation into two 2-C model. One is for bone and soft tissue mass and the other is lean
and fat tissue.
2.4.1.3 Four component model
The four component model is based on the composition of body weight is made
of fat, water, bone, mineral and protein. This has been developed by several researches
like Friedl, Selinger, Heymsfield and Baumgartner. This model can portray estimation
of fat more accurate than 2-C model but requires more measurement on different
variable.
2.4.1.4 Six component model
The six component model is more detailed than the other types of model as the
body composition is assess in atomic level. According to this model, body weight
consists of TBW, TBN (total body nitrogen), TBCa (total body calcium), TBK (total
body potassium), TBNa (total body sodium) and TBCl (total body chloride). This kind

18
of measurement need direct analysis of chemical composition in vivo. The atomic major
elements of body are measured using neutron activation analysis.
2.4.2 Body composition measurement
There are a few types of assessment where we measures body composition by
using the method of Hydrodensitometry, Anthropometry, Bioelectrical impedance
analysis, Air displacement Plethysmography, hydrometry, Dual energy X-ray
absorptiometry (DXA), Neutron activation analysis, Whole body counting of potassium,
Computed tomography, and magnetic resonance imaging. These methods are developed
to identify and estimate the body composition in molecular or atomic level.
2.4.2.1 Hydrodensitometry
Hydrodensitometry is also known as hydrostatic weighing or underwater
weighing in which it is used to measure the body volume. It works by the principle of
Archimedes where the estimation of total body volume is equal to the water displaced
by the body when it is fully submerged. However, it is not practical to collect the
amount of displace water thus measurement is done by determining the underwater
weight (UWW) of an individual. This is normally difficult to conduct for excessively
obese, pregnant, elderly or disabled subjects (Brodie and Slade, 1990). This method
requires a sensitive and continuous measurement through the level of exhalation that
will give the value of readings. The readings are the estimation of UWW which is
directly proportional to the volume and weight of the water displaced by body volume.

19
2.4.2.2. Anthropometry
This method has been used to predict the body density that can be change to
percentage of body fat. It involves skinfold technique where the thickness of skin fold is
measure at different part of body, including bone dimension and limb circumferences.
This technique is very common in the lab and anthropometric field for assessing the
body fat in body composition and nutritional evaluation (Sloan, 1967). The skinfold
method is use as it can estimates the general fatness and the distribution of
subcutaneous adipose tissue which assume to represent the total body fat. Normally, the
potential sources of error come from the caliper selection and tester reliability in which
it fails to estimate simultaneously all possible sources of measurement error (Brodie,
1998). The error can also result in different degree of error variance for different
conditions (Sloan and Shapiro, 1972; Lohman et al., 1984).
2.4.2.3 Bioelectrical Impedance
Bioelectrical impedance analysis (BIA) method is used since 1980’s and now
famous for practitioner to make different diagnosis and make a long term approach to
treatment. Using the tools for measurement, BIA will give the result in impedance value
of body tissues. The impedance then can be calculated to estimate the total body water
(TBW) which also estimate the FFM and adiposity. In addition, BIA can also be used in
approximating the body cell mass and TBW in different kind of clinical condition (Kyle
et al., 2004).

20
2.4.2.4 Air displacement Plethysmography (ADP)
This method is an alternative to hydrodensitometry as it much more convenient
and requires only minimal technician skill to conduct. The ADP is using a Bod Pod
system where the derivation of BV and Db is based on the inverse relationship between
pressure and volume (Boyle’s law): 1
2
2
1
V
V
P
P=
Figure. 2.4: Two chamber bod pod system
(Source: http://www.iub.edu/~k536/measure.html)
[Viewed: October 14, 2011]
Figure 4 show the Bod Pod system which consists of front chamber and rear
chamber that separated by a wall made of molded fiberglass. An oscillating diaphragm
is attach to create changes in volume where the measurement is taken twice and
pressure and volume is calculated before and after the patient is inside.

21
2.4.2.5 Hydrometry
Hydrometry is the measurement of body water that is the most abundant
components in the body. This technique is based on the dilution techniques where a
tracer will be diluted in one of the water components. Hydrometry requires two fluid
samples which is normally blood, saliva or urine. The first sample is for baseline
measure where the second one measures the concentration of the tracer. Then, the TBW
is calculated from the estimation of the water components that already equilibrate with
the tracer like tritium oxide, deuterium oxide and oxygen-18 (Heyward and Stolarczyk,
1996).
2.4.2.6 Dual energy X-ray absorptiometry (DXA)
DXA provide a measurement of total body bone mineral and bone mineral
density. In addition, it also able to measures FFM, %BF and soft tissue mass where it is
equal to the summation of lean tissue mass (LTM) and FM. The bone mineral content
that is captured by the DXA is given in grams and projected area of the measured site is
in centimeter (Adams, 2003). Then bone mineral density is calculated by dividing the
bone mineral content by the bone area (Blake et al., 1999). The principle is based on the
measurement of attenuation of x-ray with high and low photon energies. Since the X-
ray is absorbed by the body, the attenuation of the energy varies depending on the
densities and chemical composition of the tissue.
2.4.2.7 Neutron activation analysis (NAA)
This method can give details composition of body in atomic level where suitable
for 6-C model. During the assessment, a beam of neutrons will be projected to the
patient thus creating an isotope that emits gamma rays. Then components like calcium,

22
sodium, chlorine, phosphorous, nitrogen, hydrogen, oxygen and carbon can be
determined through the measurement of the emission of the gamma rays.
2.4.2.8 Whole body counting of potassium
This method is able to give the value of body cell mass by the measurement of
total body potassium. Potassium is an element that can be found in the intracellular with
different types namely 39
K, 40
K and 41
K. Only 40
K can be detected by the gamma rays
making use of it as counter to determine the whole lean mass of the body. Finally, the
fat percentage in the body can be determined from the lean mass and total body weight.
2.4.2.9 Computed tomography
Computed tomography (CT) is also based on the difference of X-ray attenuation
where it allows identification of bone, adipose tissue and lean tissue. It is a powerful
radiographic tool where fatness can be measures by combining a specific part with the
whole body. In addition, due to the properties of CT that is more sensitive to small
changes in attenuation result in the ability of CT in producing image of soft tissue in
great clarity compared to standard radiography (Brooks and DiChiro, 1975;
McCullough et al., 1976).
Figure 2.5: CT scan
(Source: http://www.iub.edu/~k536/measure.html)
[Viewed: October 14, 2011]

23
The figure depicts the concept of CT scan where the x-ray tube is placed opposite poles
of a large ring that rotate around the patient. Then the computer will generate the 3-D
image of organs and tissues slices by slices using the lead shutter in front of the X-ray
tube and X-ray detector after complete rotation of 360°.
2.4.2.10 Magnetic resonance imaging (MRI)
MRI similarly can produce an image and simultaneously detect subcutaneous and
visceral fat. It gives an unbiased measurement of fat content, internal and subcutaneous
for a large range of body shapes and sizes (Thomas et al., 1998). Using MRI, the patient
will be placed in a magnetic field that aligns together hydrogen nuclei when radio
pulsed frequency is applied. When the radio frequency is turned off, the hydrogen
nuclei will emit the radio signal that they absorbed creating an image at tissue level.
2.5 Bioelectrical impedance analysis (BIA)
BIA is method that uses an alternating current (AC) to measure the opposition of
body tissue. Normally, the impedance value that captured will be varying according to
the frequency of the current used. There are a few ways of using BIA where sometimes,
single frequency or multi frequency is used in the analysis.
2.5.1 BIA principles
BIA works on the principles that relate the conductor volume, length, resistivity
and impedance value. The conductor principle can be compare to the human body
where conductor itself is the human body which has volume (V), height (L), specific
resistivity for components like FM and FFM (ρ), and body impedance (Z).
24
2.5.1.1 Body impedance (Z)
Impedance value is a resistive property of alternating current (AC) that is a
frequency dependant. It consists of two components which are resistive (R) and reactive
capacitive (Xc). The relationship can be put into an equation of:
222 RXZ c +=
The value of Xc refers to the value of body capacitance that present in the body
when AC is in contact with the cell membrane. Therefore, Xc can be related to the body
cell mass (BCM) that contains active components of the body like muscle, blood and
immune cells. Resistive value, R, is the indicator of the extracellular mass and
intracellular mass in which R is assume proportional to FM or FFM. The value of R is a
resistive value when a current flow through the body and can indicate that high reading
of R shows that FFM content is low in human body and vice versa. The effect of Xc
sometimes is negligible due to comparatively small value but becomes significant as the
frequency increases.
2.5.1.2 Volume and body composition
The volume of a conductor can be interpreted by the equation: ALV ×= . Since
Length can be related to the height of human then area is derived from the relationship
of resistance for a conductor: A
LR
ρ= . Since R is proportional to impedance,
rearranging the equation result in Z
LA
ρ= . Thus, deriving again the equation of volume
will result in:
Z
LV
2ρ=
-------------------------------------- (1)

25
This volume can be interpreted as the volume of the FFM or TBW that directly
proportional to square of height and inversely proportional to value of impedance of
body. However, this equation holds an assumption that the conductor is a perfect
cylinder with a uniform cross sectional area. This is not true as a whole as human body
can be represented as five cylinders excluding head (Kushner, 1992). All the five
cylinders are different in cross sectional area resulting in different measurement of
resistance (Baumgartner et al., 1989). Thus, to cater all the differences in the body
segment, the equation of volume become:
trunkarmlegz
L
z
L
z
LV
+
+
=
222
22ρρρ
.
2.5.1.3 Calculation of body composition
There are a few formulas in calculating the body composition components like
TBW, FFM, FM, and % BF. Using BIA method, these readings can be measured at the
frequency of 50 kHz using the formulas below (Lukaski, Bolonchuk, 1988):
( ) ( ) ( )ageweightsexcesis
heightTBW 069.0014205.3
tanRe372.0
2
−++
=
---------- (2)
• Height is in cm
• Sex: Male = 1, Female = 0
• Weight is in kg
• Age is in years
73.0
TBWFFM =
--------------------------------------------------------------------------- (3)
• 0.73 is known as the hydration constant
FFMWeightFM −= ------------------------------------------------------------------ (4)
%100% ×=weight
FMBF
---------------------------------------------------------------- (5)

26
2.5.2 BIA models and approaches
There are a few models and approaches that have been used in determining the
TBW and FFM in the body for BIA. However, the concept still applies the same where
two electrodes namely source and sink is used to determine the current flow pass
through it. The current that pass through the body will go through all the conducting
material and voltage drop across the source and sink can be measured. These conductors
are normally in the form of charged ions like sodium and chloride ions.
2.5.2.1 Single frequency BIA (SF-BIA)
In this method, only one frequency which is at 50 kHz is used to measure the
impedance across the electrode that is paced on the hand and foot. However, some are
placing the electrodes across hand to hand and even foot to foot (Jebb et al., 2000; Utter
et al., 1999).
2.5.2.1.1 Series model
This is one of the traditional models where the assumption is considering only
one conducting path and human body consists of series of resistors. Using a single
frequency of 50 kHz, the impedance value will be used to determine the TBW and FFM.
However, this method is only suitable for patient with normal ratio of ECW to ICW.
2.5.2.1.2 Parallel model
This model made of assumptions where the body is not just a series of resistors but
parallel as it suits more of the human physiology. The parallel model is the reciprocal of
the series model and preferred to be used for patient with fluid imbalance as it is
suitable for estimation of ICW and BCM.

27
2.5.2.2 Multi-frequency BIA (MF-BIA)
Since single frequency BIA cannot penetrate cell, multi-frequency BIA can
achieved more in order to estimate the FM, ECW, ICW and TBW. The range of
frequencies start from 0 up to 500 kHz is used to give more accurate and less biased
value than SF-BIA.
2.5.2.2.1 Bioelectrical impedance spectroscopy (BIS)
The BIS is more to prediction using the mathematical modelling and mixture
equation. The mixture equation like Cole model can show improvement in accuracy
than regression approach as BIS utilizing correlation between R and body fluid
compartments. From there, prediction equation can be derived provided reliable data
fitting and valid fluid distribution model is included (Kyle et al., 2004).
2.5.2.2.2 Segmental model
The value of impedance is greatly influenced by the cross sectional area of the body.
Comparing the five model cylinder, trunk will represent most of the FFM value than
others. Therefore, segmented model can give more accurate value than the whole body
BIA. Segmental BIA is able to calculate the distribution of body composition segment
by segment thus useful in patient with distorted fluid distribution. In addition, to used
segmental model requires additional two more electrodes in any part like torso, leg or
arm.

28
2.5.2.2.3 Localized bioelectrical impedance analysis
Localized BIA is also one of the methods that can give specific segment value.
As the traditional BIA concluded population specific, localized BIA can be more focus
to avoid the interference effect for example in measuring the local abdominal fat by
using the localized BIA (Scharfetter et al., 2001).
2.5.2.2.4 Bioelectrical impedance vector analysis (BIVA)
BIVA is type of analysis that is consider as a standalone model that can give
direct assessment of patient from direct impedance measurements plotted in bivariate
vector standardized by the subject’s height. This method is useful and advantageous in
the clinical settings as the result is not biased due to choice of regression equation since
no conversion of raw data to body composition is required. The result can be plot in R-
Xc plane and stratified accordingly due to different vector distribution pattern (Piccoli et
al., 1995; Piccoli et al., 2002).

29
2.6 Statistical test
Statistical test is important in organizing data and making conclusion from the raw
data. It’s a powerful tool in which one can represent a set of raw data in graphical or
tabulated form and relate the variable while making estimation and get better
understanding of situation of the data portrayed. Some of the statistical analysis that is
common to researchers is t-test and analysis of variance (ANOVA) that involves the
description of mean.
2.6.1 T-test
T-test is a test which able to determine the separateness of two sets of
measurement. Therefore, mean or average value and distribution can be depicted by
using t-test. There are three types of t-test which is independent t-test and dependent t-
test and one sample t-test.
2.6.1.1 Independent t-test
This test is applicable for comparing two different population or sample for one
variable. Normally, for a simple experiment the result of the experiment and the control
group can be compared and analyse by using the independent t-test.
2.6.1.2 Dependent t-test
The dependent t-test is used to evaluate data by comparing average of one single
group for two different variables. This is normally called as paired sample test as the
result from the two mean is from the same group of interest. The dependent t-test
usually been applied in before and after situation where the effect of the variable is
determine by comparing the mean.
30
2.6.1.3 One sample t-test
This type of test is more direct as we only compare mean of a variable with a
constant value that is usually a hypothesized value that already calculated before the test
is conduct. It can determine the validity of the measurement or maybe directing to
another conclusion of the test.
2.6.2 ANOVA
ANOVA is more powerful than t-test as it can compare means more than two
groups. The reliability of t-test is valid up until two groups thus urging the ANOVA
method to be used to get result and see the relationship from different group or variables.
Generally, there are two main types of ANOVA namely one-way ANOVA and two-way
ANOVA.
2.6.2.1 One way ANOVA
One way ANOVA is the upgraded version of independent t-test where it can
evaluate a mean for more than two groups. Sometimes, in real situation cross evaluation
for several samples is required to get a confirmation of the hypothesis of an experiment.
2.6.2.2 Two-way ANOVA
This method is different in terms of evaluation of mean can be compared with
two different variable for the same group. This will allow the researcher to determine
the combined effect of the independent variables plus assessing the interaction between
the variables in influencing the mean on the dependent variable.

31
CHAPTER THREE
METHODOLOGY
3.0 Introduction
The effect of the leech therapy on body composition is a basic research on
determining the difference in impedance measurement before and after the treatment.
The process of the study can be depicted by the flowchart in Figure 3.1 below.
Figure 3.1: Flowchart of study
Preparation for demographic data and measurement setup at leech therapy
treatment center in Pantai Dalam, KL
Completion of data by subjects with 2 forms:
i- Personal information ii- Consent form
Conducting measurement for pre-treatment data
Keying in information and data measurement before leech therapy
Completion of treatment within 1 hour
Keying in information and measurement after treatment of leech therapy
Analyzing data using the statistical tool

32
3.1 Subjects / patient
The criteria of the subjects of this study are constrained by the method of the
analysis which uses the BIA measurement and the treatment of leech therapy. For BIA
measurement, a subject should not be in the early pregnancy stage or implanted with
any electronic devices such as a pace maker. Moreover, leech therapy treatment also
could not be performed on pregnant women due to the influence of treatment in the
course of developing pregnancy and sometimes causing miscarriage. In addition, the
leech therapy patient must not experiencing any symptoms of low blood pressure,
anemia or anything similar as well as taking any medication that has the same effect as
Hirudin enzyme. This will make the conditions of the patient become worse and thus is
not eligible to be the subject of this study.
Overall, there are 50 patients that agree to take part in this study. All information
regarding this study was brief thoroughly.
3.2 Measurement setup
Before measurement begins, the patient must be sure to be in the supine position.
The measurement is taken from the right hand and right foot of the patient. So, the
placement of the electrode on proximal part is placed on the dorsal surface of the wrist
so that the upper border of the electrode bisects the styloids processes of the ulna and
radius and dorsal surface of the ankle that it able to bisects medial and lateral malleoli.
In addition, the right foot and right hand where the distal placement of electrodes is
done at the base of the second or third metacarpal phalangeal joints. These distance at
the proximal and distal are always check to be in the distance of at least 5cm.
Then, the clip wire is attached to the self adhesive disposable electrodes to take
the measurement. Basically, there are 2 main wires that are used which are red and

33
black. The position of the red wire is placed at the distal and black is always positions at
the proximal distance. This can be illustrated below.
Figure 3.2 Placement of electrodes at hand
Figure 3.3 Placement of electrodes at leg
3.3 Data measurement
The procedure could be outline as below:
1. After the patient is in the correct position, then the body must be check so that it
won’t touch one and other. This is to avoid any short circuit in the path of the current
inside the body
2. The electrodes is placed on the correct position
3. The crocodile clips is attached to the metal tab strip of the electrode.
4. The bioimpedance machine which is Quadscan 4000 is switch on.

34
5. All the data from the patient were insert one by one before the measurement start.
6. After 3 to 4 minutes, the measurement start to take place and results are display on
the LCD screen.
7. Then the data could be downloaded via Bluetooth connection at any time for analysis.
3.4 Statistical analysis
This analysis is divided into a few parts that are bar graphs, descriptive statistics,
independent t-test, paired sample t-test and ANOVA. The steps are depicted more on
appendix A.
3.4.1 Bar graph
The step by step procedures are by clicking this one by one.
Analyze descriptive statistics frequencies chart.
Since the bar graph is set in percentage, all the frequencies given are automatically
converted.
3.4.2 Descriptive statistics
This can be done as follows.
Analyze descriptive statistics frequencies descriptives
options ok.
All the important descriptive parameters are chosen for the analysis. These include
mean, standard mean error, kurtosis, variance and standard deviation.

35
3.4.3 Independent sample t-test
Following the order below, the results are obtained from independent t-test.
Analyze compare means independent sample t-test ok
The entire test variables are put on the box and grouping variable is defined.
3.4.4 Paired sample t-test
Following the order below, the results are obtained from paired sample t-test.
Analyze compare means paired sample t-test ok
The entire paired variables are put on the box for analysis.
3.4.5 ANOVA
This can be done as follows.
Analyze compare means one way ANOVA post hoc ok

36
CHAPTER FOUR
RESULTS
4.0 Statistical analysis
The data that were collected from the Quadscan 4000 are all analyzed closely by
using the SPSS tool. The involve test are pair t-test, independent sample t-test and
ANOVA which stands for analysis of variance. The effect of body composition is
measured based in the bioimpedance parameter which are divided into 2 called as
primary and secondary bioimpedance parameter. The parameter involves were listed in
Table 4.0 as below.
Table 4.0: Bioimpedance parameter
Main bioimpedance parameter Secondary bioimpedance parameter
Impedance at 5K Percentage of fat before test
Impedance at 50K Min fat before test
Impedance at 100K Max fat before test
Impedance at 200K Percentage of lean before test
Reactance at 50K Min lean before test
Resistance at 50K Max lean before test
Phase Angle at 50 kHz Dry lean weight before test
Basal metabolic rate Percentage of water before test
Intracellular water Min water before test
Normal value of intra cellular water Max water before test
Extra-cellular water Density before test
Normal value of extra cellular water Nutrition before test
Total body water volume Normal nutrition before test
Min total body water Third space value before test
Max total body water volume before test
Body cell mass before test

37
4.1 Demographic data
The demographic data is basically a requirement for the patient to complete in
order to enrol in this study. Important background information were listed such as
gender, marital status, occupation, age, illness, number of treatment and subject’s daily
activity. BMI measurements are derived from the demographic information and
compare with the analysis data from Quadscan 4000.
Figure 4.1: Bar graph for subject’s gender
Based on figure 4.1, gender of patient can be classified for the leech therapy
treatment that is dominated by female by 54% of the participant of this study which is
more than half. Therefore, the male participants were identified to be only 46% from the
50 patients that enrolled. These participants were randomly picked from the patients
who come to get the leech therapy treatment in the treatment center. Thus, this shows
that this treatment is more popular among females than males by 8% difference.

38
Figure 4.2: Bar graph for subject’s marital status
For the above figure 4.2, the variables involve is the marital status of the
subjects. The bar graph shows that the patients that come to get the treatment are mostly
single person rather than married. This is depicted by the value of single patient that
covers 60% than the total patient that come to get treatment. Married person that are
chosen were only 20 persons that brings the statistical percentage up to 40% only.

39
Figure 4.3: Bar graph for range of subject’s age
From figure 4.3, the ranges of subject’s age are determined from the maximum
and minimum value of the data. Using cross tabulation method, there are 5 significance
ranges which dominated by the patient from age 21-30 years by 36%. This is followed
by those who are younger in the category of age less than 21 by 24%. Then, the
percentage is decreases from age of more than 50 by 18%, 41 to 50 by 12% and least
participant for range of 31 to 40 years by only 10%.

40
Figure 4.4: Bar graph for subject’s occupation
From the chart of figure 4.4, most of the subjects are working in the private
sector showing 42% participation rate where those who fall in this category are
consultant, driver, secretary, artist, lecturer, executive, technician, manager, banker,
clerk, engineer and hotelier. However, 38% out of 50 subjects were categorized as
students where this covers student from primary to tertiary level of education. The
public sector is fall behind with 6% in which subjects currently working as nurse or
research assistant in the public university. Furthermore, unemployed participants were
categorized as housewife or retiree with overall 12% from the total patients. Self-
working subject is only one where it contributes 2% of the total statistics.

41
Figure 4.5: Bar graph for number of leech therapy treatment
The bar graph is indicating that most of the participants were a first timer in
getting a leech therapy treatment with 88% and the rest were the second time getting
this treatment and third time with percentages 10% and 2% respectively.
42
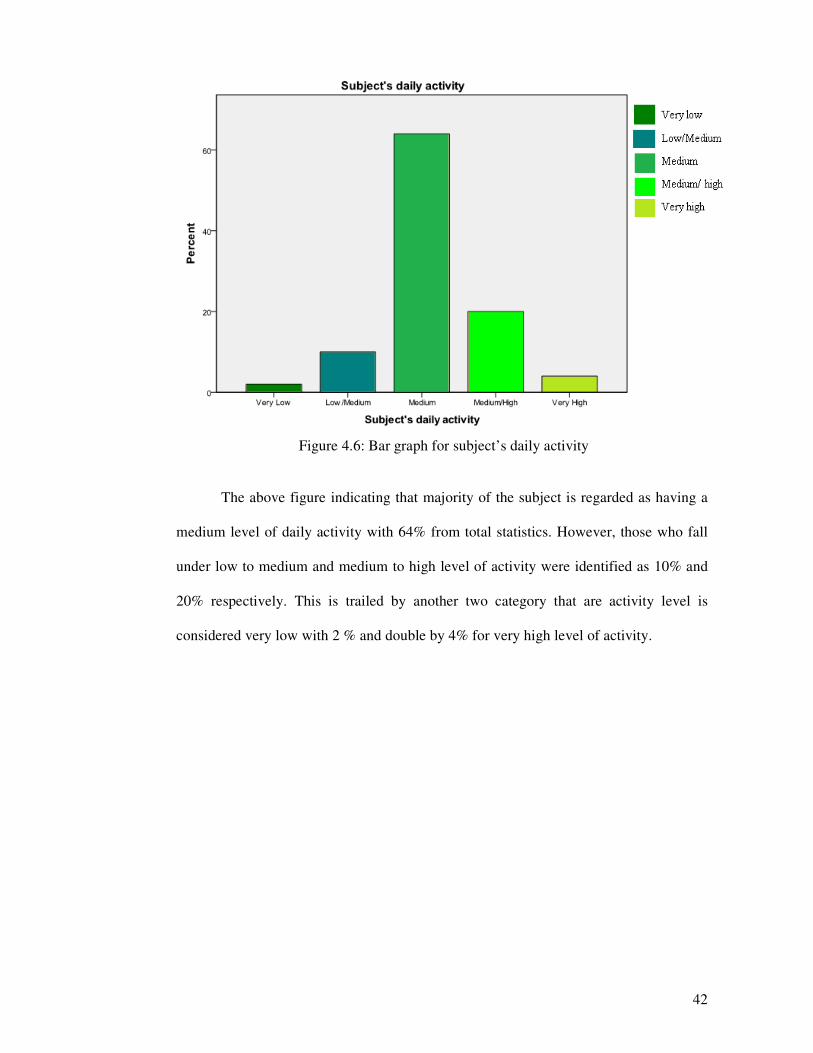
Figure 4.6: Bar graph for subject’s daily activity
The above figure indicating that majority of the subject is regarded as having a
medium level of daily activity with 64% from total statistics. However, those who fall
under low to medium and medium to high level of activity were identified as 10% and
20% respectively. This is trailed by another two category that are activity level is
considered very low with 2 % and double by 4% for very high level of activity.

43
Figure 4.7: Bar graph for BMI readings
The BMI readings were taken before and after the leech therapy treatment and
most of the participant of this study are having a BMI from 20 to 25 with 46% in total.
The BMI range from 26 to 30 was more with 20% than BMI range of less than 20 that is
only 18%. About 6% of total patient is having BMI of more than 35.

44

45

46

47

48

49

50

51

52

53

54

55

56

57

58

59

60

61

62

63

64

65

66

67

68

69

70

71

72

73

74

75
4.4 Comparison of bioimpedance parameter
This is the analysis to see the comparison of bioimpedance parameter with the
demographic variable namely age and BMI groups
4.4.1 Comparison of Bioimpedance Parameters with Patient’s Age Group.
In this section Comparison of Bioimpedance Parameters with Patient’s Age
Group are shown here. For ease of reporting and analysis age group also divided into
four groups here. For analysis the bioimpedance parameters are divided into two groups
here. They are primary and secondary bioimpedance parameters. Also need to consider
the condition before and after treatment here. Independent T test and ANOVA test was
used here for this analysis. The value of P should be less than 5% for significance.
The age group 2 until age group 5 have almost the same pattern in age group 1
and some have some missing value because insufficiency of parameters for analysis.
Table 4.30 Comparisons of Main Bioimpedance Parameters before Treatment for
Female age group 1.
Main Bioimpedance Parameters Overall (p) BMI (P) Diseases Grp(p)
Impedance value at 5KHz 0.000 0.000 0.000
Impedance value at 50KHz 0.000 0.000 0.000
Impedance value at 100KHz 0.000 0.000 0.000
Impedance value at 200KHz 0.000 0.000 0.000
Reactance at 50KHz 0.002 0.000 0.000
Resistance at 50KHz 0.000 0.000 0.000
Phase Angle at 50 KHz 0.000 0.000 0.000
Basal metabolic rate 0.099 0.000 0.000
Intracellular water 0.720 0.000 0.000
Normal value of intracellular
water
0.345 0.000 0.000
Extra-cellular water 0.534 0.000 0.000
Normal extra cellular water 0.710 0.000 0.000
Total body water volume 0.749 0.000 0.000
Min total body water volume 0.011 0.000 0.000
Max total body water volume 0.182 0.000 0.000
Body cell mass 0.724 0.000 0.000
* No of treatment does not have enough parameter for analysis.
76
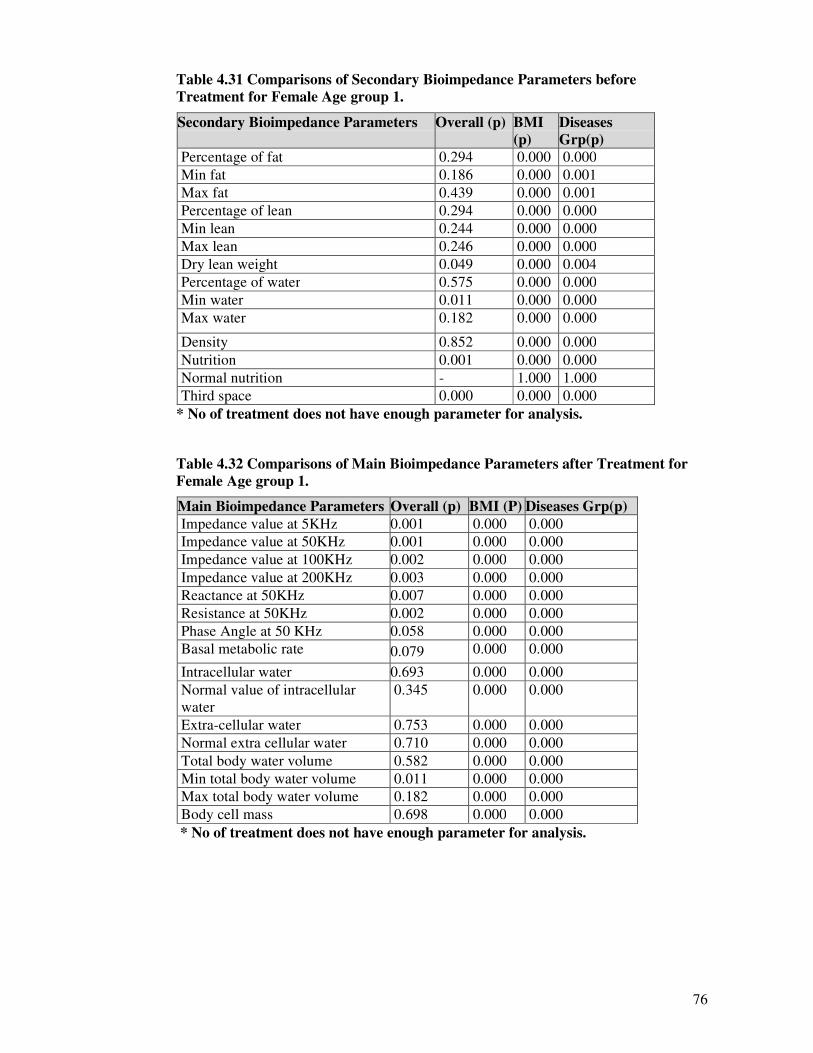
Table 4.31 Comparisons of Secondary Bioimpedance Parameters before
Treatment for Female Age group 1.
Secondary Bioimpedance Parameters Overall (p) BMI
(p)
Diseases
Grp(p)
Percentage of fat 0.294 0.000 0.000
Min fat 0.186 0.000 0.001
Max fat 0.439 0.000 0.001
Percentage of lean 0.294 0.000 0.000
Min lean 0.244 0.000 0.000
Max lean 0.246 0.000 0.000
Dry lean weight 0.049 0.000 0.004
Percentage of water 0.575 0.000 0.000
Min water 0.011 0.000 0.000
Max water 0.182 0.000 0.000
Density 0.852 0.000 0.000
Nutrition 0.001 0.000 0.000
Normal nutrition - 1.000 1.000
Third space 0.000 0.000 0.000
* No of treatment does not have enough parameter for analysis.
Table 4.32 Comparisons of Main Bioimpedance Parameters after Treatment for
Female Age group 1.
Main Bioimpedance Parameters Overall (p) BMI (P) Diseases Grp(p)
Impedance value at 5KHz 0.001 0.000 0.000
Impedance value at 50KHz 0.001 0.000 0.000
Impedance value at 100KHz 0.002 0.000 0.000
Impedance value at 200KHz 0.003 0.000 0.000
Reactance at 50KHz 0.007 0.000 0.000
Resistance at 50KHz 0.002 0.000 0.000
Phase Angle at 50 KHz 0.058 0.000 0.000
Basal metabolic rate 0.079 0.000 0.000
Intracellular water 0.693 0.000 0.000
Normal value of intracellular
water
0.345 0.000 0.000
Extra-cellular water 0.753 0.000 0.000
Normal extra cellular water 0.710 0.000 0.000
Total body water volume 0.582 0.000 0.000
Min total body water volume 0.011 0.000 0.000
Max total body water volume 0.182 0.000 0.000
Body cell mass 0.698 0.000 0.000
* No of treatment does not have enough parameter for analysis.

77
Table 4.33 Comparisons of Secondary Bioimpedance Parameters after Treatment
For Female Age group 1.
Secondary Bioimpedance Parameters Overall (p) BMI
(p)
Diseases
Grp(p)
Percentage of fat 0.246 0.000 0.000
Min fat 0.235 0.000 0.005
Max fat 0.633 0.000 0.000
Percentage of lean 0.246 0.000 0.000
Min lean 0.160 0.000 0.000
Max lean 0.204 0.000 0.000
Dry lean weight 0.047 0.000 0.005
Percentage of water 0.347 0.000 0.000
Min water 0.011 0.000 0.000
Max water 0.182 0.000 0.000
Density 0.852 0.000 0.000
Nutrition 0.000 0.000 0.000
Normal nutrition - 1.000 1.000
Third space 0.001 0.000 0.000
* No of treatment does not have enough parameter for analysis.
Table 4.34 Comparisons of Main Bioimpedance Parameters before Treatment for
male age group 1.
Main Bioimpedance Parameters Overall (p) BMI (P) No of
treatment (p)
Diseases
Grp(p)
Impedance value at 5KHz 0.000 0.104 0.640 0.000
Impedance value at 50KHz 0.000 0.024 0.688 0.001
Impedance value at 100KHz 0.000 0.022 0.640 0.001
Impedance value at 200KHz 0.000 0.024 0.574 0.000
Reactance at 50KHz 0.002 0.001 0.207 0.154
Resistance at 50KHz 0.000 0.023 0.686 0.001
Phase Angle at 50 KHz 0.000 0.003 0.280 0.001
Basal metabolic rate 0.099 0.000 0.194 0.322
Intracellular water 0.720 0.000 0.324 0.142
Normal value of intracellular
water
0.345 0.000 0.217 0.781
Extra-cellular water 0.534 0.000 0.211 0.089
Normal extra cellular water 0.710 0.000 0.217 0.790
Total body water volume 0.749 0.000 0.246 0.057
Min total body water volume 0.011 0.000 0.232 0.769
Max total body water volume 0.182 0.000 0.209 0.799
Body cell mass 0.724 0.000 0.328 0.140

78
Table 4.35 Comparisons of Secondary Bioimpedance Parameters before
Treatment for Male Age group 1.
Secondary Bioimpedance
Parameters
Overall (p) BMI (p) No of treatment
(p)
Diseases
Grp(p)
Percentage of fat 0.294 0.365 0.616 0.000
Min fat 0.186 0.000 0.380 0.170
Max fat 0.439 0.000 0.116 0.645
Percentage of lean 0.294 0.365 0.616 0.000
Min lean 0.244 0.000 0.213 0.257
Max lean 0.246 0.000 0.186 0.337
Dry lean weight 0.049 0.000 0.163 0.904
Percentage of water 0.575 0.000 0.258 0.003
Min water 0.011 0.000 0.232 0.769
Max water 0.182 0.000 0.209 0.799
Density 0.852 0.224 1.000 0.000
Nutrition 0.001 0.000 0.585 0.396
Normal nutrition - 1.000 1.000 1.000
Third space 0.000 0.001 0.336 0.000
Table 4.36 Comparisons of Main Bioimpedance Parameters after Treatment for
Male Age group 1.
Main Bioimpedance Parameters Overall (p) BMI (P) No of treatment
(p)
Diseases
Grp(p)
Impedance value at 5KHz 0.001 0.031 0.482 0.000
Impedance value at 50KHz 0.001 0.016 0.553 0.001
Impedance value at 100KHz 0.002 0.015 0.512 0.001
Impedance value at 200KHz 0.003 0.015 0.497 0.001
Reactance at 50KHz 0.007 0.000 0.562 0.733
Resistance at 50KHz 0.002 0.016 0.550 0.001
Phase Angle at 50 KHz 0.058 0.000 0.350 0.012
Basal metabolic rate 0.079 0.000 0.221 0.299
Intracellular water 0.693 0.000 0.383 0.147
Normal value of intracellular
water
0.345 0.000 0.217 0.781
Extra-cellular water 0.753 0.000 0.278 0.073
Normal extra cellular water 0.710 0.000 0.217 0.790
Total body water volume 0.582 0.000 0.322 0.048
Min total body water volume 0.011 0.000 0.232 0.769
Max total body water volume 0.182 0.000 0.209 0.799
Body cell mass 0.698 0.000 0.384 0.150

79
Table 4.37 Comparisons of Secondary Bioimpedance Parameters after Treatment
for Male Age group 1.
Secondary Bioimpedance Parameters Overall (p) BMI
(p)
No of treatment
(p)
Diseases
Grp(p)
Percentage of fat 0.246 0.577 0.719 0.000
Min fat 0.235 0.000 0.286 0.094
Max fat 0.633 0.000 0.116 0.645
Percentage of lean 0.246 0.000 0.719 0.000
Min lean 0.160 0.000 0.237 0.249
Max lean 0.204 0.000 0.202 0.347
Dry lean weight 0.047 0.000 0.159 0.917
Percentage of water 0.347 0.000 0.199 0.001
Min water 0.011 0.000 0.232 0.769
Max water 0.182 0.000 0.209 0.799
Density 0.852 0.224 1.000 0.000
Nutrition 0.000 0.000 0.448 0.237
Normal nutrition 0.000 1.000 1.000 1.000
Third space 0.001 0.018 0.548 0.000

80
4.4.6 Comparison of Bioimpedance Parameters with Patient’s BMI Group.
In this section Comparison of Bioimpedance Parameters with Patient’s BMI
Group are shown here. For ease of reporting and analysis BMI group divided into five
groups here.BMI less than 20 in group 1,BMI 20 to 25 in group 2,BMI 25 to 30 in
group 3,BMI 30 to BMI greater than 35 in group 5. .For analysis the bioimpedance
parameters are divided into two groups here. They are primary and secondary
bioimpedance parameters. Also need to consider the condition before and after
treatment here. Independent T test and ANOVA test was used here for this analysis. The
value of P should be less than 5% for significance
Table 4.66 Comparisons of Main Bioimpedance Parameters before Treatment for
Female BMI group 1.
Main Bioimpedance Parameters Overall (p) BMI (P) No of
treatment (p)
Diseases
Grp(p)
Impedance value at 5KHz 0.004 0.008 0.000 0.000
Impedance value at 50KHz 0.043 0.013 0.000 0.000
Impedance value at 100KHz 0.122 0.014 0.000 0.001
Impedance value at 200KHz 0.184 0.016 0.000 0.001
Reactance at 50KHz 0.001 0.150 0.178 0.000
Resistance at 50KHz 0.051 0.013 0.000 0.000
Phase Angle at 50 KHz 0.045 0.503 0.000 0.025
Basal metabolic rate 0.093 0.553 0.301 0.000
Intracellular water 0.133 0.911 0.184 0.000
Normal value of intracellular
water
0.046 0.517 0.378 0.000
Extra-cellular water 0.117 0.649 0.224 0.000
Normal extra cellular water 0.017 0.517 0.378 0.743
Total body water volume 0.053 0.574 0.183 1.000
Min total body water volume 0.202 0.232 0.257 0.000
Max total body water volume 0.068 1.000 0.597 0.000
Body cell mass 0.142 0.876 0.176 0.000

81
Table 4.67 Comparisons of Secondary Bioimpedance Parameters before
Treatment for Female BMI group 1.
Secondary Bioimpedance Parameters Overall (p) BMI
(p)
No of treatment
(p)
Diseases
Grp(p)
Percentage of fat 0.744 0.024 0.014 0.000
Min fat 0.613 0.002 0.006 0.006
Max fat 0.273 0.024 0.067 0.003
Percentage of lean 0.744 0.024 0.014 0.000
Min lean 0.218 0.074 0.807 0.000
Max lean 0.252 0.108 0.141 0.000
Dry lean weight 0.008 0.537 0.416 0.472
Percentage of water 0.000 0.000 0.000 0.000
Min water 0.202 0.232 0.257 0.000
Max water 0.068 1.000 0.597 0.000
Density 0.228 0.074 0.087 0.000
Nutrition 0.708 0.526 0.044 0.000
Normal nutrition - 1.000 1.000 1.000
Third space 0.000 0.000 0.000 0.000
Table 4.68 Comparisons of Main Bioimpedance Parameters after Treatment for
Female BMI group 1.
Main Bioimpedance Parameters Overall (p) BMI (P) No of
treatment (p)
Diseases
Grp(p)
Impedance value at 5KHz 0.337 0.012 0.000 0.003
Impedance value at 50KHz 0.676 0.024 0.000 0.005
Impedance value at 100KHz 0.783 0.033 0.000 0.005
Impedance value at 200KHz 0.640 0.055 0.000 0.004
Reactance at 50KHz 0.039 0.002 0.001 0.000
Resistance at 50KHz 0.750 0.026 0.000 0.005
Phase Angle at 50 KHz 0.925 0.331 0.000 0.000
Basal metabolic rate 0.098 0.531 0.212 0.000
Intracellular water 0.140 0.967 0.062 0.000
Normal value of intracellular
water
0.046 0.517 0.378 0.000
Extra-cellular water 0.201 0.546 0.111 0.000
Normal extra cellular water 0.017 0.517 0.378 0.743
Total body water volume 0.071 0.518 0.070 1.000
Min total body water volume 0.202 0.232 0.257 0.000
Max total body water volume 0.068 1.000 0.597 0.000
Body cell mass 0.131 0.992 0.062 0.000
82
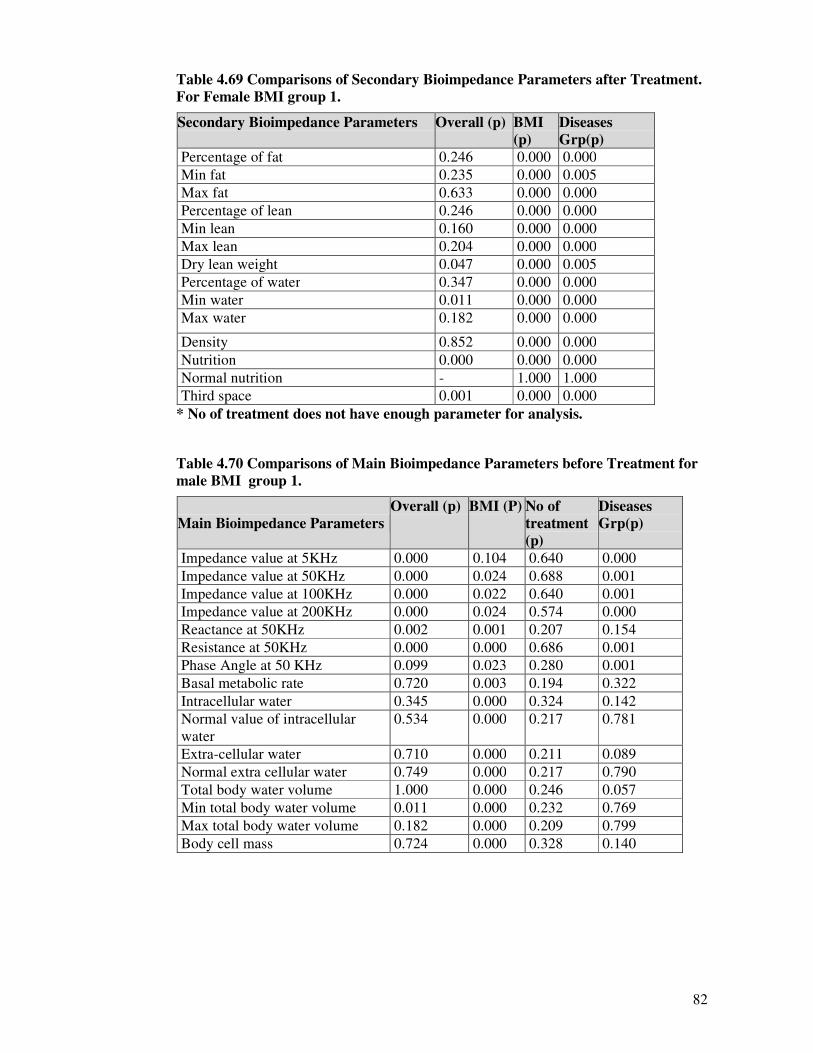
Table 4.69 Comparisons of Secondary Bioimpedance Parameters after Treatment.
For Female BMI group 1.
Secondary Bioimpedance Parameters Overall (p) BMI
(p)
Diseases
Grp(p)
Percentage of fat 0.246 0.000 0.000
Min fat 0.235 0.000 0.005
Max fat 0.633 0.000 0.000
Percentage of lean 0.246 0.000 0.000
Min lean 0.160 0.000 0.000
Max lean 0.204 0.000 0.000
Dry lean weight 0.047 0.000 0.005
Percentage of water 0.347 0.000 0.000
Min water 0.011 0.000 0.000
Max water 0.182 0.000 0.000
Density 0.852 0.000 0.000
Nutrition 0.000 0.000 0.000
Normal nutrition - 1.000 1.000
Third space 0.001 0.000 0.000
* No of treatment does not have enough parameter for analysis.
Table 4.70 Comparisons of Main Bioimpedance Parameters before Treatment for
male BMI group 1.
Main Bioimpedance Parameters
Overall (p) BMI (P) No of
treatment
(p)
Diseases
Grp(p)
Impedance value at 5KHz 0.000 0.104 0.640 0.000
Impedance value at 50KHz 0.000 0.024 0.688 0.001
Impedance value at 100KHz 0.000 0.022 0.640 0.001
Impedance value at 200KHz 0.000 0.024 0.574 0.000
Reactance at 50KHz 0.002 0.001 0.207 0.154
Resistance at 50KHz 0.000 0.000 0.686 0.001
Phase Angle at 50 KHz 0.099 0.023 0.280 0.001
Basal metabolic rate 0.720 0.003 0.194 0.322
Intracellular water 0.345 0.000 0.324 0.142
Normal value of intracellular
water
0.534 0.000 0.217 0.781
Extra-cellular water 0.710 0.000 0.211 0.089
Normal extra cellular water 0.749 0.000 0.217 0.790
Total body water volume 1.000 0.000 0.246 0.057
Min total body water volume 0.011 0.000 0.232 0.769
Max total body water volume 0.182 0.000 0.209 0.799
Body cell mass 0.724 0.000 0.328 0.140

83
Table 4.71 Comparisons of Secondary Bioimpedance Parameters before
Treatment for Male BMI group 1.
Secondary Bioimpedance Parameters Overall (p) BMI
(p)
No of
treatment (p)
Diseases
Grp(p)
Percentage of fat 0.294 0.365 0.616 0.000
Min fat 0.186 0.000 0.380 0.170
Max fat 0.439 0.000 0.116 0.645
Percentage of lean 0.294 0.365 0.616 0.000
Min lean 0.244 0.000 0.231 0.257
Max lean 0.246 0.000 0.186 0.337
Dry lean weight 0.49 0.000 0.163 0.904
Percentage of water 0.575 0.000 0.258 0.003
Min water 0.11 0.000 0.232 0.769
Max water 0.182 0.000 0.209 0.799
Density 0.852 0.224 1.000 0.000
Nutrition 0.001 0.000 0.585 0.396
Normal nutrition - 1.000 1.000 1.000
Third space 0.000 0.001 0.336 0.000
Table 4.72 Comparisons of Main Bioimpedance Parameters after Treatment for
Male BMI group 1.
Main Bioimpedance Parameters
Overall (p) BMI (P) No of
treatment
(p)
Diseases
Grp(p)
Impedance value at 5KHz 0.001 0.031 0.482 0.000
Impedance value at 50KHz 0.001 0.016 0.553 0.001
Impedance value at 100KHz 0.002 0.015 0.512 0.001
Impedance value at 200KHz 0.003 0.015 0.497 0.001
Reactance at 50KHz 0.007 0.000 0.562 0.733
Resistance at 50KHz 0.002 0.000 0.550 0.001
Phase Angle at 50 KHz 0.058 0.016 0.350 0.012
Basal metabolic rate 0.079 0.000 0.221 0.299
Intracellular water 0.693 0.000 0.383 0.147
Normal value of intracellular
water
0.345 0.000 0.217 0.781
Extra-cellular water 0.753 0.000 0.278 0.073
Normal extra cellular water 0.710 0.000 0.217 0.790
Total body water volume 0.582 0.000 0.333 0.048
Min total body water volume 0.011 0.000 0.232 0.769
Max total body water volume 0.182 0.000 0.209 0.799
Body cell mass 0.698 0.000 0.384 0.150

84
Table 4.73 Comparisons of Secondary Bioimpedance Parameters after Treatment
for Male BMI group 1.
Secondary Bioimpedance Parameters Overall (p) BMI
(p)
No of
treatment (p)
Diseases
Grp(p)
Percentage of fat 0.246 0.577 0.719 0.000
Min fat 0.235 0.000 0.286 0.094
Max fat 0.633 0.000 0.116 0.645
Percentage of lean 0.246 0.577 0.719 0.000
Min lean 0.160 0.000 0.237 0.249
Max lean 0.204 0.000 0.202 0.347
Dry lean weight 0.047 0.000 0.159 0.917
Percentage of water 0.347 0.000 0.199 0.001
Min water 0.011 0.000 0.232 0.769
Max water 0.182 0.000 0.209 0.799
Density 0.852 0.000 1.000 0.000
Nutrition 0.000 0.000 0.448 0.237
Normal nutrition - 0.224 1.000 1.000
Third space 0.001 0.000 0.548 0.000

85
4.5 Interaction of Bioimpedance Parameters with Demographic Variables.
In this section the interaction of Bioimpedance Parameters with demographic
variables such as gender, occupation, diseases, number of treatment are shown. The
significance value of P should be less than 5%. These interaction of the parameter is
investigate further to see the relationship between them.
4.5.1 Interaction of Bioimpedance Parameters with Patient’s Gender.
According to gender the interaction between age group, BMI group and diseases
groups for the main and secondary bioimpedance parameters before and after test are
shown here. The value of P is valid when p <0.05.
Table 4.102 Interaction of Main Bioimpedance Parameters before Treatment for
Female.
Main Bioimpedance Parameters Age Grp(p) BMI Grp (p) Disease (p)
Impedance value at 5KHz 0.000 0.000 0.000
Impedance value at 50KHz 0.000 0.000 0.000
Impedance value at 100KHz 0.000 0.000 0.000
Impedance value at 200KHz 0.000 0.000 0.000
Reactance at 50KHz 0.000 0.000 0.000
Resistance at 50KHz 0.000 0.000 0.000
Phase Angle at 50 KHz 0.000 0.000 0.032
Basal metabolic rate 0.000 0.000 0.000
Intracellular water 0.000 0.000 0.000
Normal intracellular water 0.000 0.000 0.000
Extra-cellular water 0.000 0.000 0.000
Normal extra cellular water 0.000 0.000 0.000
Total body water volume 0.000 0.000 0.000
Min total body water volume 0.000 0.000 0.000
Max total body water volume 0.000 0.000 0.000
Body cell mass 0.000 0.000 0.000
86
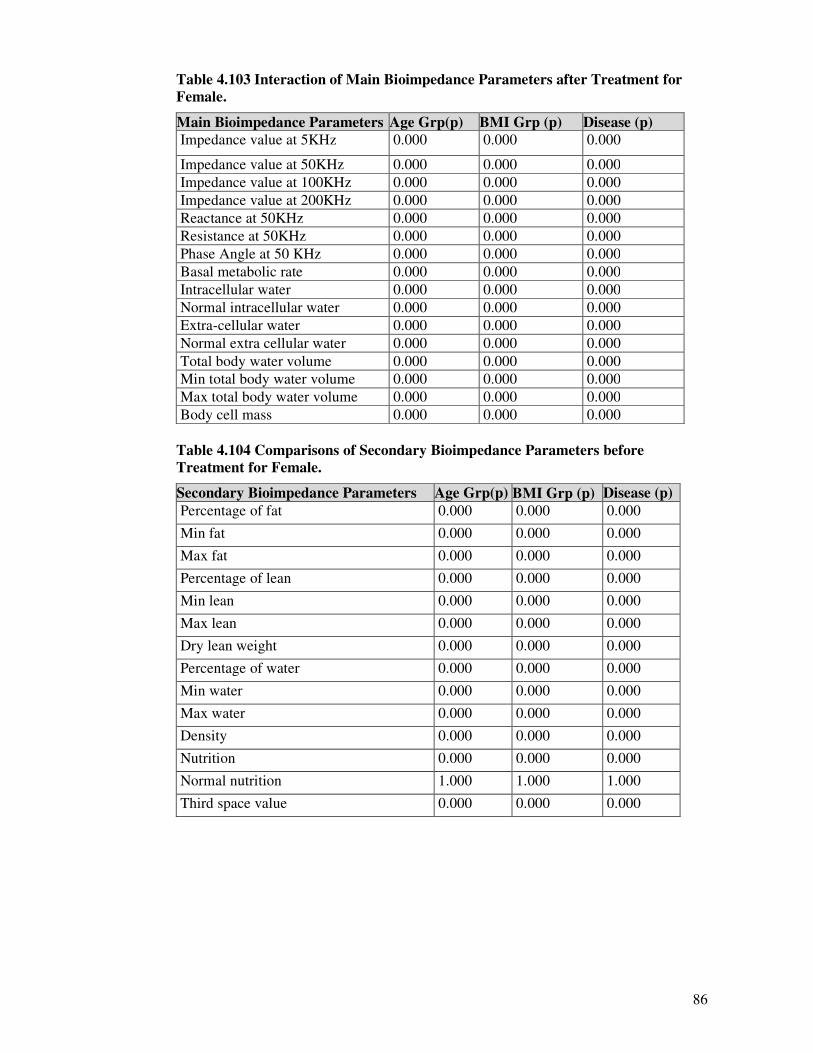
Table 4.103 Interaction of Main Bioimpedance Parameters after Treatment for
Female.
Main Bioimpedance Parameters Age Grp(p) BMI Grp (p) Disease (p)
Impedance value at 5KHz 0.000 0.000 0.000
Impedance value at 50KHz 0.000 0.000 0.000
Impedance value at 100KHz 0.000 0.000 0.000
Impedance value at 200KHz 0.000 0.000 0.000
Reactance at 50KHz 0.000 0.000 0.000
Resistance at 50KHz 0.000 0.000 0.000
Phase Angle at 50 KHz 0.000 0.000 0.000
Basal metabolic rate 0.000 0.000 0.000
Intracellular water 0.000 0.000 0.000
Normal intracellular water 0.000 0.000 0.000
Extra-cellular water 0.000 0.000 0.000
Normal extra cellular water 0.000 0.000 0.000
Total body water volume 0.000 0.000 0.000
Min total body water volume 0.000 0.000 0.000
Max total body water volume 0.000 0.000 0.000
Body cell mass 0.000 0.000 0.000
Table 4.104 Comparisons of Secondary Bioimpedance Parameters before
Treatment for Female.
Secondary Bioimpedance Parameters Age Grp(p) BMI Grp (p) Disease (p)
Percentage of fat 0.000 0.000 0.000
Min fat 0.000 0.000 0.000
Max fat 0.000 0.000 0.000
Percentage of lean 0.000 0.000 0.000
Min lean 0.000 0.000 0.000
Max lean 0.000 0.000 0.000
Dry lean weight 0.000 0.000 0.000
Percentage of water 0.000 0.000 0.000
Min water 0.000 0.000 0.000
Max water 0.000 0.000 0.000
Density 0.000 0.000 0.000
Nutrition 0.000 0.000 0.000
Normal nutrition 1.000 1.000 1.000
Third space value 0.000 0.000 0.000

87
Table 4.105 Interactios of Secondary Bioimpedance Parameters after Treatment
for Female.
Secondary Bioimpedance Parameters Age Grp(p) BMI Grp (p) Disease (p)
Percentage of fat 0.000 0.000 0.000
Min fat 0.000 0.000 0.000
Max fat 0.000 0.000 0.000
Percentage of lean 0.000 0.000 0.000
Min lean 0.000 0.000 0.000
Max lean 0.000 0.000 0.000
Dry lean weight 0.000 0.000 0.000
Percentage of water 0.001 0.000 0.000
Min water 0.000 0.000 0.000
Max water 0.000 0.000 0.000
Density 0.000 0.000 0.000
Nutrition 0.000 0.000 0.000
Normal nutrition 1.000 1.000 1.000
Third space value 0.002 0.000 0.000
Table 4.106 Interaction of Main Bioimpedance Parameters before Treatment for
Male.
Main Bioimpedance Parameters Age Grp(p) BMI Grp (p) Diseases (p)
Impedance value at 5KHz 0.000 0.000 0.003
Impedance value at 50KHz 0.000 0.000 0.005
Impedance value at 100KHz 0.000 0.000 0.007
Impedance value at 200KHz 0.000 0.000 0.010
Reactance at 50KHz 0.000 0.050 0.000
Resistance at 50KHz 0.000 0.000 0.006
Phase Angle at 50 KHz 0.000 0.000 0.000
Basal metabolic rate 0.004 0.000 0.686
Intracellular water 0.000 0.000 0.004
Normal intracellular water 0.000 0.000 0.000
Extra-cellular water 0.000 0.000 0.004
Normal extra cellular water 0.000 0.000 0.000
Total body water volume 0.000 0.000 0.006
Min total body water volume 0.000 0.000 0.001
Max total body water volume 0.000 0.000 0.000
Body cell mass 0.000 0.000 0.004

88
Table 4.107 Interaction of Main Bioimpedance Parameters after Treatment for
Male.
Main Bioimpedance Parameters Age Grp(p) BMI Grp (p) Diseases (p)
Impedance value at 5KHz 0.000 0.000 0.004
Impedance value at 50KHz 0.000 0.000 0.008
Impedance value at 100KHz 0.001 0.000 0.009
Impedance value at 200KHz 0.001 0.000 0.010
Reactance at 50KHz 0.000 0.415 0.000
Resistance at 50KHz 0.000 0.000 0.009
Phase Angle at 50 KHz 0.000 0.000 0.002
Basal metabolic rate 0.001 0.000 0.785
Intracellular water 0.000 0.000 0.004
Normal intracellular water 0.000 0.000 0.000
Extra-cellular water 0.000 0.000 0.005
Normal extra cellular water 0.000 0.000 0.000
Total body water volume 0.000 0.000 0.007
Min total body water volume 0.000 0.000 0.001
Max total body water volume 0.000 0.000 0.000
Body cell mass 0.000 0.000 0.004
Table 4.108 Interactions of Secondary Bioimpedance Parameters before
Treatment for Male.
Secondary Bioimpedance Parameters Age Grp(p) BMI Grp (p) Disease (p)
Percentage of fat 0.000 0.000 0.000
Min fat 0.000 0.000 0.000
Max fat 0.000 0.000 0.000
Percentage of lean 0.000 0.000 0.000
Min lean 0.002 0.000 0.205
Max lean 0.001 0.000 0.152
Dry lean weight 0.000 0.000 0.234
Percentage of water 0.000 0.000 0.000
Min water 0.000 0.000 0.001
Max water 0.000 0.000 0.000
Density 0.000 0.000 0.000
Nutrition 0.000 0.000 0.000
Normal nutrition 1.000 1.000 1.000
Third space value 0.000 0.000 0.001

89
Table 4.109 Interactions of Secondary Bioimpedance Parameters after Treatment
for Male.
Secondary Bioimpedance Parameters Age Grp(p) BMI Grp (p) Disease (p)
Percentage of fat 0.000 0.000 0.000
Min fat 0.000 0.000 0.000
Max fat 0.000 0.000 0.000
Percentage of lean 0.000 0.000 0.000
Min lean 0.002 0.000 0.260
Max lean 0.001 0.000 0.234
Dry lean weight 0.000 0.000 0.230
Percentage of water 0.001 0.000 0.000
Min water 0.000 0.000 0.001
Max water 0.000 0.000 0.000
Density 0.000 0.000 0.000
Nutrition 0.000 0.000 0.000
Normal nutrition 1.000 1.000 1.000
Third space value 0.002 0.000 0.000
4.5.2 Interaction of Bioimpedance Parameters with Patient’s Age Group.
According to Age group the interaction between gender, BMI group and
diseases groups for the main and secondary bioimpedance parameters before and after
test are shown here. The value of P is valid when p < 0.05.
Table 4.110 Interaction of Main Bioimpedance Parameters before Treatment for
Age Group1.
Main Bioimpedance Parameters Gender (p) BMI group (p) Disease (p)
Impedance value at 5KHz 0.001 0.000 0.005
Impedance value at 50KHz 0.001 0.000 0.017
Impedance value at 100KHz 0.002 0.000 0.023
Impedance value at 200KHz 0.003 0.000 0.027
Reactance at 50KHz 0.007 0.000 0.000
Resistance at 50KHz 0.002 0.000 0.018
Phase Angle at 50 KHz 0.058 0.000 0.586
Basal metabolic rate 0.079 0.000 0.160
Intracellular water 0.693 0.000 0.120
Normal intracellular water 0.345 0.000 0.001
Extra-cellular water 0.753 0.000 0.003
Normal extra cellular water 0.710 0.000 0.037
Total body water volume 0.582 0.000 0.079
Min total body water volume 0.011 0.000 0.000
Max total body water volume 0.182 0.000 0.000
Body cell mass 0.698 0.000 0.124

90
Table4.111 Interaction of Main Bioimpedance Parameters after Treatment for Age
Group1.
Main Bioimpedance Parameters Gender (p) BMI group (p) Disease (p)
Impedance value at 5KHz 0.001 0.000 0.005
Impedance value at 50KHz 0.001 0.000 0.017
Impedance value at 100KHz 0.002 0.000 0.023
Impedance value at 200KHz 0.003 0.000 0.027
Reactance at 50KHz 0.007 0.000 0.000
Resistance at 50KHz 0.002 0.000 0.018
Phase Angle at 50 KHz 0.058 0.000 0.586
Basal metabolic rate 0.079 0.000 0.160
Intracellular water 0.693 0.000 0.120
Normal intracellular water 0.345 0.000 0.001
Extra-cellular water 0.753 0.000 0.003
Normal extra cellular water 0.710 0.000 0.037
Total body water volume 0.582 0.000 0.079
Min total body water volume 0.011 0.000 0.000
Max total body water volume 0.182 0.000 0.000
Body cell mass 0.698 0.000 0.124
Table 4.112 Comparisons of Secondary Bioimpedance Parameters before
Treatment for Age Group1.
Secondary Bioimpedance Parameters Gender (p) BMI group (p) Disease (p)
Percentage of fat 0.294 0.000 0.000
Min fat 0.186 0.000 0.000
Max fat 0.439 0.000 0.000
Percentage of lean 0.294 0.000 0.000
Min lean 0.244 0.000 0.160
Max lean 0.246 0.000 0.157
Dry lean weight 0.049 0.000 0.421
Percentage of water 0.575 0.000 0.000
Min water 0.011 0.000 0.000
Max water 0.182 0.000 0.000
Density 0.852 0.000 0.000
Nutrition 0.001 0.000 0.928
Normal nutrition - 0.000 0.020
Third space value 0.000 0.000 0.000

91
Table 4.113 Interactions of Secondary Bioimpedance Parameters after Treatment
for Age Group1.
Secondary Bioimpedance Parameters Gender (p) BMI Grp (p) Disease (p)
Percentage of fat 0.246 0.000 0.000
Min fat 0.235 0.000 0.000
Max fat 0.633 0.000 0.000
Percentage of lean 0.246 0.000 0.000
Min lean 0.160 0.000 0.169
Max lean 0.204 0.000 0.142
Dry lean weight 0.047 0.000 0.444
Percentage of water 0.347 0.000 0.000
Min water 0.011 0.000 0.000
Max water 0.182 0.000 0.000
Density 0.852 0.000 0.000
Nutrition 0.000 0.000 0.941
Normal nutrition - 0.006 0.020
Third space value 0.001 0.000 0.000
4.5.3 Interaction of Bioimpedance Parameters with Age Patient BMI.
According to BMI group the interaction between gender, BMI group and
diseases groups for the main and secondary bioimpedance parameters before and after
test are shown here. The value of P is valid when p < 0.05.
Table 4.130 Interaction of Main Bioimpedance Parameters before Treatment for
BMI group1.
Main Bioimpedance Parameters Gender (p) Age Grp (p) Diseases (p)
Impedance value at 5KHz 0.004 0.001 0.00029
Impedance value at 50KHz 0.043 0.002 0.00077
Impedance value at 100KHz 0.122 0.004 0.00127
Impedance value at 200KHz 0.184 0.005 0.00187
Reactance at 50KHz 0.001 0.000 0.00000
Resistance at 50KHz 0.051 0.003 0.00084
Phase Angle at 50 KHz 0.045 0.513 0.33359
Basal metabolic rate 0.093 0.686 0.00001
Intracellular water 0.133 0.051 0.00019
Normal intracellular water 0.046 0.008 0.00012
Extra-cellular water 0.117 0.013 0.00000
Normal extra cellular water 0.017 0.014 0.00037
Total body water volume 0.053 0.022 0.00001
Min total body water volume 0.202 0.178 0.00000
Max total body water volume 0.068 0.017 0.00002
Body cell mass 0.142 0.053 0.00019

92
Table 4.131 Interaction of Main Bioimpedance Parameters after Treatment for
BMI group1.
Main Bioimpedance Parameters Gender (p) Age Grp (p) Diseases (p)
Impedance value at 5KHz 0.337 0.0005 0.0004
Impedance value at 50KHz 0.676 0.0023 0.0013
Impedance value at 100KHz 0.783 0.0036 0.0022
Impedance value at 200KHz 0.640 0.0047 0.0032
Reactance at 50KHz 0.039 0.0000 0.0000
Resistance at 50KHz 0.750 0.0025 0.0014
Phase Angle at 50 KHz 0.925 0.1267 0.2713
Basal metabolic rate 0.098 0.6976 0.0000
Intracellular water 0.140 0.0489 0.0002
Normal intracellular water 0.046 0.0083 0.0001
Extra-cellular water 0.201 0.0163 0.0000
Normal extra cellular water 0.017 0.0136 0.0004
Total body water volume 0.071 0.0242 0.0000
Min total body water volume 0.202 0.1776 0.0000
Max total body water volume 0.068 0.0170 0.0000
Body cell mass 0.131 0.0481 0.0002
Table 4.132 Interactions of Secondary Bioimpedance Parameters before
Treatment for BMI group1.
Secondary Bioimpedance Parameters Gender (p) Age Grp (p) Disease (p)
Percentage of fat 0.744 0.123 0.0000
Min fat 0.613 0.003 0.0000
Max fat 0.273 0.004 0.0002
Percentage of lean 0.744 0.123 0.0000
Min lean 0.218 0.031 0.0000
Max lean 0.252 0.032 0.0000
Dry lean weight 0.008 0.040 0.0000
Percentage of water 0.000 0.000 0.0196
Min water 0.202 0.178 0.0000
Max water 0.068 0.017 0.0000
Density 0.228 0.269 0.0000
Nutrition 0.708 0.463 0.0605
Normal nutrition - 0.109 0.0076
Third space value 0.000 0.000 0.0064

93
Table 4.133 Interactions of Secondary Bioimpedance Parameters after Treatment
for BMI group1.
Secondary Bioimpedance Parameters Gender (p) Age Grp (p) Disease (p)
Percentage of fat 0.766 0.114 0.0000
Min fat 0.613 0.003 0.0000
Max fat 0.273 0.004 0.0002
Percentage of lean 0.766 0.114 0.0000
Min lean 0.167 0.018 0.0000
Max lean 0.221 0.020 0.0000
Dry lean weight 0.009 0.039 0.0000
Percentage of water 0.003 0.000 0.0349
Min water 0.202 0.178 0.0000
Max water 0.068 0.017 0.0000
Density 0.740 0.250 0.0000
Nutrition 0.708 0.475 0.0943
Normal nutrition 0.000 0.109 0.0076
Third space value 0.766 0.000 0.0081
4.5.4 Interaction of Bioimpedance Parameters with Patient Disease.
According to Diseases group the interaction between gender, BMI group and
age groups for the main and secondary bioimpedance parameters before and after test
are shown here. The value of P is valid when p < 0.05. For analysis from diseases group
only arthritis, high blood pressure,, diabetes, migraine and stoke patients are chosen.
Table 4.150 Interaction of Main Bioimpedance Parameters before Treatment for
diseases group 1.
Main Bioimpedance Parameters Gender (p) Age Grp (p) BMI Grp(p)
Impedance value at 5KHz 0.104 0.273 0.000
Impedance value at 50KHz 0.101 0.340 0.000
Impedance value at 100KHz 0.126 0.390 0.000
Impedance value at 200KHz 0.182 0.446 0.000
Reactance at 50KHz 0.020 0.000 0.062
Resistance at 50KHz 0.105 0.348 0.000
Phase Angle at 50 KHz 0.746 0.225 0.000
Basal metabolic rate 0.161 0.715 0.000
Intracellular water 0.182 0.143 0.000
Normal intracellular water 0.287 0.209 0.000
Extra-cellular water 0.069 0.041 0.000
Normal extra cellular water 0.112 0.174 0.000
Total body water volume 0.008 0.054 0.000
Min total body water volume 0.070 0.156 0.000
Max total body water volume 0.221 0.185 0.000
Body cell mass 0.188 0.145 0.000

94
Table 4.151 Interaction of Main Bioimpedance Parameters after Treatment for
diseases group 1.
Main Bioimpedance Parameters Gender (p) Age Grp (p) BMI Grp(p)
Impedance value at 5KHz 0.078 0.300 0.000
Impedance value at 50KHz 0.088 0.391 0.000
Impedance value at 100KHz 0.074 0.447 0.000
Impedance value at 200KHz 0.108 0.509 0.000
Reactance at 50KHz 0.431 0.000 0.000
Resistance at 50KHz 0.088 0.403 0.000
Phase Angle at 50 KHz 0.363 0.070 0.000
Basal metabolic rate 0.108 0.989 0.000
Intracellular water 0.285 0.359 0.000
Normal intracellular water 0.287 0.209 0.000
Extra-cellular water 0.150 0.330 0.000
Normal extra cellular water 0.112 0.174 0.000
Total body water volume 0.035 0.336 0.000
Min total body water volume 0.070 0.156 0.000
Max total body water volume 0.221 0.185 0.000
Body cell mass 0.270 0.365 0.000
Table 4.152 Interactions of Secondary Bioimpedance Parameters before
Treatment for Diseases group 1.
Secondary Bioimpedance Parameters Gender (p) Age Grp (p) BMI Grp (p)
Percentage of fat 0.009 0.533 0.027
Min fat 0.406 0.009 0.000
Max fat 0.301 0.167 0.000
Percentage of lean 0.009 0.533 0.027
Min lean 0.068 0.260 0.000
Max lean 0.099 0.361 0.000
Dry lean weight 0.513 0.958 0.000
Percentage of water 0.468 0.651 0.000
Min water 0.070 0.156 0.000
Max water 0.221 0.185 0.000
Density 0.001 0.219 0.059
Nutrition 0.000 0.654 0.000
Normal nutrition - 0.160 0.014
Third space value 0.787 0.003 0.001

95
Table 4.153 Interactions of Secondary Bioimpedance Parameters after Treatment
for diseases group 1.
Secondary Bioimpedance Parameters Gender (p) Age Grp (p) BMI Grp (p)
Percentage of fat 0.017 0.161 0.054
Min fat 0.059 0.109 0.000
Max fat 0.533 0.482 0.054
Percentage of lean 0.017 0.161 0.000
Min lean 0.187 0.541 0.000
Max lean 0.132 0.665 0.000
Dry lean weight 0.462 0.927 0.000
Percentage of water 0.624 0.688 0.000
Min water 0.070 0.156 0.000
Max water 0.221 0.185 0.000
Density 0.003 0.050 0.082
Nutrition 0.000 0.388 0.000
Normal nutrition - 0.160 0.014
Third space value 0.088 0.809 0.001

96
CHAPTER FIVE
DISCUSSION
5.1 Demographic analysis
The demographic analysis was done and depicted clearly in the previous chapter
by the bar charts for all the independent parameter which are categorized as gender,
marital status, age, occupations, number of treatment, subject’s activity and BMI
readings.
For a bar graph, the information that could be extracted are the comparison
between groups of data and make a generalization or simple conclusion about the data
in a glance. From the first bar graph of figure 4.1, the females are the dominating gender
in getting a leech therapy treatment as more than half of the patients are females. This
could be affected by many factors as women are prone to any treatment for cosmetic
improvement, and more health conscious than men. In Singapore, a study by ministry of
health showed that there is a significance difference between male and female health
practices that strike out female with the better overall health behavior (A.V., Chua,
2009).
In addition, those who are single also are more than half of the total patient.
Even in a study about the healthy lifestyle of vegetarian, the demographic data of the
marital status gives a significance difference in the distribution where most of them are
single (Bedford, J., Barr, S. I., 2005). However, there are no specific study on the effect
of the marital status and leech therapy.
From figure 4.3, there are a huge gap for those who are younger that fall within
the range of less than or equal 30 years old with those who are older or equal to 31 years
old. It means a deduction can be made of younger people are willing to try alternative
way for cure than older generations. This can be compared to the study of the age

97
related differences in complimentary medicine. It was concluded that the use of
complementary medicine is stronger among midlife and younger adults rather than older
adults (Grzywacz, J.G., et al,, 2007).
The occupations of the subject are also taken into account where there are 2
obvious frequencies which belong to the category of students and private sector worker.
This might due to many reasons as it can be deducted that level of stress is always
associated with the job of the participants. Higher stress could harm the health level and
students are also having a higher risk which involve problems in study or peer stress.
In addition, the information on the subject’s involvement in the treatment is also
recorded where there is a clear trend that notes on the treatment is done for a first timer.
This might be because of the center itself which promote the treatment so that it can
reach more people in experiencing the new sensation of alternative medicine treatment
that rarely commercialized.
Besides that, the profile of the subject is also collected by the information on
daily activity of subject. Most of the participants were having a medium level of activity
where this can be related by the majority of the public sector worker and students
involvement in this study. These groups of people are mostly engage in activity that
sufficient to be characterized as average rather than unemployed subject that has
minimal use of body daily.
Also, the BMI index for both before and after the treatment remain the same as
BMI is hardly changes over a short period of time. Thus, from the data it is found that
most of the participants are healthy which ranges from 20 to 25. Nevertheless, there are
also participants which need an extra reminder on health level based on their current
BMI.
The standard BMI chart is divided into 3 main categories which are
underweight, normal and overweight. Thus the distributions of the sampling of

98
participants are considered majority normal since obesity is not a big factor in
determining the course of leech therapy treatment.
5.2.0 Descriptive statistics analysis
5.2.1 Relationship between characteristics of descriptive statistic
Descriptive statistics is an analysis which describes the attribute of grouped data.
The main features of the bioimpedance parameter can be used to describe the
distribution, central tendency and the dispersion of the data. The distribution of the
collected data already had been discussed in the previous topic where the demographic
data gives the general overview of the distribution from the bar graphs frequency.
However another value that can depict the distribution of the data is kurtosis. It
measures the shape of the peak that could be described as flat or sharp peak. Higher
value of kurtosis will give the description of the peak of the distribution that tends to be
pointed than normal distribution and the opposite for lower value of kurtosis.
Accordingly, the central tendency of the bioimpedance parameter is calculated
by the statistical tool namely expected value or also knows as mean or average. The
mean will gives the center of distribution of values which are common within the data.
In other words, the characteristics could be use to make a general conclusion about the
distribution.
Also, the dispersion characteristics can be described by the value of the standard
deviation and variance. However, standard deviation is more common to see the
dispersion of the data. Significantly, variance could be associated with the kurtosis
where if the value of the kurtosis is higher it means that the value of the variance is
inversely decreasing.

99
5.2.2 Bioimpedance parameter distribution characteristics
From the overall characteristics of the bioimpedance parameter, the 50 kHz
impedance readings give a trend that shows the changes before and after treatment of
leech therapy. It is found that the overall characteristic of the main and secondary
bioimpedance parameter are increasingly towards a better level. This is proven from the
increasing mean value from the measurement of both parameters before and after the
treatment.
Moreover, to compare the attributes of gender towards the parameter gives a
result where the impedance mean of the female is much higher than the impedance of
male. In contrast, the dispersion value of data from the standard deviation shows that
data for male are less disperses than female. The impedance value for male is normally
higher than female but contradict the normality due to the sample size and the range of
age is higher for male than female.
Furthermore, the BMI group characterization shows that the bioimpedance
parameter also shows positive increasing result. This is again depicted by the increasing
mean value of the parameter before and after the treatment. In addition, as the
comparison is done between all the 5 groups, it is identified that the impedance value is
decreasing as the BMI group increases. The increasing value of BMI group indicates the
effect of leech treatment follow the group of patient that are categorize as underweight
subject to overweight subject. Thus, it is normal to the assumption that overweight
person has higher fat and so affecting the impedance value to become lower than the
normal person.

100
5.3 Analysis of bioimpedance parameter
The result from the section 4.3 is basically showing the significance value of
main and secondary bioimpedance parameter before and after the treatment. This is
important to analyze as the significance value for the pair t-test can tell the effect of
before treatment and after treatment will gives any difference in mean value or no
changes at all.
The desired result is to see that the mean value of the parameter of this treatment
will change after the therapy. Therefore, it is shown that for p < 0.05 gives the outcome
that there is difference in mean before and after the treatment. Later part of the analysis
takes into the consideration of different independent factor that could affect the reading
before and after treatment. The tested parameters are gender, BMI groups, Disease
groups, occupation groups, age groups and number of treatment groups.
In gender difference, the impedance value at 50 kHz indicates accepted
significance value where both are less than 0.05. This is because the gender could
directly affect the reading of the bioimpedance parameter. For example like the fat
percentage from the previous discussion shows difference in mean before and after
treatment, it also has different value from female to male. Thus, this proved that it is
significance to classify the impedance value for both female and male in a different
range.
For BMI groups, it is positively showing the p value that accept the difference in
mean for different subject group that is classified with 5 different groups of BMI.
However BMI group 4 did not bring any significance value before and after the
treatment. This could be affected by the sampling size of the BMI group 4 and
distribution of gender group with BMI group 4.
The problem of sampling size also affects the p value of age groups. It is
insignificant for group age 3 but significant for the rest of the group. Thus, it shows that

101
older people and younger people has different value of bioimpedance parameter and
significantly will have diverse readings if the body composition is tested before and
after the leech treatment.
In extension, the impedance value at 50 kHz denotes significant value for
different disease group. A deduction can be made where not only treatment is different,
the body composition of the patient will also be poles apart from one disease to another.
However, the occupation groups’ show accepted value of different mean for all
group except for group 3. Even the sample size is quite big, the varieties and diversities
of occupation in group 3 must be taken into account. Since the daily activities also
affecting the type of job that patients are involve in, private sector group could be more
detailed based on the level of activeness. This is because, subject that require higher
level of fitness will have different body composition than some other job that also fall
under the category of private sector.
The number of treatment group also show effect to the reading of before and
after the treatment of leech therapy. The significance value shows that first time patient
will experience different body composition measurement than the second or third.
However, this analysis does not cover the duration of one treatment to another
treatment.

102
5.4 Comparison between bioimpedance parameter
The comparison of bioimpedance parameter can also be analyzed in detail
within the same age groups and BMI groups. These 2 factors are chosen as it has
significant effect to the bioimpedance parameter both primary and secondary. In terms
of age group 1, there are significant different if it compare with BMI and disease
groups. However, the number of treatment can’t be compared due to insufficient
parameter for the analysis.
This is different with the patient with age group 2 where the majority of the data
are representative thus giving it possible value to be analyzed and compared with BMI,
number of treatment and disease groups. In contrast, the comparison for age group 3 is
not possible since it has fewer patients and a lot of missing data. Furthermore, there is
no male subject that falls under the category of age group 3. Also, the independent t-test
is not possible to key in since gender group has only 1 mean.
In the analysis of age group 4 which is between 41 to 50 are also majority
unavailable since the female group that fall under this category is none. Thus,
comparison failed to be done. Only male has some comparison value with BMI and
disease group. For age group 5, the male gender has more significant value if to be
compared to the bioimpedance analysis. Female are mostly insignificant if to be
compared to all the bioimpedance parameter.
Overall comparison of bioimpedance parameter within the same BMI groups
also shows not many that are significant. In contrary, for BMI group 2 which are the
majority data gives a positive result where the comparison between those measurements
that falls under this category is significant. However, since the comparison is more
detail than the previous discussion, it is found that most of the tables are empty due to
not enough data for the analysis.

103
5.5 Interaction of bioimpedance parameters with demographic variable
In this analysis, the demographic variable that has been discussed earlier is look
into details where the bioimpedance parameters that are affecting the results were
studied. In this topic, the variables that are affecting the main and secondary
bioimpedance parameter are gender, age, BMI and disease groups.
For interaction of the bioimpedance parameter with the age, BMI and disease
group based on gender it is proven that there are significance value that shows all the
interaction have different effect. Whether it is male or female, the value can be further
classified with different category of patient based on their age group, BMI group and
disease group. This is because percentage of fat or fat free mass could be varies in
different individuals as female and male has diverse category of patients.
Furthermore, the interactions between Age group and gender, BMI group and
disease group also show value of p < 0.05. This denotes that all of them are significant
except for age group 5. Those with age group 5 could have the same value of mean for
all their interactions with gender, BMI groups and disease groups. There’s a lot of factor
that affecting this age group since it is define for age that is more than 50 years old. In
term of gender, BMI group and disease group, those who are in this age have almost an
equal average value. Moreover, those who are more than 50 tend to have similar daily
activities and similar group of diseases.
For BMI groups’ interaction, it is found that BMI group 1 has no significant
effect toward gender and age groups. However, they are mostly affected by factor of
disease groups. Group2 and group 3 BMI have more significant interaction with the
demographic variables. This is again because of the diversity of range for a normal BMI
groups that are assumes healthy in terms of their ratio of weight and height. However,
those patient in BMI group 5 which experience obesity or overweight has different
value of effect on age and disease except their gender. Moreover, it could also because

104
of number of sampling or due to non-sampling error because of some limitations in
taking the measurement for overweight patient.
Finally, the interactions of disease group show different kind of result. For those
subject with sinus does not show any significant difference in terms of their gender and
age. The only factor that has value of p < 0.05 is available for BMI groups. This is
different with those patient with acne problem where their body composition different
in term of gender and age only. This is more obvious for the second bioimpedance
parameter analysis. Moreover, those with eczema and get treated for detoxifying
process shows all changes before and after the treatment. Since other illness for group 6
has small sample value, it is showing no significant difference before and after the
treatment.

105
CHAPTER SIX
CONCLUSION
From the study it is known that the bioimpedance parameter changes with
demographic variables and it shows some significant result. The characteristics of the
bioimpedance analysis has been analyze in many ways to see the relationship,
interactions and comparison between the data. It is known that overall, the leech therapy
treatment has a significant effect to the human body composition. Summarizing the
analysis, the human body compositions do change after a treatment is done.
Some limitations of the study is the bioimpedance machine that is limited and a
lot of time has to allocate just for machine reservation. Besides, the sampling is not
sufficient given the time and amount of therapy center in Malaysia.
However, this study could be further improvised and a lot of factor can be taken
into consideration to see more significant effect of leech therapy to human body.

106
References:
Adams, J.E., (2003). Dual-energy X-ray absorptiometry. Grampp S (Ed.). Berlin
Heidelberg- New York: Springer.
Adams, S.L., (1988). The medicinal leech. A page from the annelids of internal
medicine. Annals of International Medicine, 109, 399-405.
Amrit, P.S., (2010). Medicinal leech therapy (Hirudotherapy): A brief overview.
Complementary Therapies in Clinical Practice, 213-215.
Aziz, R. A., Sarmidi, M. R., Kumaresan, S., and Foo, D. C. Y. (2005). Engineering
Aspects of Herbal and Phytochemical Processing: A Malaysian Perspective.
Bulletin of Institution of Engineers, Malaysia (IEM), 2005(12): 10-19
(December 2005).
Bhanganada, K., Chayavatana, T., Pongnumkul, C., Tonmukayakul, A.,
Sakolsatayadorn, P., Komaratat, K., (1983). Surgical management of an
epidemic of penile amputations in Siam. American Journal of Surgery, 146,
376-382.
Baumgartner, R.N., Chumlea, W.C., Roche, A.F., (1989). Estimation of body
composition from segmental impedance. American Journal of Clinical Nutrition,
50, 221
Blake, G.M., Wahner, H.W., Fogelman, I., (1999). The evaluation of osteoporosis: dual
energy X-ray absorptiometry and ultrasound in clinical practice. London: Martin
Dunitz.
107
Boileau, R.A., Lohman, T.G., (1977). The measurement of human physique and its
effect on physical performance. The Orthopedics Clinics of North America, 8,
563.
Brodie, D.A., Slade, P.D., (1990). Dietary versus healthy life style interventions in the
treatment of obesity: resultant changes and the prediction of outcome.
Psychology and Health, 4, 319.
Brodie, M.J., Moscrip, V., Hutcheson, R., (1998). Body composition measurement: a
review of hydrodensitometry, anthropometry, and impedance methods. Nutrition,
14, 296–310.
Brooks, R.A., DiChiro, G., (1975). Theory of image reconstruction in computed
tomography. Radiology, 17(56), 1-72.
Cassileth, B. R., Schraub, S., Robinson, E. and Vickers, A., (2001). Alternative
medicine use worldwide. Cancer, 91, 1390–1393.
Chepeha, D.B., Nussenbaum, B., Bradford, C.R., Teknos, T.N., (2002). Leech therapy
for patients with surgically unsalvageable venous obstruction after
revascularized free tissue transfer. Archive of Otolaryngology- Head and Neck
Surgery,128, 960–965.
Efferth, T., Li, P.C., Konkimalla, V.S., Kaina, B., (2007). From traditional Chinese
medicine to rational cancer therapy. Trends in Molecular Medicine, 13, 353–361.
Engemann, J. F. and Hegner, R. W., (1981). Phylum annelida, class III: Hirudo
medicinalis, the medical leech. In: Invertebrate Zoology (3rd edn). New York,
NY, MacMillan.
108
Eroglu, C., Hokelek, M., Guneren, E., Esen., S., Pekbay, A., Uysal, O.A., (2001).
Bacterial flora of Hirudo medicinalis and their antibiotic sensitivities in the
Middle Black Sea Region, Turkey. Annals of Plastic Surgery, 47, 70-73.
Fields, W.S., (1991). The history of leeching and hirudin. Haemostasis, 21, 3-10.
Gawler, I., (1984). You can conquer cancer: Prevention and management. Melbourne,
Victoria: Hill of Content Publishing.
Grossman, M.D., Karlovitz, A., (1998). Lingual trauma: The use of medicinal leeches in
the treatment of massive lingual hematoma. Journal of Trauma, 44, 1083-1085.
Heckmann, J.G., Dutsch, M., Neundorfer, B., Dutsch, F., Hartung, U., (2005). Leech
therapy in the treatment of median nerve compression due to forearm
haematoma. Journal of Neurology, Neurosurgical and Psychiatry, 76, 1465.
Heyward, V.H., Stolarczyk, L.M. (1996). Applied body composition assessment (2nd
ed.). Champaigne, IL: Human Kinetics.
Hullett, J.S., Spinnato, G.G., Ziccardi, V., (2007). Treatment of an ear laceration with
adjunctive leech therapy: A case report. Journal of Oral Maxillofacial Surgery,
65, 2112-2114.
Irish, J.C., Gullane, P.J., Mulholland, S, Neligan, P.C., (2000). Medicinal leech in head
and neck reconstruction. Journal Otolaryngology, 29, 327-332.
Janet, P.W., (1998), K536 Assessment of Body Fat, Retrieved from
http://www.iub.edu/~k536/measure.html

109
Jebb, S.A., Cole, T.J., Doman, D., Murgatroyd, P.R., Prentice, A.M., (2000). Evaluation
of the novel Tanita body-fat analyser to measure body composition by
comparison with a four-compartment model. British Journal of Nutrition, 83,
115–122.
Jonas, W.B., Kaptchuk, T.J., Linde, K., (2003). A critical overview of homeopathy.
Annals of International Medicine, 138, 393–399.
King, S.B., (2005). Is surgery preferred for the diabetic with multivessel disease?
Surgery is preferred for the diabetic with multivessel disease. Circulation, 112,
1500-1507.
Kushner, R. F., (1992). Bioelectrical impedance analysis: A review of principles and
applications. Journal of the American College of Nutrition, 11, 199-209.
Kyle, U.G., Bosaeus, I., De Lorenzo, A.D., Deurenberg, P., Elia, M., Gomez, J.M.,
Heitmann, B.L., Kent-Smith, L., Melchior, J.C., Pirlich, M., (2004).
Bioelectrical impedance analysis-part I: review of principles and methods.
Clinical Nutrition, 23, 1226–1243.
Lent, C., (1986). New medical and scientific uses of the leech. Nature, 323, 494.
Lohman, T.G., Pollock, M.L., Slaughter, M.H., (1984). Methodological factors and the
prediction of body fat in female athletes. Medicine and Science in Sports and
Exercise, 16, 92
Lukaski, Bolonchuk, (1988). Formula for total body water. Aviation Space and
Environmental Medicine, 59, p. 1163-1169

110
McCullough, E.C., Payne, I.T., Baker, H.L. Jr., (1976). Performance evaluation and
quality assurance of computed tomography scanners, with illustrations from the
EMI, ACTA and Delta Scanners. Radiology, 120, 173-188.
Mineo, M., Jolley, T., Rodriguez, G., (2004). Leech therapy in penile replantation: A
case of recurrent penile self-amputation. Urology, 63, 981-983.
Mory, R.N., Mindell, D., Bloom, D.A., (2000). The leech and the physician: Biology,
etymology, and medical practice with Hirudinea medicinalis. World Jornal
Surgery, 24, 878-883.
Munshi, Y., Ara, I., Rafique, H., Ahmad, Z, (2008). Leeching in the history - a review.
Pakistan Journal of Biological Science, 11, 1650-1653.
Pettit, G.R., Ode, R.H., (1977). Antineoplastic agents: Isolation and characterization of
sphyrnastatins 1 and 2 from the hammerhead shark. Journal of Pharmacological
Science, 66, 757–758.
Piccoli, A., Nigrelli, S., Caberlotto, A., (1995). Bivariate normal values of the
bioelectrical impedance vector in adult and elderly populations. American
Journal Clinical of Nutrition, 61, 269 –270.
Piccoli, A., Pillon. L, Dumler, F., (2002). Impedance vector distribution by sex, race,
body mass index, and age in the United States: standard reference intervals as
bivariate Z scores. Nutrition, 18, 153– 167.
Povolny, B., (2008). Acupuncture and traditional Chinese medicine: an overview.
Techniques in Regional Anesthesia and Pain Management, 12 (2), 109-110.
Ribeiro, J. M. C., Garcia, E. S., (1981). Platelet antiaggregating activity in the salivary
secretion of the blood-sucking bug Rhodnius prolixus. Experentia 37, 384-386.

111
Scharfetter, H., Schlager, T., Stollberger, R., Felsberger, R., Hutten, H., Hinghofer-
Szalkay, H., (2001). Assessing abdominal fatness with local bioimpedance
analysis: basics and experimental findings. International Journal of Obesity and
Related Metabolic Disorder, 25, 502–511.
Schraub, S, (2000). Unproven methods in cancer: A worldwide problem. Support Care
Cancer, 8, 10-15.
Seidler, V., Linetskiy, I., Hubalkova, H., Stankova, H., Smucler, R., Mazanek, J.,
(2008). Ozone and its usage in general medicine and dentistry. A review article.
Prague Medical Report, 109, 5-13.
Senz, R., Müller, G., (1989). Laser in medicine. Berichte der Bunsengesellschaft für
physikalische Chemie, 93, 269–277.
Sloan, A.W., (1967). Estimation of body fat in young men. Journal of Applied
Physiology, 23, 311–315.
Sloan, A.W., Shapiro, M. A., (1972). Comparison of skinfold measurement with three
standard callipers. Human Biology, 44, 29.
Thomas, E.L., Saeed, N., Hajnal, J.V., (1998). Magnetic resonance imaging of total
body fat. Journal of Applied Physiology, 5(85), 1778-1785.
Utter, A.C., Nieman, D.C., Ward, A.N., Butterworth, D.E., (1999). Use of the leg-to-leg
bioelectrical impedance method in assessing body-composition change in obese
women. American Journal of Clinical Nutrition, 69, 603–607.
Valauri, F.A., (1991). The use of medicinal leeches in microsurgery. Blood Coagul
Fibrinolysis, 2, 185-187.

112
Webster, K.R., (n.d.). Dr. Moerman's Anti-Cancer Diet. Retrieved from
http://www.cancertutor.com/Cancer/Moerman.html.
World health organization, (2003). Introduction to drug utilization research. Oslo,
Norway.

113
Appendices
Appendix A: Statistical method
1. Bar graph using SPSS
2. Descriptive statistics using SPSS

114
3. Independent sample t-test using SPSS
4. Paired sample t-test using SPSS
5. ANOVA using SPSS

115
Appendix B:
Table 4.38 Comparisons of Main Bioimpedance Parameters before Treatment for
Female age group 2.
Main Bioimpedance Parameters Overall (p) BMI (P) No of
treatment (p)
Diseases
Grp(p)
Impedance value at 5KHz 0.058 0.000 0.000 0.000
Impedance value at 50KHz 0.030 0.000 0.000 0.000
Impedance value at 100KHz 0.031 0.000 0.000 0.000
Impedance value at 200KHz 0.026 0.000 0.000 0.000
Reactance at 50KHz 0.576 0.000 0.595 0.000
Resistance at 50K 0.029 0.000 0.000 0.000
Phase Angle at 50 KHz 0.026 0.000 0.000 0.005
Basal metabolic rate 0.016 0.000 0.000 0.000
Intracellular water 0.613 0.000 0.000 0.000
Normal value of intracellular
water
0.865 0.000 0.000 0.000
Extra-cellular water 0.374 0.000 0.000 0.000
Normal extra cellular water 0.378 0.000 0.000 0.000
Total body water volume 0.025 0.000 0.000 0.000
Min total body water volume 0.967 0.000 0.000 0.000
Max total body water volume 0.874 0.000 0.000 0.000
Body cell mass 0.634 0.000 0.000 0.000
Table 4.39 Comparisons of Secondary Bioimpedance Parameters before
Treatment for Female Age group 2.
Secondary Bioimpedance Parameters Overall (p) BMI
(p)
No of
treatment (p)
Diseases
Grp(p)
Percentage of fat 0.051 0.000 0.019 0.369
Min fat 0.092 0.000 0.466 0.000
Max fat 0.588 0.000 0.391 0.000
Percentage of lean 0.051 0.000 0.019 0.369
Min lean 0.005 0.000 0.169 0.000
Max lean 0.003 0.000 0.163 0.000
Dry lean weight 0.111 0.000 0.000 0.000
Percentage of water 0.298 0.000 0.001 0.343
Min water 0.967 0.000 0.000 0.000
Max water 0.874 0.000 0.000 0.000
Density 0.506 0.000 0.015 0.306
Nutrition 0.000 0.000 0.000 0.000
Normal nutrition - 1.000 1.000 1.000
Third space 0.018 0.000 0.001 0.041

116
Table 4.40 Comparisons of Main Bioimpedance Parameters after Treatment for
Female Age group 2.
Main Bioimpedance Parameters Overall (p) BMI (P) No of
treatment (p)
Diseases
Grp(p)
Impedance value at 5KHz 0.204 0.000 0.000 0.000
Impedance value at 50KHz 0.185 0.000 0.000 0.000
Impedance value at 100KHz 0.168 0.000 0.000 0.000
Impedance value at 200KHz 0.191 0.000 0.000 0.000
Reactance at 50KHz 0.724 0.000 0.100 0.000
Resistance at 50KHz 0.185 0.000 0.000 0.000
Phase Angle at 50 KHz 0.183 0.000 0.000 0.000
Basal metabolic rate 0.017 0.000 0.000 0.000
Intracellular water 0.504 0.000 0.000 0.000
Normal value of intracellular
water
0.865 0.000 0.000 0.000
Extra-cellular water 0.446 0.000 0.000 0.000
Normal extra cellular water 0.378 0.000 0.000 0.000
Total body water volume 0.036 0.000 0.000 0.000
Min total body water volume 0.967 0.000 0.000 0.000
Max total body water volume 0.874 0.000 0.000 0.000
Body cell mass 0.487 0.000 0.000 0.000
Table 4.41 Comparisons of Secondary Bioimpedance Parameters after Treatment.
For Female Age group 2.
Secondary Bioimpedance Parameters Overall (p) BMI
(p)
No of
treatment (p)
Diseases
Grp(p)
Percentage of fat 0.342 0.000 0.001 0.725
Min fat 0.006 0.000 0.418 0.000
Max fat 0.583 0.000 0.421 0.000
Percentage of lean 0.342 0.000 0.001 0.725
Min lean 0.025 0.000 0.194 0.000
Max lean 0.013 0.000 0.225 0.000
Dry lean weight 0.115 0.000 0.000 0.000
Percentage of water 0.154 0.000 0.000 0.200
Min water 0.967 0.000 0.000 0.000
Max water 0.874 0.000 0.000 0.000
Density 0.871 0.000 0.000 0.442
Nutrition 0.000 0.000 0.003 0.001
Normal nutrition - 1.000 1.000 1.000
Third space 0.280 0.000 0.000 0.046

117
Table 4.42Comparisons of Main Bioimpedance Parameters before Treatment for
male age group 2.
Main Bioimpedance Parameters Overall (p)
BMI (P)
No of
treatment (p)
Diseases
Grp(p)
Impedance value at 5KHz 0.058 0.000 0.001 0.003
Impedance value at 50KHz 0.030 0.000 0.001 0.002
Impedance value at 100KHz 0.031 0.000 0.001 0.001
Impedance value at 200KHz 0.026 0.000 0.001 0.001
Reactance at 50KHz 0.576 0.000 0.002 0.075
Resistance at 50KHz 0.029 0.000 0.001 0.002
Phase Angle at 50 KHz 0.026 0.000 0.089 0.000
Basal metabolic rate 0.016 0.000 0.031 0.000
Intracellular water 0.613 0.000 0.009 0.001
Normal value of intracellular
water
0.865 0.000 0.173 0.001
Extra-cellular water 0.374 0.000 0.003 0.005
Normal extra cellular water 0.378 0.000 0.189 0.001
Total body water volume 0.025 0.000 0.003 0.002
Min total body water volume 0.967 - 0.188 0.001
Max total body water volume 0.874 - 0.225 0.002
Body cell mass 0.634 0.000 0.009 0.001
Table 4.43 Comparisons of Secondary Bioimpedance Parameters before
Treatment for Male Age group 2.
Secondary Bioimpedance Parameters Overall (p)
BMI
(p)
No of
treatment
(p)
Diseases
Grp(p)
Percentage of fat 0.051 0.003 0.174 0.329
Min fat 0.092 0.000 0.016 0.005
Max fat 0.588 0.000 0.000 0.020
Percentage of lean 0.051 0.003 0.174 0.329
Min lean 0.005 0.000 0.009 0.008
Max lean 0.003 0.000 0.005 0.011
Dry lean weight 0.111 0.000 0.404 0.000
Percentage of water 0.298 0.000 0.211 0.090
Min water 0.967 0.000 0.188 0.001
Max water 0.874 0.000 0.225 0.002
Density 0.506 0.003 0.208 0.443
Nutrition 0.000 0.000 0.176 0.000
Normal nutrition - 1.000 1.000 1.000
Third space 0.018 0.004 0.000 0.257

118
Table 4.44 Comparisons of Main Bioimpedance Parameters after Treatment for
Male Age group 2.
Main Bioimpedance Parameters Overall (p)
BMI (P)
No of
treatment (p)
Diseases
Grp(p)
Impedance value at 5KHz 0.204 0.001 0.000 0.006
Impedance value at 50KHz 0.185 0.000 0.000 0.003
Impedance value at 100KHz 0.168 0.000 0.001 0.002
Impedance value at 200KHz 0.191 0.000 0.001 0.001
Reactance at 50KHz 0.724 0.002 0.100 0.229
Resistance at 50KHz 0.185 0.000 0.000 0.002
Phase Angle at 50 KHz 0.183 0.000 0.354 0.000
Basal metabolic rate 0.017 0.000 0.026 0.000
Intracellular water 0.504 0.000 0.010 0.001
Normal value of intracellular
water
0.865 0.000 0.173 0.001
Extra-cellular water 0.446 0.000 0.002 0.006
Normal extra cellular water 0.378 0.000 0.189 0.001
Total body water volume 0.036 0.000 0.001 0.006
Min total body water volume 0.967 0.000 0.188 0.001
Max total body water volume 0.874 0.000 0.225 0.002
Body cell mass 0.487 0.000 0.010 0.001
Table 4.45 Comparisons of Secondary Bioimpedance Parameters after Treatment
for Male Age group 2.
Secondary Bioimpedance Parameters Overall (p)
BMI
(p)
No of
treatment
(p)
Diseases
Grp(p)
Percentage of fat 0.342 0.002 0.134 0.279
Min fat 0.006 0.000 0.006 0.000
Max fat 0.583 0.000 0.001 0.016
Percentage of lean 0.342 0.002 0.134 0.279
Min lean 0.025 0.000 0.002 0.014
Max lean 0.013 0.000 0.001 0.025
Dry lean weight 0.115 0.000 0.439 0.000
Percentage of water 0.154 0.000 0.150 0.084
Min water 0.967 0.000 0.188 0.001
Max water 0.874 0.000 0.225 0.002
Density 0.871 0.003 0.208 0.443
Nutrition 0.000 0.000 0.001 0.002
Normal nutrition - 1.000 1.000 1.000
Third space 0.280 0.003 0.021 0.141

119
Table 4.46 Comparisons of Main Bioimpedance Parameters before Treatment for
Female age group 3.
Main Bioimpedance Parameters BMI (P) Diseases Grp(p)
Impedance value at 5KHz 0.000 0.108
Impedance value at 50KHz 0.000 0.017
Impedance value at 100KHz 0.000 0.018
Impedance value at 200KHz 0.000 0.020
Reactance at 50KHz 0.000 0.000
Resistance at 50KHz 0.000 0.016
Phase Angle at 50 KHz 0.000 0.000
Basal metabolic rate 0.329 0.000
Intracellular water 0.007 0.000
Normal value of intracellular
water
0.000 0.000
Extra-cellular water 0.070 0.000
Normal extra cellular water 0.000 0.000
Total body water volume 0.245 0.000
Min total body water volume 0.000 0.000
Max total body water volume 0.000 0.000
Body cell mass 0.007 0.000
* No of treatment does not have enough parameter for analysis.
** Overall value does not have enough parameter for analysis.
Table 4.47 Comparisons of Secondary Bioimpedance Parameters before
Treatment for Female Age group 3.
Secondary Bioimpedance Parameters BMI
(p)
Diseases
Grp(p)
Percentage of fat 0.000 0.000
Min fat 0.376 -
Max fat 0.065 0.000
Percentage of lean 0.000 0.000
Min lean 0.363 0.000
Max lean 0.179 0.000
Dry lean weight 0.075 0.000
Percentage of water 0.000 0.000
Min water 0.000 0.000
Max water 0.000 0.000
Density 0.000 0.000
Nutrition 0.000 0.000
Normal nutrition 1.000 1.000
Third space 0.000 0.000
* No of treatment does not have enough parameter for analysis.
** Overall value does not have enough parameter for analysis.

120
Table 4.48 Comparisons of Main Bioimpedance Parameters after Treatment for
Female Age group 3.
Main Bioimpedance Parameters BMI (P) Diseases Grp(p)
Impedance value at 5KHz 0.000 0.229
Impedance value at 50KHz 0.000 0.187
Impedance value at 100KHz 0.000 0.178
Impedance value at 200KHz 0.000 0.173
Reactance at 50KHz 0.000 0.012
Resistance at 50KHz 0.000 0.186
Phase Angle at 50 KHz 0.000 0.000
Basal metabolic rate 0.048 0.000
Intracellular water 0.000 0.000
Normal value of intracellular
water
0.000 0.000
Extra-cellular water 0.002 0.000
Normal extra cellular water 0.000 0.000
Total body water volume 0.013 0.000
Min total body water volume 0.000 0.000
Max total body water volume 0.000 0.000
Body cell mass 0.000 0.000
* No of treatment does not have enough parameter for analysis.
** Overall value does not have enough parameter for analysis.
Table 4.49 Comparisons of Secondary Bioimpedance Parameters after Treatment
For Female Age group 3.
Secondary Bioimpedance Parameters BMI
(p)
Diseases
Grp(p)
Percentage of fat 0.000 0.000
Min fat 0.054 0.000
Max fat 0.121 0.000
Percentage of lean 0.000 0.000
Min lean 0.036 0.000
Max lean 0.052 0.000
Dry lean weight 0.069 0.000
Percentage of water 0.000 0.000
Min water 0.000 0.000
Max water 0.000 0.000
Density 0.000 0.000
Nutrition 0.000 0.000
Normal nutrition 1.000 1.000
Third space 0.000 0.000
* No of treatment does not have enough parameter for analysis.
** Overall value does not have enough parameter for analysis.

121
Comparisons of Main Bioimpedance Parameters before Treatment for Male age
group 3.
*Not enough parameter for analysis
Comparisons of Secondary Bioimpedance Parameters before Treatment for Male
Age group 3.
*Not enough parameter for analysis
Comparisons of Main Bioimpedance Parameters after Treatment for Male Age
group 3.
*Not enough parameter for analysis
Comparisons of Secondary Bioimpedance Parameters after Treatment for Male
Age group 3.
*Not enough parameter for analysis
Table 4.50: Comparisons of Main Bioimpedance Parameters before Treatment for
Female age group 4.
Main Bioimpedance Parameters Overall (p)
Impedance value at 5KHz 0.003
Impedance value at 50KHz 0.002
Impedance value at 100KHz 0.002
Impedance value at 200KHz 0.001
Reactance at 50KHz 0.012
Resistance at 50KHz 0.002
Phase Angle at 50 KHz 0.000
Basal metabolic rate 0.000
Intracellular water 0.000
Normal value of intracellular
water
0.000
Extra-cellular water 0.000
Normal extra cellular water 0.000
Total body water volume 0.000
Min total body water volume 0.000
Max total body water volume 0.000
Body cell mass 0.000
*Only overall parameter has enough parameter for analysis

122
Table 4.51 Comparisons of Secondary Bioimpedance Parameters before
Treatment for Female Age group 4.
Secondary Bioimpedance Parameters Overall (p)
Percentage of fat 0.001
Min fat 0.000
Max fat 0.000
Percentage of lean 0.001
Min lean 0.000
Max lean 0.000
Dry lean weight 0.000
Percentage of water 0.001
Min water 0.000
Max water 0.000
Density 0.000
Nutrition 0.000
Normal nutrition -
Third space 0.000
*Only overall parameter has enough parameter for analysis
Table 4.52 Comparisons of Main Bioimpedance Parameters after Treatment for
Female Age group 4.
Main Bioimpedance Parameters Overall (p)
Impedance value at 5KHz 0.004
Impedance value at 50KHz 0.006
Impedance value at 100KHz 0.006
Impedance value at 200KHz 0.004
Reactance at 50KHz 0.029
Resistance at 50KHz 0.005
Phase Angle at 50 KHz 0.010
Basal metabolic rate 0.001
Intracellular water 0.000
Normal value of intracellular
water
0.000
Extra-cellular water 0.000
Normal extra cellular water 0.000
Total body water volume 0.000
Min total body water volume 0.000
Max total body water volume 0.000
Body cell mass 0.000
*Only overall parameter has enough parameter for analysis

123
Table 4.53 Comparisons of Secondary Bioimpedance Parameters after Treatment.
For Female Age group 4.
Secondary Bioimpedance Parameters Overall (p)
Percentage of fat 0.000
Min fat 0.000
Max fat 0.000
Percentage of lean 0.000
Min lean 0.000
Max lean 0.000
Dry lean weight 0.000
Percentage of water 0.001
Min water 0.000
Max water 0.000
Density 0.000
Nutrition 0.365
Normal nutrition -
Third space 0.000
*Only overall parameter has enough parameter for analysis
Table 4.54 Comparisons of Main Bioimpedance Parameters before Treatment for
male age group 4.
Main Bioimpedance Parameters Overall (p) BMI (P) Diseases Grp(p)
Impedance value at 5KHz 0.004 0.000 0.666
Impedance value at 50KHz 0.006 0.000 0.751
Impedance value at 100KHz 0.006 0.000 0.659
Impedance value at 200KHz 0.004 0.000 0.483
Reactance at 50KHz 0.029 0.000 0.958
Resistance at 50KHz 0.005 0.000 0.746
Phase Angle at 50 KHz 0.010 0.000 0.679
Basal metabolic rate 0.000 0.003 0.003
Intracellular water 0.000 0.001 0.006
Normal value of intracellular
water
0.000 0.000 0.022
Extra-cellular water 0.000 0.004 0.004
Normal extra cellular water 0.000 0.000 0.020
Total body water volume 0.000 0.003 0.003
Min total body water volume 0.000 0.000 0.022
Max total body water volume 0.000 0.000 0.021
Body cell mass 0.000 0.001 0.006
* No of treatment does not have enough parameter for analysis.

124
Table 4.55 Comparisons of Secondary Bioimpedance Parameters before
Treatment for Male Age group 4.
Secondary Bioimpedance Parameters Overall (p) BMI
(p)
Diseases
Grp(p)
Percentage of fat 0.001 0.000 0.001
Min fat 0.000 0.008 0.008
Max fat 0.000 0.002 0.002
Percentage of lean 0.001 0.000 0.001
Min lean 0.000 0.003 0.008
Max lean 0.000 0.002 0.005
Dry lean weight 0.000 0.006 0.001
Percentage of water 0.001 0.000 0.001
Min water 0.000 0.000 0.022
Max water 0.000 0.000 0.021
Density 0.000 0.000 0.006
Nutrition 0.000 0.064 0.000
Normal nutrition - 1.000 1.000
Third space 0.000 0.000 0.000
* No of treatment does not have enough parameter for analysis.
Table 4.56 Comparisons of Main Bioimpedance Parameters after Treatment for
Male Age group 4.
Main Bioimpedance Parameters Overall (p) BMI (P) Diseases Grp(p)
Impedance value at 5KHz 0.004 0.000 0.001
Impedance value at 50KHz 0.006 0.000 0.666
Impedance value at 100KHz 0.006 0.000 0.751
Impedance value at 200KHz 0.004 0.000 0.659
Reactance at 50KHz 0.029 0.000 0.958
Resistance at 50KHz 0.005 0.000 0.746
Phase Angle at 50 KHz 0.010 0.000 0.679
Basal metabolic rate 0.000 0.000 0.003
Intracellular water 0.000 0.003 0.006
Normal value of intracellular
water
0.000 0.001 0.022
Extra-cellular water 0.000 0.004 0.004
Normal extra cellular water 0.000 0.000 0.020
Total body water volume - 0.003 0.003
Min total body water volume 0.000 0.000 0.022
Max total body water volume 0.000 0.000 0.021
Body cell mass 0.000 0.001 0.006
* No of treatment does not have enough parameter for analysis.

125
Table 4.57 Comparisons of Secondary Bioimpedance Parameters after Treatment
for Male Age group 4.
Secondary Bioimpedance Parameters Overall (p) BMI
(p)
Diseases
Grp(p)
Percentage of fat 0.004 0.000 0.004
Min fat 0.006 0.000 0.006
Max fat 0.006 0.000 0.006
Percentage of lean 0.004 0.000 0.004
Min lean 0.029 0.000 0.029
Max lean 0.005 0.000 0.005
Dry lean weight 0.010 0.003 0.010
Percentage of water 0.000 0.000 0.000
Min water 0.000 0.000 0.000
Max water 0.000 0.000 0.000
Density 0.000 0.000 0.000
Nutrition 0.365 0.743 0.000
Normal nutrition - 1.000 -
Third space 0.000 0.000 0.000
* No of treatment does not have enough parameter for analysis.
Table 4.58 Comparisons of Main Bioimpedance Parameters before Treatment for
Female age group 5.
Main Bioimpedance Parameters Overall (p) BMI (P) No of treatment
(p)
Diseases
Grp(p)
Impedance value at 5KHz 0.000 0.000 0.494 0.085
Impedance value at 50KHz 0.003 0.000 0.509 0.153
Impedance value at 100KHz 0.003 0.000 0.551 0.153
Impedance value at 200KHz 0.002 0.000 0.589 0.158
Reactance at 50KHz 0.000 0.000 0.380 0.001
Resistance at 50KHz 0.004 0.000 0.514 0.157
Phase Angle at 50 KHz 0.760 0.000 0.567 0.000
Basal metabolic rate 0.068 0.000 0.086 0.078
Intracellular water 0.529 0.000 0.028 0.006
Normal value of intracellular
water
0.018 0.000 0.005 0.002
Extra-cellular water 0.711 0.000 0.048 0.032
Normal extra cellular water 0.020 0.000 0.005 0.002
Total body water volume 0.723 0.000 0.093 0.038
Min total body water volume 0.006 0.000 0.007 0.003
Max total body water volume 0.010 0.000 0.005 0.003
Body cell mass 0.537 0.000 0.029 0.006

126
Table 4.59 Comparisons of Secondary Bioimpedance Parameters before
Treatment for Female Age group 5.
Secondary Bioimpedance Parameters Overall (p) BMI
(p)
No of
treatment (p)
Diseases
Grp(p)
Percentage of fat 0.000 0.000 0.000 0.000
Min fat 0.000 0.000 0.114 0.034
Max fat 0.000 0.000 0.181 0.098
Percentage of lean 0.000 0.000 0.000 0.000
Min lean 0.000 0.000 0.145 0.061
Max lean 0.001 0.000 0.168 0.083
Dry lean weight 0.790 0.000 0.087 0.159
Percentage of water 0.000 0.000 0.000 0.000
Min water 0.000 0.000 0.007 0.003
Max water 0.751 0.000 0.005 0.003
Density 0.604 0.000 0.000 0.000
Nutrition 0.000 0.000 0.740 0.012
Normal nutrition 0.000 1.000 1.000 1.000
Third space 0.000 0.000 0.026 0.000
Table 4.60 Comparisons of Main Bioimpedance Parameters after Treatment for
Female Age group 5.
Main Bioimpedance Parameters Overall (p) BMI (P) No of treatment
(p)
Diseases
Grp(p)
Impedance value at 5KHz 0.015 0.000 0.494 0.085
Impedance value at 50KHz 0.011 0.000 0.509 0.153
Impedance value at 100KHz 0.008 0.000 0.551 0.153
Impedance value at 200KHz 0.005 0.000 0.589 0.158
Reactance at 50KHz 0.676 0.001 0.380 0.001
Resistance at 50KHz 0.011 0.000 0.514 0.157
Phase Angle at 50 KHz 0.149 0.170 0.567 0.000
Basal metabolic rate 0.010 0.000 0.086 0.078
Intracellular water 0.000 0.000 0.028 0.006
Normal value of intracellular
water
0.802 0.000 0.005 0.002
Extra-cellular water 0.049 0.000 0.048 0.032
Normal extra cellular water 0.009 0.000 0.005 0.002
Total body water volume 0.000 0.000 0.093 0.038
Min total body water volume 0.751 0.000 0.007 0.003
Max total body water volume 0.604 0.000 0.005 0.003
Body cell mass 0.000 0.000 0.029 0.006

127
Table 4.61 Comparisons of Secondary Bioimpedance Parameters after Treatment.
For Female Age group 5.
Secondary Bioimpedance Parameters Overall (p) BMI
(p)
No of
treatment (p)
Diseases
Grp(p)
Percentage of fat 0.000 0.000 0.000 0.000
Min fat 0.000 0.000 0.114 0.034
Max fat 0.000 0.000 0.152 0.034
Percentage of lean 0.000 0.000 0.000 0.000
Min lean .000 0.000 0.077 0.070
Max lean 0.001 0.000 0.090 0.064
Dry lean weight 0.921 0.000 0.081 0.162
Percentage of water 0.000 0.000 0.000 0.000
Min water 0.751 0.000 0.007 0.003
Max water 0.604 0.000 0.005 0.003
Density 0.000 0.000 0.000 0.000
Nutrition 0.000 0.000 0.061 0.000
Normal nutrition 0.000 1.000 1.000 1.000
Third space 0.000 0.000 0.003 0.000
Table 4.62 Comparisons of Main Bioimpedance Parameters before Treatment for
male age group 5.
Main Bioimpedance Parameters Overall (p) BMI (P) No of
treatment (p)
Diseases
Grp(p)
Impedance value at 5KHz 0.021 0.979 0.000 0.000
Impedance value at 50KHz 0.017 0.434 0.002 0.000
Impedance value at 100KHz 0.020 0.343 0.003 0.000
Impedance value at 200KHz 0.019 0.377 0.003 0.000
Reactance at 50KHz 0.772 0.008 0.000 0.000
Resistance at 50KHz 0.017 0.407 0.002 0.000
Phase Angle at 50 KHz 0.390 0.000 0.026 0.000
Basal metabolic rate 0.003 0.000 0.002 0.000
Intracellular water 0.000 0.000 0.013 0.000
Normal value of intracellular
water
0.802 0.000 0.018 0.000
Extra-cellular water 0.008 0.000 0.010 0.000
Normal extra cellular water 0.009 - 0.020 0.000
Total body water volume 0.000 .0000 0.009 0.000
Min total body water volume 0.751 0.000 0.006 0.000
Max total body water volume 0.604 0.000 0.010 0.000
Body cell mass 0.000 0.000 0.015 0.000

128
Table 4.63 Comparisons of Secondary Bioimpedance Parameters before
Treatment for Male Age group 5.
Secondary Bioimpedance Parameters Overall (p) BMI
(p)
No of treatment
(p)
Diseases
Grp(p)
Percentage of fat 0.000 0.345 0.000 0.000
Min fat 0.000 . 0.058 .
Max fat 0.000 . 0.058 .
Percentage of lean 0.000 0.345 0.000 0.000
Min lean 0.000 0.000 0.000 .
Max lean 0.001 0.000 0.000 .
Dry lean weight 0.790 0.000 0.000 0.000
Percentage of water 0.000 0.000 0.044 0.000
Min water 0.751 0.000 0.006 .
Max water 0.604 0.000 0.010 .
Density 0.000 0.058 0.000 0.000
Nutrition 0.000 0.000 0.058 0.000
Normal nutrition 0.000 1.000 1.000 1.000
Third space 0.000 0.001 0.695 0.000
Table 4.64 Comparisons of Main Bioimpedance Parameters after Treatment for
Male Age group 5.
Main Bioimpedance Parameters Overall (p) BMI (P) No of treatment
(p)
Diseases
Grp(p)
Impedance value at 5KHz 0.015 0.628 0.628 0.000
Impedance value at 50KHz 0.011 0.343 0.343 0.003
Impedance value at 100KHz 0.008 0.340 0.340 0.003
Impedance value at 200KHz 0.005 0.399 0.399 0.002
Reactance at 50KHz 0.676 0.055 0.055 0.000
Resistance at 50KHz 0.011 0.337 0.337 0.004
Phase Angle at 50 KHz 0.149 0.000 0.000 0.760
Basal metabolic rate 0.010 0.000 0.000 0.068
Intracellular water 0.000 0.000 0.000 0.529
Normal value of intracellular
water
0.802 0.000 0.000 0.018
Extra-cellular water 0.763 0.000 0.000 0.711
Normal extra cellular water 0.049 - 0.000 0.020
Total body water volume 0.009 0.000 0.000 0.723
Min total body water volume 0.000 0.000 0.000 0.006
Max total body water volume 0.751 0.000 0.000 0.010
Body cell mass 0.604 0.000 0.000 0.537

129
Table 4.65 Comparisons of Secondary Bioimpedance Parameters after Treatment
for Male Age group 5.
Secondary Bioimpedance Parameters Overall (p) BMI
(p)
No of
treatment (p)
Diseases
Grp(p)
Percentage of fat 0.000 0.069 0.000 0.000
Min fat 0.000 0.058 0.058 .
Max fat 0.000 0.000 1.000 .
Percentage of lean 0.000 0.069 0.000 0.000
Min lean 0.000 0.000 0.070 0.000
Max lean 0.001 0.000 0.069 0.000
Dry lean weight 0.921 0.000 0.001 0.000
Percentage of water 0.000 0.000 0.000 0.000
Min water 0.751 0.000 0.006 .
Max water 0.604 0.000 0.010 .
Density 0.000 0.058 0.000 0.000
Nutrition 0.000 0.000 0.000 0.000
Normal nutrition 0.000 1.000 1.000 1.000
Third space 0.000 0.003 0.000 0.000

130
Appendix C:
Table 4.74 Comparisons of Main Bioimpedance Parameters before Treatment for
Female BMI group 2.
Main Bioimpedance Parameters Overall (p) BMI
(P)
No of
treatment (p)
Diseases Grp(p)
Impedance value at 5KHz 0.058 0.000 0.000 0.000
Impedance value at 50KHz 0.030 0.000 0.000 0.000
Impedance value at 100KHz 0.031 0.000 0.000 0.000
Impedance value at 200KHz 0.026 0.000 0.000 0.000
Reactance at 50KHz 0.576 0.000 0.000 0.000
Resistance at 50KHz 0.029 0.000 0.000 0.000
Phase Angle at 50 KHz 0.026 0.000 0.000 0.000
Basal metabolic rate 0.016 0.000 0.000 0.000
Intracellular water 0.613 0.000 0.000 0.000
Normal value of intracellular
water
0.865 0.000 0.000 0.000
Extra-cellular water 0.374 0.000 0.000 0.000
Normal extra cellular water 0.378 0.000 0.000 0.000
Total body water volume 0.025 0.000 0.000 0.000
Min total body water volume 0.967 0.000 0.000 0.000
Max total body water volume 0.874 0.000 0.000 0.000
Body cell mass 0.634 0.000 0.000 0.000
Table 4.75 Comparisons of Secondary Bioimpedance Parameters before
Treatment for Female BMI group 2.
Secondary Bioimpedance Parameters Overall (p) BMI (p) No of
treatment
(p)
Diseases
Grp(p)
Percentage of fat 0.051 0.000 0.019 0.369
Min fat 0.092 0.000 0.466 0.000
Max fat 0.588 0.000 0.391 0.369
Percentage of lean 0.051 0.000 0.019 0.000
Min lean 0.005 0.000 0.169 0.000
Max lean 0.003 0.000 0.163 0.000
Dry lean weight 0.111 0.000 0.000 0.000
Percentage of water 0.298 0.000 0.001 0.343
Min water 0.967 0.000 0.000 0.000
Max water 0.874 0.000 0.000 0.000
Density 0.506 0.000 0.015 0.306
Nutrition 0.000 0.000 0.000 0.000
Normal nutrition - 1.000 1.000 1.000
Third space 0.018 0.000 0.001 0.041

131
Table 4.76 Comparisons of Main Bioimpedance Parameters after Treatment for
Female BMI group 2.
Main Bioimpedance Parameters Overall (p)
BMI (P)
No of
treatment (p)
Diseases
Grp(p)
Impedance value at 5KHz 0.204 0.000 0.000 0.000
Impedance value at 50KHz 0.185 0.000 0.000 0.000
Impedance value at 100KHz 0.168 0.000 0.000 0.000
Impedance value at 200KHz 0.191 0.000 0.000 0.000
Reactance at 50KHz 0.724 0.000 0.100 0.000
Resistance at 50KHz 0.185 0.000 0.000 0.000
Phase Angle at 50 KHz 0.183 0.000 0.000 0.000
Basal metabolic rate 0.017 0.000 0.000 0.000
Intracellular water 0.504 0.000 0.000 0.000
Normal value of intracellular
water
0.865 0.000 0.000 0.000
Extra-cellular water 0.446 0.000 0.000 0.000
Normal extra cellular water 0.378 0.000 0.000 0.000
Total body water volume 0.036 0.000 0.000 0.000
Min total body water volume 0.967 0.000 0.000 0.000
Max total body water volume 0.874 0.000 0.000 0.000
Body cell mass 0.487 0.000 0.000 0.000
Table 4.77 Comparisons of Secondary Bioimpedance Parameters after Treatment.
For Female BMI group 2.
Secondary Bioimpedance Parameters Overall (p) BMI
(p)
No of
treatment (p)
Diseases
Grp(p)
Percentage of fat 0.164 0.000 0.476 0.000
Min fat 0.203 0.000 0.005 0.066
Max fat 0.752 0.000 0.008 0.157
Percentage of lean 0.164 0.000 0.476 0.000
Min lean 0.169 0.000 0.669 0.059
Max lean 0.146 0.000 0.881 0.038
Dry lean weight 0.935 0.000 0.014 0.000
Percentage of water 0.009 0.000 0.000 0.000
Min water 0.015 0.000 0.616 0.001
Max water 0.028 0.000 0.862 0.001
Density 0.049 0.000 0.259 0.000
Nutrition 0.002 0.000 0.094 0.060
Normal nutrition - 1.000 1.000 1.000
Third space 0.001 0.000 0.000 0.000

132
Table 4.78 Comparisons of Main Bioimpedance Parameters before Treatment for
male BMI group 2.
Main Bioimpedance Parameters Overall (p)
BMI (P)
No of
treatment (p)
Diseases Grp(p)
Impedance value at 5KHz 0.001 0.128 0.000 0.024
Impedance value at 50KHz 0.000 0.088 0.000 0.019
Impedance value at 100KHz 0.000 0.089 0.000 0.009
Impedance value at 200KHz 0.000 0.097 0.000 0.005
Reactance at 50KHz 0.000 0.000 0.627 0.000
Resistance at 50KHz 0.000 0.087 0.000 0.016
Phase Angle at 50 KHz 0.802 0.000 0.001 0.000
Basal metabolic rate 0.129 0.000 0.283 0.000
Intracellular water 0.087 0.000 0.044 0.000
Normal value of intracellular
water
0.020 0.000 0.365 0.000
Extra-cellular water 0.005 0.000 0.148 0.000
Normal extra cellular water 0.006 0.000 0.400 0.000
Total body water volume 0.003 0.000 0.095 0.000
Min total body water volume 0.015 0.000 0.625 0.000
Max total body water volume 0.028 0.000 0.505 0.000
Body cell mass 0.086 0.000 0.041 0.000
Table 4.79 Comparisons of Secondary Bioimpedance Parameters before
Treatment for Male BMI group 2.
Secondary Bioimpedance Parameters Overall (p) BMI
(p)
No of
treatment (p)
Diseases
Grp(p)
Percentage of fat 0.683 0.000 0.451 0.000
Min fat 0.262 0.000 0.482 0.000
Max fat 0.818 0.000 0.232 0.000
Percentage of lean 0.683 0.000 0.451 0.000
Min lean 0.419 0.000 0.265 0.000
Max lean 0.322 0.000 0.230 0.000
Dry lean weight 0.780 0.000 0.909 0.075
Percentage of water 0.205 0.090 0.216 0.000
Min water 0.015 0.000 0.615 0.000
Max water 0.028 0.000 0.505 0.000
Density 0.273 0.000 0.238 0.000
Nutrition 0.059 0.000 0.001 0.000
Normal nutrition - 1.000 1.000 1.000
Third space 0.001 0.003 0.866 0.195
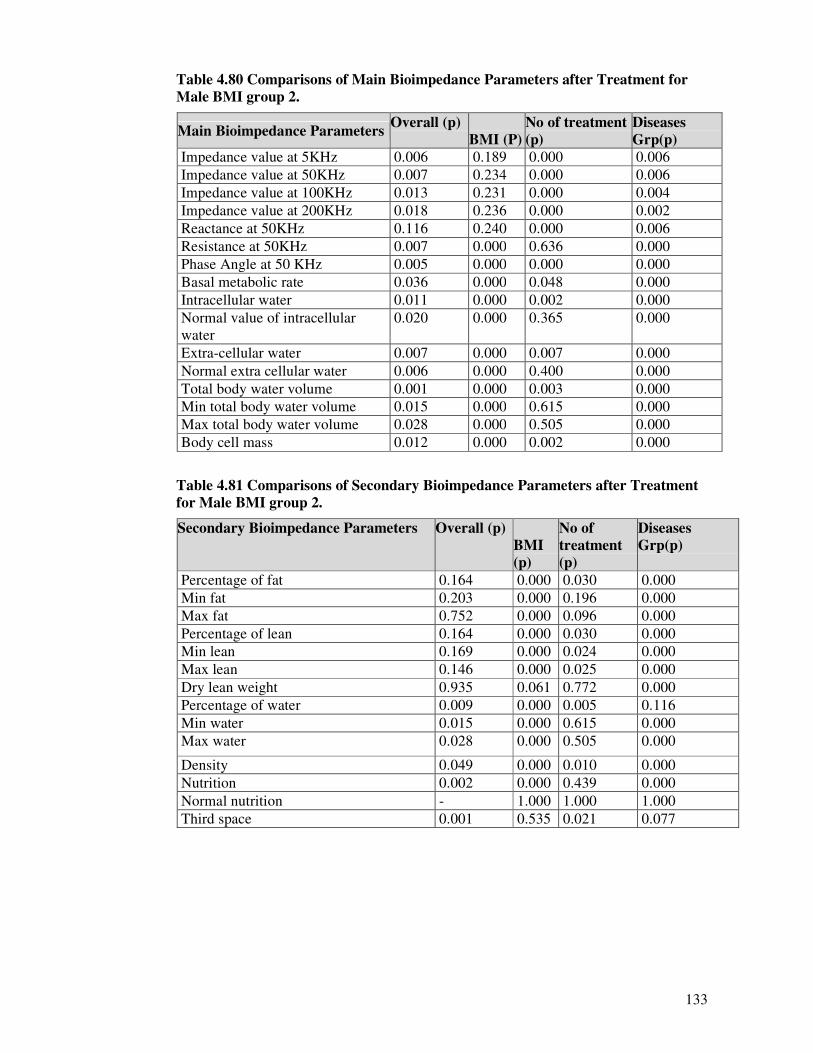
133
Table 4.80 Comparisons of Main Bioimpedance Parameters after Treatment for
Male BMI group 2.
Main Bioimpedance Parameters Overall (p)
BMI (P)
No of treatment
(p)
Diseases
Grp(p)
Impedance value at 5KHz 0.006 0.189 0.000 0.006
Impedance value at 50KHz 0.007 0.234 0.000 0.006
Impedance value at 100KHz 0.013 0.231 0.000 0.004
Impedance value at 200KHz 0.018 0.236 0.000 0.002
Reactance at 50KHz 0.116 0.240 0.000 0.006
Resistance at 50KHz 0.007 0.000 0.636 0.000
Phase Angle at 50 KHz 0.005 0.000 0.000 0.000
Basal metabolic rate 0.036 0.000 0.048 0.000
Intracellular water 0.011 0.000 0.002 0.000
Normal value of intracellular
water
0.020 0.000 0.365 0.000
Extra-cellular water 0.007 0.000 0.007 0.000
Normal extra cellular water 0.006 0.000 0.400 0.000
Total body water volume 0.001 0.000 0.003 0.000
Min total body water volume 0.015 0.000 0.615 0.000
Max total body water volume 0.028 0.000 0.505 0.000
Body cell mass 0.012 0.000 0.002 0.000
Table 4.81 Comparisons of Secondary Bioimpedance Parameters after Treatment
for Male BMI group 2.
Secondary Bioimpedance Parameters Overall (p)
BMI
(p)
No of
treatment
(p)
Diseases
Grp(p)
Percentage of fat 0.164 0.000 0.030 0.000
Min fat 0.203 0.000 0.196 0.000
Max fat 0.752 0.000 0.096 0.000
Percentage of lean 0.164 0.000 0.030 0.000
Min lean 0.169 0.000 0.024 0.000
Max lean 0.146 0.000 0.025 0.000
Dry lean weight 0.935 0.061 0.772 0.000
Percentage of water 0.009 0.000 0.005 0.116
Min water 0.015 0.000 0.615 0.000
Max water 0.028 0.000 0.505 0.000
Density 0.049 0.000 0.010 0.000
Nutrition 0.002 0.000 0.439 0.000
Normal nutrition - 1.000 1.000 1.000
Third space 0.001 0.535 0.021 0.077

134
Table 4.82 Comparisons of Main Bioimpedance Parameters before Treatment for
Female BMI group 3.
Main Bioimpedance Parameters Overall (p) BMI (P) Diseases Grp(p)
Impedance value at 5KHz 0.000 0.000 0.000
Impedance value at 50KHz 0.000 0.000 0.000
Impedance value at 100KHz 0.000 0.000 0.000
Impedance value at 200KHz 0.000 0.000 0.000
Reactance at 50KHz 0.000 0.000 0.000
Resistance at 50KHz 0.000 0.000 0.000
Phase Angle at 50 KHz 0.004 0.000 0.000
Basal metabolic rate 0.000 0.000 0.000
Intracellular water 0.707 0.007 0.000
Normal value of intracellular
water
0.000 0.000 0.000
Extra-cellular water 0.016 0.000 0.000
Normal extra cellular water 0.000 0.007 0.000
Total body water volume 0.006 0.000 0.000
Min total body water volume 0.003 0.022 0.000
Max total body water volume 0.002 0.000 0.000
Body cell mass 0.630 0.000 0.000
*no of treatment does not have enough parameter for analysis
Table 4.83 Comparisons of Secondary Bioimpedance Parameters before
Treatment for Female BMI group 3.
Secondary Bioimpedance Parameters Overall (p) BMI
(p)
Diseases
Grp(p)
Percentage of fat 0.000 0.000 0.025
Min fat 0.000 0.000 0.000
Max fat 0.000 0.000 0.000
Percentage of lean 0.000 0.000 0.025
Min lean 0.000 0.002 0.009
Max lean 0.000 0.001 0.001
Dry lean weight 0.004 0.000 0.000
Percentage of water 0.000 0.000 0.000
Min water 0.707 0.022 0.004
Max water 0.000 0.001 0.001
Density 0.016 0.001 0.000
Nutrition 0.000 0.000 0.003
Normal nutrition 0.006 1.000 1.000
Third space 0.003 0.000 0.000
*no of treatment does not have enough parameter for analysis

135
Table 4.84. Comparisons of Main Bioimpedance Parameters after Treatment for
Female BMI group 3.
Main Bioimpedance Parameters Overall (p) BMI (P) Diseases Grp(p)
Impedance value at 5KHz 0.000 0.000 0.025
Impedance value at 50KHz 0.000 0.000 0.000
Impedance value at 100KHz 0.000 0.000 0.000
Impedance value at 200KHz 0.000 0.000 0.025
Reactance at 50KHz 0.002 0.002 0.009
Resistance at 50KHz 0.000 0.001 0.001
Phase Angle at 50 KHz 0.001 0.000 0.000
Basal metabolic rate 0.000 0.000 0.293
Intracellular water 0.286 0.000 0.000
Normal value of intracellular
water
0.000 0.007 0.000
Extra-cellular water 0.016 0.000 0.000
Normal extra cellular water 0.000 0.007 0.000
Total body water volume 0.172 0.000 0.000
Min total body water volume 0.003 0.022 0.001
Max total body water volume 0.002 0.001 0.000
Body cell mass 0.298 0.000 0.000
*no of treatment does not have enough parameter for analysis
Table 4.85 Comparisons of Secondary Bioimpedance Parameters after Treatment.
For Female BMI group 3.
Secondary Bioimpedance Parameters Overall (p) BMI
(p)
Diseases
Grp(p)
Percentage of fat 0.258 0.000 0.025
Min fat 0.003 0.000 0.000
Max fat 0.000 0.000 0.000
Percentage of lean 0.258 0.000 0.067
Min lean 0.000 0.002 0.009
Max lean 0.003 0.002 0.001
Dry lean weight 0.015 0.001 0.000
Percentage of water 0.003 0.000 0.007
Min water 0.702 0.022 0.001
Max water 0.002 0.001 0.000
Density 0.004 0.000 0.021
Nutrition 0.002 0.001 0.000
Normal nutrition - 1.000 1.000
Third space 0.022 0.000 0.000
*no of treatment does not have enough parameter for analysis

136
Table 4.86 Comparisons of Main Bioimpedance Parameters before Treatment for
Male BMI group 3.
Main Bioimpedance Parameters Overall (p) BMI (P) Diseases Grp(p)
Impedance value at 5KHz 0.000 0.000 0.046
Impedance value at 50KHz 0.000 0.000 0.043
Impedance value at 100KHz 0.000 0.000 0.044
Impedance value at 200KHz 0.000 0.000 0.030
Reactance at 50KHz 0.000 0.000 0.000
Resistance at 50KHz 0.000 0.000 0.045
Phase Angle at 50 KHz 0.004 0.000 0.000
Basal metabolic rate 0.000 0.000 0.000
Intracellular water 0.707 0.000 0.000
Normal value of intracellular
water
0.000 0.031 0.000
Extra-cellular water 0.016 0.001 0.000
Normal extra cellular water 0.000 0.035 0.000
Total body water volume 0.006 0.000 0.000
Min total body water volume 0.003 0.013 0.000
Max total body water volume 0.002 0.085 0.000
Body cell mass 0.630 0.000 0.000
*no of treatment does not have enough parameter for analysis
Table 4.87 Comparisons of Secondary Bioimpedance Parameters before
Treatment for Male BMI group 3.
Secondary Bioimpedance Parameters Overall (p) BMI
(p)
Diseases
Grp(p)
Percentage of fat 0.022 0.000 0.002
Min fat 0.000 0.032 -
Max fat 0.000 0.000 0.000
Percentage of lean 0.022 0.000 0.002
Min lean 0.000 0.000 0.000
Max lean 0.005 0.000 0.000
Dry lean weight 0.002 0.000 0.000
Percentage of water 0.030 0.005 0.003
Min water 0.003 0.013 0.000
Max water 0.002 0.085 0.000
Density 0.000 0.003 0.003
Nutrition 0.007 0.032 0.032
Normal nutrition - 1.000 1.000
Third space 0.006 0.000 0.002
*no of treatment does not have enough parameter for analysis

137
Table 4.88 Comparisons of Main Bioimpedance Parameters after Treatment for
Male BMI group 3.
Main Bioimpedance Parameters Overall (p) BMI (P) Diseases Grp(p)
Impedance value at 5KHz 0.000 0.000 0.014
Impedance value at 50KHz 0.000 0.000 0.011
Impedance value at 100KHz 0.000 0.000 0.011
Impedance value at 200KHz 0.000 0.000 0.013
Reactance at 50KHz 0.002 0.000 0.000
Resistance at 50KHz 0.000 0.000 0.011
Phase Angle at 50 KHz 0.001 0.000 0.000
Basal metabolic rate 0.000 0.000 0.000
Intracellular water 0.268 0.000 0.000
Normal value of intracellular
water
0.000 0.031 0.001
Extra-cellular water 0.099 0.000 0.000
Normal extra cellular water 0.000 0.035 0.003
Total body water volume 0.172 0.000 1.000
Min total body water volume 0.003 0.013 0.000
Max total body water volume 0.002 0.085 0.000
Body cell mass 0.298 0.000 0.000
*no of treatment does not have enough parameter for analysis
Table 4.89 Comparisons of Secondary Bioimpedance Parameters after Treatment
for Male BMI group 3.
Secondary Bioimpedance Parameters Overall (p) BMI
(p)
Diseases
Grp(p)
Percentage of fat 0.258 0.000 0.000
Min fat 0.003 - 0.003
Max fat 0.000 0.000 0.000
Percentage of lean 0.258 0.000 0.000
Min lean 0.000 0.000 0.000
Max lean 0.000 0.000 0.000
Dry lean weight 0.003 0.000 0.000
Percentage of water 0.015 0.004 0.328
Min water 0.003 0.013 0.000
Max water 0.002 0.085 0.000
Density 0.003 0.003 0.003
Nutrition 0.002 1.000 1.000
Normal nutrition - 1.000 1.000
Third space 0.022 0.000 0.187
*no of treatment does not have enough parameter for analysis

138
Table 4.90 Comparisons of Main Bioimpedance Parameters before Treatment for
Female BMI group 4.
Main Bioimpedance Parameters Overall (p) BMI (P) Diseases Grp(p)
Impedance value at 5KHz 0.000 0.002 0.000
Impedance value at 50KHz 0.000 0.008 0.003
Impedance value at 100KHz 0.000 0.002 0.003
Impedance value at 200KHz 0.000 0.000 0.003
Reactance at 50KHz 0.000 0.000 0.000
Resistance at 50KHz 0.000 0.006 0.003
Phase Angle at 50 KHz 0.006 0.000 0.002
Basal metabolic rate 0.009 0.454 0.000
Intracellular water 0.001 0.215 0.000
Normal value of intracellular
water
0.000 0.019 0.000
Extra-cellular water 0.000 0.213 0.000
Normal extra cellular water 0.000 0.019 0.000
Total body water volume 0.000 0.364 0.000
Min total body water volume 0.000 0.019 0.000
Max total body water volume 0.000 0.009 0.000
Body cell mass 0.001 0.204 0.000
*no of treatment does not have enough parameter for analysis
Table 4.91 Comparisons of Secondary Bioimpedance Parameters before
Treatment for Female BMI group 4.
Secondary Bioimpedance Parameters Overall (p) BMI
(p)
Diseases
Grp(p)
Percentage of fat 0.003 0.000 0.000
Min fat 0.000 0.032 0.000
Max fat 0.000 0.000 -
Percentage of lean 0.003 0.000 0.000
Min lean 0.016 0.881 0.000
Max lean 0.000 0.337 0.000
Dry lean weight 0.017 0.841 0.000
Percentage of water 0.006 0.000 0.000
Min water 0.000 0.019 0.000
Max water 0.000 0.009 0.000
Density 0.001 0.000 0.000
Nutrition 0.000 0.000 0.032
Normal nutrition - 1.000 1.000
Third space 0.047 0.000 0.000
*no of treatment does not have enough parameter for analysis

139
Table 4.92 Comparisons of Main Bioimpedance Parameters after Treatment for
Female BMI group 4.
Main Bioimpedance Parameters Overall (p) BMI (P) Diseases Grp(p)
Impedance value at 5KHz 0.070 0.000 0.000
Impedance value at 50KHz 0.059 0.001 0.000
Impedance value at 100KHz 0.049 0.001 0.000
Impedance value at 200KHz 0.046 0.000 0.000
Reactance at 50KHz 0.040 0.000 0.182
Resistance at 50KHz 0.059 0.001 0.000
Phase Angle at 50 KHz 0.005 0.000 0.000
Basal metabolic rate 0.008 0.052 0.000
Intracellular water 0.001 0.278 0.000
Normal value of intracellular
water
0.000 0.019 0.000
Extra-cellular water 0.001 0.231 0.000
Normal extra cellular water 0.000 0.019 0.000
Total body water volume 0.006 0.329 0.000
Min total body water volume 0.000 0.019 0.000
Max total body water volume 0.000 0.009 0.000
Body cell mass 0.001 0.000 0.000
*no of treatment does not have enough parameter for analysis
Table 4.93 Comparisons of Secondary Bioimpedance Parameters after Treatment.
For Female BMI group 4.
Secondary Bioimpedance Parameters Overall (p) BMI
(p)
Diseases
Grp(p)
Percentage of fat 0.041 0.000 0.000
Min fat 0.000 0.010 0.000
Max fat 0.000 0.001 0.000
Percentage of lean 0.041 0.000 0.000
Min lean 0.014 0.382 0.182
Max lean 0.011 0.436 0.000
Dry lean weight 0.012 0.628 0.000
Percentage of water 0.070 0.001 0.000
Min water 0.000 0.019 0.000
Max water 0.000 0.009 0.000
Density 0.031 0.000 0.000
Nutrition 0.007 0.054 0.000
Normal nutrition - 1.000 0.000
Third space 0.029 0.002 0.000
*no of treatment does not have enough parameter for analysis

140
Table 4.94 Comparisons of Main Bioimpedance Parameters before Treatment for
male BMI group 4.
Main Bioimpedance Parameters Overall (p)
Impedance value at 5KHz 0.000
Impedance value at 50KHz 0.000
Impedance value at 100KHz 0.000
Impedance value at 200KHz 0.000
Reactance at 50KHz 0.000
Resistance at 50KHz 0.000
Phase Angle at 50 KHz 0.006
Basal metabolic rate 0.009
Intracellular water 0.000
Normal value of intracellular
water
0.000
Extra-cellular water 0.000
Normal extra cellular water 0.000
Total body water volume 0.000
Min total body water volume 0.000
Max total body water volume 0.000
Body cell mass 0.001
*Only overall parameter has enough data for analysis.
Table 4.95 Comparisons of Secondary Bioimpedance Parameters before
Treatment for Male BMI group 4.
Secondary Bioimpedance Parameters Overall (p)
Percentage of fat 0.003
Min fat 0.000
Max fat 0.000
Percentage of lean 0.003
Min lean 0.016
Max lean 0.000
Dry lean weight 0.017
Percentage of water 0.006
Min water 0.000
Max water 0.000
Density 0.001
Nutrition 0.000
Normal nutrition -
Third space 0.047
*Only overall parameter has enough data for analysis.

141
Table 4.96 Comparisons of Main Bioimpedance Parameters after Treatment for
Male BMI group 4.
Main Bioimpedance Parameters Overall (p)
Impedance value at 5KHz 0.070
Impedance value at 50KHz 0.059
Impedance value at 100KHz 0.049
Impedance value at 200KHz 0.046
Reactance at 50KHz 0.040
Resistance at 50KHz 0.059
Phase Angle at 50 KHz 0.005
Basal metabolic rate 0.008
Intracellular water 0.001
Normal value of intracellular
water
0.000
Extra-cellular water 0.001
Normal extra cellular water 0.000
Total body water volume 0.006
Min total body water volume 0.000
Max total body water volume 0.000
Body cell mass 0.001
*Only overall parameter has enough data for analysis.
Table 4.97 Comparisons of Secondary Bioimpedance Parameters after Treatment
for Male BMI group 4.
Secondary Bioimpedance Parameters Overall (p)
Percentage of fat 0.041
Min fat 0.000
Max fat 0.000
Percentage of lean 0.041
Min lean 0.014
Max lean 0.011
Dry lean weight 0.012
Percentage of water 0.070
Min water 0.000
Max water 0.000
Density 0.031
Nutrition 0.007
Normal nutrition -
Third space 0.029
*Only overall parameter has enough data for analysis.

142
Table 4.98 Comparisons of Main Bioimpedance Parameters before Treatment for
Female BMI group 5.
Main Bioimpedance Parameters BMI (P) Diseases Grp(p)
Impedance value at 5KHz 0.000 0.000
Impedance value at 50KHz 0.000 0.000
Impedance value at 100KHz 0.000 0.000
Impedance value at 200KHz 0.000 0.000
Reactance at 50KHz 0.000 0.000
Resistance at 50KHz 0.000 0.000
Phase Angle at 50 KHz 0.000 0.000
Basal metabolic rate 0.000 0.000
Intracellular water 0.000 0.000
Normal value of intracellular
water
0.000 0.000
Extra-cellular water 0.000 0.000
Normal extra cellular water 0.000 0.000
Total body water volume 0.000 0.000
Min total body water volume - -
Max total body water volume - -
Body cell mass 0.000 0.000
*Overall and no of treatment does not have enough parameter for analysis
Table 4.99 Comparisons of Secondary Bioimpedance Parameters before
Treatment for Female BMI group 5.
Secondary Bioimpedance Parameters BMI
(p)
Diseases
Grp(p)
Percentage of fat 0.000 0.000
Min fat - -
Max fat - -
Percentage of lean 0.000 0.000
Min lean - 0.000
Max lean - 0.000
Dry lean weight 0.000 0.000
Percentage of water 0.000 0.000
Min water - -
Max water - -
Density 0.000 0.000
Nutrition 0.001 0.001
Normal nutrition 1.000 1.000
Third space 0.000 0.000
*Overall and no of treatment does not have enough parameter for analysis

143
Table 4.100 Comparisons of Main Bioimpedance Parameters after Treatment for
Female BMI group 5.
Main Bioimpedance Parameters BMI (P) Diseases Grp(p)
Impedance value at 5KHz 0.000 0.000
Impedance value at 50KHz 0.000 0.000
Impedance value at 100KHz 0.000 0.000
Impedance value at 200KHz 0.000 0.000
Reactance at 50KHz 0.000 0.000
Resistance at 50KHz 0.000 0.000
Phase Angle at 50 KHz 0.000 0.000
Basal metabolic rate 0.000 0.000
Intracellular water 0.000 0.000
Normal value of intracellular
water
0.000 0.000
Extra-cellular water 0.000 0.000
Normal extra cellular water 0.000 0.000
Total body water volume 0.000 0.000
Min total body water volume - -
Max total body water volume - -
Body cell mass 0.000 0.000
*Overall and no of treatment does not have enough parameter for analysis
Table 4.101 Comparisons of Secondary Bioimpedance Parameters after Treatment.
For Female BMI group 5.
Secondary Bioimpedance Parameters BMI
(p)
Diseases
Grp(p)
Percentage of fat 0.000 0.000
Min fat - -
Max fat - -
Percentage of lean 0.000 0.000
Min lean - -
Max lean - -
Dry lean weight 0.000 0.000
Percentage of water 0.000 0.000
Min water - -
Max water - -
Density 0.000 0.000
Nutrition 1.000 1.000
Normal nutrition 1.000 1.000
Third space 0.000 0.000
*Overall and no of treatment does not have enough parameter for analysis

144
Comparisons of Main Bioimpedance Parameters before Treatment for male BMI
group 5.
*Not enough parameter for analysis
Comparisons of Secondary Bioimpedance Parameters before Treatment for Male
BMI group 5.
*Not enough parameter for analysis
Comparisons of Main Bioimpedance Parameters after Treatment for Male BMI
group 5.
*Not enough parameter for analysis
Comparisons of Secondary Bioimpedance Parameters after Treatment for Male
BMI group 5.
*Not enough parameter for analysis

145
Appendix D:
Table 4.114 Interaction of Main Bioimpedance Parameters before Treatment for
Age Group2.
Main Bioimpedance Parameters Gender (p) BMI group (p) Disease (p)
Impedance value at 5KHz 0.058 0.000 0.016
Impedance value at 50KHz 0.030 0.000 0.032
Impedance value at 100KHz 0.031 0.000 0.032
Impedance value at 200KHz 0.026 0.000 0.034
Reactance at 50KHz 0.576 0.000 0.000
Resistance at 50KHz 0.029 0.014 0.033
Phase Angle at 50 KHz 0.026 0.000 0.014
Basal metabolic rate 0.016 0.000 0.000
Intracellular water 0.613 0.000 0.000
Normal intracellular water 0.865 0.001 0.000
Extra-cellular water 0.374 0.000 0.000
Normal extra cellular water 0.378 0.000 0.000
Total body water volume 0.025 0.000 0.000
Min total body water volume 0.967 0.006 0.000
Max total body water volume 0.874 0.000 0.000
Body cell mass 0.634 0.001 0.000
Table 4.115 Interaction of Main Bioimpedance Parameters after Treatment for
Age Group2.
Main Bioimpedance Parameters Gender (p) BMI group (p) Disease (p)
Impedance value at 5KHz 0.204 0.000 0.042
Impedance value at 50KHz 0.185 0.000 0.054
Impedance value at 100KHz 0.168 0.000 0.057
Impedance value at 200KHz 0.191 0.000 0.050
Reactance at 50KHz 0.724 0.001 0.007
Resistance at 50KHz 0.185 0.000 0.054
Phase Angle at 50 KHz 0.183 0.001 0.001
Basal metabolic rate 0.017 0.000 0.000
Intracellular water 0.504 0.001 0.000
Normal intracellular water 0.865 0.000 0.000
Extra-cellular water 0.446 0.000 0.000
Normal extra cellular water 0.378 0.000 0.000
Total body water volume 0.036 0.006 0.000
Min total body water volume 0.967 0.000 0.000
Max total body water volume 0.874 0.000 0.000
Body cell mass 0.487 0.001 0.000

146
Table 4.116 Interactions of Secondary Bioimpedance Parameters before
Treatment for Age Group2.
Secondary Bioimpedance Parameters Gender (p) BMI Grp (p) Disease (p)
Percentage of fat 0.051 0.000 0.000
Min fat 0.092 0.000 0.000
Max fat 0.588 0.000 0.000
Percentage of lean 0.051 0.000 0.000
Min lean 0.005 0.001 0.000
Max lean 0.003 0.002 0.000
Dry lean weight 0.111 0.000 0.000
Percentage of water 0.298 0.000 0.001
Min water 0.967 0.000 0.000
Max water 0.874 0.000 0.000
Density 0.506 0.000 0.000
Nutrition 0.000 0.098 0.000
Normal nutrition - 0.218 0.000
Third space value 0.019 0.000 0.009
Table4.117 Interactions of Secondary Bioimpedance Parameters after Treatment
for Age group 2.
Secondary Bioimpedance Parameters Gender (p) BMI Grp (p) Disease (p)
Percentage of fat 0.342 0.000 0.000
Min fat 0.006 0.000 0.000
Max fat 0.583 0.000 0.000
Percentage of lean 0.342 0.000 0.000
Min lean 0.025 0.000 0.002
Max lean 0.013 0.000 0.002
Dry lean weight 0.115 0.000 0.000
Percentage of water 0.154 0.001 0.000
Min water 0.967 0.000 0.000
Max water 0.874 0.000 0.000
Density 0.871 0.000 0.000
Nutrition 0.000 0.000 0.138
Normal nutrition - 0.000 0.218
Third space value 0.280 0.009 0.000

147
Table 4.118 Interaction of Main Bioimpedance Parameters before Treatment for
Age Group3.
Main Bioimpedance Parameters BMI group (p) Disease (p)
Impedance value at 5KHz 0.000 0.108
Impedance value at 50KHz 0.000 0.017
Impedance value at 100KHz 0.000 0.018
Impedance value at 200KHz 0.000 0.020
Reactance at 50KHz 0.000 0.000
Resistance at 50KHz 0.000 0.016
Phase Angle at 50 KHz 0.000 0.000
Basal metabolic rate 0.329 0.000
Intracellular water 0.007 0.000
Normal intracellular water 0.000 0.000
Extra-cellular water 0.070 0.000
Normal extra cellular water 0.000 0.000
Total body water volume 0.245 0.000
Min total body water volume 0.000 0.000
Max total body water volume 0.000 0.000
Body cell mass 0.007 0.000
* Gender does not have enough parameter for analysis.
Table 4.119 Interaction of Main Bioimpedance Parameters after Treatment for
Age Group3.
Main Bioimpedance Parameters BMI group (p) Disease (p)
Impedance value at 5KHz 0.000 0.229
Impedance value at 50KHz 0.000 0.187
Impedance value at 100KHz 0.000 0.178
Impedance value at 200KHz 0.000 0.173
Reactance at 50KHz 0.000 0.012
Resistance at 50KHz 0.000 0.186
Phase Angle at 50 KHz 0.000 0.000
Basal metabolic rate 0.048 0.000
Intracellular water 0.000 0.000
Normal intracellular water 0.000 0.000
Extra-cellular water 0.002 0.000
Normal extra cellular water 0.000 0.000
Total body water volume 0.013 0.000
Min total body water volume 0.000 0.000
Max total body water volume 0.000 0.000
Body cell mass 0.000 0.000
* Gender does not have enough parameter for analysis.
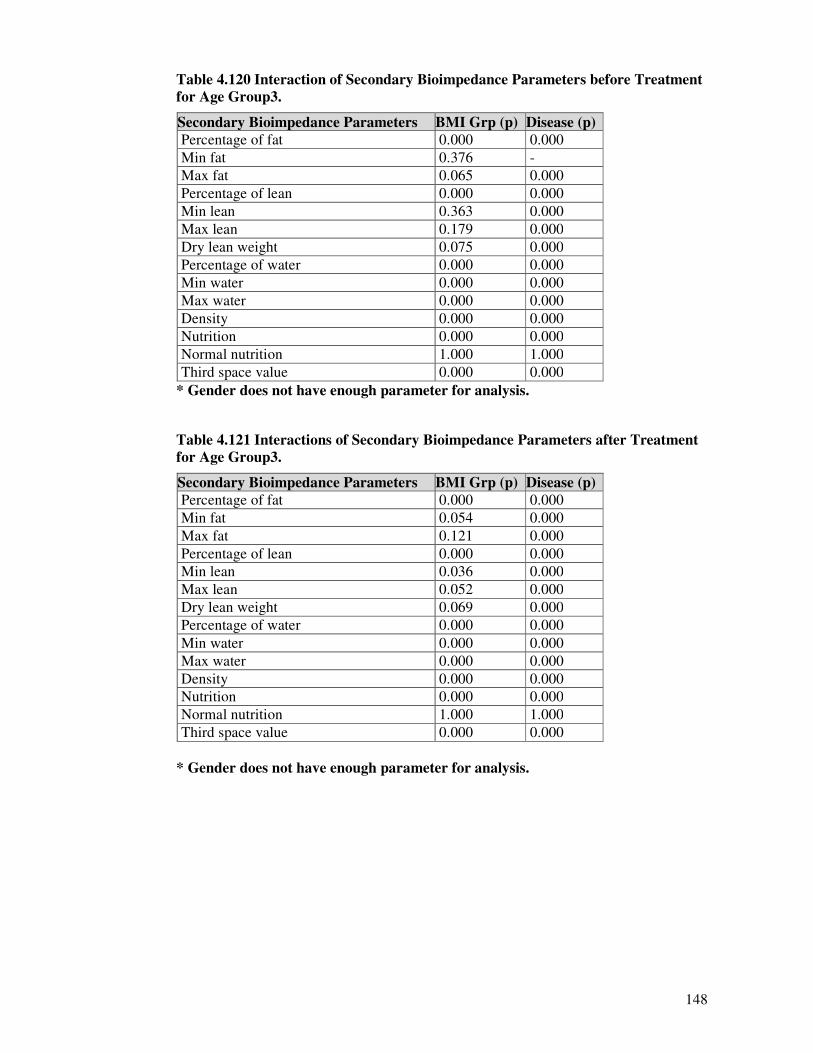
148
Table 4.120 Interaction of Secondary Bioimpedance Parameters before Treatment
for Age Group3.
Secondary Bioimpedance Parameters BMI Grp (p) Disease (p)
Percentage of fat 0.000 0.000
Min fat 0.376 -
Max fat 0.065 0.000
Percentage of lean 0.000 0.000
Min lean 0.363 0.000
Max lean 0.179 0.000
Dry lean weight 0.075 0.000
Percentage of water 0.000 0.000
Min water 0.000 0.000
Max water 0.000 0.000
Density 0.000 0.000
Nutrition 0.000 0.000
Normal nutrition 1.000 1.000
Third space value 0.000 0.000
* Gender does not have enough parameter for analysis.
Table 4.121 Interactions of Secondary Bioimpedance Parameters after Treatment
for Age Group3.
Secondary Bioimpedance Parameters BMI Grp (p) Disease (p)
Percentage of fat 0.000 0.000
Min fat 0.054 0.000
Max fat 0.121 0.000
Percentage of lean 0.000 0.000
Min lean 0.036 0.000
Max lean 0.052 0.000
Dry lean weight 0.069 0.000
Percentage of water 0.000 0.000
Min water 0.000 0.000
Max water 0.000 0.000
Density 0.000 0.000
Nutrition 0.000 0.000
Normal nutrition 1.000 1.000
Third space value 0.000 0.000
* Gender does not have enough parameter for analysis.

149
Table 4.122 Interaction of Main Bioimpedance Parameters before Treatment for
Age Group4.
Main Bioimpedance Parameters Gender (p) BMI group (p) Disease (p)
Impedance value at 5KHz 0.003 0.000 0.050
Impedance value at 50KHz 0.002 0.000 0.015
Impedance value at 100KHz 0.002 0.000 0.013
Impedance value at 200KHz 0.001 0.000 0.013
Reactance at 50KHz 0.012 0.000 0.746
Resistance at 50KHz 0.002 0.000 0.015
Phase Angle at 50 KHz 0.000 0.000 0.082
Basal metabolic rate 0.000 0.000 0.000
Intracellular water 0.000 0.000 0.000
Normal intracellular water 0.000 0.000 0.000
Extra-cellular water 0.000 0.000 0.000
Normal extra cellular water 0.000 0.000 0.000
Total body water volume 0.000 0.000 0.000
Min total body water volume 0.000 0.000 0.000
Max total body water volume 0.000 0.000 0.000
Body cell mass 0.000 0.000 0.000
Table 4.123 Interaction of Main Bioimpedance Parameters after Treatment for
Age Group4
Main Bioimpedance Parameters Gender (p) BMI group (p) Disease (p)
Impedance value at 5KHz 0.004 0.000 0.089
Impedance value at 50KHz 0.006 0.000 0.020
Impedance value at 100KHz 0.006 0.000 0.016
Impedance value at 200KHz 0.004 0.000 0.016
Reactance at 50KHz 0.029 0.000 0.282
Resistance at 50KHz 0.005 0.000 0.019
Phase Angle at 50 KHz 0.000 0.000 0.028
Basal metabolic rate 0.010 0.000 0.000
Intracellular water 0.000 0.000 0.000
Normal intracellular water 0.000 0.000 0.000
Extra-cellular water 0.000 0.000 0.000
Normal extra cellular water 0.000 0.000 0.000
Total body water volume 0.000 0.000 0.000
Min total body water volume 0.000 0.000 0.000
Max total body water volume 0.000 0.000 0.000
Body cell mass 0.000 0.000 0.000

150
Table 4.124 Interactions of Secondary Bioimpedance Parameters before
Treatment for Age Group4.
Secondary Bioimpedance Parameters Gender (p) BMI Grp (p) Disease (p)
Percentage of fat 0.001 0.000 0.071
Min fat 0.000 0.022 0.022
Max fat 0.000 0.001 0.001
Percentage of lean 0.001 0.000 0.071
Min lean 0.000 0.000 0.000
Max lean 0.000 0.000 0.000
Dry lean weight 0.000 0.000 0.000
Percentage of water 0.000 0.000 0.526
Min water 0.000 0.000 0.000
Max water 0.000 0.000 0.000
Density 0.000 0.000 0.021
Nutrition 0.000 0.002 0.000
Normal nutrition 0.000 0.001 0.001
Third space value 0.000 0.000 0.046
Table 4.125 Interactions of Secondary Bioimpedance Parameters after Treatment
for Age Group4.
Secondary Bioimpedance Parameters Gender (p) BMI Grp (p) Disease (p)
Percentage of fat 0.000 0.000 0.069
Min fat 0.000 0.022 0.022
Max fat 0.000 0.001 0.001
Percentage of lean 0.000 0.000 0.069
Min lean 0.000 0.000 0.000
Max lean 0.000 0.000 0.000
Dry lean weight 0.000 0.000 0.000
Percentage of water 0.002 0.000 0.575
Min water 0.000 0.000 0.000
Max water 0.000 0.000 0.000
Density 0.000 0.000 0.021
Nutrition 0.365 0.001 0.000
Normal nutrition - 0.001 0.001
Third space value 0.000 0.000 0.016

151
Table 4.126 Interaction of Main Bioimpedance Parameters before Treatment for
Age Group5.
Main Bioimpedance Parameters Gender (p) BMI group (p) Disease (p)
Impedance value at 5KHz 0.188 0.034 0.000
Impedance value at 50KHz 0.175 0.185 0.001
Impedance value at 100KHz 0.241 0.455 0.001
Impedance value at 200KHz 0.283 0.617 0.002
Reactance at 50KHz 0.062 0.000 0.259
Resistance at 50KHz 0.187 0.214 0.001
Phase Angle at 50 KHz 0.076 0.003 0.527
Basal metabolic rate 0.367 0.227 0.000
Intracellular water 0.075 0.113 0.000
Normal intracellular water 0.017 0.000 0.088
Extra-cellular water 0.003 0.056 0.001
Normal extra cellular water 0.072 0.003 0.000
Total body water volume 0.202 0.685 0.000
Min total body water volume 0.012 0.000 0.248
Max total body water volume 0.018 0.000 0.300
Body cell mass 0.080 0.112 0.000
Table 4.127 Interaction of Main Bioimpedance Parameters after Treatment for
Age Group5
Main Bioimpedance Parameters Gender (p) BMI group (p) Disease (p)
Impedance value at 5KHz 0.298 0.036 0.000
Impedance value at 50KHz 0.398 0.117 0.000
Impedance value at 100KHz 0.575 0.182 0.000
Impedance value at 200KHz 0.764 0.239 0.000
Reactance at 50KHz 0.016 0.001 0.000
Resistance at 50KHz 0.413 0.123 0.000
Phase Angle at 50 KHz 0.045 0.043 0.000
Basal metabolic rate 0.977 0.121 0.000
Intracellular water 0.032 0.096 0.000
Normal intracellular water 0.017 0.000 0.088
Extra-cellular water 0.001 0.011 0.006
Normal extra cellular water 0.072 0.003 0.000
Total body water volume 0.039 0.613 0.000
Min total body water volume 0.012 0.000 0.248
Max total body water volume 0.018 0.000 0.300
Body cell mass 0.031 0.093 0.000

152
Table 4.128 Interactions of Secondary Bioimpedance Parameters before
Treatment for Age Group5.
Secondary Bioimpedance Parameters Gender (p) BMI Grp (p) Disease (p)
Percentage of fat 0.000 0.000 0.000
Min fat 0.000 0.000 0.152
Max fat 0.000 0.000 0.077
Percentage of lean 0.000 0.000 0.000
Min lean 0.211 0.749 0.000
Max lean 0.141 0.383 0.000
Dry lean weight 0.140 0.000 0.008
Percentage of water 0.139 0.000 0.001
Min water 0.012 0.000 0.248
Max water 0.018 0.000 0.200
Density 0.000 0.000 0.000
Nutrition 0.000 0.002 0.000
Normal nutrition - 0.000 0.000
Third space value 0.000 0.000 0.002
Table 4.129 Interactions of Secondary Bioimpedance Parameters after Treatment
for Age Group 5.
Secondary Bioimpedance Parameters Gender (p) BMI Grp (p) Disease (p)
Percentage of fat 0.000 0.000 0.000
Min fat 0.000 0.000 0.026
Max fat 0.000 0.000 0.027
Percentage of lean 0.000 0.000 0.000
Min lean 0.011 0.595 0.000
Max lean 0.012 0.301 0.000
Dry lean weight 0.200 0.000 0.019
Percentage of water 0.587 0.000 0.002
Min water 0.012 0.000 0.248
Max water 0.018 0.000 0.300
Density 0.001 0.000 0.000
Nutrition 0.003 0.007 0.000
Normal nutrition - 0.000 0.000
Third space value 0.000 0.000 0.005

153
Appendix E:
Table 4.134 Interaction of Main Bioimpedance Parameters before Treatment for
BMI group2.
Main Bioimpedance Parameters Gender (p) Age Grp (p) Diseases (p)
Impedance value at 5KHz 0.001 0.0000 0.015
Impedance value at 50KHz 0.000 0.0001 0.060
Impedance value at 100KHz 0.000 0.0001 0.085
Impedance value at 200KHz 0.000 0.0002 0.118
Reactance at 50KHz 0.000 0.0000 0.000
Resistance at 50KHz 0.000 0.0001 0.065
Phase Angle at 50 KHz 0.802 0.0000 0.003
Basal metabolic rate 0.129 0.0000 0.000
Intracellular water 0.087 0.0000 0.000
Normal intracellular water 0.020 0.0000 0.000
Extra-cellular water 0.005 0.0000 0.000
Normal extra cellular water 0.006 0.0000 0.000
Total body water volume 0.003 0.0000 0.000
Min total body water volume 0.015 0.0000 0.000
Max total body water volume 0.028 0.0000 0.000
Body cell mass 0.086 0.0000 0.000
Table 4.135 Interaction of Main Bioimpedance Parameters after Treatment for
BMI group2.
Main Bioimpedance Parameters Gender (p) Age Grp (p) Diseases (p)
Impedance value at 5KHz 0.006 0.0000 0.004
Impedance value at 50KHz 0.007 0.0001 0.011
Impedance value at 100KHz 0.013 0.0001 0.015
Impedance value at 200KHz 0.018 0.0001 0.019
Reactance at 50KHz 0.116 0.0000 0.000
Resistance at 50KHz 0.007 0.0001 0.012
Phase Angle at 50 KHz 0.005 0.0000 0.127
Basal metabolic rate 0.036 0.0000 0.000
Intracellular water 0.011 0.0000 0.000
Normal intracellular water 0.020 0.0000 0.000
Extra-cellular water 0.007 0.0000 0.000
Normal extra cellular water 0.006 0.0000 0.000
Total body water volume 0.001 0.0000 0.000
Min total body water volume 0.015 0.0000 0.000
Max total body water volume 0.028 0.0000 0.000
Body cell mass 0.012 0.0000 0.000

154
Table 4.136 Interactions of Secondary Bioimpedance Parameters before
Treatment for BMI group2.
Secondary Bioimpedance Parameters Gender (p) Age Grp (p) Disease (p)
Percentage of fat 0.683 0.0000 0.0000
Min fat 0.262 0.0000 0.0000
Max fat 0.818 0.0000 0.0000
Percentage of lean 0.683 0.0000 0.0000
Min lean 0.419 0.0000 0.0000
Max lean 0.322 0.0000 0.0000
Dry lean weight 0.780 0.0000 0.0000
Percentage of water 0.205 0.1749 0.1815
Min water 0.015 0.0000 0.0000
Max water 0.028 0.0000 0.0000
Density 0.273 0.0004 0.0001
Nutrition 0.059 0.0000 0.0033
Normal nutrition - 0.0001 0.0000
Third space value 0.001 0.0088 0.0367
Table 4.137 Interactions of Secondary Bioimpedance Parameters after Treatment
for BMI group2.
Secondary Bioimpedance Parameters Gender (p) Age Grp (p) Disease (p)
Percentage of fat 0.164 0.000 0.000
Min fat 0.203 0.000 0.000
Max fat 0.752 0.000 0.000
Percentage of lean 0.164 0.000 0.000
Min lean 0.169 0.000 0.000
Max lean 0.146 0.000 0.000
Dry lean weight 0.935 0.000 0.000
Percentage of water 0.009 0.266 0.153
Min water 0.015 0.000 0.000
Max water 0.028 0.000 0.000
Density 0.049 0.000 0.001
Nutrition 0.002 0.000 0.000
Normal nutrition - 0.000 0.000
Third space value 0.001 0.162 0.021

155
Table 4.138 Interaction of Main Bioimpedance Parameters before Treatment for
BMI group3.
Main Bioimpedance Parameters Gender (p) Age Grp (p) Diseases (p)
Impedance value at 5KHz 0.000 0.000 0.0000
Impedance value at 50KHz 0.000 0.000 0.0000
Impedance value at 100KHz 0.000 0.000 0.0000
Impedance value at 200KHz 0.000 0.000 0.0000
Reactance at 50KHz 0.000 0.000 0.0000
Resistance at 50KHz 0.000 0.000 0.0000
Phase Angle at 50 KHz 0.004 0.000 0.0000
Basal metabolic rate 0.000 0.000 0.0000
Intracellular water 0.707 0.001 0.0000
Normal intracellular water 0.000 0.001 0.0000
Extra-cellular water 0.016 0.005 0.0000
Normal extra cellular water 0.000 0.000 0.0000
Total body water volume 0.006 0.005 0.0000
Min total body water volume 0.003 0.001 0.0000
Max total body water volume 0.002 0.003 0.0000
Body cell mass 0.630 0.001 0.0000
Table 4.139 Interaction of Main Bioimpedance Parameters after Treatment for
BMI group3.
Main Bioimpedance Parameters Gender (p) Age Grp (p) Diseases (p)
Impedance value at 5KHz 0.000 0.000 0.000
Impedance value at 50KHz 0.000 0.000 0.000
Impedance value at 100KHz 0.000 0.000 0.000
Impedance value at 200KHz 0.000 0.000 0.000
Reactance at 50KHz 0.002 0.000 0.000
Resistance at 50KHz 0.000 0.000 0.000
Phase Angle at 50 KHz 0.001 0.000 0.000
Basal metabolic rate 0.000 0.000 0.000
Intracellular water 0.286 0.001 0.000
Normal intracellular water 0.000 0.001 0.000
Extra-cellular water 0.099 0.001 0.000
Normal extra cellular water 0.000 0.000 0.000
Total body water volume 0.172 0.002 0.000
Min total body water volume 0.003 0.001 0.000
Max total body water volume 0.002 0.003 0.000
Body cell mass 0.298 0.001 0.000

156
Table 4.140 Interactions of Secondary Bioimpedance Parameters before
Treatment for BMI group3.
Secondary Bioimpedance Parameters Gender (p) Age Grp (p) Disease (p)
Percentage of fat 0.022 0.0000 0.0000
Min fat 0.000 0.0000 0.0000
Max fat 0.000 0.0000 0.0000
Percentage of lean 0.022 0.0000 0.0000
Min lean 0.000 0.0001 0.0000
Max lean 0.005 0.0002 0.0000
Dry lean weight 0.002 0.0000 0.0000
Percentage of water 0.030 0.0620 0.0000
Min water 0.003 0.0013 0.0000
Max water 0.002 0.0035 0.0000
Density 0.000 0.0002 0.0000
Nutrition 0.007 0.0000 0.0000
Normal nutrition - 0.0002 0.0000
Third space value 0.006 0.0069 0.0000
Table 4.141 Interactions of Secondary Bioimpedance Parameters after Treatment
for BMI group 3.
Secondary Bioimpedance Parameters Gender (p) Age Grp (p) Disease (p)
Percentage of fat 0.258 0.000 0.0000
Min fat 0.003 0.000 0.0000
Max fat 0.000 0.000 0.0000
Percentage of lean 0.258 0.000 0.0000
Min lean 0.000 0.000 0.0000
Max lean 0.000 0.000 0.0000
Dry lean weight 0.003 0.000 0.0000
Percentage of water 0.015 0.012 0.0000
Min water 0.003 0.001 0.0000
Max water 0.002 0.003 0.0000
Density 0.003 0.000 0.0000
Nutrition 0.002 0.000 0.0000
Normal nutrition . 0.000 0.0000
Third space value 0.022 0.000 0.0000

157
Table 4.142 Interaction of Main Bioimpedance Parameters before Treatment for
BMI group4.
Main Bioimpedance Parameters Gender (p) Age Grp (p) Diseases (p)
Impedance value at 5KHz 0.0000 0.0000 0.0000
Impedance value at 50KHz 0.0000 0.0000 0.0000
Impedance value at 100KHz 0.0000 0.0000 0.0000
Impedance value at 200KHz 0.0000 0.0000 0.0000
Reactance at 50KHz 0.0002 0.0000 0.0000
Resistance at 50KHz 0.0000 0.0000 0.0000
Phase Angle at 50 KHz 0.0056 0.0000 0.0000
Basal metabolic rate 0.0092 0.0000 0.0000
Intracellular water 0.0006 0.0000 0.0000
Normal intracellular water 0.0000 0.0000 0.0000
Extra-cellular water 0.0000 0.0000 0.0000
Normal extra cellular water 0.0000 0.0000 0.0000
Total body water volume 0.0003 0.0000 0.0000
Min total body water volume 0.0000 0.0000 0.0000
Max total body water volume 0.0001 0.0000 0.0000
Body cell mass 0.0005 0.0000 0.0000
Table 4.143 Interaction of Main Bioimpedance Parameters after Treatment for
BMI group 4.
Main Bioimpedance Parameters Gender (p) Age Grp (p) Diseases (p)
Impedance value at 5KHz 0.070 0.0001 0.0000
Impedance value at 50KHz 0.059 0.0003 0.0001
Impedance value at 100KHz 0.049 0.0001 0.0000
Impedance value at 200KHz 0.046 0.0001 0.0000
Reactance at 50KHz 0.040 0.0000 0.0380
Resistance at 50KHz 0.059 0.0003 0.0001
Phase Angle at 50 KHz 0.005 0.0000 0.0000
Basal metabolic rate 0.008 0.0000 0.0000
Intracellular water 0.001 0.0000 0.0000
Normal intracellular water 0.000 0.0000 0.0000
Extra-cellular water 0.001 0.0000 0.0000
Normal extra cellular water 0.000 0.0000 0.0000
Total body water volume 0.006 0.0000 0.0000
Min total body water volume 0.000 0.0000 0.0000
Max total body water volume 0.000 0.0000 0.0000
Body cell mass 0.001 0.0000 0.0000

158
Table 4.144 Interactions of Secondary Bioimpedance Parameters before
Treatment for BMI group 4.
Secondary Bioimpedance Parameters Gender (p) Age Grp (p) Disease (p)
Percentage of fat 0.003 0.0000 0.0000
Min fat 0.000 0.0015 0.0000
Max fat 0.000 0.0001 -
Percentage of lean 0.003 0.0000 0.0000
Min lean 0.016 0.0000 0.0000
Max lean 0.000 0.0000 0.0000
Dry lean weight 0.017 0.0000 0.0000
Percentage of water 0.006 0.0000 0.0000
Min water 0.000 0.0000 0.0000
Max water 0.000 0.0000 0.0000
Density 0.001 0.0000 0.0000
Nutrition 0.000 0.0000 0.0000
Normal nutrition - 0.0000 0.0000
Third space value 0.047 0.0000 0.0000
Table 4.145 Interactions of Secondary Bioimpedance Parameters after Treatment
for BMI group 4.
Secondary Bioimpedance Parameters Gender (p) Age Grp (p) Disease (p)
Percentage of fat 0.041 0.0000 0.0000
Min fat 0.000 0.0001 0.0000
Max fat 0.000 0.0001 0.0000
Percentage of lean 0.041 0.0000 0.0000
Min lean 0.014 0.0000 0.0000
Max lean 0.011 0.0000 0.0000
Dry lean weight 0.012 0.0000 0.0000
Percentage of water 0.070 0.0000 0.0000
Min water 0.000 0.0000 0.0000
Max water 0.000 0.0000 0.0000
Density 0.031 0.0000 0.0000
Nutrition 0.007 0.0000 0.0000
Normal nutrition - 0.0000 0.0000
Third space value 0.029 0.0000 0.0000

159
Table 4.146 Interaction of Main Bioimpedance Parameters before Treatment for
BMI group 5.
Main Bioimpedance Parameters Age Grp (p) Diseases (p)
Impedance value at 5KHz 0.000 0.000
Impedance value at 50KHz 0.000 0.000
Impedance value at 100KHz 0.000 0.000
Impedance value at 200KHz 0.000 0.000
Reactance at 50KHz 0.000 0.000
Resistance at 50KHz 0.000 0.000
Phase Angle at 50 KHz 0.000 0.000
Basal metabolic rate 0.000 0.000
Intracellular water 0.000 0.000
Normal intracellular water 0.000 0.000
Extra-cellular water 0.000 0.000
Normal extra cellular water 0.000 0.000
Total body water volume 0.000 0.000
Min total body water volume - -
Max total body water volume - -
Body cell mass 0.000 0.000
* Gender doesn’t have enough parameter for analysis.
Table 4.147 Interaction of Main Bioimpedance Parameters after Treatment for
BMI group 5.
Main Bioimpedance Parameters Age Grp (p) Diseases (p)
Impedance value at 5KHz 0.000 0.000
Impedance value at 50KHz 0.000 0.000
Impedance value at 100KHz 0.000 0.000
Impedance value at 200KHz 0.000 0.000
Reactance at 50KHz 0.000 0.000
Resistance at 50KHz 0.000 0.000
Phase Angle at 50 KHz 0.000 0.000
Basal metabolic rate 0.000 0.000
Intracellular water 0.000 0.000
Normal intracellular water 0.000 0.000
Extra-cellular water 0.000 0.000
Normal extra cellular water 0.000 0.000
Total body water volume 0.000 0.000
Min total body water volume - -
Max total body water volume - -
Body cell mass 0.000 0.000
* Gender does not have enough parameter for analysis.

160
Table 4.148 Interactions of Secondary Bioimpedance Parameters before
Treatment for BMI group 5.
Secondary Bioimpedance Parameters Age Grp (p) Disease (p)
Percentage of fat 0.0000 0.0000
Min fat - -
Max fat - -
Percentage of lean 0.0000 0.0000
Min lean - -
Max lean - -
Dry lean weight 0.0000 0.0000
Percentage of water 0.0000 0.0000
Min water - -
Max water - -
Density 0.0000 0.0000
Nutrition 0.0011 0.0011
Normal nutrition 1.0000 1.0000
Third space value 0.0000 0.0000
* Gender does not have enough parameter for analysis.
Table 4.149 Interactions of Secondary Bioimpedance Parameters after Treatment
for BMI group 5.
Secondary Bioimpedance Parameters Age Grp (p) Disease (p)
Percentage of fat 0.0000 0.0000
Min fat - -
Max fat - -
Percentage of lean 0.0000 0.0000
Min lean - -
Max lean - -
Dry lean weight 0.0000 0.0000
Percentage of water 0.0000 0.0000
Min water - -
Max water - -
Density 0.0000 0.0000
Nutrition 1.0000 1.0000
Normal nutrition 1.0000 1.0000
Third space value 0.0000 0.0000
* Gender does not have enough parameter for analysis.

161
Appendix F:
Table 4.154 Interaction of Main Bioimpedance Parameters before Treatment for
diseases group 2.
Main Bioimpedance Parameters Gender (p) Age Grp (p) BMI Grp(p)
Impedance value at 5KHz 0.000 0.001 0.190
Impedance value at 50KHz 0.001 0.005 0.065
Impedance value at 100KHz 0.001 0.005 0.078
Impedance value at 200KHz 0.002 0.008 0.063
Reactance at 50KHz 0.010 0.000 0.000
Resistance at 50KHz 0.001 0.005 0.065
Phase Angle at 50 KHz 0.031 0.260 0.002
Basal metabolic rate 0.000 0.000 0.219
Intracellular water 0.000 0.000 0.359
Normal intracellular water 0.002 0.061 0.108
Extra-cellular water 0.000 0.000 0.457
Normal extra cellular water 0.000 0.006 0.913
Total body water volume 0.000 0.000 0.121
Min total body water volume 0.029 0.001 0.355
Max total body water volume 0.001 0.060 0.037
Body cell mass 0.000 0.000 0.366
Table 4.155 Interaction of Main Bioimpedance Parameters after Treatment for
Diseases group 2.
Main Bioimpedance Parameters Gender (p) Age Grp (p) BMI Grp(p)
Impedance value at 5KHz 0.000 0.000 0.527
Impedance value at 50KHz 0.000 0.000 0.439
Impedance value at 100KHz 0.000 0.001 0.424
Impedance value at 200KHz 0.000 0.001 0.416
Reactance at 50KHz 0.002 0.000 0.000
Resistance at 50KHz 0.000 0.001 0.437
Phase Angle at 50 KHz 0.001 0.125 0.006
Basal metabolic rate 0.000 0.000 0.365
Intracellular water 0.000 0.000 0.498
Normal intracellular water 0.002 0.061 0.108
Extra-cellular water 0.000 0.000 0.621
Normal extra cellular water 0.000 0.006 0.913
Total body water volume 0.000 0.000 0.202
Min total body water volume 0.029 0.001 0.355
Max total body water volume 0.001 0.060 0.037
Body cell mass 0.000 0.000 0.500

162
Table 4.156 Interactions of Secondary Bioimpedance Parameters before
Treatment for Diseases group 2.
Secondary Bioimpedance Parameters Gender (p) Age Grp (p) BMI Grp (p)
Percentage of fat 0.071 0.000 0.000
Min fat 0.000 0.018 0.000
Max fat 0.000 0.051 0.000
Percentage of lean 0.071 0.000 0.000
Min lean 0.000 0.000 0.238
Max lean 0.000 0.000 0.169
Dry lean weight 0.000 0.000 0.146
Percentage of water 0.508 0.000 0.000
Min water 0.029 0.001 0.355
Max water 0.001 0.060 0.037
Density 0.041 0.000 0.000
Nutrition 0.189 0.083 0.455
Normal nutrition - 0.000 0.001
Third space value 0.259 0.000 0.000
Table 4.157 Interactions of Secondary Bioimpedance Parameters after Treatment
for diseases group 2.
Secondary Bioimpedance Parameters Gender (p) Age Grp (p) BMI Grp (p)
Percentage of fat 0.419 0.000 0.000
Min fat 0.002 0.072 0.000
Max fat 0.00 0.066 0.000
Percentage of lean 0.419 0.000 0.000
Min lean 0.000 0.000 0.340
Max lean 0.000 0.000 0.229
Dry lean weight 0.000 0.000 0.172
Percentage of water 0.988 0.000 0.000
Min water 0.029 0.001 0.355
Max water 0.001 0.060 0.037
Density 0.220 0.000 0.000
Nutrition 0.281 0.041 0.394
Normal nutrition - 0.000 0.001
Third space value 0.194 0.000 0.000

163
Table 4.158 Interaction of Main Bioimpedance Parameters before Treatment for
diseases group 3.
Main Bioimpedance Parameters Gender (p) Age Grp (p) BMI Grp(p)
Impedance value at 5KHz 0.003 0.005 0.000
Impedance value at 50KHz 0.003 0.008 0.000
Impedance value at 100KHz 0.002 0.011 0.000
Impedance value at 200KHz 0.002 0.014 0.000
Reactance at 50KHz 0.017 0.000 0.000
Resistance at 50KHz 0.003 0.009 0.000
Phase Angle at 50 KHz 0.002 0.410 0.000
Basal metabolic rate 0.005 0.000 0.000
Intracellular water 0.004 0.000 0.000
Normal intracellular water 0.009 0.000 0.000
Extra-cellular water 0.008 0.000 0.000
Normal extra cellular water 0.009 0.000 0.000
Total body water volume 0.005 0.000 0.000
Min total body water volume 0.012 0.000 0.000
Max total body water volume 0.009 0.000 0.000
Body cell mass 0.004 0.000 0.000
Table 4.159 Interaction of Main Bioimpedance Parameters after Treatment for
diseases group 3.
Main Bioimpedance Parameters Gender (p) Age Grp (p) BMI Grp(p)
Impedance value at 5KHz 0.002 0.005 0.000
Impedance value at 50KHz 0.002 0.008 0.000
Impedance value at 100KHz 0.002 0.010 0.000
Impedance value at 200KHz 0.002 0.011 0.000
Reactance at 50KHz 0.005 0.000 0.000
Resistance at 50KHz 0.002 0.009 0.000
Phase Angle at 50 KHz 0.011 0.063 0.002
Basal metabolic rate 0.009 0.000 0.000
Intracellular water 0.006 0.000 0.000
Normal intracellular water 0.009 0.000 0.000
Extra-cellular water 0.008 0.000 0.000
Normal extra cellular water 0.009 0.000 0.000
Total body water volume 0.005 0.000 0.000
Min total body water volume 0.012 0.000 0.000
Max total body water volume 0.009 0.000 0.000
Body cell mass 0.006 0.000 0.000

164
Table 4.160 Interactions of Secondary Bioimpedance Parameters before
Treatment for Diseases group 3.
Secondary Bioimpedance Parameters Gender (p) Age Grp (p) BMI Grp (p)
Percentage of fat 0.001 0.001 0.000
Min fat 0.000 0.000 0.000
Max fat 0.016 0.000 0.000
Percentage of lean 0.001 0.001 0.000
Min lean 0.007 0.000 0.000
Max lean 0.005 0.000 -
Dry lean weight 0.009 0.000 0.000
Percentage of water 0.002 0.000 0.000
Min water 0.012 0.000 0.000
Max water 0.009 0.000 0.000
Density 0.001 0.000 0.000
Nutrition 0.004 0.007 0.000
Normal nutrition - 0.000 0.000
Third space value 0.008 0.000 0.000
Table 4.161 Interactions of Secondary Bioimpedance Parameters after Treatment
for diseases group 3.
Secondary Bioimpedance Parameters Gender (p) Age Grp (p) BMI Grp (p)
Percentage of fat 0.001 0.001 0.000
Min fat 0.001 0.002 0.000
Max fat 0.003 0.000 0.000
Percentage of lean 0.001 0.001 0.000
Min lean 0.009 0.000 0.000
Max lean 0.010 0.000 0.000
Dry lean weight 0.013 0.000 0.000
Percentage of water 0.001 0.000 0.000
Min water 0.012 0.000 0.000
Max water 0.009 0.000 0.000
Density 0.001 0.002 0.000
Nutrition 0.002 0.004 0.000
Normal nutrition - 0.000 0.000
Third space value 0.006 0.000 0.000

165
Table 4.162 Interaction of Main Bioimpedance Parameters before Treatment for
diseases group 4.
Main Bioimpedance Parameters Gender (p) Age Grp (p) BMI Grp(p)
Impedance value at 5KHz 0.000 0.000 0.001
Impedance value at 50KHz 0.000 0.000 0.001
Impedance value at 100KHz 0.000 0.000 0.003
Impedance value at 200KHz 0.000 0.000 0.005
Reactance at 50KHz 0.016 0.000 0.000
Resistance at 50KHz 0.000 0.000 0.001
Phase Angle at 50 KHz 0.013 0.000 0.002
Basal metabolic rate 0.643 0.001 0.000
Intracellular water 0.260 0.000 0.000
Normal intracellular water 0.346 0.000 0.000
Extra-cellular water 0.205 0.000 0.000
Normal extra cellular water 0.927 0.000 0.000
Total body water volume 0.795 0.000 0.000
Min total body water volume 0.234 0.000 0.000
Max total body water volume 0.245 0.000 0.000
Body cell mass 0.276 0.000 0.000
Table 4.163 Interaction of Main Bioimpedance Parameters after Treatment for
Diseases group 4.
Main Bioimpedance Parameters Gender (p) Age Grp (p) BMI Grp(p)
Impedance value at 5KHz 0.000 0.000 0.000
Impedance value at 50KHz 0.001 0.000 0.000
Impedance value at 100KHz 0.001 0.000 0.000
Impedance value at 200KHz 0.001 0.000 0.000
Reactance at 50KHz 0.012 0.000 0.001
Resistance at 50KHz 0.001 0.000 0.000
Phase Angle at 50 KHz 0.001 0.000 0.004
Basal metabolic rate 0.809 0.000 0.000
Intracellular water 0.156 0.000 0.000
Normal intracellular water 0.346 0.000 0.000
Extra-cellular water 0.073 0.000 0.000
Normal extra cellular water 0.927 0.000 0.000
Total body water volume 0.505 0.000 0.000
Min total body water volume 0.234 0.000 0.000
Max total body water volume 0.245 0.000 0.000
Body cell mass 0.150 0.000 0.000

166
Table 4.164 Interactions of Secondary Bioimpedance Parameters before
Treatment for Female Diseases group 4.
Secondary Bioimpedance Parameters Gender (p) Age Grp (p) BMI Grp (p)
Percentage of fat 0.037 0.000 0.000
Min fat 0.032 0.000 0.000
Max fat 0.016 0.000 0.001
Percentage of lean 0.037 0.000 0.000
Min lean 0.608 0.000 0.000
Max lean 0.472 0.000 0.000
Dry lean weight 0.901 0.000 0.000
Percentage of water 0.016 0.000 0.000
Min water 0.234 0.000 0.000
Max water 0.245 0.000 0.000
Density 0.315 0.000 0.000
Nutrition 0.000 0.000 0.069
Normal nutrition - 0.000 0.007
Third space value 0.000 0.000 0.000
Table 4.165 Interactions of Secondary Bioimpedance Parameters after Treatment
for diseases group 4.
Secondary Bioimpedance Parameters Gender (p) Age Grp (p) BMI Grp (p)
Percentage of fat 0.109 0.000 0.000
Min fat 0.048 0.000 0.000
Max fat 0.024 0.000 0.000
Percentage of lean 0.109 0.000 0.000
Min lean 0.514 0.000 0.000
Max lean 0.237 0.000 0.000
Dry lean weight 0.654 0.000 0.000
Percentage of water 0.035 0.000 0.000
Min water 0.234 0.000 0.000
Max water 0.245 0.000 0.000
Density 0.441 0.000 0.000
Nutrition 0.000 0.000 0.057
Normal nutrition - 0.000 0.007
Third space value 0.000 0.000 0.000

167
Table 4.166 Interaction of Main Bioimpedance Parameters before Treatment for
diseases group 5
Main Bioimpedance Parameters Gender (p) Age Grp (p) BMI Grp(p)
Impedance value at 5KHz 0.012 0.000 0.000
Impedance value at 50KHz 0.000 0.000 0.000
Impedance value at 100KHz 0.000 0.000 0.000
Impedance value at 200KHz 0.000 0.000 0.000
Reactance at 50KHz 0.000 0.000 0.000
Resistance at 50KHz 0.000 0.000 0.000
Phase Angle at 50 KHz 0.000 0.000 0.000
Basal metabolic rate 0.000 0.000 0.000
Intracellular water 0.001 0.000 0.000
Normal intracellular water 0.000 0.003 0.000
Extra-cellular water 0.000 0.000 0.000
Normal extra cellular water 0.000 0.000 0.000
Total body water volume 0.000 0.000 0.000
Min total body water volume 0.000 0.007 -
Max total body water volume 0.000 0.012 -
Body cell mass 0.001 0.000 0.000
Table 4.167 Interaction of Main Bioimpedance Parameters after Treatment for
Male diseases group 5.
Main Bioimpedance Parameters Gender (p) Age Grp (p) BMI Grp(p)
Impedance value at 5KHz 0.235 0.000 0.000
Impedance value at 50KHz 0.013 0.000 0.000
Impedance value at 100KHz 0.020 0.000 0.000
Impedance value at 200KHz 0.021 0.000 0.000
Reactance at 50KHz 0.000 0.000 0.000
Resistance at 50KHz 0.013 0.000 0.000
Phase Angle at 50 KHz 0.000 0.000 0.000
Basal metabolic rate 0.000 0.000 0.000
Intracellular water 0.001 0.000 0.000
Normal intracellular water 0.000 0.003 0.000
Extra-cellular water 0.000 0.000 0.000
Normal extra cellular water 0.000 0.000 0.000
Total body water volume 0.000 0.000 0.000
Min total body water volume 0.000 0.007 -
Max total body water volume 0.000 0.012 -
Body cell mass 0.001 0.000 0.000

168
Table 4.168 Interactions of Secondary Bioimpedance Parameters before
Treatment for Diseases group 5.
Secondary Bioimpedance Parameters Gender (p) Age Grp (p) BMI Grp (p)
Percentage of fat 0.000 0.001 0.000
Min fat 0.000 0.000 -
Max fat 0.000 0.006 -
Percentage of lean 0.000 0.001 0.000
Min lean 0.001 0.000 -
Max lean 0.001 0.000 -
Dry lean weight 0.000 0.000 0.000
Percentage of water 0.000 0.169 0.000
Min water 0.000 0.007 -
Max water 0.000 0.012 -
Density 0.295 0.000 0.000
Nutrition 0.000 0.000 0.000
Normal nutrition - 0.000 0.000
Third space value 0.090 0.058 0.000
Table 4.169 Interactions of Secondary Bioimpedance Parameters after Treatment
for diseases group 5.
Secondary Bioimpedance Parameters Gender (p) Age Grp (p) BMI Grp (p)
Percentage of fat 0.000 0.001 0.000
Min fat 0.000 0.000 -
Max fat 0.000 0.019 -
Percentage of lean 0.000 0.001 0.000
Min lean 0.003 0.000 0.000
Max lean 0.001 0.000 0.000
Dry lean weight 0.000 0.000 0.000
Percentage of water 0.000 0.149 0.000
Min water 0.000 0.007 -
Max water 0.000 0.012 -
Density 0.295 0.000 0.000
Nutrition 0.000 0.000 0.000
Normal nutrition - 0.000 0.000
Third space value 0.011 0.043 0.000

169
Table 4.170 Interaction of Main Bioimpedance Parameters before Treatment for
diseases group 6.
Main Bioimpedance Parameters Gender (p) Age Grp (p) BMI Grp(p)
Impedance value at 5KHz 0.007 0.120 0.026
Impedance value at 50KHz 0.006 0.083 0.119
Impedance value at 100KHz 0.009 0.053 0.173
Impedance value at 200KHz 0.011 0.034 0.204
Reactance at 50KHz 0.009 0.000 0.000
Resistance at 50KHz 0.007 0.077 0.132
Phase Angle at 50 KHz 0.001 0.000 0.224
Basal metabolic rate 0.000 0.006 0.346
Intracellular water 0.034 0.077 0.054
Normal intracellular water 0.060 0.278 0.000
Extra-cellular water 0.034 0.430 0.005
Normal extra cellular water 0.060 0.063 0.000
Total body water volume 0.013 0.063 0.205
Min total body water volume 0.058 0.404 0.000
Max total body water volume 0.065 0.419 0.000
Body cell mass 0.032 0.077 0.052
Table 4.171 Interaction of Main Bioimpedance Parameters after Treatment for
Diseases group 6.
Main Bioimpedance Parameters Gender (p) Age Grp (p) BMI Grp(p)
Impedance value at 5KHz 0.015 0.039 0.014
Impedance value at 50KHz 0.012 0.031 0.080
Impedance value at 100KHz 0.012 0.022 0.117
Impedance value at 200KHz 0.011 0.015 0.142
Reactance at 50KHz 0.000 0.030 0.000
Resistance at 50KHz 0.011 0.030 0.086
Phase Angle at 50 KHz 0.000 0.001 0.039
Basal metabolic rate 0.000 0.003 0.449
Intracellular water 0.036 0.082 0.070
Normal intracellular water 0.060 0.278 0.000
Extra-cellular water 0.022 0.414 0.009
Normal extra cellular water 0.060 0.063 0.000
Total body water volume 0.010 0.058 0.290
Min total body water volume 0.058 0.404 0.000
Max total body water volume 0.065 0.419 0.000
Body cell mass 0.034 0.084 0.069

170
Table 4.172 Interactions of Secondary Bioimpedance Parameters before
Treatment for Diseases group 6.
Secondary Bioimpedance Parameters Gender (p) Age Grp (p) BMI Grp (p)
Percentage of fat 0.000 0.000 0.000
Min fat 0.021 0.011 0.000
Max fat 0.019 0.033 0.000
Percentage of lean 0.000 0.000 0.000
Min lean 0.003 0.008 0.302
Max lean 0.004 0.040 0.137
Dry lean weight 0.001 0.005 0.160
Percentage of water 0.002 0.006 0.000
Min water 0.058 0.404 0.000
Max water 0.065 0.419 0.000
Density 0.000 0.000 0.000
Nutrition 0.003 0.019 0.108
Normal nutrition - 0.000 0.018
Third space value 0.005 0.065 0.000
Table 4.173 Interactions of Secondary Bioimpedance Parameters after Treatment
for Female diseases group 6.
Secondary Bioimpedance Parameters Gender (p) Age Grp (p) BMI Grp (p)
Percentage of fat 0.000 0.000 0.000
Min fat 0.021 0.011 0.000
Max fat 0.011 0.014 0.000
Percentage of lean 0.000 0.000 0.000
Min lean 0.003 0.010 0.287
Max lean 0.002 0.025 0.190
Dry lean weight 0.001 0.004 0.203
Percentage of water 0.003 0.004 0.000
Min water 0.058 0.404 0.000
Max water 0.065 0.419 0.000
Density 0.000 0.000 0.000
Nutrition 0.266 0.004 0.063
Normal nutrition - 0.000 0.018
Third space value 0.020 0.020 0.000