chapter one introduction 1.1 background to the...
TRANSCRIPT
1
CHAPTER ONE
INTRODUCTION
1.1 Background to the Study
Since the 1960s to date, small and medium sized enterprises (SMEs) have been given due
recognitions especially in the developed nations for playing very important roles towards
fostering accelerated economic growth, development and stability within several economies
(Yitzhaki, 2006). They make-up the largest proportion of businesses all over the world and play
tremendous roles in employment generation, provision of goods and services, creating a better
standard of living, as well as immensely contributing to the gross domestic products (GDPs) of
many countries (OECD, 2000).Over the last few decades, the contributions of the SMEs sector,
the development of the largest economies in the world have beamed the searchlight on the
uniqueness of the SMEs; and this have succeeded in overruling previously held views that SMEs
were only ―miniature versions‖ of larger companies (Al-Shaikh 1998; Gaskill et al. 1993).
And although Small and Medium Enterprises have been at the center of the policy debate for
quite some time in both developed and developing countries, little analytical work has been
undertaken in this area.The dearth information that exists among researchers on Small and
Medium Enterprises however provides a sense of how important this sector is for sustainable
development in emerging economies (Medina, 2001). For instance, recent studies conducted by
United Nations Industrial Development Organization (UNIDO) concur that SMEs are: labor-
intensive, providing more opportunities for low-skilled workers, correlated with lower income
distribution inequality, necessary for agriculture-dependent nations transitioning to an industrial-
2
and service-oriented economy, excellent sites for innovation and sustainable initiatives due to
their inherent flexibility and risk-taking ability (Patricoff & Sunderland, 2005).
In both the UK and Nigeria, the SMEs sector constitutes the largest proportion of the entire
businesses. In the UK for instance, SMEs represent over 95 percent of all businesses and
contribute over 65 percent of the labor force as well as over 30 percent of the GDP (Day 2000;
Dewhurst and Burns 1993). Likewise, In Nigeria, data from the Federal Office of Statistics
reveal that about 97 percent of the entire enterprises in the country are SMEs and they employ an
average of 50 percent of the working population as well as contributing up to 50 percent to the
countries industrial output (Ariyo ,1999; Ihua ,2005).
Globally, the growth of any economy is dependent on vibrant SMEs and when the reverse seems
the case, the entire economy suffers. The stunted growth of the economy has often been blamed
on many factors, top of which is the challenge of uncoordinated tax administration that has
crippled production capacity of the SMEs (Yitzhaki, 2006). One of the major impediments to the
growth of SMEs is the issue of taxation. The yoke of taxes on SMEs ranked second among the
factors stunting the growth of the economy in USA (Thuronyi, 2009). Thuronyi says that taxes
are heavy yokes that frustrates existing investors, and scares away prospective ones.
A study conducted by Shome (2004), in collaboration with the Washington, United States-based
Center for International Private Enterprise exposed the actual extent of the burden of multiple
taxation on SMEs in South America. According to Shome, the Jamaican business environment is
being suffocated by too many taxes from the national, federal and local governments. Indeed, an
3
indigenous restaurant operator, barber or a hairdresser who has to pay taxes to the various tiers of
government in addition to the cost of powering his business via generators, and paying staff
salaries will find it an herculean task making profit to keep his business afloat because of high
overhead incurred (Terkper, 2003).
In Africa, the same attention about the growth and ensuing challenges of SMEs has continued to
top discussions among researchers. According to Terkper (2007) and estimates from the
Manufacturers Association of Nigeria (MAN) about 1,000 SMEs firms in Nigeria that set out to
do business in the country annually end up shutting down due to the unfriendly business
environment. Taxes confront the manufacturing sector in different shapes and shades viz: import
duties, export & excise duties, sales and VAT, withholdings and income taxes, mobile
advertising & billboard levies, education, levies, social responsibility charges (Terkper, 2007).
Taxation practice in Ivory Coast became more pronounced and prevalent in the late 1980‘s. This
concern was first raised by Foluso (2007) who noted that about 154 taxes had identified in the
country, and expressed doubt whether these taxes could attract serious investors into the county.
According to him, taxation undermines the quest for economic transformation and it is pushing
organizations to retrench staff because of the high cost of doing business.
In Gambia, companies pay taxes on more than 100 items imposed by both the state and its
various Local Governments. According to Cordes, Hertzfeld & Vonortas (1999) in Survey of
High Technology Firms, they identified several effects of successful taxation as economically:
4
counter productive, destroys investor confidence, raises cost of doing business and it is one of
the major threats to the growth of manufacturing sector in Gambia.
As pointed out earlier in this study, SMEs are important to almost all economies in the world, but
especially to those in developing countries like Kenya. And although there are many small and
medium enterprises in Kenya, this study involves itself with 656 SMEs which make tax returns
to KRA and have a turn over of Ksh 5 million and above. In addition, SMEs have been divided
under four major categories. Theses are: services (airline, hotels, education, health, commercial,
general services and clearing and forwarding), wholesalers and retailers, manufacturing and
agriculture and financial services (construction, financial services Government, NGOs and real
estates), (KRA, 2010). The growth and size distribution of firms within a country --from the very
labour intensive to the very capital intensive is of course influenced by taxation behavior.
Achievement of this growth is more difficult if SME activity in general is discouraged by harsh
policy of taxation (Cohen, Nelson & Walsh, 2000). Using data collected from the personal tax
returns of sole proprietors in the US for 2003 and 2006, Carroll (2007) found evidence that
marginal tax rates exert statistically and quantitatively significant influence on the growth of
SMEs.
In Kenya, while comparison tax costs are difficult to measure, the few studies carried out on
taxation have concluded that while total business tax costs tend to be higher for large companies,
as a percentage of sales ,they are significantly also higher for SMEs (Osambo, 2009).
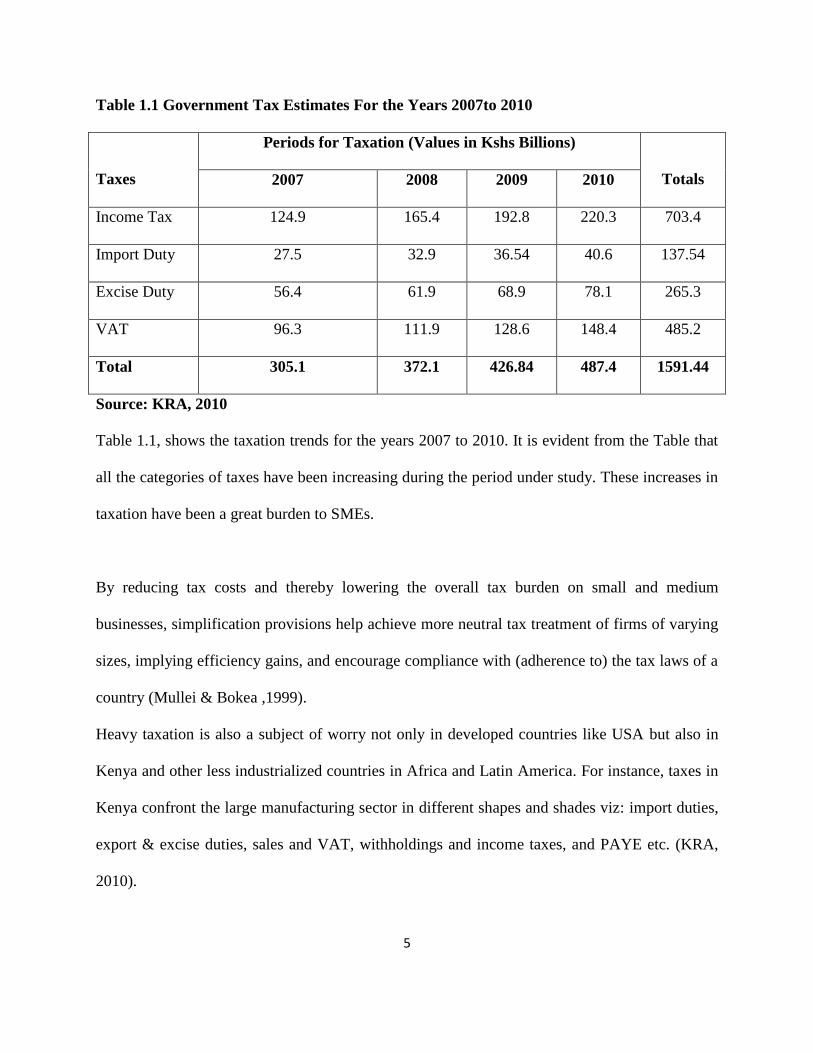
Government tax estimates for the years 2007to 2010 is shown in Table 1.1.
5
Table 1.1 Government Tax Estimates For the Years 2007to 2010
Taxes
Periods for Taxation (Values in Kshs Billions)
Totals 2007 2008 2009 2010
Income Tax 124.9 165.4 192.8 220.3 703.4
Import Duty 27.5 32.9 36.54 40.6 137.54
Excise Duty 56.4 61.9 68.9 78.1 265.3
VAT 96.3 111.9 128.6 148.4 485.2
Total 305.1 372.1 426.84 487.4 1591.44
Source: KRA, 2010
Table 1.1, shows the taxation trends for the years 2007 to 2010. It is evident from the Table that
all the categories of taxes have been increasing during the period under study. These increases in
taxation have been a great burden to SMEs.
By reducing tax costs and thereby lowering the overall tax burden on small and medium
businesses, simplification provisions help achieve more neutral tax treatment of firms of varying
sizes, implying efficiency gains, and encourage compliance with (adherence to) the tax laws of a
country (Mullei & Bokea ,1999).
Heavy taxation is also a subject of worry not only in developed countries like USA but also in
Kenya and other less industrialized countries in Africa and Latin America. For instance, taxes in
Kenya confront the large manufacturing sector in different shapes and shades viz: import duties,
export & excise duties, sales and VAT, withholdings and income taxes, and PAYE etc. (KRA,
2010).
6
The high levels of taxation of SMEs in Africa and in Kenya in particular, warrants attention on
accelerated research areas aimed at addressing the overall effects of taxation on SMEs (Osambo,
2009). By studying taxation behavior in five different countries (USA, Gambia, Nigeria, South
Africa and Kenya), Derwent (2000) concluded that increased tax burden is a major threat on the
overall growth of SMEs.
A major area of concern therefore is how to reduce the effects of high tax burden on SMEs. One
contribution and response to this phenomenon, has been the role of entrepreneur‘s innovative
characteristics (Stoner, 2002). In his contribution, Stoner identified several characteristics of an
entrepreneur mainly conceptual fluency, uniqueness, authoritative and flexibility and creative.
According to Robbins (2006), one of the importance of creativity is that it enables entrepreneurs
to appraise and understands problems more fully and to see things differently and also enable
them to have a change of approach to problem solving.
Can the idea of creativity and innovation be applied by SMEs to help reduce and cope with the
heavy tax burden in Nairobi County? It is against this scenario that this study is established.
Furthermore, the study will attempt to identify all the taxes subjected to SMEs and their effects
on the various levels of operations on the business enterprises. In addition, the study will
establish the innovative coping mechanisms utilized by the SMEs to respond to the current
effects of taxation. The specific concern will be to examine the possible effects of taxation on
such various levels of operations and the consequent innovative and creative mechanisms that
can be employed by SMEs to respond to the tax effects.
1.2 Statement of the Research Problem
7
Taxation has been identified as a major threat to the growth of small and medium enterprises not
only in highly industrialized countries such USA but also less industrialized countries; Kenya in
particular (Burke & Jarratt, 2004). For instance, in Kenya, Income tax is a direct tax charged on
business income, employment income, rent income, pensions, and investment income. There are
many methods applied in the collection of income tax which include PAYE, withholding tax,
installment tax, advance tax, presumptive income tax and the direct payments to the
Commissioner of Domestic Taxes for balance of tax and arrears. According to KRA (2009),
PAYE is a method for collecting tax at source from individuals in gainful employment. Indirect
taxation which is charged includes VAT (Value added tax), corporation tax, and installment tax
and excise duties. The stunted growth of the SMEs has often been blamed largely on the
challenge of taxation (Gaskill,, Auken & Manning, 1993).
Taxation in general increases the costs of operation of running small and medium enterprises. To
compensate for the increased costs of operation, prices on goods are raised thus causing the
amounts of sales to go down. And the effects of reduced sales are reduced profits, reduced
capital base and slow creation of employment resulting to slow growth (Thuronyi, 2009).
A question that appears to generate surprisingly little debate in Kenya is the scope for legally
mitigating taxes by individuals and SMEs. It is within this backdrop that the current study is
established
Entrepreneurship is about change (Richard Cantillon, 1730 as quoted in Baer, 1993) and since
entrepreneurs are innovators, they should devise ways and means of coping with the adverse and
threatening effects of taxation in order to survive, grow and sustain their businesses. How then
can Kenyan individuals and business enterprises arrange their affairs within the current legal
8
environment so as to minimize their tax burden? The current research will seek to answer this
research question.
1.3 The Research Objectives
The study will attempt to achieve the following general objective, which will further be sub-
divided into subsequent specific objectives.
1.3.1 General Objectives
The general objective of this study will be to examine the innovative tax coping mechanisms by
SMEs in Nairobi County.
1.3.2 Specific Objectives
The specific objectives of the study will be to:
1. To assess the effect of taxation on the costs of operation of small and medium
enterprises.
2. To compare taxation effect on the growth of varying small and medium enterprises
(services, wholesalers and retailers, manufacturers and agriculture and financial services).
3. Evaluate business security measures on the growth of small and medium enterprises.
1.4 Hypotheses
The study will test several hypotheses that are as follows.
1. HO: There is no significant difference in the effect of taxation on the various costs of
operation of SMEs
H1: Taxation increases the various costs of operation of SMEs

9
2. Ho: There is no significant difference in the effect of taxation on the growth of
varying small and medium enterprises
H1: There is significant difference in the effect of taxation on the growth of varying
small and medium enterprises
3. HO: There is no significant difference in the effect of tax security measures on the
growth of small and medium enterprises
H1: There is significant difference in the effect of tax security measures on the growth
of small and medium enterprises
1.5. Justification of the Study
The researcher hopes that the findings of the study will go a long way to improve the
management of taxation in Kenya. In the first place, the findings will be useful to the Ministry of
Finance in formulating a policy action plan to address the negative impact of taxation to the
growth of SMEs in Kenyan. Similarly, the recommendations will provide useful suggestions to
the players to enable them deal with the challenges facing the growth of SMEs.
Furthermore, the outcomes of the study may become a very resourceful reference material to
various stakeholders in the economy and readers in general interested in gaining more
knowledge about the effect of taxation on the growth of SMEs.
Specifically, financial institutions and investors in technologies will find the information useful
when developing programmes to suit the growth of SMEs. Finally the study results and
recommendations may provide useful information to scholars keen on carrying out research in
matters pertaining to taxation and their effect on the growth of SMEs.
1.6. Scope of the Study

10
The study will be carried out in Nairobi County.
The current research will cover SMEs randomly selected from different types of businesses in
Nairobi County. It is to the opinion of the author that carrying out a research in Nairobi County
only will be adequate since extending it to other areas will amount to a replication. Incidentally,
all the other factors influencing SMEs growth other than taxation will be held constant
And, although the County has many Small and Medium Enterprises, only those SMEs that make
tax returns to KRA will be included in the current study.
1.7. Organization of the Study
This chapter contains three chapters. In Chapter One, an introduction to the topical issue is made.
This introductory chapter gives the background to the study. The chapter also presents the
problem the study intends to investigate, the objectives it hopes to achieve and the hypotheses
statements it intends to test. A brief statement of the anticipated usefulness of the study also
forms part of this introductory chapter. The scope of the study concludes the chapter.
Chapter Two sheds light on the review of related literature, which will basically dwell on
taxation, growth of SMEs, taxation and the effect of taxation on the growth of SMEs. Theoretical
literature on taxation and the growth of SMEs will also be discussed.
A conceptual framework that relates the relationship among variables in the study will also be
presented.

11
In chapter three, the researcher presents the research design and methodology that will describe
the research design, target population, sample and sampling procedures. This chapter also
contains a description of the instruments that will be used for data collection, validity and
reliability of these instruments, data collection and analysis procedures.
12
CHAPTER TWO
LITERATURE REVIEW
2.1 Introduction
This chapter reviews literature concerning the theoretical and analytical evidence on the
underlying effect of taxation and the subsequent innovative tax coping mechanisms employed by
the SMEs. First, in section 2.2, a review of the Concept of SMEs, relevance of SMEs to the
development of national economy and socio-economic background of Nairobi County are
presented. In section 2.3, an overview of tax and taxation are also presented. A discussion of tax
multiplicity and types of taxations is made in subsections 2.3.1 and 2.3.2. In section 2.4, the
concept of entrepreneurship is presented. Theories of entrepreneurship have been covered in
section 2.5. A brief description of the models of innovation and creativity is presented in section
2.6. In section 2.7, the effect of taxation on the growth of SMEs is reviewed. Innovative tax
copying mechanisms employed by SMEs has been dealt with in section 2.8. Critical literature
reviews of the topics under consideration are further considered in section 2.9. A summary on
the literature review, the research opportunity and the conceptual framework for the current
study are discussed in section 2.10 and section 2.11.
2.2 The Small and Medium Enterprises
2.2.1 The Concept of Small and Medium Enterprises
Small scale enterprises have so many definitions due to different criteria employed by different
people and institutions in defining it. There is no single, uniformly accepted definition of a small
firm (Storey, 1994).
13
Firms differ in their levels of capitalization, sales and employment. Hence, definitions which
employ measures of size (number of employees, turnover, profitability, net worth, etc) when
applied to one sector could lead to all-firm being classified as small, while the same size
definition when applied to a different sector could lead to a different result.
Scholars, researchers and international bodies have always attempted to provide a standard
definition of SMEs. No such definitions have been accepted universally. However, the
followings are some definitions of small and medium scale enterprises: the World Bank
Document (Report No 71 14) of 1988, Nigeria defined small and medium enterprises as one
whose total fixed assets (excluding land) plus cost of investment do not exceed ten million naira
in constant 1985 price. Mead (1998) sees SMEs as firms with less than 50 employees and at leas
half the output is sold.
According to Bolton committee (1971) defined small and medium scale enterprise as a firm that
meets the following three criteria: it has a relatively small share of their market place; it is
managed by owners in a personalized way, and not through the medium of a formalized
management structure and it is independent, in the sense of not forming part of a large enterprise.
There are various criteria of size that might be used to define an SME (turnover, number of
employees, capital base, profits, extent of imports and exports), and various definition have
indeed been developed for application in a range of countries. The centre for industrial Research
and development (1990) defined small scale industries as one whose total assets in capital
equipment, plant and working capital are less than tow hundred and fifty thousand naira and
employing fewer than fifty full-time workers.
14
Onwe (2006) observed that Central Bank of Nigeria (2002) defined SME as a firm with capital
outlay of not more than N200 m. National Council of Industry (2003) defined small industry as
a project with capital investment of over N1.5 million but not more than N50 million and/or
work force of between 1 to 100 workers.
A definition of small and medium scale enterprises which has enjoyed wider acceptance is the
one given by the United States Committee for Economic Development (2002). It defined small
scale enterprise as any enterprise that is characterized by, at least, two of the following features:
management is dependent – usually managers are also the owners; capital is supplied and
ownership is held by an individual or small group; area is localized; while workers and the
owners are of one home or community, market need not be local; and the size of the firm is small
relative to the industry.
In fact, the concept, small scale enterprise often called small and ‗medium-size enterprise (SME)
is relative and dynamic, hence there is no universal definition for small and medium scale
enterprises. Researchers, because of this problem of definition adopt definitions for small and
medium-scale enterprises, which are more appropriate to their particular target group. To this
end, small scale enterprise within the context of this work is any business organization which has
working capital between one hundred thousand naira and ten million naira excluding land and
employs fewer than fifty full-time workers.
Sule (1986) observed that definitions of SMEs vary across countries and business environment
as a result of differences in industrial organization at different level of ‗economic development in
15
parts of the same country. Characteristics of SMEs identified by Sule include the following
distinguishing factors: tax payers tend to be few, owner of the business is also the manager,
transactions are based on cash payments and hardly bank payments, the businesses normally
have a dynamic lifespan, and the places of business for SMEs are normally fixed but volatile and
react to changes/demands. On accounting standards, SMEs tend to have little accounts or records
SMEs have a focus on meeting local customers for their market reach and administratively,
SMEs engage few or no professional unlike major companies run by professionals (Boune,
2007).
2.2.2 Relevance of SMEs to the Development of National Economy
Small-scale enterprises are dominating other aspects of enterprises in the world economy and
Kenya‘s in particular.
According to Nwankwo (1992), it is estimated that probably up to 90 percent of all registered
business organizations in Nigeria are in the category of small and medium scale enterprises. In
the case of Ebonyi State, over 96 percent of the business organizations are small-scale
businesses. The Kenyan scenario is not different either with hundreds of companies registered
daily at the registrar of companies‘ house. Records available at KRA (2010) show that there are
over nine hundred SMEs that make tax returns.
The importance and contributions of small scale enterprises to national economy‘s growth cannot
be over-emphasized. They play a crucial role in providing solid base for a country‘s social
economic development. Small scale enterprises produce goods and services for both end and
intermediate users and also utilize low capital cost for creating jobs especially in the fast growing
service sector of the economy.
16
Liedholm and mead (1987) observed that small and medium scale enterprises provide productive
employment and earning opportunities. Longnecker et‘al (1997) postulated that small scale
enterprises in united state of America have created over 3 million new jobs in manufacturing
between 1976 and 1986. SSES also play a vital role of introducing innovations. Records show
that many scientific breakthroughs have originated with independent inventors and small
organizations. Longenecker, Moore and petty (1997) suggest, on the basis of several studies by
the U.S Department of commerce, that 50 percent of all innovations since world war if have coke
from new and smaller firms.
Ekhator (2001) found out that most countries in the world that have attained advanced stage in
industrial development and did so because they started their industrial development with
programmes in the small and medium scale enterprises. SMEs foster linkages within industries
and between industries and other sectors of the economy, (Olusoji, 1999). SMEs can also,
contribute to long run industrial growth by producing an increasing number of firms that grow up
and out of small scale sector. They accelerate rural development and promote the utilization of
domestic‖ resources by adapting to local markets and local sources of material.
Enudu (1999) noted that small-scale enterprises make use of waste material from big industries
for further production. Small business can be an aid to personal and national self-reliance. Ukeje
(2003) noted that small-scale business enterprises contribute 70 percent of industrial employment
in Kenyan economy though it accounts for only 10-15 percent of manufacturing output. In fact
there abound many economic cum social roles SMEs play in the development of the national
17
economy. To this effect, policies that would facilitate their utilization should be adopted by
concerned authorities.
In realization of the advantages of promoting SMEs, Kenyan government is at the forefront in
promoting the growth of SMEs in all parts of the country in partnership with development
partners, financial institutions and enterprise agencies. In Nigeria, the Federal Government of
Nigeria has continued to play pioneering and active roles in stimulating SMEs (Obitayo, 1991).
The government has established many institutions to facilitate the growth of SMEs. These
institutions include the National Directorate of Employment (NDE), the Family Economic
Advancement Programme (FEAP) etc. The government also provided technical assistance to
SSEs through its various agencies such as the Industrial Development Centre (IDCs) centre for
Industrial Research and Development (CIR), Project Development Centre (PRODA), Small and
Medium Scale Enterprise Development Agency of Nigeria (SMEDAN), Small and Medium
Scale Enterprise Investment Equity Scheme (SMEIES) etc specifically, the government has
played lead role in:
Young Lee and Roger Gordon (2005) gave the following suggestions in their Background Paper
for Tax Dialogue Conference,‘‘ that for SMEs to fully develop and use their potential, they need
specific policy measures to ensure that technology services and infrastructure are provided‘‘.
Further, research and development institutions that are publicly funded should be encouraged to
target the technology needs of SMEs.
Secondly, the problem of access to information may be attributed to the inadequacy of SME
support institutions. The need for a supportive policy to encourage the establishment of
documentation centers and information networks to provide information to SMEs at an
18
affordable price (Foluso, 2007).
Thirdly, the government should come up with training for training managerial and technical
courses for the small enterprises entrepreneurs. Equally, there should be business information
centers (Terkper, 2007).
Fourthly, government should come up with proper regulatory policies that are small enterprises
friendly since many of what we have in Kenya; frustrate every effort of a junior entrepreneur.
The policies we seem to have, seemed to cater for the well-established businesses.
Since majority of small enterprises lack finance, government should establish friendly small
loaning system. This would include low interests rates to ensure the continuity of these
businesses (Foluso, 2007).
2.2.3 Socio-Economic Background of Nairobi County
Nairobi is the capital city of Kenya with a thriving SMEs sector that exhibit both formal and
informal characteristics. The SMEs in Nairobi‘s industrial area play a major role in providing
products and services to a major population of Nairobi. They also contribute a great deal to the
country‘s economic growth. Major players in the sector come from the middle and lower class
levels of the society which comprises of the majority of the population in Nairobi living in
Eastland, Eastleigh, Makadara, Mlolongo, South B Estate, sprawling Mathare slums, Kibera and
Mukuru Kwa Njenga among others.
2.3 An Overview of Tax and Taxation
Scholars, researchers and economists have always attempted to define and understand the term
taxation. However, these groups of experts have not yet defined and standardized the meaning of

19
tax and taxation (Erosa, Gustavo & Walter, 2009). The origin of the terms tax and taxation has
always been a subject of controversy among economists and researchers. Scanty literature on this
subject has attempted to trace the first known system of taxation to Ancient Egypt in around
3000 BC - 2800 BC in the first dynasty of the Old Kingdom (McCluskey, William; Franzsen, &
Riël, 2005). However, the controversy of taxation has also been compounded by the critical
forms that existed then. Such obsolete forms of taxation include seigniorage( the tax on the
creation of money), Scutage tax paid in lieu of military service- a non-tax obligation ), Tallage (
a tax on feudal dependents) and Tithe ( a tax-like payment (one tenth of one's earnings or
agricultural produce), paid to the Church. By bringing theses historical issues on tax and taxation
to the fore, and how these terms have been understood by generational scholars, key concepts
have been identified and used (Arundel & Kabla, 1998).
Anyanwu (1997) noted that taxation has three principal objectives, which are regulation of the
economy and economic activities, raising of revenue for the government and controlling of
income and employment.
Revenue realizable form taxation depends on some factors but principally on the tax base and
rate. Tax base refers to the specification of the minimum amount above which is taxable, while
tax rate is the amount which is levied per unit of base. Tax bases simply are those objects upon
which tax revenue are derived (Mansfield 1973).
Tax system, therefore, should be consistent with over-all economic policy, which may include
such objectives as favoring savings over consumption and raising private investment. Taxes no
matter the type and how there are being administered bear effects on payer. Effects of taxation
are the changes in the economy consequent upon tax imposition. Anyanwu (1997) contends that
20
the presence of tax distorts the pattern of production, consumption, investment, employment and
other similar patterns for good or for bad and these distortions are collectively viewed as the
effects to taxation.
Lewis (2005) observed that an effective and efficient tax administration system is integral to any
country‘s well being. The proper amount of tax must be collected in a timely manner and the
enforcement powers of the tax administration must provide an even playing field for business by
ensuring that all taxpayers meet their tax filing and paying requirements. The tax administration
must balance its educational and assistance role with its enforcement role. The overriding goal is
to foster voluntary compliance with the tax laws. This represents a significant challenge in a
developing economy.
Taxes may have a great variety of effects. They may cause some goods to become more
expensive relative to others and so cause a change in the pattern of consumption. They may fail
more heavily on some households than others, thus altering the distribution of net income. ―they
may effect people‘s willingness to work and to save, and to take risks, that is, they may effect the
total supply to resource s available to the economy‖, (Seddon 1973).
Raymond & Jakob in their investigation carried out in Ugandan firms on ―Are corruption and
Taxation Really Harmful to Growth? Firm Level Evidence‖: Journal of Development Economics
(2007) studied the relationship between bribery payments, taxes and firm growth. Using
industry-location averages to circumvent potential problems of endogeneity and measurement
errors, and found that both the rate of taxation and bribery are negatively correlated with firm
growth. A one-percentage point increase in the bribery rate is associated with a reduction in firm
21
growth of three percentage points, an effect that is about three times greater than that of taxation.
This provides some validation for firm-level theories of corruption which posits that corruption
retards the development process to an even greater extent than taxation.
Bhatt (1973) noted that the tax system is an organic part of the economic system, and hence it is
essential that there be some certainty and stability about its basic features. According to him, a
large number of ad hoc change3 each year create a climate of uncertainty, which hampers
productive effort and diverts valuable scarce resources towards speculative and other undesirable
channels, as well as encouraging efforts to circumvent the government measures. Thus, the
qualitative aspect of taxation in the conventional economic analysis is not much concerned with
the revenue-yielding capacity a tax but with its effects on economic unites who are subjected to
the payment of tax.
2.3.1 Tax Multiplicity
Tax policy in both developed and developing countries has been largely used to generate
maximum revenue for the government and as a result its use for optimal allocation of resources
or redistribution of income is being neglected. Anyanwu (1997) noted that tax authority in
Nigeria has concentrated on the manipulation of the rates and tax bases in order to generate
enough revenue for the government. According to Anyanwu, this has led to imposing of different
types of taxes and levies by tax authorities. These different taxes which should have otherwise
come under one major type of tax but are split into many forms are in, this work refereed to as
―multiple tax‖.
22
Ndokwu (1988) observed that so many taxes are imposed at different or supplementary rates and
it involves different tax bases and different times of payment. In Nigeria, Tax policy planning is
not clearly assigned to specific unit rather than on long term studies, (Anyanwu 1997). Utomi
(2000) in line with this view noted that Nigeria has a confused taxation philosophy. This results
in proliferation f taxes and tax laws hence tax multiplicity.
Awake (2003) observed that over 300 different taxes are paid by tax payers in some African
countries, while in some Asian countries, local officials impose dozen of illegal charges from
fees for, growing bananas to taxes on slaughtering pigs-either to top up (increase) the local
finances or pad their on pockets.
Taxes generally provide basis for government revenue, which help them in carrying out their
functions. This is why Ojo (1996) defined tax as a means by which government appropriate part
of private sector‘s income and expenditure as its revenue for the purpose of meeting recurrent
expenditure and creating public capitals formation towards the development and growth of goods
and services of the economy.
A good tax possesses the following qualities: fairness, convenience, simplicity and minimum
cost of collection and minimum distortions. Ravelo (1980) noted that taxes should be chosen so
as to minimize interference with economic decisions in otherwise efficient markets. Imposition
of excess burden should be minimized. Again, a good tax system should permit efficient and
non-arbitrary administration and it should be understandable to the taxpayer. Taxes therefore are
known to play important role in the process of development of an economy. This is the role of
providing finance for government expenditure. There are three main objectives of taxation.
23
These include raising of revenue for the government, regulating the economy and economic
activities, and controlling of income and employment.
To tax is to impose a financial charge or other levy upon a taxpayer (an individual or legal entity)
by a state or the functional equivalent of a state such that failure to pay is punishable by law.
Taxes are also imposed by many sub- national entities. Taxes consist of direct tax or indirect tax,
and may be paid in money or as its labor. A tax may be defined as a pecuniary burden laid upon
individuals or property owners to support the government. A tax "is not a voluntary payment or
donation, but an enforced contribution, exacted pursuant to legislative authority" and is "any
contribution imposed by government, whether under the name of toll, tribute, impost, duty,
custom, excise, subsidy, aid, supply, or other name‖ (Erosa & Ventura,2009).
The legal definition and the economic definition of taxes differ in that economists do not
consider many transfers to governments to be taxes. For example, some transfers to the public
sector are comparable to prices. Examples include tuition at public universities and fees for
utilities provided by local governments. Governments also obtain resources by creating money
(e.g., printing bills and minting coins), through voluntary gifts (e.g., contributions to public
universities and museums), by imposing penalties (e.g., traffic fines), by borrowing, and by
confiscating wealth. From the view of economists, a tax is a non-penal, yet compulsory transfer
of resources from the private to the public sector levied on a basis of predetermined criteria and
without reference to specific benefit received.
In modern taxation systems, taxes are levied in money, but in-kind and corvée taxation is a
characteristic of traditional or pre-capitalist states and their functional equivalents. The method
24
of taxation and the government expenditure of taxes raised is often highly debated in politics and
economics. Tax collection is performed by a government agency such as Canada Revenue
Agency, the Internal Revenue Service (IRS) in the United States, or Her Majesty's Revenue and
Customs (HMRC) in the UK and KRA in Kenya. When taxes are not fully paid, civil penalties
(such as fines or forfeiture) or criminal penalties (such as incarceration) may be imposed on the
non-paying entity or individual.
In Kenya, taxation is the single largest source of government budgetary resources. A study
carried out by Moyi & Ronge (2006) found out that between 1995 and 2004, tax revenue
constituted 80.4% of total government revenue (including grants).
Taxation is used to raise sufficient revenue to fund public spending without recourse to excessive
public sector borrowing. Secondly, it is used to mobilize revenue in ways that are equitable and
that minimize its disincentive effects on economic activities (ibid).
Unfortunately, over the same period, Kenya has moved from being a low tax burden country to a
high tax burden country, yet the country still faces the obvious need for more tax revenues to
maintain public services.
According to Sessional Paper No 1 of 1986 (GOK, 1996), the Kenyan Government initiated
essential policy goals: raise the tax revenue-GDP ratio from 22% in 1986 to 24% by the period
1999/2007, promote saving and investment by placing a greater burden on taxation of
consumption , devise a tax structure that distributes income equitably and promotes rural-urban
balance, make industry more competitive through reviews of import duties and export
compensation, design a buoyant and elastic tax system that keeps revenues expanding at the
25
same pace with income growth without annual changes in rates, Reduce compliance and
administrative costs through low and rationalized tax rates, wider tax bases, self-assessment
systems and taxpayer education and services. These reform goals gave birth to the Kenya
Revenue Authority (KRA) which was incorporated in 1995.
Thus, KRA amalgamated the five main revenue departments that were initially in the Ministry of
Finance namely Customs Duty, Excise Duty, Sales Tax, Income Tax and Corporate Tax).
According to Karingi et al (2005), there have been criticisms leveled against KRA resulting to
the problem of ambitious and rapidly changing tax/GDP targets that are externally induced as
well as the failure to reform local government taxation. One of the mistakes of the Kenyan tax
reform, Karingi continues, is poor sequencing, which results in policy reforms that hurts the
growth of SMEs.
Kenya, like many other developing countries, seeks to apply the tax weapon so as to meet the
objectives of raising enough revenue. The three main factors of production –labor, capital and
land- are used in varying proportions in the productive process of the economy. The returns to
these factors- wages, profits and rent –are taxed if the objectives of the tax policy are to be met.
In Kenya, the tax system has mainly concentrated on taxing individual income (Personal .Income
Tax-PIT), profits (Corporate Income Tax-CIT) and goods and services (VAT, excise duties).
However, when this is done progressively, it may hurt some important part of the economic
which includes the SMEs.
26
King & McGrath (2002, observed that compared with a sample of low-income sub-Saharan
countries, Kenya‘s tax/GDP ratio is higher than the sample average. The imbalance between
government revenue and expenditure results in large and chronic fiscal deficits. In theory, the
financing of a deficit especially through foreign borrowing or additional foreign financing may
have considerable effects on interest rates, the balance of payments and the external value of the
currency, in this case the shilling. This has prompted Kenya to initiate reforms in the tax
structure with diverse objectives. Unfortunately, the reform process began at a time when the
macro-economic environment was unstable thus inhibiting the growth of SMEs.
Although has Kenya embarked on massive tax reforms since1986, little is known about the
actual effect of such tax to the growth of SMEs. It is not known how the reforms have affected
each tax source. The current study attempts to fill this research gap.
If well designed, taxation has the capacity to raise the incremental savings ratio, which is one of
the main determinants of growth (Prest, 1985). The growth in tax revenue must approximate the
growth in expenditure for the players of economy to hold (World Bank, 1990).
Osoro ( 199) identifies the main elements of the tax reforms programmes beneficial to the
growth of SMES which include: Imposing a small number of taxes with the broadest possible
base and moderate rates ,using VAT to replace commodity taxes in order to minimize
disincentives for investments and exports , not only avoiding raising taxes on the poor, but also
reducing their tax burden-this is achieved by levying excise duties on luxury items and
exempting foodstuffs to protect the low-income groups., avoiding tax incentives and shifting to
broader, simpler tax bases on which lower rates are applied, minimizing corporate tax evasion
27
(some countries levy minimum taxes on a company‘s net worth).,lowering distortions that reduce
economic welfare and growth (World Bank, 1990).
Unfortunately, in Kenya more often, tax systems has emphasized the introduction of either new
taxes or new rates on existing bases, more stringent administrative changes and the need to
widen tax bases and reduce exemptions (Thirsk, 1991).
According to Musgrave (1987), taxation issues include impact of alternative taxes on saving and
investment and the resultant challenges for micro balance of the economy. Reforms according to
him should address the issue of equity in the distribution of the tax burden as well as
composition of the tax structure.
Kenya‘s tax programme, Wagacha (1999) argues, should seek to (a) improve the efficiency and
productivity of taxation, (b) improve tax collection and administration while lowering the rates,
and (c) gain tax effectiveness through greater tax elasticity. On the basis of tax/GDP , this author
observes that Kenya‘s tax burden (averaging 26.6%) is high by international standards and
therefore the ultimate objective of a tax reform scheme should be to lower the excessive tax
burden and efficiency costs of taxation.
2.3.2 Types of Taxation
Taxes consist of direct tax or indirect tax. In the current study, both direct and indirect taxes will
be considered since it is easier to measure. According to Osambo (2009), direct taxes include
income tax, VAT, customs and excise, national insurance, corporation tax and excise duties.
28
Income tax is probably the most important tax of all, raising well over a quarter of all tax
revenue. It is charged on all income, but the rate increases the more income is earned. The first
part is tax-free, but then once you have earned this personal allowance the tax rate is 10% for the
next chunk of income. The level at which the rate changes is termed the tax band and these tend
to be changed in the budget each year to keep up with inflation. Income tax is collected by the
Central governments (Cordes, Hertzfeld & Vonortas, 2004).
In Kenya, Income tax is a direct tax charged on business income, employment income, rent
income, pensions, and investment income. There are many methods applied in the collection of
income tax. Which include PAYE, withholding tax, installment tax, advance tax, presumptive
income tax and the direct payments to the Commissioner of Domestic Taxes for balance of tax
and arrears. According to KRA (2009), PAYE is a method for collecting tax at source from
individuals in gainful employment. In this type of taxation, the employer is empowered to deduct
tax according to the prevailing rates of tax from their employees‘ salary or wages on each payday
for a month then remit it to the Paymaster.
Withholding tax is a form of income tax deducted at source from the following sources of
income: interest, dividends, royalties, management or professional fees, commission, pensions,
and rent received by non-resident persons.
Advance tax which was introduced in 1996, is a tax paid in advance before a public service
vehicle or commercial vehicle is licensed. The tax is applicable to vans, pickups, trucks, Lorries
and saloons.

29
The main goal of income tax has been to enhance collection by broadening the tax base.
However, when this tax is done excessively, it hurts the most contributory agents of the economy
(Wanjohi & Mugure, 2008).
VAT (Value added tax) is a tax on spending and is therefore an indirect tax. VAT is charged at
every stage of the production and the only people who pay VAT as a tax are the consumers. A
firm has to keep a record of all the VAT they have paid on their supplies and all the VAT they
have collected on their sales. The current rate of VAT in Kenya is 16 % (KRA, 2011).
VAT was introduced in Kenya in 1990 to replace sales tax. Since 1991, VAT has been
broadened to cover the service sector. Stringent measures includes the raising of the minimum
turnover level for compulsory registration from Ksh10, 000 to Ksh40, 000 and introducing stiff
penalties for defaulters in the following areas: late VAT returns, failure to issue VAT invoices
and failure to maintain proper books of account, an aspect of VAT that elicited much interest
from the taxpayers especially the SMEs (Nyamunga, 2001).
The national insurance is paid by both employers and employees. According to Cordes, Herzfeld
Vonortas (2004), national insurance is a fund maintained by government to pay out for those
unemployed and when one reaches retirement age.
Corporation tax is the main business tax. This is a tax charged on company profits and the rate
varies according to the size of the business. It is effectively an income tax for business as their
income is their profit. Business do also have to pay local business taxes (business rates) to local
authorities in the area they are located in, but corporation tax is collected by the national
government ( Kortum & Lerner ,1999). In Kenya, corporation tax is income tax levied on
30
corporate bodies such as Limited Companies, Trust, and Co-operatives. Resident companies are
taxable at a rate of 30 % while non-resident companies are taxable at the rate of 37.5 % on the
taxable income KRA (2009).
Installment tax is paid by both individual and corporate taxpayers who have tax payable for any
year, except in the case of those individuals whose tax liability for a particular year is fully
covered under PAYE, or whose final tax liability is below Ksh 40000.
Excise duties are also taxes on spending and are termed indirect taxes, but they are taxes on
specific goods. Excise duties are charged on alcohol, tobacco, and petrol and gambling. Theses
taxes tend to be increased each year in the Budget. This is because they are usually set at a fixed
rate and so need to be increased to ensure that the revenue from them keeps up with inflation.
Excise duties are intended to try to reduce consumption because of the harmful social costs that
may be generated as a result (pollution from petrol, etc.). Since 1991, the coverage of excise
duties has expanded from domestic production to include imports. Excise duties were
rationalized to cover the luxury goods tax element on wine, beer, spirits, mineral water, tobacco
products, matches, luxury passenger cars and minibuses. Automotive fuels and cosmetics were
also introduced into the excise tax net (Nyamunga, 2001).
Allingham & Sandmo (2004) identifies various taxes that are synonymous with the informal
sector. According to them, there are two types of direct presumptive taxes: –withholding and
direct tax on all or below threshold businesses. On the other hand, presumptive withholding taxes
31
requires formal sector tax collector such as customs (imports or exports), marketing agency
(agricultural, forestry, etc products), government or private corporation (goods and services
purchases), corporation (dividends), financial institution (interest income, pensions, etc).
One of the key objectives of tax reforms in Kenya is to ensure that the tax system can be
harnessed to mitigate the perpetual fiscal imbalances. This can be achieved through tax policies
intended to make the yield of individual taxes responsive to changes in national income. In
addition, it is expected that the predominant taxes in the revenue would be those with highly
elastic yields with respect to national income (Kinyanjui & Moyi, 2008). Incidentally this
assertion can not hold true when SMEs continue to suffer heavy taxation burdens.
2.4 Concept of Entrepreneurship
Entrepreneurship is an outcome of complex balancing of opportunity initiatives, risks and
rewards (Mamun, 2000). Entrepreneurship is as a process by which people pursue opportunities,
fulfilling needs and wants through innovations, without regard to the resources they currently
control. Entrepreneurial resource is vital ingredient of economic development whereas a key
element of economic development is that the 'people of the country' must be major participants in
the process that brought about changes in structure of economic and population growths along
with consumption pattern. According to North (1990), through the process of entrepreneurship, it
is possible to augment the scope of capital formation, employment generation and facilitate
industrialization in a country. In addition, entrepreneurship acts as a powerful tool of
employment generation, raising productivity through innovation, facilitating transfer of
32
technology, playing key role in commercializing new products, redistribution of wealth and
income, earning foreign exchanges and promoting social welfare (North ,1990).
The concept of entrepreneurship as stated by Rauch & Frese (2000) is multifaceted and used in a
wide variety of contexts. At its heart are entrepreneurs, i.e. persons that are believed to have
characteristic traits or behave in some characteristic way. On the basis of these characteristic
traits entrepreneurship is described as an innovator who undertakes the new combinations of
factors of production. Innovation may occur in the form of: i) the introduction of a new goods, ii)
the introduction of new method of production, iii) the opening of a new market, iv) the conquest
of a new source of supply of factors of production and v) the reorganization of any industry.
Entrepreneurs are specially motivated and talented type of individuals who are to see potentially
profitable opportunities and tend to exploit them (Saha, 1989). It is recognized that mere
existence of resources does not guarantee economic growth (Purhit and Rahman, 1995).
Experience shows that progress is basically the human effort and it takes human agents to
mobilize capital, to exploit natural resources to create new markets and to carry on trade
(Frederick and Myers, 2002). According to J.A. Schumpter entrepreneurship is the central figure
of the development process because the entrepreneur in the modern complex economic world
can create opportunities for production technology, by expanding or discovering new market,
new product, new source of resources, etc. All these activities will embrace risk and uncertainties
and at the same time will increase the demand for higher or increased investment in the
economy. This demand for increased investment will necessitate higher capital accumulation and
thereby the demand for increased rate of savings in the economy. The cumulative effects of all
33
these factors will increase level of income ands total production of goods and services in the
economy. In other words, in totality, the net result of expansion in the volume of economic
activities will lead to growth in national economy and if a proper and equitable distribution
policy can be formulated by the state to suit the real development in the economy will take place
(Saha, 1989).
2.5 Theories of Entrepreneurship
Entrepreneurship theories and research remain important to the development of the
entrepreneurship field. Several theories have been put forward by scholars to explain the field of
entrepreneurship.
The current study examines three entrepreneurship theories with a bias on the growth of SMEs.
These are: (1) Economic entrepreneurship theory, (2) Psychological entrepreneurship theory and
(3) Sociological Entrepreneurship theory.
2.5.1 Economic Entrepreneurship Theory
The economic entrepreneurship theory has deep roots in the classical and neoclassical theories of
economics, and the Austrian market process (AMP). However, because of criticisms leveled
against the classical and neo-classical conjectures led to the Austrian Market process (AMP)
which was a model influenced by Joseph Aloi Schumpeter (1934).
Schumpeter (1934) described entrepreneurship as a driver of market-based systems. To him an
important function of an enterprise was to create something new which resulted in processes that
served as impulses for the motion of market economy. Murphy, Liao & Welsch (2006) contend
34
that the theory offered a logic dynamic reality. In explaining this, they point to the fact that
knowledge is communicated throughout a market system (e.g. via price information), innovation
transpires, entrepreneurs satisfy market needs, and system-level change occurs. If an
entrepreneur knows how to create new goods or services, or knows a better way to do so,
benefits can be reaped through this knowledge. Entrepreneurs effectuate knowledge when they
believe it will procure some individually-defined benefits.
Fiet, (2002) held that entrepreneurs are incentivized to use episodic knowledge (that is, possibly
never seen before and never to be seen again), to generate value.
Thus, the AMP was based on three main conceptualizations (Kirzner, 1973).The first was the
arbitraging market in which opportunities emerge for given market actors as others overlook
certain opportunities or undertake suboptimal activity. The second was alertness to profit-making
opportunities, which entrepreneurs discover and entrepreneurial advantage. The third
conceptualization, following Say (1803) and Schumpeter (1934), was that ownership is distinct
from entrepreneurship. In other words, entrepreneurship does not require ownership of resources,
an idea that adds context to uncertainty and risk (Gartner, 2004). These conceptualizations show
that every opportunity is unique and therefore previous activity cannot be used to predict
outcomes reliably.
(Casson, 2005) contends that an entrepreneur is the prime mover in economic development, and
his function is to innovate, or to carry out new combinations. Anyone who performs this function
is an entrepreneur, whether they are independent or dependent employees of a company.
However, while the causes generating opportunities are unexplained in the entrepreneurship
literature, a generation of scholars led by Shane and Ulrich (2004) examined the relationship
among the entrepreneur, product development and technological innovation. The studies noted
35
that the technology opportunity set is endogenously created by investments in new knowledge
(Warsh, 2006). However, not only does new knowledge contribute to technological change, it
also creates opportunities for use by third party firms (Jaffe, 1989), often-new ventures (Shane,
2001). The creation of new knowledge gives rise to new opportunities through knowledge
spillovers; therefore, entrepreneurial activity does not involve simply the arbitrage of
opportunities (Kirzner, 1973) but also the exploitation of new opportunities created but not
appropriated by incumbent organizations (Acs, Audretsch and Feldman, 1994).
In the current study, just like suggested in the economic entrepreneurship theory by
Schumpeter (1934) who described entrepreneurship as a driver of market-based systems,
mitigating the adverse effect of taxation requires innovation which is basically dependent on
entrepreneurship ,creating of new knowledge ,risk taking and management ,adaptability and
leveraging technology.
2.5.2 Psychological Entrepreneurship Theory
The level of analysis in psychological theories is the individual (Landstrom, 1998). These
theories emphasize personal characteristics that define entrepreneurship. Personality traits need
for achievement and locus of control are associated with entrepreneurial inclination which
involves risk taking, innovativeness, and tolerance for ambiguity. The essence of psychological
or personal theory is the difference in individuals‘ attitude. According to this theory the
difference in attitude i.e. the internal attitude and ability to judge and forecast the situation lead a
man to become a successful entrepreneur.
36
Coon (2004) defines personality traits as ―stable qualities that a person shows in most
situations‖. Coon argues that there are enduring inborn qualities or potentials of the individual
that naturally make him an entrepreneur.
Some of the characteristics or behaviors associated with entrepreneurs are that they tend to be
more opportunity driven (they nose around), demonstrate high level of creativity and innovation,
and show high-level of management skills and business know-how (Rauch and Frese 2000).
Coon (2004) says that entrepreneurs have been found to be optimistic, (they see the cup as half
full than as half empty), emotionally resilient and have mental energy, they are hard workers,
show intense commitment and perseverance, thrive on competitive desire to excel and win, tend
to be dissatisfied with the status quo and desire improvement, entrepreneurs are also
transformational in nature, who are life long learners and use failure as a tool and springboard.
They also believe that they can personally make a difference, are individuals of integrity and
above all visionary.
David McClelland‘s theory (1961) on need for achievement explained that human beings have a
need to succeed, accomplish, excel or achieve. Entrepreneurs are driven by this need to achieve
and excel. In his theory McClelland emphasized the relationship of achievement motivation or
need for achievement (Pervin, 1980). According to McClelland, one would expect a relatively
greater amount of entrepreneurship in a society if the average level of need achievement in a
society is relatively high. Because having a high achievement encourages an individual to sit
challenging goals, work hard to achieve the goals and uses the skills and abilities needed to
accomplish them (Pervin, 1980). Moreover, it is the inner drive of individuals that propels them
to work more and to achieve something for their own interest by taking personal risk (Islam and
37
Becker, 2001). Need for achievement then, reflects a strong goal orientation, an obsession with
job or task to be done. Consequently, McClelland advocates increasing level of need-
achievement in a society in order to stimulate entrepreneurship and economic growth (Frese,
2000). Finally, according to McClelland, entrepreneurs are activated by the high extent of
achievement motivation and he also stated a desire to do well, not so much for the sake of social
recognition or prestige, but for an inner feeling of personal accomplishment, induce people to be
an entrepreneur (Frese, 2000).
An entrepreneur‘s need for achievement drives him to become innovative by devising tax coping
mechanisms in order to survive in the business engagements and excel. This is what motivated
the author to adopt the David McClelland‘s theory (1961).
2.5.3 Sociological Entrepreneurship Theory
These are theories based on sociological aspects. This is because socio-cultural factors have a
substantial influence in creating entrepreneur as well as entrepreneurship (Gartner, 2004).
Moreover, social and cultural factors places a high value on innovation, risk taking and
independence is more likely to produce entrepreneurial events than a system with contrasting
values (Mamun,2000). Among these type of theories Max Weber‘s protestant values is ancient
one. In this theory Weber argued that protestant or Calvinistic logic or values were instrumental
in promoting capitalist enterprise. These values included, first of all, an emphasis on the inherent
goodness of work itself. A person‘s work was regarded as a calling in the very literal rendering
of the concept of vocation. Moreover, the experience of financial rewards from one‘s work was

38
regarded as a manifestation that one was blessed by God, a number of elect few predestined to
share this grace. However, money created temptations to the flesh, whose yearnings were to be
suppressed. Protestant values called for self-restraint and deferral of gratification. By investing
one‘s earnings in the form of capital, one could practice such self-denial. Over a period of many
years, repeated investment of earnings created the capital base for the take off of Western
societies into the economic break-through of the industrial revolution (Mamun,2000).
A previously stated in this study, social and cultural factors is an important ingredient on
innovation, risk taking and independence for a holistic entrepreneurial status. Just in the same
vein, the current study envisions that entrepreneurship will thrive well in a climate where tax
burden is reduced.
2.6 Models of Innovation and Creativity
2.6.1 Schumpeter's Innovation Model
Schumpeter's model is dynamic system that continually generates change and technological
progress. Schumpeter's model is a dynamic one which describes an equilibrium path that the
economy follows over time, not the stable equilibrium described by the familiar supply and
demand models that were in vogue when Schumpeter first described his concept of creative
destruction early in the twentieth century. Schumpeter described the capitalist economy as a
"perennial gale of creative destruction" in which each firm sought to gain an advantage in the
marketplace through innovation. He complained that "the problem that is usually being
visualized is how capitalism administers existing structures, whereas the relevant problem is how
it creates and destroys them" (Schumpeter, 1934). Each innovation, such as a more attractive

39
design, a lowering of production costs, a new product, a new source of supply of inputs or raw
materials, or improved management methods was pursued because it held the possibility of
generating higher profit for the innovating firm. Such creative activity also destroyed the
monopoly power that its competitors had gained by means of their earlier innovations.
Each innovator's gain is, therefore, only temporary because the creative innovation of its
competitors will, sooner or later, destroy its hard-earned market power. This continual creation
and destruction prevents permanent monopolies from developing, and in the process, society
enjoys continuous technological progress. Creative destruction was, according to Schumpeter,
the source of economic growth and the enormous increases in living standards that the world was
experiencing in the early 1900s (Lewer and Van den Berg, 2004).
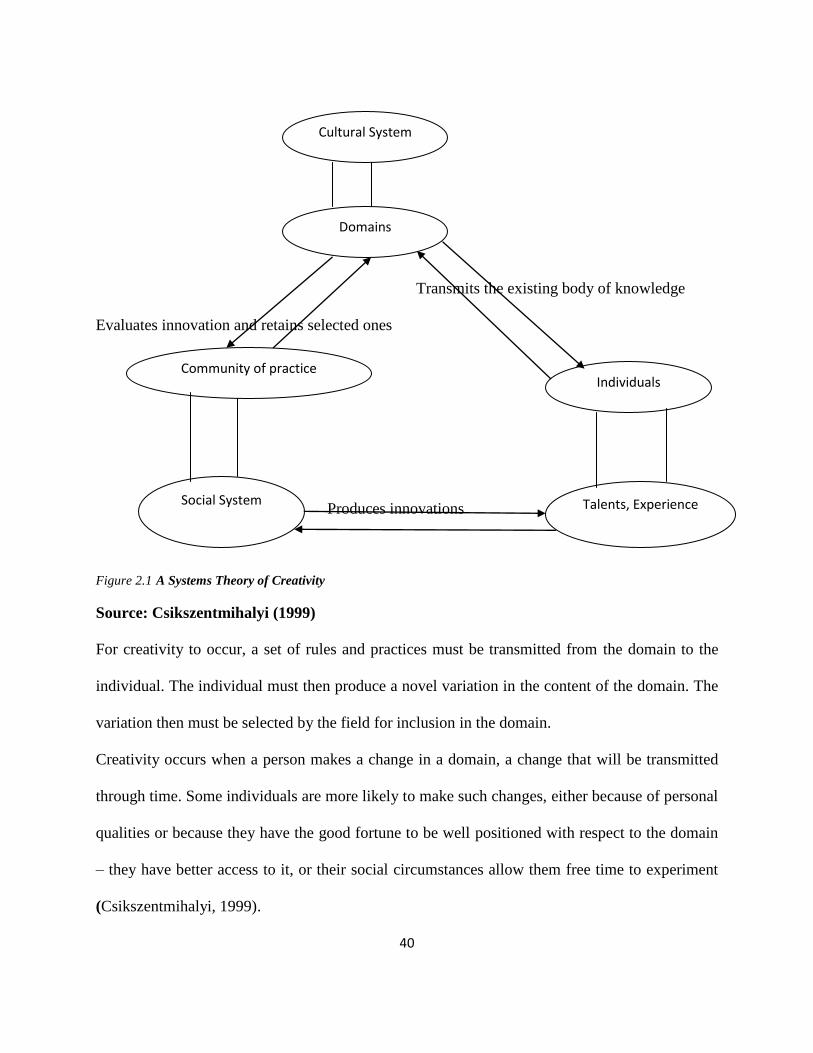
2.6.2 A Systems Theory of Creativity
This Theory was advanced by Mihaly Csikszentmihalyi (1988) by relating creative effort by
individuals to the state of the domain they are working in and the characteristics of those who
assess the worth of the creative endeavor in the field concerned.
According to Mihaly Csikszentmihalyi, the environment has two salient aspects: a cultural, or
symbolic, aspect which here is called the domain; and a social aspect called the field. Creativity
is a process that can be observed only at the intersection where individuals, domains, and fields
interact. This is shown in Figure 2.1.
40
Transmits the existing body of knowledge
Evaluates innovation and retains selected ones
Produces innovations
Figure 2.1 A Systems Theory of Creativity
Source: Csikszentmihalyi (1999)
For creativity to occur, a set of rules and practices must be transmitted from the domain to the
individual. The individual must then produce a novel variation in the content of the domain. The
variation then must be selected by the field for inclusion in the domain.
Creativity occurs when a person makes a change in a domain, a change that will be transmitted
through time. Some individuals are more likely to make such changes, either because of personal
qualities or because they have the good fortune to be well positioned with respect to the domain
– they have better access to it, or their social circumstances allow them free time to experiment
(Csikszentmihalyi, 1999).
Cultural System
Domains
Community of practice Individuals
Talents, Experience Social System
41
2.7 The Effect of Taxation on the Growth of SMEs
2.7.1 Effect of Taxation on the Costs of Operation of Small and Medium Enterprises.
Arinaitwe (2006) says that the desired capital stock depends not only on output, but also on the
costs associated with investments. In other words, an economy on a rapid growth path attracts a
high rate of investment, while a stagnant or shrinking economy offers no inducement for net
investment aimed at the market.
From this basic condition one can readily incorporate tax considerations into the analysis. In
particular, tax elements heavily influence costs of operation, which is the cost per year of
deploying capital in an investment project. From the point of view of the investor, the effective
return on capital is diminished to the extent of tax due on company income.
However, the cost of paying company tax is offset by any benefit which may accrue to the
investor from tax incentives such as tax holidays, preferential tax rates, investment credits, or
capital allowances in excess of economic depreciation. These benefits arise at different points in
time and vary year to year. To handle this complexity, the standard approach is to take the
present discounted value of the tax benefits, per unit of the investment outlay.
Borgarello, Marignani, & Sande, 2004) argues that investment can be financed by equity or debt.
Hence, the overall cost of funds depends on both the tax rate on debt financing and the risk
adjusted real rate of return required by entrepreneurs who provide equity financing.
In this framework, investment takes place as long as the gross return on additional investment
exceeds the tax-adjusted cost of capital. In effect, the hurdle value of investment rises with the
company tax rate and the tax on dividends, and falls with the value of the tax incentive package.
A higher cost of capital reduces the set of viable investment projects. It also provides an
incentive for companies to pursue more labor-intensive projects. Conversely, a lower cost
42
expands the set of viable investment projects, and favors capital-intensive projects. The net
impact of tax hence breaks on job creation.
The theoretical effect of taxation on investment is mediated by three other considerations.
First, the gestation period for many investments may span several years, particularly for large
projects. So there can be substantial lags before tax policies to stimulate investment have an
actual impact. (Still, policy changes that worsen profitability may provoke an immediate
cessation of planned investments.)
Second, recent models that highlight the effect of uncertainty show that investors may defer
projects even if they are fundamentally viable. Faced with substantial uncertainty about
economic stability or the sustainability of pro-investment policies, along with irreversible start-
up costs, investors may choose to wait and see how events unfold before committing funds.
Implicitly, they demand a higher hurdle rate consisting of the standard value. The result may be a
very sluggish investment response. The antidote is to reduce uncertainty by establishing a track
record of dependable policy management.
Third, liquidity constraints and imperfections in the financial markets can enhance the
effectiveness of tax cuts. The neoclassical model assumes that investors have access to debt and
equity financing at a market-determined cost of funds (adjusted for risk). This is a reasonable
assumption for SMEs. But for many companies the main source of funds for investment is
retained earnings. In this case, tax cuts can foster investment by augmenting the company‘s net
cash flow, providing the means to take advantage of viable investment opportunities that
otherwise would be missed for lack of finance.
43
2.7.2 To Compare Taxation Effect on the Growth of Varying Small and Medium
Enterprises
A comparison of effective average tax burdens for companies located in different jurisdictions
(varying small and medium enterprises) was carried out by (Spengel, 1995; Jacobs and Spengel,
1996; Meyer, 1996; Stetter, 2005; Gutekunst, 2005, Hermann, 2006). The effective average tax
burden is derived by simulating the development of a corporation over a certain period. For the
computation of the effective average tax burden the entrepreneurs use the economic data of the
corporation and tax data as inputs. The entrepreneurs compare effective average tax burdens for
companies over a period of ten years. According to this model, the effective tax burden is the
difference between the pre-tax and the post-tax value of the firm at the end of the simulation
period. The value of the firm is represented by the equity, which includes the capital stock and
the cumulative net income of each of the ten periods. At the end of period ten, the tax value of
assets and liabilities may differ from their fair value, depending on the tax rules which are to be
applied. These hidden reserves and liabilities are added to the taxable income in period ten and
are taxed accordingly. As a consequence, only the effects of different tax accounting rules on the
liquidity are taken into account. Remaining loss carry forwards at the end of the simulation are
dissolved liquidity-related whereas a devaluation of 50 per cent is made if there are no
restrictions for the use of loss carry forwards and a devaluation of 75 per cent if there are any
restrictions. The computation of the absolute effective average tax burden requires two steps.
In the first step, the pre-tax value of the firm at the end of the simulation period is calculated.
The pre-tax value of the firm is derived from the estimated cash flows and the value of the net
assets at the end of the simulation period. The cash flows are derived from estimates for the cash
receipts (sales and other receipts, gains upon the disposal of assets, interest and dividend income)
44
and expenses (wages and pension payments, expenses for material, energy consumption and
other expenses, new investment, interest expenses and distributed profits) covered by the
corporate planning model.
The value of the net assets at the end of the simulation period is computed by deducting the
liabilities of the corporation from the assets. Both the assets and the liabilities are valued at
calibrated parameters that are the same in each country. For assets we use replacement prices and
for liabilities nominal values. Pre-tax cash flow at the end of the simulation period + Value of
the net assets at the end of the simulation period (= assets in the capital stock at replacement
prices – liabilities in the capital stock at nominal values) = Pre-tax value of the firm at the end of
the simulation period. In the second step, we calculate the post-tax value of the firm at the end
of the simulation period. The determination of the post-tax value of the firm only has cash flow
effects and no impact on the value of the net assets. The post-tax cash flow is derived in each
period by deducting the tax liabilities from the pre-tax cash flow. In order to calculate the
absolute amount of tax liabilities, receipts and expenses enter into the tax balance sheet and/ or
into the tax profit and loss account following national taxation rules (e.g. regarding the
computation of depreciation allowances).
The reduction of the cash flow due to tax payments (liabilities) also has an impact on the
balancing investment or credit and the connected interest receipts or credits. By taking into
account these tax-induced effects on the interest income or expense of each period, the deferral
of tax payments is integrated 15 into the model. Hidden reserves and liabilities are only relevant
for taxation matters at the very end of the simulation.
Finally, referring to the tax rates, the calculations consider statutory linear as well as progressive
tax rate structures. In the case of progressive rates – relevant for special provisions for SMEs -
45
the tax rates enter into the model as functions of the relevant income or net assets (non-profit
taxes).
2.8 Innovative Tax Copying Mechanisms Employed by SMEs
2.8.1 Business Security Measures in Line with Tax Avoidance
The Entrepreneur Magazine Small Business (1995), tax avoidance refers to the legal means by
which taxpayers can reduce their tax bill and is a legal utilization of the tax regime to one's own
advantage. Tax avoidance is the legal utilization of the tax regime to one's own advantage, to
reduce the amount of tax that is payable by means that are within the law. This is the legal right
of an individual to decrease the amount of what would otherwise be his taxes or altogether avoid
them, by means which the law permits, cannot be doubted (Hoover, 2000).
Milliron and Toy (1988) predict that a rational taxpayer will avoid tax as long as the
pay-off from avoiding is greater than the expected cost of taxation. Early economic
scholars (Allingham and Sandmo, 1972) treat taxpayers as perfectly moral, risk-neutral or risk-
averse decision-makers who maximize utility. Within this framework, factors that determine the
monetary cost of compliance, like the tax rate, detection probability, level of income and penalty
structure, drive compliance behavior. Milliron and Toy (1988) point out that more recent
extension to these arguments have been achieved by ―relaxing assumptions, focusing on
specific issues, and utilizing more sophisticated techniques. According to Falkinger (1988) the
taxpayer and government exchange relationship within an avoidance setting. Falkinger
maintains that there is some theoretical support for tax avoidance or a
rationalization of past behavior. He believes that inequity as a rational causal factor
of avoidance becomes more credible at a low tax level. Other researchers have extended
46
early economic models to include 1) the taxpayer‘s incentive to purchase tax advisory services
(Beck et al., 1996), 2) the effect of practitioners on tax avoidance (Klepper et al.,
1991; Scotchmer, 1989), and 3) the effect of the tax administration (Scotchmer and
Slemrod, 1989).
Weigel et al. (1987) argue that the absence of motivational concepts suggests the inadequacy
of expected utility in this context, as economic de terrence models tend to assume
motivation as given and behavior as primarily responsive to consequent costs and benefits. They
point out that the plausibility of this assumption is questioned by the lack of empirical support
and the criticism it has provoked.
According to Fiscal psychologists, during the last two decades, policymakers and social
scientists have recognized that tax avoidance is a behavioral phenomenon. Webley et
al. (1991) categorize behavioral theories into two types. The first are integrative or
frameworks of the taxpaying process, within which data about tax avoidance can be
organized. Examples of this kind include Lewis (1982), Greenland and Van Veldhoven (1983),
and Smith and Kinsey (1987). The second category is more straightforward applications of a social-
psychological theory to tax avoidance.
Prospect theory was developed by Kahneman and Tversky (1979) using the psychological
principles that govern the perception of decision problems and the evaluation of options. A
descriptive theory of choice under uncertainty, it is viewed as an alternative to expected
utility theory. In their original article, Kahneman and Tversky illustrate the concept of ―framing‖
with the example of an unexpected tax withdrawal from a monthly pay check, which is perceived
as a loss, and not as a reduced gain.
47
2.8.2 Tax Planning
Tax planning involves conceiving of and implementing various strategies in order to minimize
the amount of taxes paid for a given period. Tax planning evaluates various tax options in order
to determine when, whether, and how to conduct business and personal transactions so that taxes
are eliminated or reduced (Dailey & Frederick, 1997). One method of tax planning is tax
avoidance.
There are many tax planning strategies available to a small business owner. However, regardless
of how simple or how complex a tax strategy is, it will be based on structuring the transaction to
accomplish one or more of these often overlapping goals: income, reducing, controlling,
claiming, controlling and avoiding the most common tax planning mistakes ( Albert,2001).
For a small business, minimizing the tax liability can provide more money for expenses,
investment, or growth. In this way, tax planning can be a source of working capital. According to
David & Jakabcin (1997), two basic rules apply to tax planning. First, a small business should
never incur additional expenses only to gain a tax deduction. Second, a small business should
always attempt to defer taxes when possible. Deferring taxes enables the business to use that
money interest-free, and sometimes even earn interest on it, until the next time taxes are due.
2.9 Critical Literature Review
2.9.1 The Effect of Multiple Taxation on the Costs of Operation of Small and Medium
Enterprises.
According to Arinaitwe (2006), tax elements heavily influence costs of operation, which is the
cost per year of deploying capital in an investment project. From the point of view of the
48
investor, Arinaitwe argues that the effective return on capital is diminished to the extent of tax due
on company income. Whereas this statement can be true, and the contents remain valuable, the
conclusions on this particular aspect of the problem are at best partial in nature, and at worst not
relevant without empirical evidence.
Borgarello, Marignani, & Sande (2004) believe that investment takes place as long as the gross
return on additional investment exceeds the tax-adjusted cost of capital. In effect, the hurdle
value of investment rises with the company tax rate and the tax on dividends, and falls with the
value of the tax incentive package. The authors treat investment as linear relationship only
dependent on tax rate. However, investment is dependent on a number of variables.
The theoretical effect of taxation on investment is mediated by three considerations: the gestation
period, deference of projects and liquidity constraints and imperfections in the financial markets.
Incidentally, investments can be determined by more than three factors.
2.9.2 To Compare Taxation Effect on the Growth of Varying Small and Medium
Enterprises
A comparison of effective average tax burdens for companies located in different jurisdictions
(varying small and medium enterprises) is made (Spengel, 1995; Jacobs and Spengel, 1996;
Meyer, 1996; Stetter, 2005; Gutekunst, 2005, Hermann, 2006). The effective average tax burden
is derived by simulating the development of a corporation over a certain period. According to
this arrangement, the effective tax burden is the difference between the pre-tax and the post-tax
value of the firm at the end of the simulation period. Referring to the tax rates, the calculations
consider statutory linear as well as progressive tax rate structures. In the case of progressive rates
– relevant for special provisions for SMEs - the tax rates enter into the model as functions of the
49
relevant income or net assets (non-profit taxes). But the author offers no data to support the
argument he is making. In the absence of any supporting evidence there is no way of judging the
validity or reliability of his conclusions and this seriously undermines the value of the work.
2.9.3 Tax Avoidance Measures
Allingham and Sandmo (1972) treat taxpayers as perfectly moral, risk-neutral or risk-averse
decision-makers who maximize utility. Within this framework, factors that determine the
monetary cost of compliance, like the tax rate, detection probability, level of income and penalty
structure, drive compliance behavior. Although not a lot of primary research has been conducted
to help support policy recommendations in this subject area, but Allingham and Sandmo (1972)
are lacking depth in their explanation of both the data collection process and sample selection
criteria. Consequently, the current work, in the absence of adequate detail, it is extremely
difficult to assess the validity and reliability of the findings.
Falkinger (1988) maintains there is some theoretical support for t ax avoidance or a
rationalization of past behavior. He believes that inequity as a rational causal factor
of avoidance becomes more credible at a low tax level. In order to determine causality, it
is important to hold the variable that is assumed to cause the change in the other variable(s)
constant and then measure the changes in the other variable(s). This type of research is very
complex and the researcher can never be completely certain that there are not other factors
influencing the causal relationship, especially when dealing with people‘s attitudes and
motivations. There are often much deeper psychological considerations, which even the
respondent may not be aware of.
50
2.10 Summary, Research Opportunity
The present study will attempt to address some aspects of taxation not fully covered in the
studies discussed hitherto.
Taxation system has evoked great attention among many researchers in the World especially in
Developed Countries. However most of the researchers concentrate more in studies which would
increase the budgets ―bottom-line‖ in terms of huge revenue collection and enforcement efforts
at the expense of studies that would address the effects of such taxes on the growth of SMES.
Empirical evidence shows that there has been hostility between the taxpayers and tax collectors
on issue relating to tax compliance (Migwi & Wanjohi, 2010).
Previous studies have examined the impact of taxation on large and small enterprises in Africa
and Kenya in particular on the growth of SMEs in Kenya. However, the reviewed literature does
not adequately address ways to mitigate the high tax burden. The current study will therefore
endeavor to examine the innovative tax coping mechanisms by SMEs in Nairobi County.
2.11The Conceptual Framework
In this study, the relationship between the dependent and the independent variables will be
investigated. These variables are as illustrated by Figure 2.1.
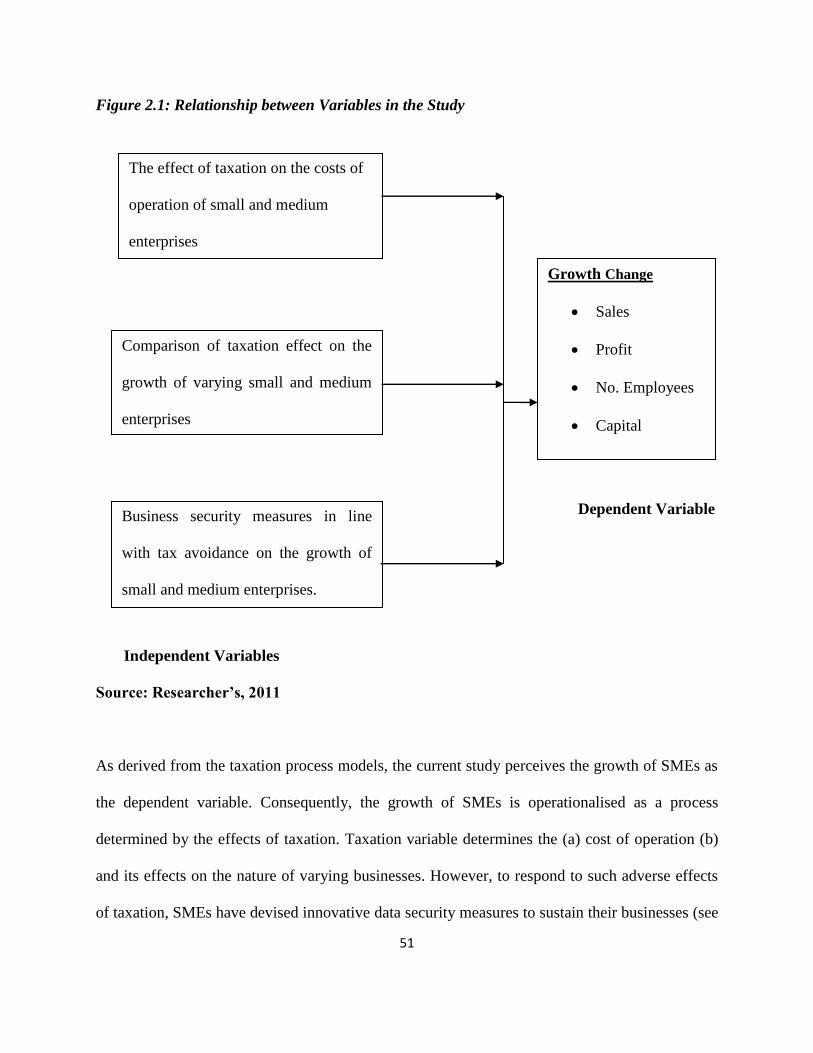
51
Figure 2.1: Relationship between Variables in the Study
Dependent Variable
Independent Variables
Source: Researcher’s, 2011
As derived from the taxation process models, the current study perceives the growth of SMEs as
the dependent variable. Consequently, the growth of SMEs is operationalised as a process
determined by the effects of taxation. Taxation variable determines the (a) cost of operation (b)
and its effects on the nature of varying businesses. However, to respond to such adverse effects
of taxation, SMEs have devised innovative data security measures to sustain their businesses (see
Comparison of taxation effect on the
growth of varying small and medium
enterprises
Growth Change
Sales
Profit
No. Employees
Capital
Business security measures in line
with tax avoidance on the growth of
small and medium enterprises.
The effect of taxation on the costs of
operation of small and medium
enterprises
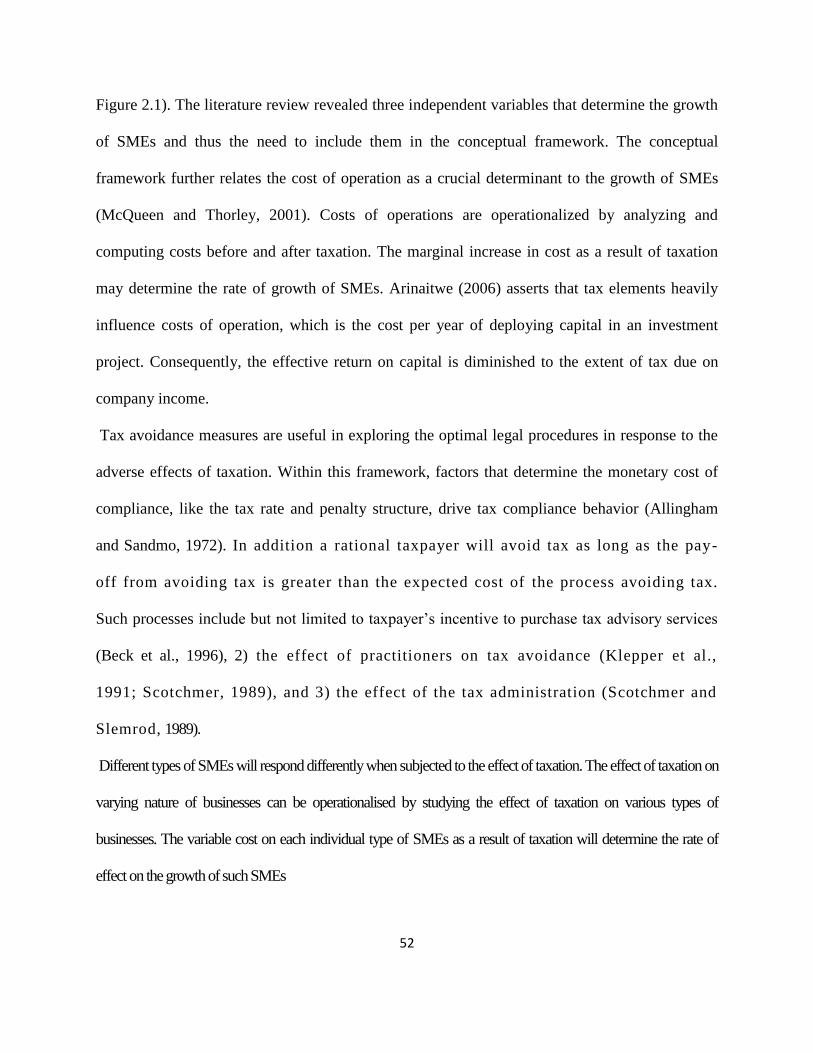
52
Figure 2.1). The literature review revealed three independent variables that determine the growth
of SMEs and thus the need to include them in the conceptual framework. The conceptual
framework further relates the cost of operation as a crucial determinant to the growth of SMEs
(McQueen and Thorley, 2001). Costs of operations are operationalized by analyzing and
computing costs before and after taxation. The marginal increase in cost as a result of taxation
may determine the rate of growth of SMEs. Arinaitwe (2006) asserts that tax elements heavily
influence costs of operation, which is the cost per year of deploying capital in an investment
project. Consequently, the effective return on capital is diminished to the extent of tax due on
company income.
Tax avoidance measures are useful in exploring the optimal legal procedures in response to the
adverse effects of taxation. Within this framework, factors that determine the monetary cost of
compliance, like the tax rate and penalty structure, drive tax compliance behavior (Allingham
and Sandmo, 1972). In addition a rational taxpayer will avoid tax as long as the pay-
off from avoiding tax is greater than the expected cost of the process avoiding tax.
Such processes include but not limited to taxpayer‘s incentive to purchase tax advisory services
(Beck et al., 1996), 2) the effect of practitioners on tax avoidance (Klepper et al.,
1991; Scotchmer, 1989), and 3) the effect of the tax administration (Scotchmer and
Slemrod, 1989).
Different types of SMEs will respond differently when subjected to the effect of taxation. The effect of taxation on
varying nature of businesses can be operationalised by studying the effect of taxation on various types of
businesses. The variable cost on each individual type of SMEs as a result of taxation will determine the rate of
effect on the growth of such SMEs

53
CHAPTER THREE
RESEARCH METHODOLOGY
3.1 Introduction
This chapter describes the plan and methodology that will be adopted by the researcher in order
to reach the sampled population, collect and analyze data so as to achieve the research objective.
In particular this chapter outlines the procedure that will be followed in conducting the study.
Section 3.2 opens by discussing the research design and the reasons why it will be used. Sub-
section 3.3 describes the boundaries of Nairobi County and why it is preferred for the study.
Section 3.4 describes the target population, sample size and sampling procedures. Section 3.5
discusses the tools of data collection. Methods of data analysis which includes both inferential
and descriptive statistics will also be discussed. Finally, a brief description of how to test the
validity and reliability of research instruments closes this chapter.
3.2 The Research Design
This research will follow both descriptive and exploration design which will explore the effects
of multiple taxation on the growth small and medium enterprises. Scholars have offered varied
definitions of research design. Survey design is used to ascertain the nature of a phenomenon
from relatively large number of cases (NKPA, 1997).
According to Weirsma (1980), descriptive sample design is research studies conducted in order
to establish the status quo. They can, he states, be useful for gathering facts in order to establish
important and useful information for the business enterprise. Survey methods collect data
through questionnaires or/ and interviews (Orodho 2005). Such factors as type of data, methods

54
of data collection, level of awareness of respondents and time dimension will dictate the type of
research design used (Miller (1991). Silverman (2000) posits that descriptive and exploration
research provides deeper understanding of social phenomena than would be obtained from purely
qualitative data. A descriptive study, Ogula (1998) asserts is used to gather systematically factual
information necessary for decision-making. They are an efficient method of collecting
descriptive data regarding the characteristics of a population and the current conditions or needs
(Gay, 1992).
In this study, information on costs and multiple taxation constitutes the descriptive analysis. In
addition, descriptive statistics utilised with such variables as the effects of multiple taxation on
operational costs and varying SMES will be confirmed through inferential statistics.
Descriptive design will also be used in this study because of its appropriateness in establishing
relationships between variables and facilitating the collection of information for determining the
population parameter. This will be complimented by document analysis, which will be used to
collect first hand in-depth data from KRA and other authentic sources that will be used to
supplement information, gathered using the descriptive design.
The descriptive studies are the most appropriate for this study because in the study, the
researcher will collect information on the state of affairs of small and medium enterprises due to
multiple taxation, without manipulating any variables. In summary therefore, the overall design
is descriptive in nature but it is however supplemented with an exploratory approach in a purely
qualitative paradigm. According to Orodho (2005), qualitative research seeks to describe and
analyze the culture and behaviour of humans and their groups from the point of view of those

55
being studied. It is flexible and encourages researchers to be innovative. It also facilitates follow
up questions that gives participants‘ views, and why they hold such views.
The research designs adopted for the current study will be most preferred since they have
previously been utilized by YAhaya (2009) to investigate and described the challenges of
multiple taxation SMEs in Kwara State as identified by tax officers in Kwara State in Nigeria. In
order to obtain relevant data, a Questionnaire on Challenges of Taxation {QCT} was
administered on one hundred and thirty-five purposively selected tax officials in the Kwara State
Board of Internal Revenue (KSB1R) as well as Tax agents in the state. A total of one hundred
and twenty questionnaires were fully completed and analyzed using relevant statistics.
3.3 The Study Area
This study will be conducted in Nairobi County (see Appendix). Nairobi County comprises the
administrative region of the capital city of Kenya. Nairobi County is thus synonymous with the
city itself. According to the 2009 Population Census, Nairobi is the Kenya‘s largest urban centre
with 3.1 million people (Kilele, 2010).
The choice of Nairobi County as the study area was influenced by various factors. Nairobi has
been selected as the location of the study first because as the administrative and commercial
capital of Kenya, the largest share (25 per cent) of modern sector wage employment is found in
Nairobi (Economic Survey, 2006, p. 66) and furthermore it is the location where most of SMEs
make tax returns to KRA.
Secondly, researcher‘s own interest formed the choice of locale‘. Gay (1992) observed that
factors such as familiarity to an area, limitations of time, effort and money may influence the

56
researchers‘ choice of locale. Thus Nairobi is familiar to the researcher. That was what
influenced the researcher to choose Nairobi County for study.
It will also be prudent for the researcher to identify a location that facilitates data collection.
Moreover, Meredith (1996) notes that carrying out a research in a setting where you are known
as a colleague and a friend facilitates data collection.
Nairobi County has over the years grown tremendously both for the population and industries
and has prompted the Kenyan Government to create the Ministry of Metropolitan to manage this
expansion. It has an estimated six hundred registered small and medium enterprises.
The SMEs have been divided under four major categories. Theses are: services (airline, hotels,
education, health, commercial, general services and clearing and forwarding), wholesalers and
retailers, manufacturing and agriculture and financial services (construction, financial services
Government, NGOs and real estates), (KRA, 2010). The researcher will be able to follow the
behaviour of these enterprises since most of them are accessible and centralised.
These combinations of characteristics make it an appropriate location for a study. Moreover the
few studies carried out in Nairobi have only explored the effect of taxation on the growth of
large enterprises and thus ignoring the effects of multiple taxation on the growth of small and
medium enterprises a research gap that this study will attempt to seal.
3.4 The Target Population
Borg and Gall (1996) defines population as all members of a real set of people, events or objects
to which the researcher wishes to generalize the results of the research. According to Chein
(1981), a population is the aggregate of all cases that conform to some designated set of
specifications (Frankfort-Nachmias & Nachmias, 1996, p.179).
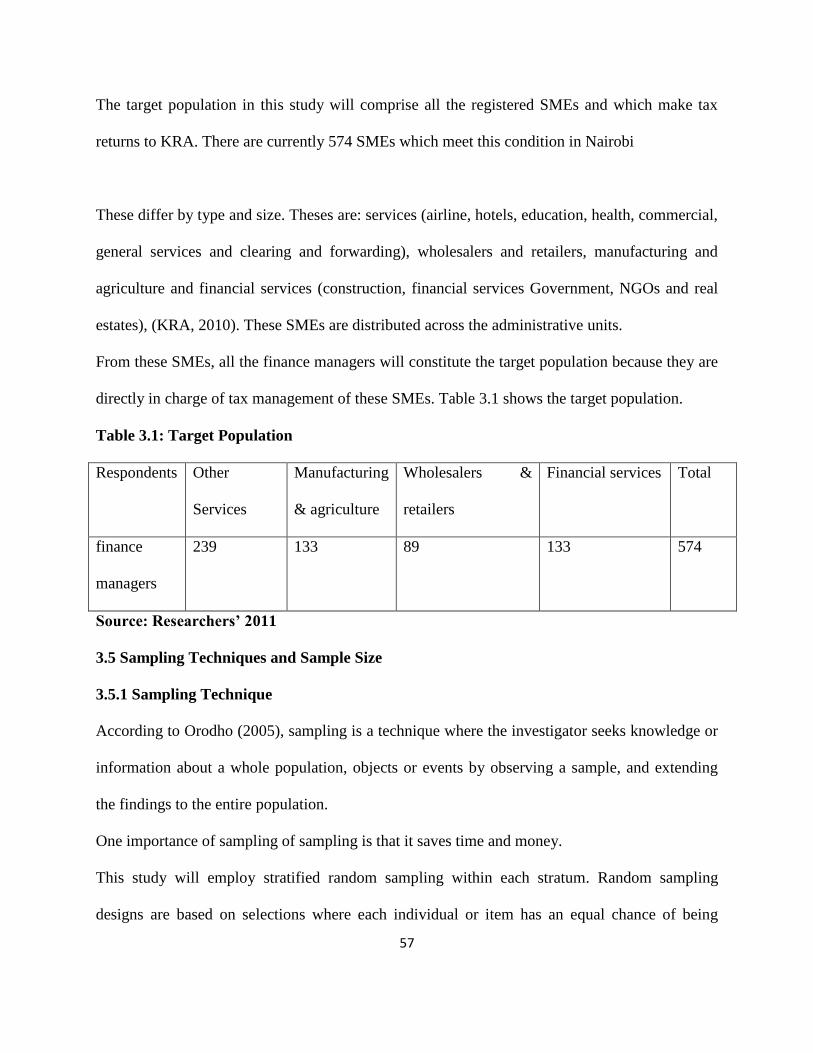
57
The target population in this study will comprise all the registered SMEs and which make tax
returns to KRA. There are currently 574 SMEs which meet this condition in Nairobi
These differ by type and size. Theses are: services (airline, hotels, education, health, commercial,
general services and clearing and forwarding), wholesalers and retailers, manufacturing and
agriculture and financial services (construction, financial services Government, NGOs and real
estates), (KRA, 2010). These SMEs are distributed across the administrative units.
From these SMEs, all the finance managers will constitute the target population because they are
directly in charge of tax management of these SMEs. Table 3.1 shows the target population.
Table 3.1: Target Population
Respondents Other
Services
Manufacturing
& agriculture
Wholesalers &
retailers
Financial services Total
finance
managers
239 133 89 133 574
Source: Researchers’ 2011
3.5 Sampling Techniques and Sample Size
3.5.1 Sampling Technique
According to Orodho (2005), sampling is a technique where the investigator seeks knowledge or
information about a whole population, objects or events by observing a sample, and extending
the findings to the entire population.
One importance of sampling of sampling is that it saves time and money.
This study will employ stratified random sampling within each stratum. Random sampling
designs are based on selections where each individual or item has an equal chance of being

58
represented (Cooper & Schindler). There are many random sampling designs, but the researcher
will only employ two designs: stratified and simple random sampling designs.
The SMEs in the population differ by type – services, wholesalers and retailers, manufacturing
and agriculture and financial services.
In order to ensure that these different categories are adequately represented in the sample,
stratified sampling will be used. According to Frankfort-Nachmias and Nachmias (1996),
stratified sampling is used primarily to ensure that different groups in the population are
adequately represented in the sample.
Theses are: services (airline, hotels, education, health, commercial, general services and clearing
and forwarding), wholesalers and retailers, manufacturing and agriculture and financial services
(construction, financial services Government, NGOs and real estates), (KRA, 2010). These
SMEs are distributed across the administrative units
The SMEs in Nairobi County will therefore first be classified according to whether they are
services, wholesalers and retailers, manufacturing and agriculture and financial services. The
population will thus be sub-divided into four mutually exclusive strata which will be based on
the four types of SMEs. The list obtained will serve as the sampling frame from which a
representative sample of the population will be obtained.
Simple random sampling will be used to draw the types of SMEs from each stratum. According
to Doane (2007), in a simple random sampling, every item in the population has an equal chance
of being chosen in a sample of items. For instance, in the stratum other services; airline, hotels,
education, health, commercial, general services and clearing and forwarding will be selected by
use of simple random.
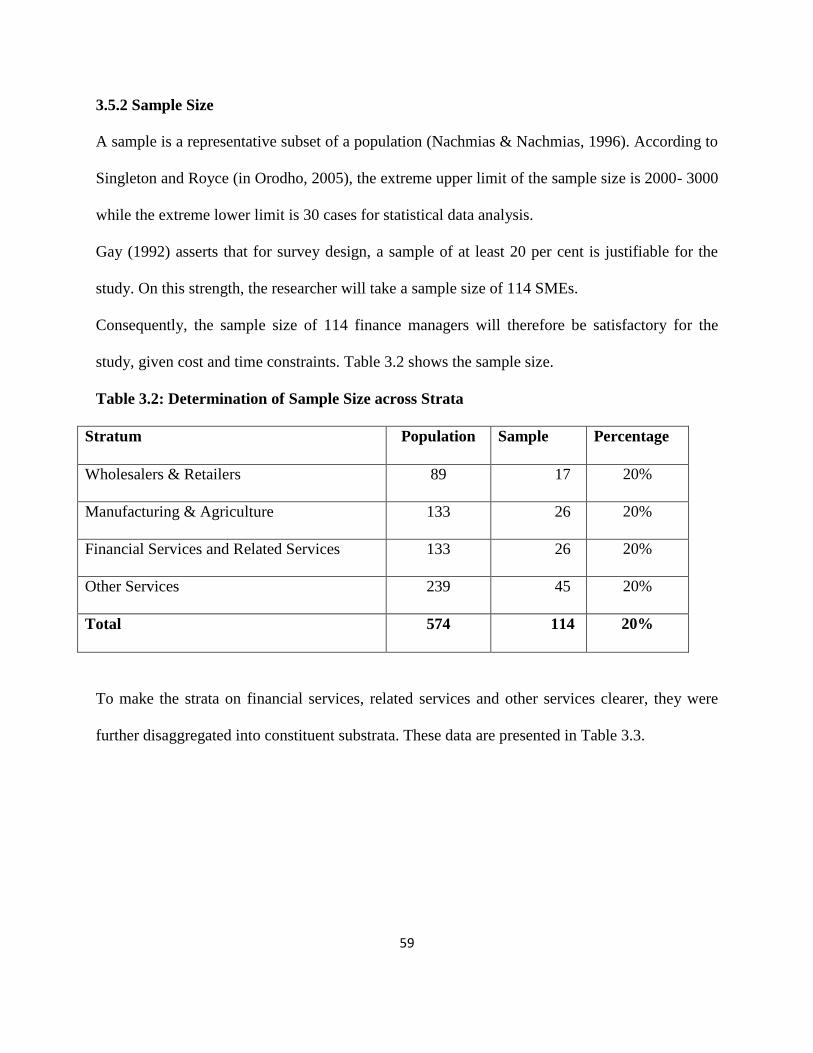
59
3.5.2 Sample Size
A sample is a representative subset of a population (Nachmias & Nachmias, 1996). According to
Singleton and Royce (in Orodho, 2005), the extreme upper limit of the sample size is 2000- 3000
while the extreme lower limit is 30 cases for statistical data analysis.
Gay (1992) asserts that for survey design, a sample of at least 20 per cent is justifiable for the
study. On this strength, the researcher will take a sample size of 114 SMEs.
Consequently, the sample size of 114 finance managers will therefore be satisfactory for the
study, given cost and time constraints. Table 3.2 shows the sample size.
Table 3.2: Determination of Sample Size across Strata
Stratum Population Sample Percentage
Wholesalers & Retailers 89 17 20%
Manufacturing & Agriculture 133 26 20%
Financial Services and Related Services 133 26 20%
Other Services 239 45 20%
Total 574 114 20%
To make the strata on financial services, related services and other services clearer, they were
further disaggregated into constituent substrata. These data are presented in Table 3.3.
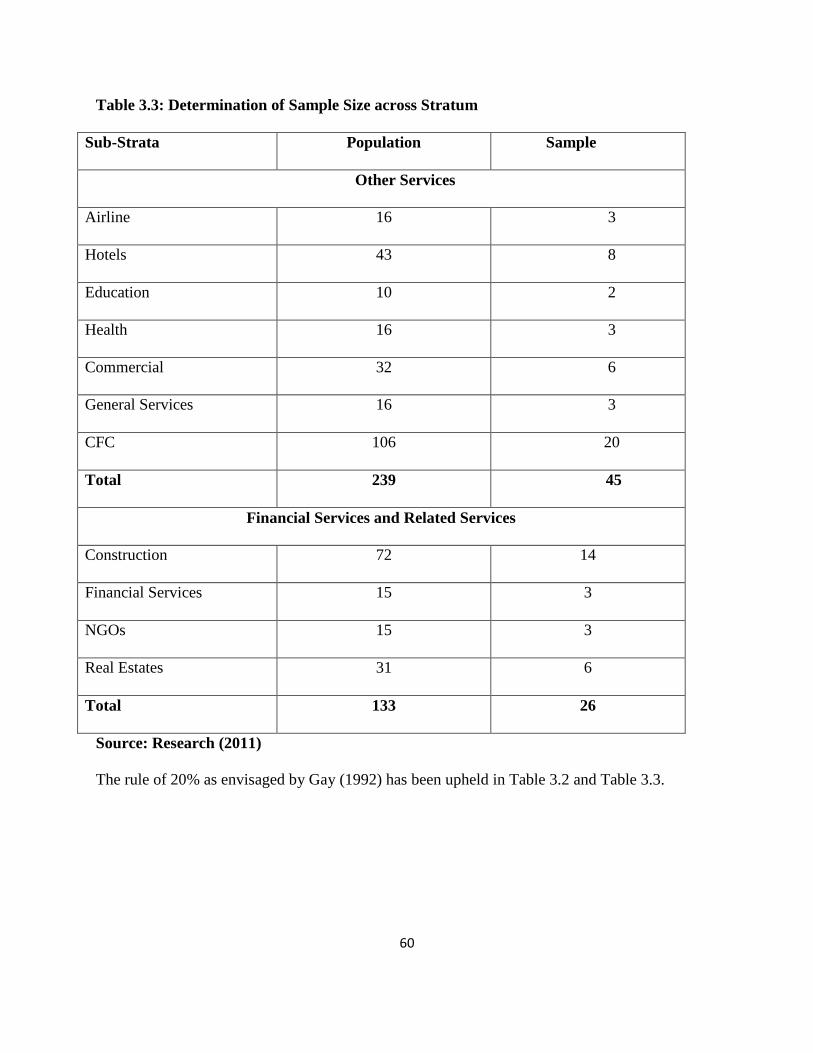
60
Table 3.3: Determination of Sample Size across Stratum
Sub-Strata Population Sample
Other Services
Airline 16 3
Hotels 43 8
Education 10 2
Health 16 3
Commercial 32 6
General Services 16 3
CFC 106 20
Total 239 45
Financial Services and Related Services
Construction 72 14
Financial Services 15 3
NGOs 15 3
Real Estates 31 6
Total 133 26
Source: Research (2011)
The rule of 20% as envisaged by Gay (1992) has been upheld in Table 3.2 and Table 3.3.
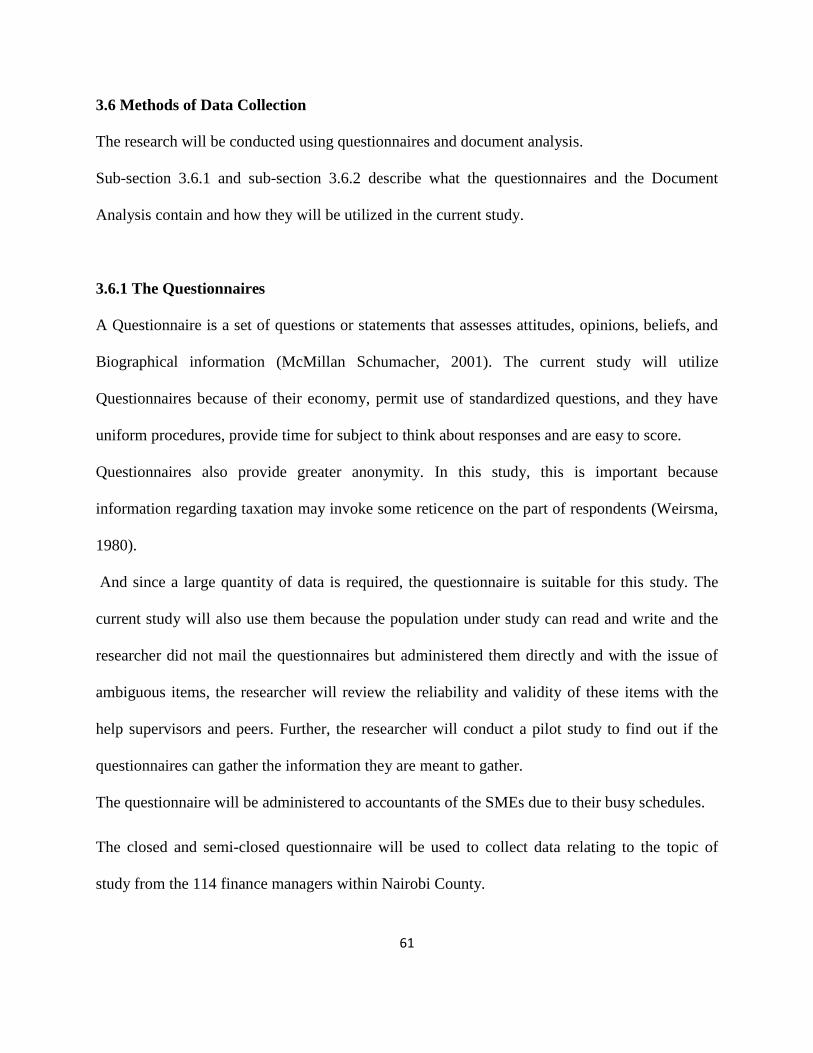
61
3.6 Methods of Data Collection
The research will be conducted using questionnaires and document analysis.
Sub-section 3.6.1 and sub-section 3.6.2 describe what the questionnaires and the Document
Analysis contain and how they will be utilized in the current study.
3.6.1 The Questionnaires
A Questionnaire is a set of questions or statements that assesses attitudes, opinions, beliefs, and
Biographical information (McMillan Schumacher, 2001). The current study will utilize
Questionnaires because of their economy, permit use of standardized questions, and they have
uniform procedures, provide time for subject to think about responses and are easy to score.
Questionnaires also provide greater anonymity. In this study, this is important because
information regarding taxation may invoke some reticence on the part of respondents (Weirsma,
1980).
And since a large quantity of data is required, the questionnaire is suitable for this study. The
current study will also use them because the population under study can read and write and the
researcher did not mail the questionnaires but administered them directly and with the issue of
ambiguous items, the researcher will review the reliability and validity of these items with the
help supervisors and peers. Further, the researcher will conduct a pilot study to find out if the
questionnaires can gather the information they are meant to gather.
The questionnaire will be administered to accountants of the SMEs due to their busy schedules.
The closed and semi-closed questionnaire will be used to collect data relating to the topic of
study from the 114 finance managers within Nairobi County.
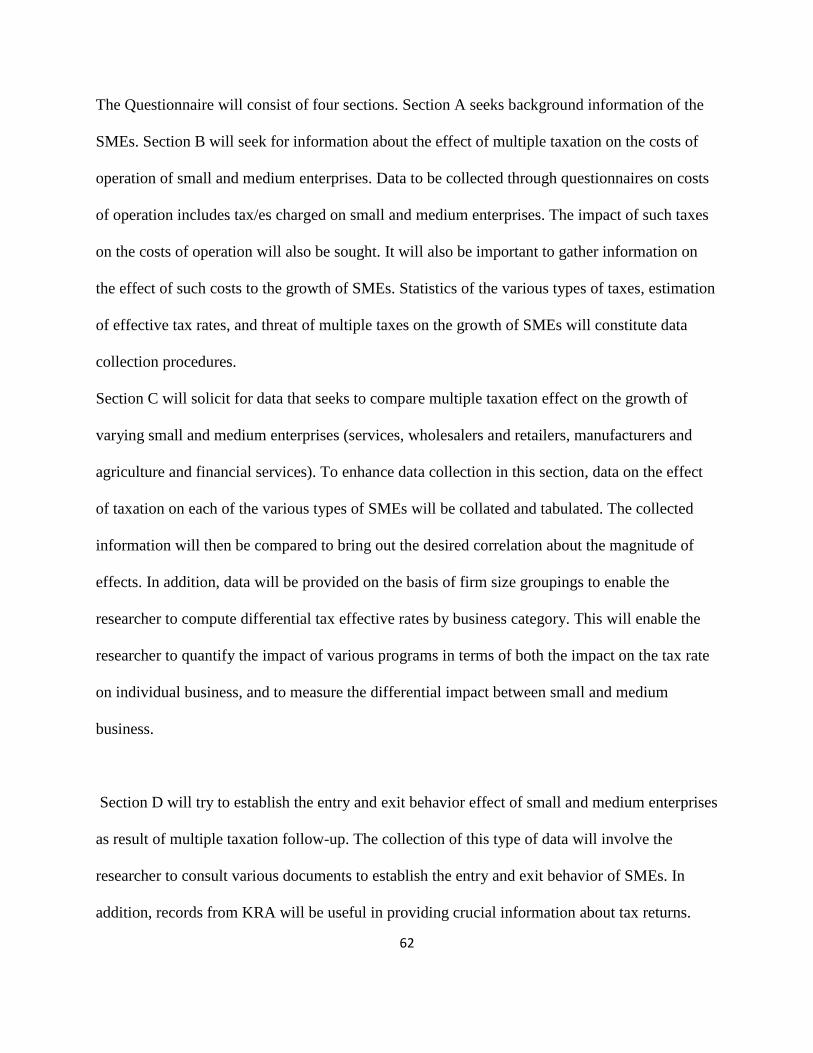
62
The Questionnaire will consist of four sections. Section A seeks background information of the
SMEs. Section B will seek for information about the effect of multiple taxation on the costs of
operation of small and medium enterprises. Data to be collected through questionnaires on costs
of operation includes tax/es charged on small and medium enterprises. The impact of such taxes
on the costs of operation will also be sought. It will also be important to gather information on
the effect of such costs to the growth of SMEs. Statistics of the various types of taxes, estimation
of effective tax rates, and threat of multiple taxes on the growth of SMEs will constitute data
collection procedures.
Section C will solicit for data that seeks to compare multiple taxation effect on the growth of
varying small and medium enterprises (services, wholesalers and retailers, manufacturers and
agriculture and financial services). To enhance data collection in this section, data on the effect
of taxation on each of the various types of SMEs will be collated and tabulated. The collected
information will then be compared to bring out the desired correlation about the magnitude of
effects. In addition, data will be provided on the basis of firm size groupings to enable the
researcher to compute differential tax effective rates by business category. This will enable the
researcher to quantify the impact of various programs in terms of both the impact on the tax rate
on individual business, and to measure the differential impact between small and medium
business.
Section D will try to establish the entry and exit behavior effect of small and medium enterprises
as result of multiple taxation follow-up. The collection of this type of data will involve the
researcher to consult various documents to establish the entry and exit behavior of SMEs. In
addition, records from KRA will be useful in providing crucial information about tax returns.

63
Data if available on the number of taxes charged on individual businesses will also be gathered.
This will entail collecting data on various goods as they transit from one point of production to
another.
Finally, section E will collect information on business security measures in line with tax
avoidance on the growth of small and medium enterprises. First, the questionnaires will gather
information on what tax security measures are available for the SMEs in Nairobi County. The
questionnaires will also contain items that seek information on methods applied by SMEs
respond to the effect of multiple taxation.
The sub-sections in the questionnaire will contain Likert Rating (LR) Scale which consists of
five statements adopted from Stevens (1951).
3.6.2 Secondary Data Analysis.
Documents are records of past events that are written or printed. They include internal papers,
communications to various publics and personal files, program descriptions and institutional
statistical data. The current research will use documents to collect data because they will provide
background information on the topic under focus and they will allow for criticism to ascertain
authenticity of the information that will be collected and therefore give a clear picture of
taxation. The documents will assist the researcher to study information from KRA and data from
other sources.
Using a document checklist, it will be possible for the researcher to systematically collect
relevant data from documents about the trends of tax returns by the SMEs. In this case, document
such as budgets, financial records, and entry and exit behavior from SMEs will be collected and
then analyzed.

64
3.7 Data Collection Procedure
The document analysis checklist will be used to collect secondary data from such bodies as
KRA, while questionnaire will be used for collecting primary data from the accountants.
Secondary data constitute information from already written sources such as taxation policy
documents, budgets and financial records from the SMEs and KRA. The researcher will collect
these documents and record the data from them on the Document Analysis Checklist to assist in
review of related literature and also enriching and/or verifying the primary data during the
compiling of this report.
To ensure that collection of data necessary for study is collected on time, the researcher will
involve services of research assistants. These research assistants will be identified and trained to
equip them with the necessary skills prior to the actual data collection. The main purpose of
training research will be to ensure that ethical research considerations will be strictly observed.
Specifically, research assistants will ensure that enough copies of questionnaires and covering
letters are prepared and also contacting the respondents by mail or telephone requesting them to
take part in the current study. After preparing enough copies and familiarizing with the locations,
the researcher will assign the research assistants specific duties for the respective units in Nairobi
County.
Primary data will be gathered from accountants of various SMEs in the field after obtaining the
Research Permit, developing the work plan, pre-testing the instruments through a pilot study, and
preparing enough copies of the instruments (questionnaires) ready for distribution.
Researcher will personally visit all the sampled 114 SMEs in the County and administered the
questionnaires to the finance managers, after establishing a rapport with each general manager of
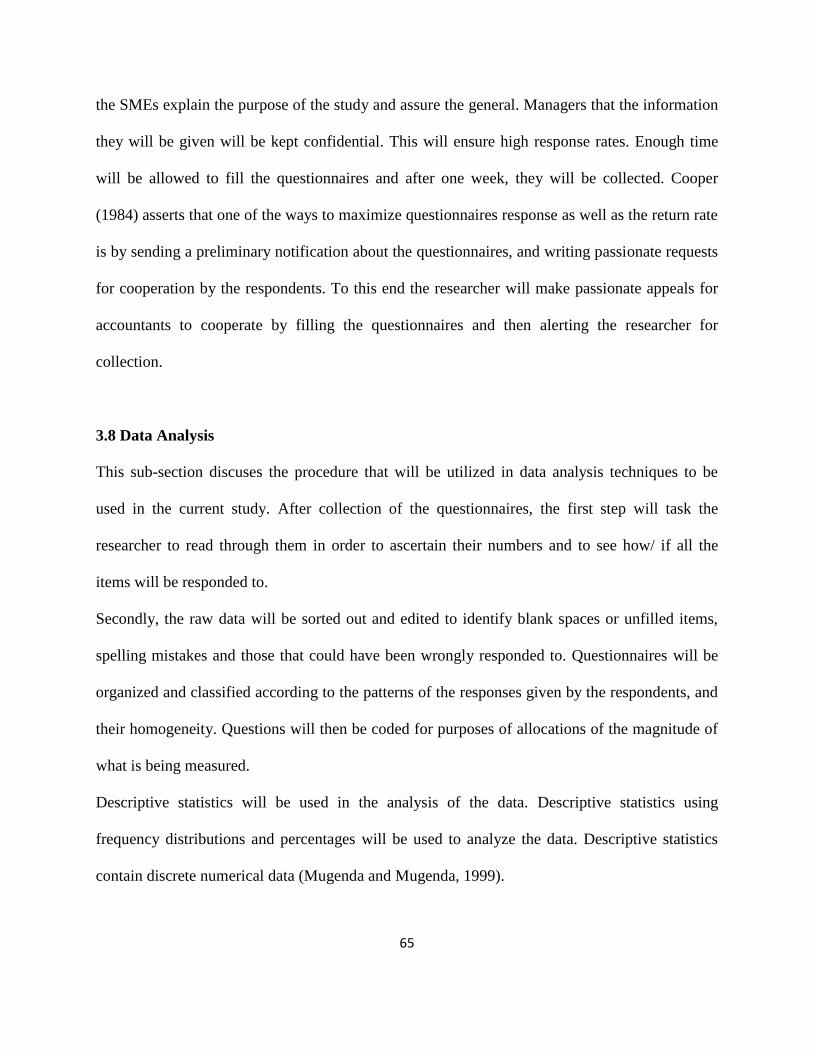
65
the SMEs explain the purpose of the study and assure the general. Managers that the information
they will be given will be kept confidential. This will ensure high response rates. Enough time
will be allowed to fill the questionnaires and after one week, they will be collected. Cooper
(1984) asserts that one of the ways to maximize questionnaires response as well as the return rate
is by sending a preliminary notification about the questionnaires, and writing passionate requests
for cooperation by the respondents. To this end the researcher will make passionate appeals for
accountants to cooperate by filling the questionnaires and then alerting the researcher for
collection.
3.8 Data Analysis
This sub-section discuses the procedure that will be utilized in data analysis techniques to be
used in the current study. After collection of the questionnaires, the first step will task the
researcher to read through them in order to ascertain their numbers and to see how/ if all the
items will be responded to.
Secondly, the raw data will be sorted out and edited to identify blank spaces or unfilled items,
spelling mistakes and those that could have been wrongly responded to. Questionnaires will be
organized and classified according to the patterns of the responses given by the respondents, and
their homogeneity. Questions will then be coded for purposes of allocations of the magnitude of
what is being measured.
Descriptive statistics will be used in the analysis of the data. Descriptive statistics using
frequency distributions and percentages will be used to analyze the data. Descriptive statistics
contain discrete numerical data (Mugenda and Mugenda, 1999).

66
Descriptive statistics which include frequencies distribution, percentages, and measure of central
tendency such as means, mode and measure of dispersion which includes standard deviations
will be derived. These analyzed data will be used to summarize findings and describe the
population sample involved.
Qualitative data will be derived from the open-ended questions in the questionnaire. The
responses will be organized in relation to the themes or research objectives and from this
information, the researcher will write a narrative and interpretive report in order to explain and
reflect the situation as it will be occurring in the selected sample.
The coded data will be entered in the computer for analysis using the Statistical Package for
Social Sciences (SPSS) version 17.5.
The results of data to be analyzed will be presented in form of tables that will show numerical
values in rows and columns. Results from descriptive analysis will be presented both in text and
tabular form. Figures that will be drawn from the results in tables will also be used to present the
results.
The ensuing sub-sections will discuss the methods of data analysis used in each of the research
question/variable in the current study.
3.8.1 Methods of Data Analysis Utilized on the Entry and Exit Behavior Effect of Small and
Medium Enterprises
Using a document checklist, it will be possible for the researcher to systematically collect
relevant data from documents about the trends of entry and exit of SMEs. In this case, document
such as records on entry and exit behavior for SMEs will be collected and then analyzed.
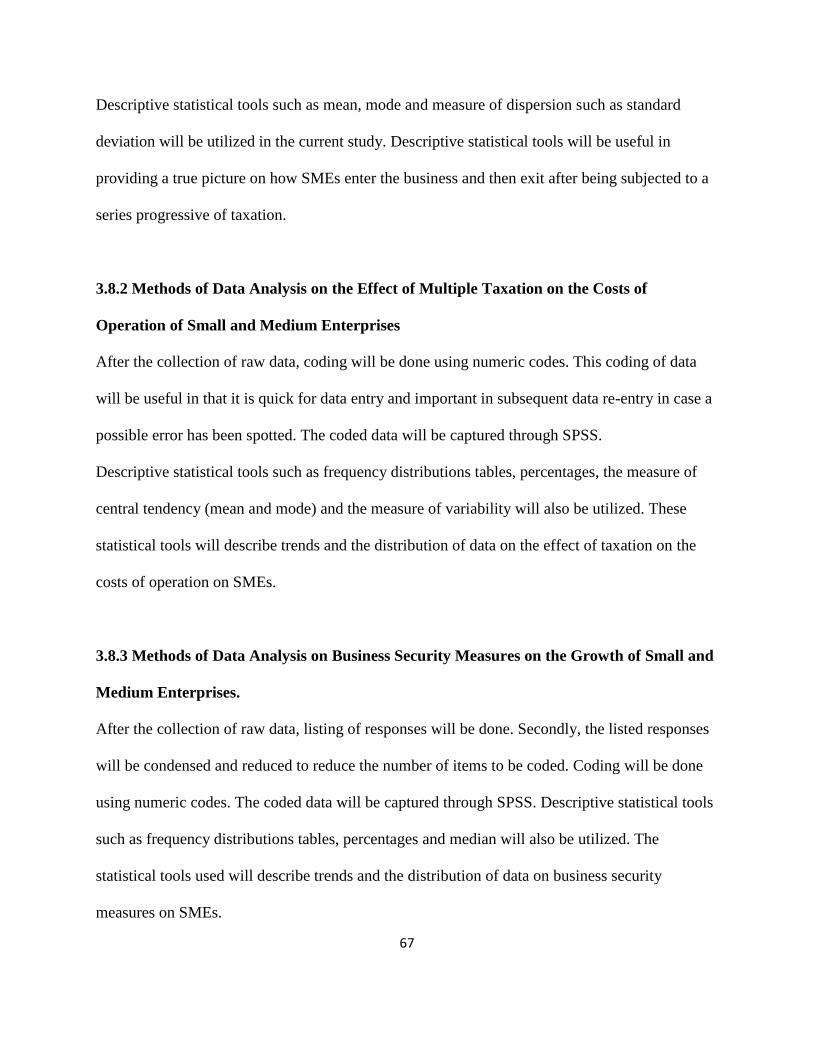
67
Descriptive statistical tools such as mean, mode and measure of dispersion such as standard
deviation will be utilized in the current study. Descriptive statistical tools will be useful in
providing a true picture on how SMEs enter the business and then exit after being subjected to a
series progressive of taxation.
3.8.2 Methods of Data Analysis on the Effect of Multiple Taxation on the Costs of
Operation of Small and Medium Enterprises
After the collection of raw data, coding will be done using numeric codes. This coding of data
will be useful in that it is quick for data entry and important in subsequent data re-entry in case a
possible error has been spotted. The coded data will be captured through SPSS.
Descriptive statistical tools such as frequency distributions tables, percentages, the measure of
central tendency (mean and mode) and the measure of variability will also be utilized. These
statistical tools will describe trends and the distribution of data on the effect of taxation on the
costs of operation on SMEs.
3.8.3 Methods of Data Analysis on Business Security Measures on the Growth of Small and
Medium Enterprises.
After the collection of raw data, listing of responses will be done. Secondly, the listed responses
will be condensed and reduced to reduce the number of items to be coded. Coding will be done
using numeric codes. The coded data will be captured through SPSS. Descriptive statistical tools
such as frequency distributions tables, percentages and median will also be utilized. The
statistical tools used will describe trends and the distribution of data on business security
measures on SMEs.
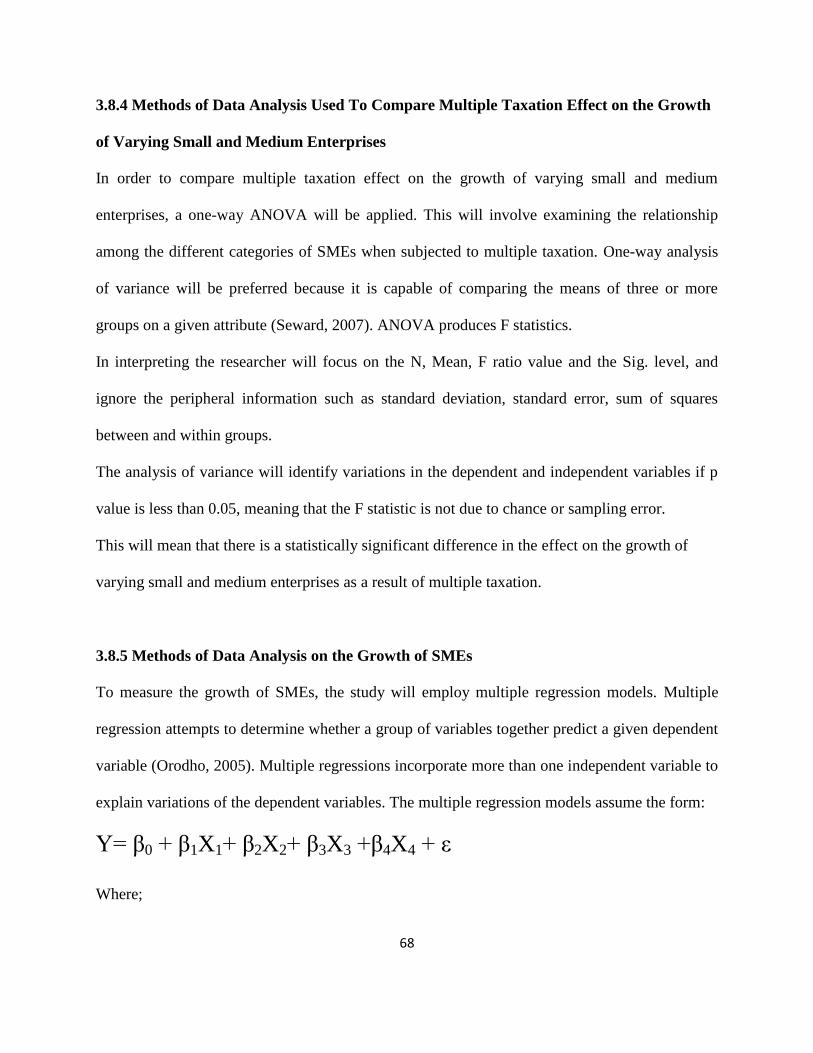
68
3.8.4 Methods of Data Analysis Used To Compare Multiple Taxation Effect on the Growth
of Varying Small and Medium Enterprises
In order to compare multiple taxation effect on the growth of varying small and medium
enterprises, a one-way ANOVA will be applied. This will involve examining the relationship
among the different categories of SMEs when subjected to multiple taxation. One-way analysis
of variance will be preferred because it is capable of comparing the means of three or more
groups on a given attribute (Seward, 2007). ANOVA produces F statistics.
In interpreting the researcher will focus on the N, Mean, F ratio value and the Sig. level, and
ignore the peripheral information such as standard deviation, standard error, sum of squares
between and within groups.
The analysis of variance will identify variations in the dependent and independent variables if p
value is less than 0.05, meaning that the F statistic is not due to chance or sampling error.
This will mean that there is a statistically significant difference in the effect on the growth of
varying small and medium enterprises as a result of multiple taxation.
3.8.5 Methods of Data Analysis on the Growth of SMEs
To measure the growth of SMEs, the study will employ multiple regression models. Multiple
regression attempts to determine whether a group of variables together predict a given dependent
variable (Orodho, 2005). Multiple regressions incorporate more than one independent variable to
explain variations of the dependent variables. The multiple regression models assume the form:
Y= β0 + β1X1+ β2X2+ β3X3 +β4X4 + ε
Where;
69
Y= Growth of SMEs, β0 = the intercept
β1, β2, β3 and β4 = partial regression coefficients (shows the change in the expected value of Y for
a unit change in X)
X1 = behavior effect, X2 = cost of operation, X3 = data security, X4 = nature of business
ε = random error
For every value of β (slope), a t-value and significance level for each t-value will be determined.
An independent variable will be considered to be a significant predictor of the dependent
variable if the absolute t-value of the regression coefficient associated with the dependent
variable is greater than the absolute critical t-value.
The overall fit of multiple regressions will be based on the F-test. The basis of F-test is based on
ANOVA test. The common measure of overall fit used in the current study will be the coefficient
of determination or R2, which is based on ANOVA table‘s sum of squares. The coefficient of
determination R2 is used in the context of statistical models whose main purpose is the prediction
of future outcomes on the basis of other related information
One-way analysis of variance will be preferred because it is capable of comparing the means of
three or more groups on a given attribute (Seward, 2007). The four predictors in the model will
be (a) behavior effect, (b) cost of operation, (c) data security and (d) nature of business. ANOVA
will be most preferred in the study because it can be used to examine differences among the
means of several different groups at once. Since ANOVA is used to test independent variables,
the researcher will opt to use it.
The researcher‘s main test of importance here will be to find out whether or not the dependent
variable (response) is determined by any group of independent variables (predictors). F-test will
70
be used with the assumption in mind that the four samples will be randomly selected from the
population and the populations being sampled have equal variances.
One of the assumption of ANOVA is that the response variable will be measured at interval or
ratio scales.
3.8.6 Hypotheses Testing
Descriptive statistics used to analyze data will be used to summarize finding and describe the
population sample involved in hypotheses testing and making of inferences.
The general guideline that will be used is that the significance value (p or sig.) that represent the
percentage or the probability the results are due to chance. The convention to be used is that
results must be equal or less than 5 % to chance. That is p must be smaller or equals to 0.05 in
order to claim the relationship to be truly significant (Seward, 2007).
Because hypothesis three asks for comparison between two groups: the entry and exit behavior
among SMEs and these two are interval data, t-test should be used to analyze the relationship
between entry and exit behavior of SMES due to effect of multiple taxation.
Interpretations and decisions on the results of the hypotheses test will be dependent upon the p-
values (shown as p in the results). The rule of thumb applied that if the p-value is more than 0.05
the researchers will not reject the null hypothesis. If it could be less than 0.05, then the researcher
could reject the Null hypothesis and take up the alternative hypothesis.
Significance will be tested at a level of 0.05, therefore meaning that, the independent samples t-
test will be used to compare two independent groups: those SMES entering and those exiting this
field when categorized by the effect of multiple taxation because the categories are only two and

71
this test is normally used to compare the means scores of two sample to a known value, thus
comparing the average of the two sample. According to (Seward, 2007), a t-test is any statistical
test in which the test statistic follows a student‘s t distribution if the null hypothesis is supported.
The independent samples t-test will assist the researcher in comparing mean values of those
SMEs entering and those forced out of these trades due to multiple taxation and to find out if the
difference between the means was statistically significant. This test will be preferred because the
two groups will be randomly drawn from normally distributed and independent populations of
SMEs therefore meaning that these will be two non-overlapping groups. The test will be
preferable since it will help to compare the two independent groups on the same attribute
(multiple taxation).
One-way analysis of variance will be used to test the second hypothesis and this test will be
preferred because it is capable of comparing the means of three or more groups on a given
attribute. This therefore will lock out the use of the t-test to test the second hypothesis because
SMEs will be categorized as from :( a) services, (b) wholesalers and retailers, (c) manufacturers
and agriculture and (d) financial services. ANOVA will be most preferred in the second
hypothesis because it can be used to examine differences among the means of several different
groups at once. Since ANOVA is be used to test independent variables, the researcher will opt to
use it.
Since F- distribution is the ratio of two variances, the ANOVA test statistic will generate F test
statistic. In interpreting the researcher will focus on the N, Mean, F ratio value and the Sig. level,
and ignore the peripheral information such as standard deviation, standard error, sum of squares
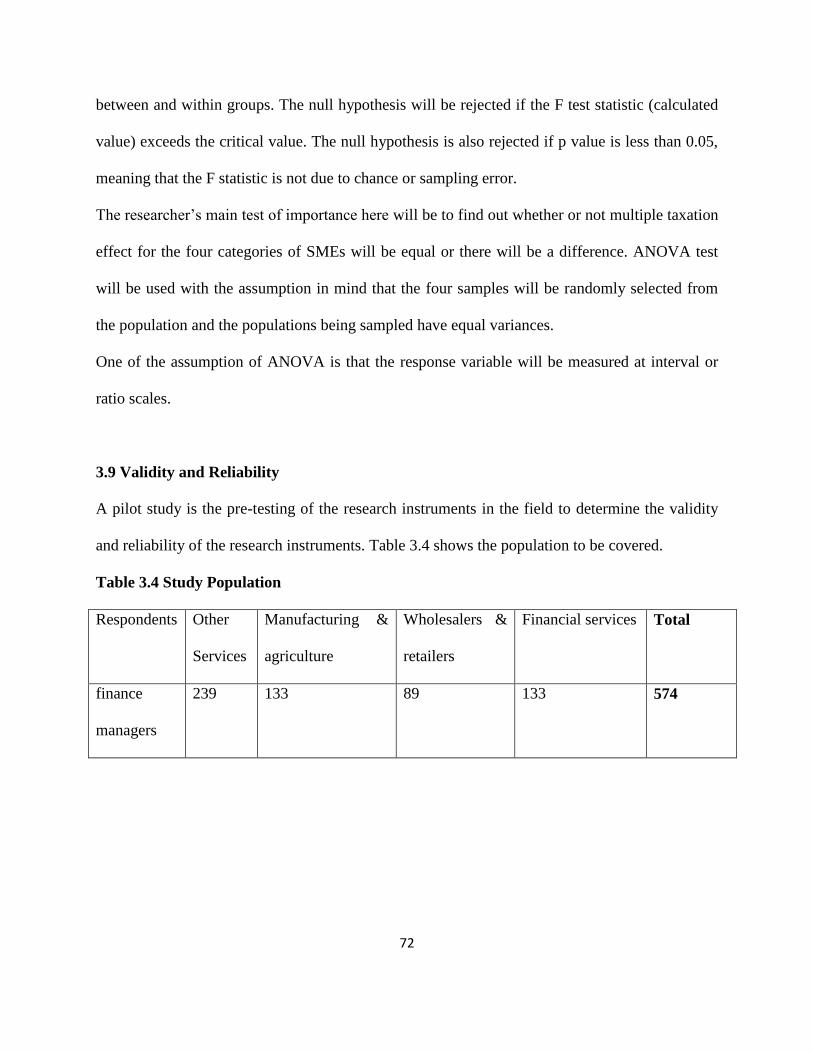
72
between and within groups. The null hypothesis will be rejected if the F test statistic (calculated
value) exceeds the critical value. The null hypothesis is also rejected if p value is less than 0.05,
meaning that the F statistic is not due to chance or sampling error.
The researcher‘s main test of importance here will be to find out whether or not multiple taxation
effect for the four categories of SMEs will be equal or there will be a difference. ANOVA test
will be used with the assumption in mind that the four samples will be randomly selected from
the population and the populations being sampled have equal variances.
One of the assumption of ANOVA is that the response variable will be measured at interval or
ratio scales.
3.9 Validity and Reliability
A pilot study is the pre-testing of the research instruments in the field to determine the validity
and reliability of the research instruments. Table 3.4 shows the population to be covered.
Table 3.4 Study Population
Respondents Other
Services
Manufacturing &
agriculture
Wholesalers &
retailers
Financial services Total
finance
managers
239 133 89 133 574

73
3.9.1 Internal Validity and External Validity
A research study has internal validity if the outcome will be dependent upon the variables
specifically under study. According to Weirsma (1980), validity is the extent to which the
instrument measures what it was designed to measure (Weirsma, 1980, p. 215).
There are many forms of internal validity; namely, content validity, construct validity and
criterion validity; however only content validity will be crucial in this study.
Content validity is the extent to which the content of the instrument in terms of the statements,
questions or indicators represents the property being measured (Frankfort-Nachmias &
Nachmias, 1996). According to Gay (1997), content validity is established by an expert. The
researcher will therefore consult the supervisors to approve the content of the instruments.
On the other hand, a study has external validity if the findings generalize to other situations and
subjects beyond those that will be studied (Orodho, 2009). In this study, the researcher will be
interested with population validity. Population validity is the extent at which the researcher
studies a sample of subjects with the objective of generalizing from the sample to the population
from which the sample is drawn (ibid). In the present study, the researcher will ensure external
validity by selecting a sample from which the generalizations will be made is indeed
representative of the population being generalized to. The population to which the study is based
will be the small and medium enterprises in Nairobi County.

74
3.9.2 Reliability
Reliability refers to consistence of measurement or the extent to which the results are similar
over different forms of the same instrument or occasions of data collection and the extent to
which measures are free from errors (McMillan & Schumacher, 2001). According to Orodho
(2005), reliability of an instrument concerns the degree to which a particular instrument can
consistently yield a similar result over a number of repeated trials .The researcher will use the
test-re-test method to determine the reliability of the instruments. Whereas we have many other
reliability methods such as split-halves, equivalent form and the internal consistency techniques,
the researcher will to use test- re-test which is appropriate for this study.
The developed questionnaires will be administered to accountants in the pilot SMEs twice at an
interval of one week. The scores of each administration will be recorded separately. Pearson‘s
Product Moment Formula will be used to calculate the correlation coefficient between the tests.
Berthoud (2000) states that a reliability index of a minimum of 0.6 is satisfactory for any
research instrument.
According to Orodho (2005), a coefficient correlation (r) of about 0.75 and above should be
considered high enough to judge an instrument as reliable. The researcher‘s value of coefficient
correlation (r) will be based upon attaining either of these coefficients to determine whether the
instruments will be considered reliable for data collection.
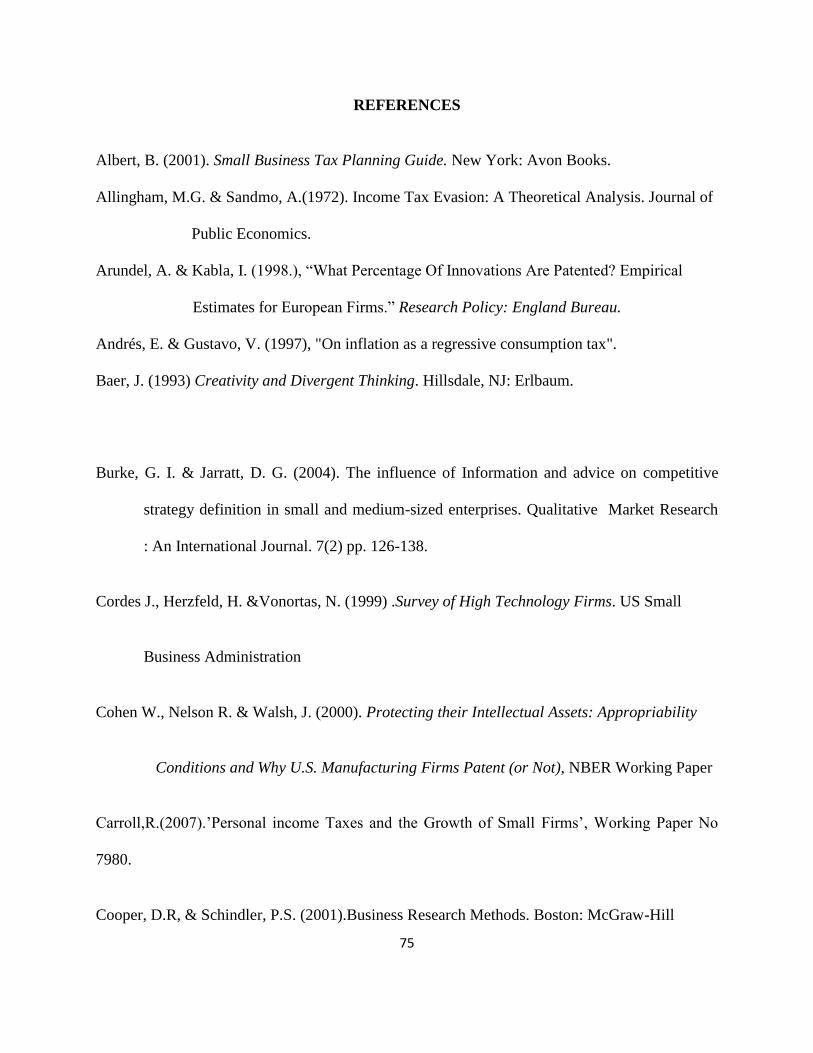
75
REFERENCES
Albert, B. (2001). Small Business Tax Planning Guide. New York: Avon Books.
Allingham, M.G. & Sandmo, A.(1972). Income Tax Evasion: A Theoretical Analysis. Journal of
Public Economics.
Arundel, A. & Kabla, I. (1998.), ―What Percentage Of Innovations Are Patented? Empirical
Estimates for European Firms.‖ Research Policy: England Bureau.
Andrés, E. & Gustavo, V. (1997), "On inflation as a regressive consumption tax".
Baer, J. (1993) Creativity and Divergent Thinking. Hillsdale, NJ: Erlbaum.
Burke, G. I. & Jarratt, D. G. (2004). The influence of Information and advice on competitive
strategy definition in small and medium-sized enterprises. Qualitative Market Research
: An International Journal. 7(2) pp. 126-138.
Cordes J., Herzfeld, H. &Vonortas, N. (1999) .Survey of High Technology Firms. US Small
Business Administration
Cohen W., Nelson R. & Walsh, J. (2000). Protecting their Intellectual Assets: Appropriability
Conditions and Why U.S. Manufacturing Firms Patent (or Not), NBER Working Paper
Carroll,R.(2007).‘Personal income Taxes and the Growth of Small Firms‘, Working Paper No
7980.
Cooper, D.R, & Schindler, P.S. (2001).Business Research Methods. Boston: McGraw-Hill
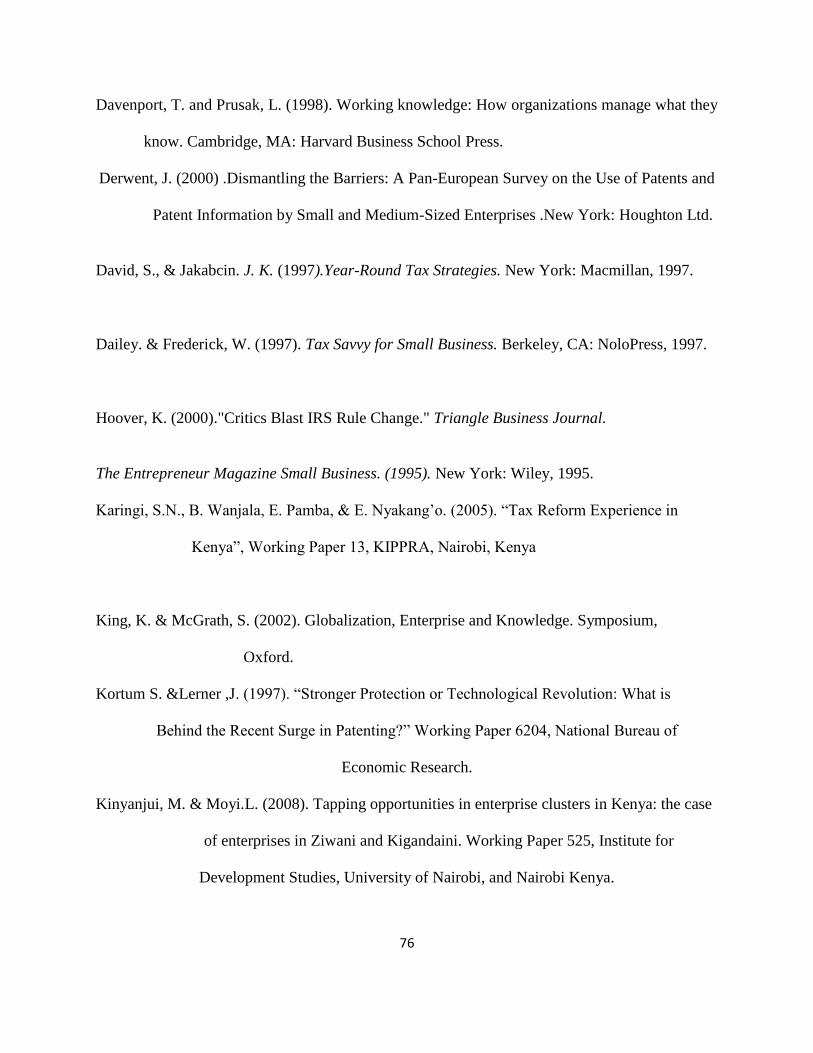
76
Davenport, T. and Prusak, L. (1998). Working knowledge: How organizations manage what they
know. Cambridge, MA: Harvard Business School Press.
Derwent, J. (2000) .Dismantling the Barriers: A Pan-European Survey on the Use of Patents and
Patent Information by Small and Medium-Sized Enterprises .New York: Houghton Ltd.
David, S., & Jakabcin. J. K. (1997).Year-Round Tax Strategies. New York: Macmillan, 1997.
Dailey. & Frederick, W. (1997). Tax Savvy for Small Business. Berkeley, CA: NoloPress, 1997.
Hoover, K. (2000)."Critics Blast IRS Rule Change." Triangle Business Journal.
The Entrepreneur Magazine Small Business. (1995). New York: Wiley, 1995.
Karingi, S.N., B. Wanjala, E. Pamba, & E. Nyakang‘o. (2005). ―Tax Reform Experience in
Kenya‖, Working Paper 13, KIPPRA, Nairobi, Kenya
King, K. & McGrath, S. (2002). Globalization, Enterprise and Knowledge. Symposium,
Oxford.
Kortum S. &Lerner ,J. (1997). ―Stronger Protection or Technological Revolution: What is
Behind the Recent Surge in Patenting?‖ Working Paper 6204, National Bureau of
Economic Research.
Kinyanjui, M. & Moyi.L. (2008). Tapping opportunities in enterprise clusters in Kenya: the case
of enterprises in Ziwani and Kigandaini. Working Paper 525, Institute for
Development Studies, University of Nairobi, and Nairobi Kenya.
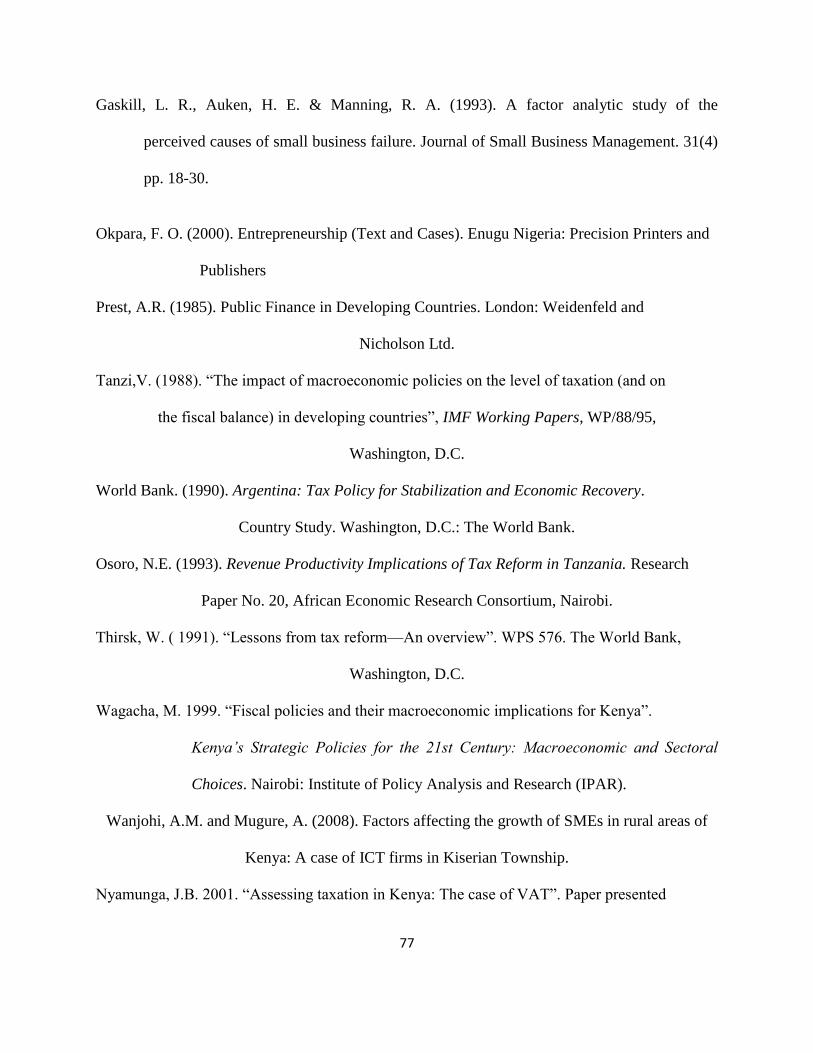
77
Gaskill, L. R., Auken, H. E. & Manning, R. A. (1993). A factor analytic study of the
perceived causes of small business failure. Journal of Small Business Management. 31(4)
pp. 18-30.
Okpara, F. O. (2000). Entrepreneurship (Text and Cases). Enugu Nigeria: Precision Printers and
Publishers
Prest, A.R. (1985). Public Finance in Developing Countries. London: Weidenfeld and
Nicholson Ltd.
Tanzi,V. (1988). ―The impact of macroeconomic policies on the level of taxation (and on
the fiscal balance) in developing countries‖, IMF Working Papers, WP/88/95,
Washington, D.C.
World Bank. (1990). Argentina: Tax Policy for Stabilization and Economic Recovery.
Country Study. Washington, D.C.: The World Bank.
Osoro, N.E. (1993). Revenue Productivity Implications of Tax Reform in Tanzania. Research
Paper No. 20, African Economic Research Consortium, Nairobi.
Thirsk, W. ( 1991). ―Lessons from tax reform—An overview‖. WPS 576. The World Bank,
Washington, D.C.
Wagacha, M. 1999. ―Fiscal policies and their macroeconomic implications for Kenya‖.
Kenya’s Strategic Policies for the 21st Century: Macroeconomic and Sectoral
Choices. Nairobi: Institute of Policy Analysis and Research (IPAR).
Wanjohi, A.M. and Mugure, A. (2008). Factors affecting the growth of SMEs in rural areas of
Kenya: A case of ICT firms in Kiserian Township.
Nyamunga, J.B. 2001. ―Assessing taxation in Kenya: The case of VAT‖. Paper presented
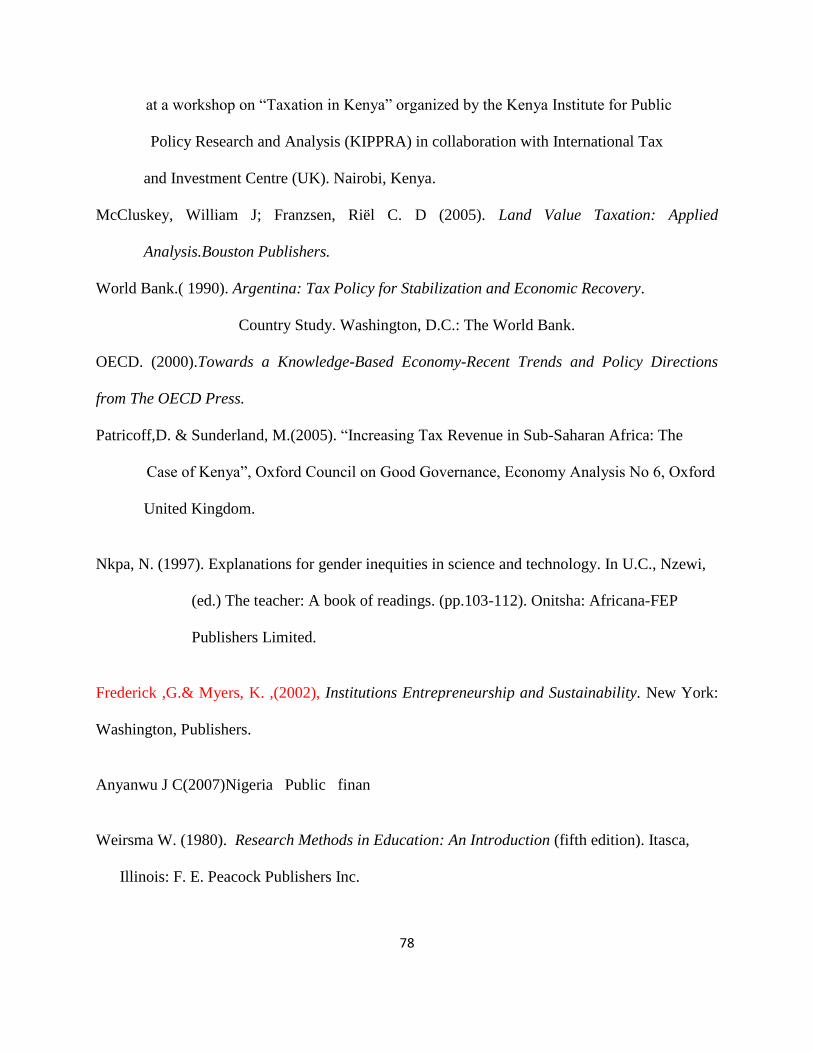
78
at a workshop on ―Taxation in Kenya‖ organized by the Kenya Institute for Public
Policy Research and Analysis (KIPPRA) in collaboration with International Tax
and Investment Centre (UK). Nairobi, Kenya.
McCluskey, William J; Franzsen, Riël C. D (2005). Land Value Taxation: Applied
Analysis.Bouston Publishers.
World Bank.( 1990). Argentina: Tax Policy for Stabilization and Economic Recovery.
Country Study. Washington, D.C.: The World Bank.
OECD. (2000).Towards a Knowledge-Based Economy-Recent Trends and Policy Directions
from The OECD Press.
Patricoff,D. & Sunderland, M.(2005). ―Increasing Tax Revenue in Sub-Saharan Africa: The
Case of Kenya‖, Oxford Council on Good Governance, Economy Analysis No 6, Oxford
United Kingdom.
Nkpa, N. (1997). Explanations for gender inequities in science and technology. In U.C., Nzewi,
(ed.) The teacher: A book of readings. (pp.103-112). Onitsha: Africana-FEP
Publishers Limited.
Frederick ,G.& Myers, K. ,(2002), Institutions Entrepreneurship and Sustainability. New York:
Washington, Publishers.
Anyanwu J C(2007)Nigeria Public finan
Weirsma W. (1980). Research Methods in Education: An Introduction (fifth edition). Itasca,
Illinois: F. E. Peacock Publishers Inc.

79
Orodho,J.A(2005). Techniques of Writing Research Proposals and Reports in Education and
Social Sciences .Nairobi,2rd
Ed .Bureau of Education Research .K.U Kanezja HP
Publishers.
Ogula, P. (1998). A handbook on Educational Research. Nairobi: New Kemit Publishers.
Verma, G. and Beard, R. (1981). What is Educational Research. Hants: Gower Publishing
Company.
Lockesh K. (1984). Methodology of Educational Research. New Delhi: Vikas Publishing House
PVT Ltd.
Miller, C (1991). Handbook of Research Design and Social Measurement, Newbury Park,
Gage.
Gay L.R (1992) Educational Research: Competences for Analysis and Application
Borg and Gall. (1989).Educational Research, New York.Longmam
Frankfort-Nachmias & Nachmias, D. (1996). Research Methods in the Social Sciences
(5th
ed.). London: Arnold.
Mcmillan, J. H. & Schumacher, S. (2001). 5th
Edition, Research in Education. London:
Addison Wesley Longman
Wiersma W. (1995). Research Methods in Education. An Introduction. London: Allyn.
Schumpeter, J.A. (1934).The Theory of Economic Development. Cambridge, MA: Harvard
University Press.
80
North, D.C. (1990). Institutions, Institutional Change, and Economic Performance. New York:
Norton Ltd
McClelland, D.C. (1961).The Achieving Society, NJ: Van Nostrand, Princeton
Murphy, J.P, Liao, J & Welsch, P.H. (2006), ―A Conceptual history of entrepreneurial thought‖,
Journal of Management History. 12, 9-24.
Kirzner, I.M. (1973). Competition and Entrepreneurship. Chicago, IL: University of Chicago
Gartner, W.B., Shaver, K.G., Carter, N.M., & Reynolds, P.D. (2004). Handbook of
entrepreneurial dynamics. Thousand Oaks, CA: Sage Publications
Fiet, J.O. (2002). The Systematic Search for Entrepreneurial Discoveries, Westport, CT:
Quorum Books
Frese, M (2000). Success and failure of Micro business Owners in Africa: A psychological
approach. Greenwood, Westport, CT
Mamun, Z. M.(2000). Entrepreneurship Development An Operational Approach. Bangladesh:
The University Press Limited.
Casson, Mark. 2005. ―Review of Scott Shane, A General Theory of Entrepreneurship,‖
Cheltenham: Edward Elgar, 2003. Small Business Economics, 24(5), 423-430.
Warsh, David. 2006. Knowledge and the Wealth of Nations. New York: W.W. Norton &
Company. 32
81
Shane, S and T. Ulrich. 2004. ―Technological Innovation, Product Development and
Entrepreneurship in Management Science.” Management Science. 50(2),133-144.
Shane, Scott. 2001. ―Technological Opportunity and New Firm Creation.‖ Management
Science. 47(2) 205-220.
Kirzner, Isreal. M. 1973. Competition and Entrepreneurship. Chicago: University of Chicago
Press.
Acs, Zoltan .J., David B. Audretsch and Maryann P. Feldman. 1994. ―R&D Spillovers and
Recipient Firm Size.‖ Review of Economics and Statistics. 76, 336-340.
Frese, M .(2000). Success and failure of Micro business Owners in Africa: A psychological
approach. Greenwood, Westport, CT
Pervin, L.A. (1980). Personality: Theory, Assessment and Research. New York: John Wiley &
Sons
Becker, (2001). ―Human Capital. Chicago‖, IL: Chicago University Press.
Landstrom, H. (1998).The Roots of Entrepreneurship Research, Conference proceedings, Lyon,
France, November 26-27.
Coon, D. (2004). Introduction to Psychology (9th Ed) Minneapolis: West Publishing Company.
Rauch, A., & Frese, M. (2000), ―Psychological approaches to entrepreneurial success: A general
model and an overview of findings‖, In: Cooper C L, Robertson I T (eds.), International Review
of Industrial and Organisational Psychology, 10, 1-41

82
McClelland, D.C. (1961).The Achieving Society, NJ: Van Nostrand, Princeton
Mamun Z Mohammad, Entrepreneurship Development An Operational Approach, Published by
The University Press Limited, Bangladesh, 2000
Jaffe, Adam B. 1989. ―Real Effects of Academic Research,‖ American Economic Review, 79 (5),
957-970.
Thuronyi,,T.( 2009).Comparative Income Taxation. Washington: Amazon Inc.
Stoner. J. (2002). Creative Response in Economic History. Ibadan: Oxford University Press.
Robbins, H. (2006).Small Business Management. New York. Willy and Sons.
Storey, D. (1994). Understanding the Small Business Sectors. USA: Rutledge
Anyanwu,J.C
Rauch, A., & Frese, M. (2000), ―Psychological approaches to entrepreneurial success: New
York: John Wiley & Sons.
Saha Kumar Saroj, "Entrepreneurship and Economic Development", Entrepreneurship, Edited by Rahman A.H.M.
Habibur, Published by , University Grand Commission of Bangladesh, (English version) 1989.
APPENDIX I
QUESTIONNAIRES FOR FINANCE MANAGERS
SECTION A
This section contains questions that relate to your business background. Pleases indicate your
responses in the spaces provided in each item.
A.1 Form of business (Tick one)
Airline
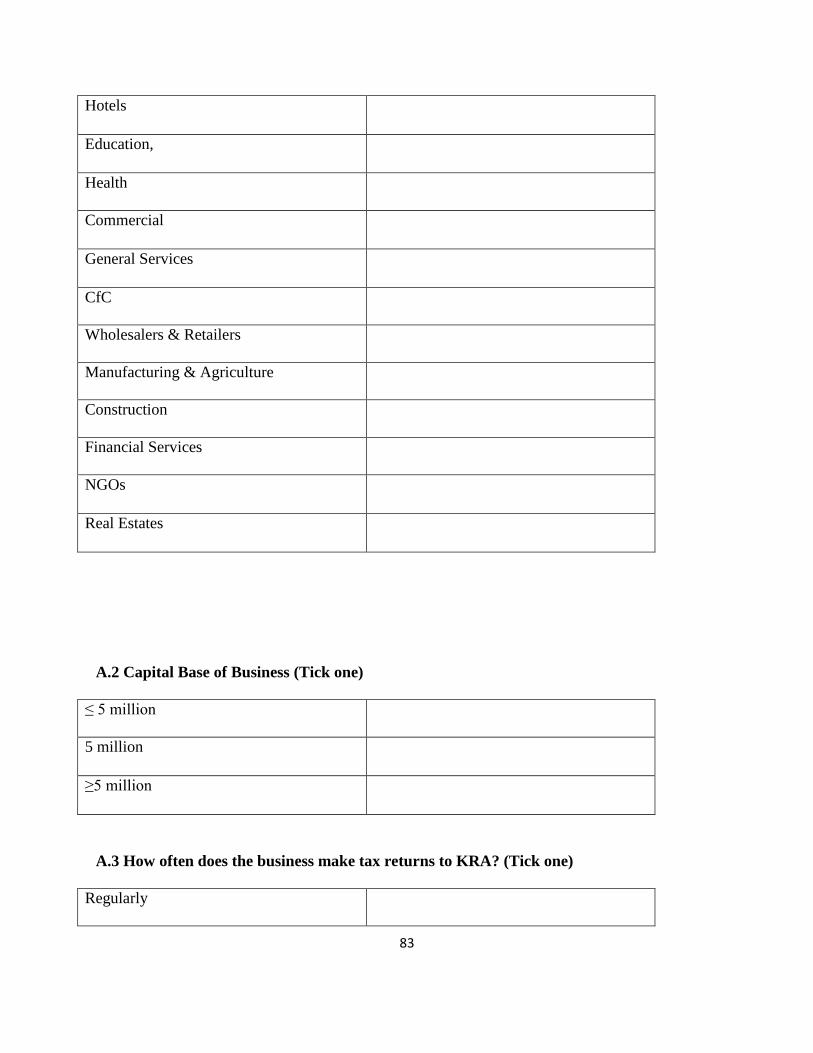
83
Hotels
Education,
Health
Commercial
General Services
CfC
Wholesalers & Retailers
Manufacturing & Agriculture
Construction
Financial Services
NGOs
Real Estates
A.2 Capital Base of Business (Tick one)
≤ 5 million
5 million
≥5 million
A.3 How often does the business make tax returns to KRA? (Tick one)
Regularly
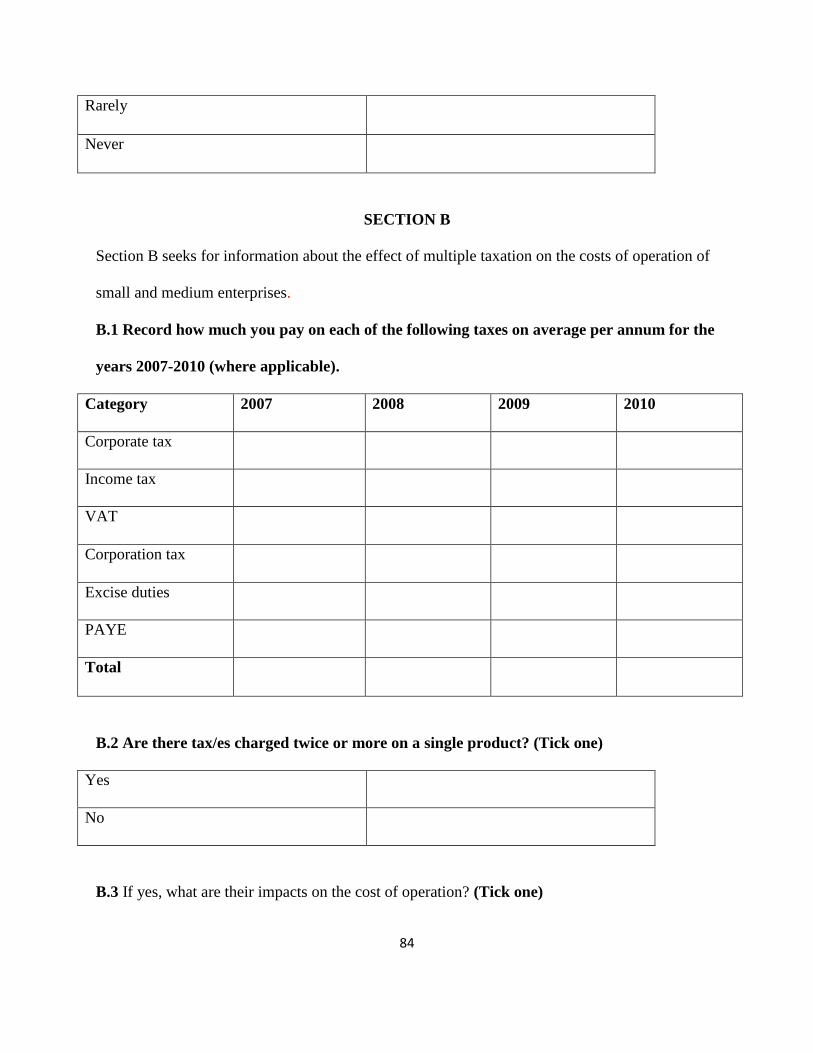
84
Rarely
Never
SECTION B
Section B seeks for information about the effect of multiple taxation on the costs of operation of
small and medium enterprises.
B.1 Record how much you pay on each of the following taxes on average per annum for the
years 2007-2010 (where applicable).
Category 2007 2008 2009 2010
Corporate tax
Income tax
VAT
Corporation tax
Excise duties
PAYE
Total
B.2 Are there tax/es charged twice or more on a single product? (Tick one)
Yes
No
B.3 If yes, what are their impacts on the cost of operation? (Tick one)
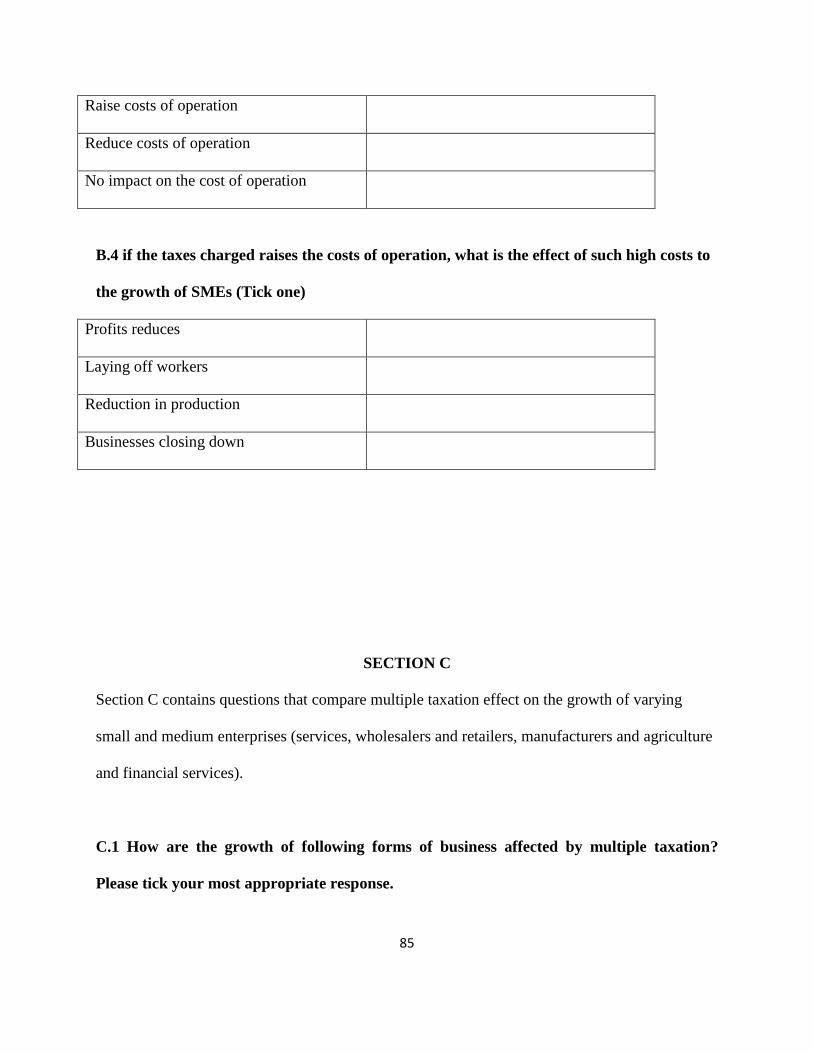
85
Raise costs of operation
Reduce costs of operation
No impact on the cost of operation
B.4 if the taxes charged raises the costs of operation, what is the effect of such high costs to
the growth of SMEs (Tick one)
Profits reduces
Laying off workers
Reduction in production
Businesses closing down
SECTION C
Section C contains questions that compare multiple taxation effect on the growth of varying
small and medium enterprises (services, wholesalers and retailers, manufacturers and agriculture
and financial services).
C.1 How are the growth of following forms of business affected by multiple taxation?
Please tick your most appropriate response.

86
Forms of Business very moderately Neutral Slightly Not affected
Airline
Hotels
Education
Health
Commercial
General Services
CFC
Wholesalers & Retailers
Manufacturing & Agriculture
Construction
Financial Services
NGOs
Real Estates
SECTION D
Section D contains questions that establish the entry and exit behavior effect of small and
medium enterprises as result of multiple taxation follow-up.
D.1 please provide data on your enterprise performance before and after the introduction
of new multiple taxation measures
Aspect Before in Ksh During the taxable period in Ksh
income

87
Expenses
Tax paid
profit
D.2 how do the data in D1 figures compare in relation to the growth of SMEs
………………………………………………………………………………………………………
………………………………………………………………………………………………………
D.3 State the cost incurred as a result of multiple taxation
………………………………………………………………………………………………………
………………………………………………………………………………………………………
D.4 Are the enterprises making profits or losses
Aspect Profits Losses
services
wholesalers and retailers
manufacturers and agriculture
financial services
D.5 please read the following statements on the behavior of SMEs and indicate your level of
agreement or disagreement
Statement Strongly
agree
Disagree Neutral Agree Strongly
Disagree
Multiple taxation stunt growth of SMEs

88
Enterprises are forced out of business due
to multiple taxation
Multiple taxation increases operation
costs
There are no businesses exiting due to
taxation
Most SMEs are winding up due multiple
taxation
SECTION E
Section E collects information on business security measures in line with tax avoidance on the
growth of small and medium enterprises.
E.1 please read the following statements on tax security measures that are available for the
SME and indicate your level of agreement or disagreement
Statement Strongly agree Disagree Neutral Agree Strongly Disagree
Tax compliance
Withholding tax
Savings on mortgages

89
Delaying of documentation
Increased year end purchases
E.2 are there cases of tax evasion for SMEs as a result of multiple taxation?
Yes
No
If yes, in what form are they exhibited?
A failure to report substantial amounts of income
A claim for fictitious or improper deductions on a return
Accounting irregularities
Improper allocation of income to a related taxpayer who is in a lower tax bracket
E.3 how do SMEs respond to the effect of multiple taxation? Please tick your most
appropriate response.
Tax evasion
Tax avoidance
Legal Vagueness

90
Reducing income
Take Advantage of tax credit
Increase your withholding
Company merger
SECTION F
Section F contains questions that establish the impact of multiple taxation on the Growth of SMEs
in relation to the following growth indicators: Sales, Profit, and Employees and Capital.
Indicate in figures the following indicators for the last five years.
Indicators
Years 2006-2010
2006 2007 2008 2009 2010
Sales
Gross Profit
Number of Employees
Capital