chapter iv an analysis of level of customers...
TRANSCRIPT

194
CHAPTER IV
AN ANALYSIS OF LEVEL OF CUSTOMERS AWARENESS
IN RETAIL BANKING SERVICES
INRODUCTION
The awareness of customers towards retail banking services would have an
impact on the utilization of these services. The banks render various retail banking
services to their customers. Due to technological advancement, the retail banking
services offered by banks have improved to a greater extent. However, the usage of
these services would depend highly on the awareness of customers towards these
services. In this study, an attempt has been made to analyze the level of awareness
of customers towards various retail banking services offered by banks in Salem
District. In this regard, 25 retail banking services as listed below have been
selected:
1. E – Banking Facility/Core Banking
2. Credit card facility
3. ECS for payment of loan installment
4. Teller facility
5. Housing loan
6. Personal loans
7. Electronic clearance service
8. Educational loans
9. Agency service
10. Inter – bank deposits facility
11. Vehicle loan

195
12. Safety locker facility
13. RTGS/NEFT (Electronic Fund Transfer)
14. Jewel loan
15. Overdraft
16. NRI Deposit
17. Provision of 24 hrs free phone services
18. Services to senior citizens
19. Rates of interest on various deposits
20. Counseling on post retirement services
21. Interest rate option/Fixed and floating rate on loan
22. Conversion of excess balance to time deposit
23. Sunday banking facility
24. Tele-banking and
25. Insurance products
The sample respondents were asked to indicate their level of awareness
towards these retail banking services in a five-point rating scale – Fully aware,
Partially aware, Just aware, Not aware and Not at all aware. The responses given
by the respondents were assigned scores like 5 for fully aware, 4 for partially aware,
3 for just aware, 2 for not aware and 1 for not at all aware. These scores have been
summed up and on the basis of total scores, the level of awareness has been
classified as low, medium and high. The scores between 25 and 41 were considered
as low level, while the scores between 42 and 58 were categorized as medium level
and the scores above 59 but less than or equal to 75 were grouped as high level. On
the basis of these scores and levels, the relationships between demographic

196
variables and level of awareness, ownership pattern of the bank and level of
awareness and frequency of operations and level of awareness have been examined
in this chapter.
TABLE 4.1
GENDER AND AWARENESS ON RETAIL BANKING SERVICES
Gender No. of respondents % Mean Minimum Maximum S.D.
Male 348 69.60 71.20 33 125 14.83
Female 152 30.40 72.61 35 116 15.65
Total 500 100.00 71.63 33 125 15.08
Source: Computed from the Primary Data
Table 4.1 shows that the average score of awareness of male customers was
found to be 71.20 which ranged between 33 and 125 with a standard deviation of
14.83. The mean score of awareness of female customers was found to be 72.61
which ranged between 35 and 116 with a standard deviation of 15.65. It denotes
that the mean score of awareness of female customers (72.61) was higher than
the mean score of awareness of male customers (71.20). However, the maximum
score of male customers (125) was found to be greater than that of female
customers (116).
TABLE 4.2
GENDER AND AWARENESS ON RETAIL BANKING SERVICES –
TWO WAY TABLE
Gender Level of Awareness
Low Medium High Total
Male 66
(67.35)
259
(70.57)
23
(65.71)
348
Female 32
(32.65)
108
(29.43)
12
(34.29)
152
Total 98 367 35 500
Source: Computed from the Primary Data
197
It could be understood from the Table 4.2 that the high level of awareness
was found to be higher among male respondents (65.71 per cent) while the high
level of awareness was found to be lower among the female respondents
(34.29 per cent). It is also observed from the analysis that the medium level of
awareness was greater among the male respondents (70.57 per cent) and it was
lower among the female respondents (29.43 per cent). The proportion of male
customers having low level of awareness was found to be 67.35 per cent while the
proportion of female customers with low level of awareness was found to be
32.65 per cent.
In order to understand the significance of relationship between gender of the
respondents and their level of awareness towards retail banking services, the
following hypotheses have been framed and tested with chi square test:
Null Hypothesis H0: There is no significant relationship between gender of the
respondents and their level of awareness towards retail banking services.
Alternative Hypothesis H1: There is a significant relationship between gender of
the respondents and their level of awareness towards retail banking services.
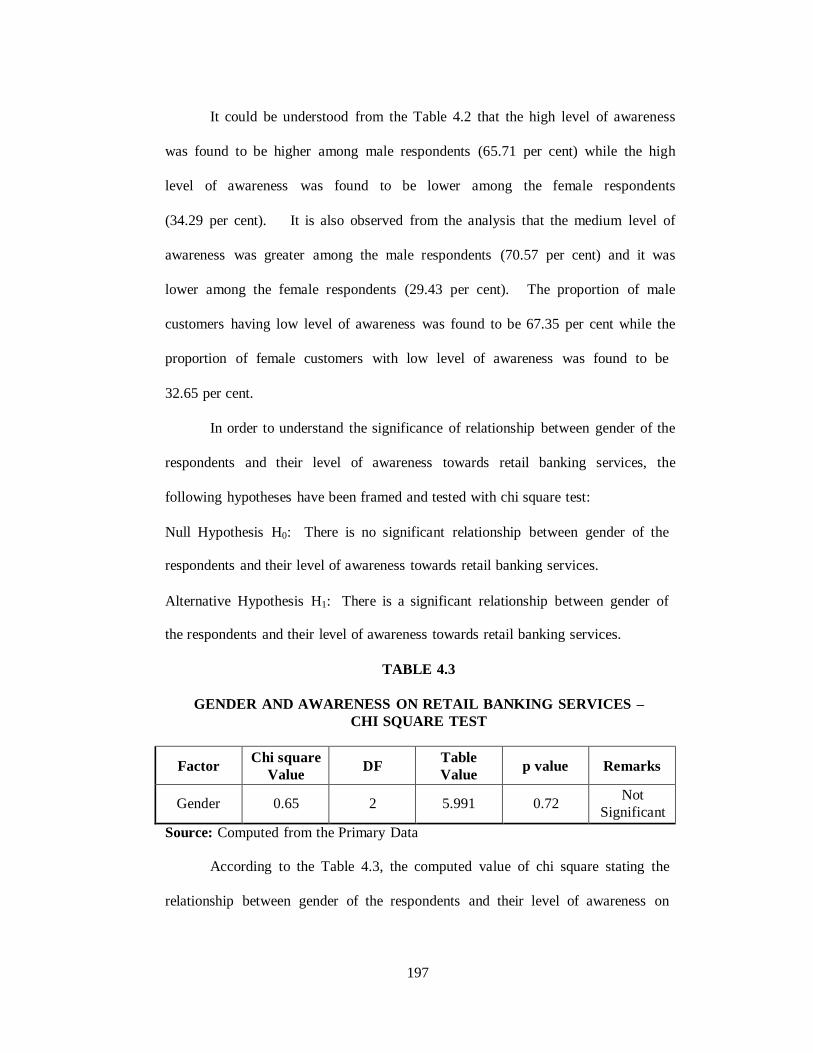
TABLE 4.3
GENDER AND AWARENESS ON RETAIL BANKING SERVICES –
CHI SQUARE TEST
Factor Chi square
Value
DF Table
Value
p value
Remarks
Gender
0.65
2
5.991
0.72 Not
Significant
Source: Computed from the Primary Data
According to the Table 4.3, the computed value of chi square stating the
relationship between gender of the respondents and their level of awareness on

198
retail banking services was 0.65 while the table value at 5% level of significance for
2 degrees of freedom was 5.991 and the p value was 0.72. Since the computed
value was lesser than the table value, it falls in the acceptance region. Hence, the
null hypothesis is accepted and the alternative hypothesis is rejected. The
hypothesis that ‘gender of the respondents and their level of awareness on retail
banking services are not significantly related’ holds good. Thus, it is concluded
that there is no significant relationship between gender of the respondents and their
level of awareness on retail banking services.
TABLE 4.4
AGE AND AWARENESS ON RETAIL BANKING SERVICES
Age
No. of
responde
nts
%
Mean
Minimum
Maximum
S.D.
Up to 20
years
50
10.00
72.52
48
101
11.66
21 to 30
years
284
56.80
72.48
33
125
15.15
31 to 40
years
112
22.40
71.99
35
106
14.56
Above
40 years
54
10.80
65.57
39
100
17.44
Total 500 100.00 71.63 33 125 15.08
Source: Computed from the Primary Data
Table 4.4 shows that the average score of awareness of customers in the age
group of up to 20 years was found to be 72.52 which ranged between 48 and 101
with a standard deviation of 11.66. The mean score of awareness of customers in
the age group of 21 to 30 years was found to be 72.48 which ranged between 33 and
125 with a standard deviation of 15.15. It is also found that the average score of
awareness of customers in the age group of 31 to 40 years was 71.99 which ranged
between 35 and 106 with a standard deviation of 14.56 while the average score of

199
awareness of customers in the age group of above 40 years was found to be 65.57
which ranged between 39 and 100 with a standard deviation of 17.44.
It denotes that the mean score of awareness of customers in the age group of
up to 20 years (72.52) was higher than the mean score of awareness of all the other
customers. However, the maximum score of customers in the age group of 20 to 40
years (125) was found to be greater than that of the other customers.
TABLE 4.5
AGE AND AWARENESS ON RETAIL BANKING SERVICES –
TWO WAY TABLE
Age Level of Awareness
Low Medium High Total
Up to 20 years 6
(6.12)
42
(11.44)
2
(5.71)
50
21 to 30 years 46
(46.94)
215
(58.58)
23
(65.71)
284
31 to 40 years 23
(23.47)
81
(22.07)
8
(22.86)
112
Above 40 years 23
(23.47)
29
(7.90)
2
(5.71)
54
Total 98 367 35 500
Source: Computed from the Primary Data
It could be understood from the Table 4.5 that the high level of awareness
was found to be higher among respondents in the age group of up to 20 years
(65.71 per cent) while the high level of awareness was found to be lower among the
respondents in the age group of above 40 years (5.71 per cent). It is also observed
from the analysis that the medium level of awareness was greater among the
respondents in the age group of 21 to 30 years (58.58 per cent) and it was lower
among the respondents in the age group of above 40 years (7.90 per cent). The
proportion of customers in the age group of 21 to 30 years having low level of

200
awareness was found to be 46.94 per cent while the proportion of customers in the
age group of up to 20 years with low level of awareness was found to be
6.12 per cent.
In order to understand the significance of relationship between age group of
the respondents and their level of awareness towards retail banking services, the
following hypotheses have been framed and tested with chi square test:
Null Hypothesis H0: There is no significant relationship between age group of the
respondents and their level of awareness towards retail banking services.
Alternative Hypothesis H1: There is a significant relationship between age group of
the respondents and their level of awareness towards retail banking services.
TABLE 4.6
AGE AND AWARENESS ON RETAIL BANKING SERVICES – CHI
SQUARE TEST
Factor Chi square
Value
DF Table
Value
p value
Remarks
Age
23.58
6
16.812
0.00 Significant
@ 1%
Source: Computed from the Primary Data
According to the Table 4.6, the computed value of chi square stating the
relationship between age of the respondents and their level of awareness on retail
banking services was 23.58 while the table value at 1% level of significance for 6
degrees of freedom was 16.812 and the p value was 0.00. Since the computed value
was greater than the table value, it falls in the rejection region. Hence, the null
hypothesis is rejected and the alternative hypothesis is accepted. The hypothesis
that ‘age of the respondents and their level of awareness on retail banking services
are not significantly related’ does not hold good. Thus, it is concluded that there is

201
a significant relationship between age of the respondents and their level of
awareness on retail banking services.
TABLE 4.7
MARITAL STATUS AND AWARENESS ON RETAIL BANKING
SERVICES
Marital
Status
No. of
respondents
%
Mean
Minimum
Maximum
S.D.
Married 230 46.00 70.61 35 116 16.34
Unmarri
ed
270
54.00
72.49
33
125
13.89
Total 500 100.00 71.63 33 125 15.08
Source: Computed from the Primary Data
Table 4.7 shows that the average score of awareness of married customers
was found to be 70.61 which ranged between 35 and 116 with a standard deviation
of 16.34. The mean score of awareness of unmarried customers was found to be
72.49 which ranged between 33 and 125 with a standard deviation of 13.89. It
denotes that the mean score of awareness of unmarried customers (72.49) was
higher than the mean score of awareness of married customers (70.61). Similarly,
the maximum score of unmarried customers (125) was found to be greater than that
of married customers (116).
TABLE 4.8
MARITAL STATUS AND AWARENESS ON RETAIL BANKING
SERVICES – TWO WAY TABLE
Marital Status Level of Awareness
Low Medium High Total
Married 62
(63.27)
151
(41.14)
17
(48.57)
230
Unmarried 36
(36.73)
216
(58.86)
18
(51.43)
270
Total 98 367 35 500
Source: Computed from the Primary Data

202
It could be understood from the Table 4.8 that the high level of awareness
was found to be higher among unmarried respondents (51.43 per cent) while the
high level of awareness was found to be lower among the married respondents
(48.57 per cent). It is also observed from the analysis that the medium level of
awareness was greater among the unmarried respondents (58.86 per cent) and it was
lower among the married respondents (41.14 per cent). On the other hand, the
proportion of married customers having low level of awareness was found to be
63.27 per cent while the proportion of unmarried customers with low level of
awareness was found to be 36.73 per cent.
In order to understand the significance of relationship between marital status
of the respondents and their level of awareness towards retail banking services, the
following hypotheses have been framed and tested with chi square test:
Null Hypothesis H0: There is no significant relationship between marital status of
the respondents and their level of awareness towards retail banking services.
Alternative Hypothesis H1: There is a significant relationship between marital
status of the respondents and their level of awareness towards retail banking
services.
TABLE 4.9
MARITAL STATUS AND AWARENESS ON RETAIL BANKING
SERVICES – CHI SQUARE TEST
Factor Chi square
Value
DF Table
Value
p value
Remarks
Marital
Status
15.34
2
9.21
0.00 Significant
@ 1%
Source: Computed from the Primary Data

203
According to the Table 4.9, the computed value of chi square stating the
relationship between marital status of the respondents and their level of awareness
on retail banking services was 15.34 while the table value at 1% level of
significance for 2 degrees of freedom was 9.21 and the p value was 0.00. Since the
computed value was greater than the table value, it falls in the rejection region.
Hence, the null hypothesis is rejected and the alternative hypothesis is accepted.
The hypothesis that ‘marital status of the respondents and their level of awareness
on retail banking services are not significantly related’ does not hold good. Thus, it
is concluded that there is a significant relationship between marital status of the
respondents and their level of awareness on retail banking services.
TABLE 4.10
EDUCATIONAL QUALIFICATION AND AWARENESS ON RETAIL
BANKING SERVICES
Educational
Qualification
No. of
respondents
%
Mean
Minimum
Maximum
S.D.
Illiterate 19 3.80 74.47 50 99 16.04
School Level 98 19.60 65.51 35 102 16.50
UG 188 37.60 71.98 33 110 13.70
PG 164 32.80 75.25 35 125 14.78
Others 31 6.20 67.90 46 94 13.25
Total 500 100.00 71.63 33 125 15.08
Source: Computed from the Primary Data
Table 4.10 shows that the average score of awareness of illiterate customers
was found to be 74.47 which ranged between 50 and 99 with a standard deviation of
16.04. The mean score of awareness of school level educated customers was found
to be 65.51 which ranged between 35 and 102 with a standard deviation of 16.50. It
is also found that the average score of awareness of UG level educated customers
was 71.98 which ranged between 33 and 110 with a standard deviation of 13.70

204
Educational
Qualification
Level of Awareness
Low Medium High Total
Illiterate 5
(5.10)
12
(3.27)
2
(5.71)
19
School Level 37
(37.76)
55
(14.99)
6
(17.14)
98
UG 25
(25.51)
152
(41.42)
11
(31.43)
188
PG 22
(22.45)
127
(34.60)
15
(42.86)
164
Others 9
(9.18)
21
(5.72)
1
(2.86)
31
Total 98 367 35 500
while the average score of awareness of PG level educated customers was found to
be 75.25 which ranged between 35 and 125 with a standard deviation of 14.78. The
average score of awareness of customers with other levels of educational
qualification was found to be 67.90 with a minimum of 46 and a maximum of 94
whose standard deviation was found to be 13.25.
It denotes that the mean score of awareness of PG level educated customers
(75.25) was higher than the mean score of awareness of all the other customers.
Similarly, the maximum score of PG level educated customers (125) was found to
be greater than that of the other customers.
TABLE 4.11
EDUCATIONAL QUALIFICATION AND AWARENESS ON RETAIL
BANKING SERVICES – TWO WAY TABLE
Source: Computed from the Primary Data
It could be understood from the Table 4.11 that the high level of awareness
was found to be higher among PG level educated respondents (42.86 per cent)
while the high level of awareness was found to be lower among the respondents
with other educational qualifications (2.86 per cent). It is also observed from the
analysis that the medium level of awareness was greater among the UG level

205
educated respondents (41.42 per cent) and it was lower among the illiterate
respondents (3.27 per cent). The proportion of school level educated customers
having low level of awareness was found to be 37.76 per cent while the proportion
of illiterate customers with low level of awareness was found to be 5.10 per cent.
In order to understand the significance of relationship between educational
qualification of the respondents and their level of awareness towards retail banking
services, the following hypotheses have been framed and tested with chi square test:
Null Hypothesis H0: There is no significant relationship between educational
qualification of the respondents and their level of awareness towards retail banking
services.
Alternative Hypothesis H1: There is a significant relationship between educational
qualification of the respondents and their level of awareness towards retail banking
services.
TABLE 4.12
EDUCATIONAL QUALIFICATION AND AWARENESS ON RETAIL
BANKING SERVICES – CHI SQUARE TEST
Factor Chi square
Value
DF Table
Value
p value
Remarks
Educational
Qualification
34.02
8
20.09
0.00 Significant
@ 1%
Source: Computed from the Primary Data
According to the Table 4.12, the computed value of chi square stating the
relationship between educational qualification of the respondents and their level of
awareness on retail banking services was 34.02 while the table value at 1% level of
significance for 8 degrees of freedom was 20.09 and the p value was 0.00. Since
the computed value was greater than the table value, it falls in the rejection region.

206
Hence, the null hypothesis is rejected and the alternative hypothesis is accepted.
The hypothesis that ‘educational qualification of the respondents and their level of
awareness on retail banking services are not significantly related’ does not hold
good. Thus, it is concluded that there is a significant relationship between
educational qualification of the respondents and their level of awareness on retail
banking services.
TABLE 4.13
OCCUPATION AND AWARENESS ON RETAIL BANKING SERVICES
Occupation No. of
respondents
%
Mean
Minimum
Maximum
S.D.
Agriculture 63 12.60 63.06 37 109 17.37
Business /
Profession
141
28.20
72.83
37
109
14.92
Employed 197 39.40 73.84 33 125 14.22
Others 99 19.80 70.95 35 96 13.61
Total 500 100.00 71.63 33 125 15.08
Source: Computed from the Primary Data
Table 4.13 shows that the average score of awareness of customers who
were doing agriculture was found to be 63.06 which ranged between 37 and 109
with a standard deviation of 17.37. The mean score of awareness of customers who
were doing business / profession was found to be 72.83 which ranged between 37
and 109 with a standard deviation of 14.92. It is also found that the average score
of awareness of employed customers was 73.84 which ranged between 33 and 125
with a standard deviation of 14.22 while the average score of awareness of
customers involved in other occupations was found to be 70.95 which ranged
between 35 and 96 with a standard deviation of 13.61.
It denotes that the mean score of awareness of employed customers (73.84)
was higher than the mean score of awareness of all the other customers. Similarly,

207
the maximum score of employed customers (125) was found to be greater than that
of the other customers.
TABLE 4.14
OCCUPATION AND AWARENESS ON RETAIL BANKING SERVICES –
TWO WAY TABLE
Occupation Level of Awareness
Low Medium High Total
Agriculture 29
(29.59)
29
(7.90)
5
(14.29)
63
Business / Profession 26
(26.53)
102
(27.79)
13
(37.14)
141
Employed 23
(23.47)
160
(43.60)
14
(40.00)
197
Others 20
(20.41)
76
(20.71)
3
(8.57)
99
Total 98 367 35 500
Source: Computed from the Primary Data
It could be understood from the Table 4.14 that the high level of awareness
was found to be higher among employed respondents (40.00 per cent) while the
high level of awareness was found to be lower among the respondents who were
engaged in other occupations (8.57 per cent). It is also observed from the analysis
that the medium level of awareness was greater among the employed respondents
(43.60 per cent) and it was lower among the respondents engaged in the agriculture
(7.90 per cent). The proportion of customers engaged in the agriculture having low
level of awareness was found to be 29.59 per cent while the proportion of
customers involved in any other occupation with low level of awareness was found
to be 20.41 per cent.

208
In order to understand the significance of relationship between occupation
of the respondents and their level of awareness towards retail banking services, the
following hypotheses have been framed and tested with chi square test:
Null Hypothesis H0: There is no significant relationship between occupation of the
respondents and their level of awareness towards retail banking services.
Alternative Hypothesis H1: There is a significant relationship between occupation
of the respondents and their level of awareness towards retail banking services.
TABLE 4.15
OCCUPATION AND AWARENESS ON RETAIL BANKING SERVICES –
CHI SQUARE TEST
Factor Chi square
Value
DF Table
Value
p value
Remarks
Occupation
40.43
6
16.812
0.00 Significant
@ 1%
Source: Computed from the Primary Data
According to the Table 4.15, the computed value of chi square stating the
relationship between occupation of the respondents and their level of awareness on
retail banking services was 40.43 while the table value at 1% level of significance
for 6 degrees of freedom was 16.812 and the p value was 0.00. Since the computed
value was greater than the table value, it falls in the rejection region. Hence, the
null hypothesis is rejected and the alternative hypothesis is accepted. The
hypothesis that ‘occupation of the respondents and their level of awareness on retail
banking services are not significantly related’ does not hold good. Thus, it is
concluded that there is a significant relationship between occupation of the
respondents and their level of awareness on retail banking services.

209
TABLE 4.16
MONTHLY INCOME AND AWARENESS ON RETAIL BANKING
SERVICES
Monthly
Income
No. of
respondents
%
Mean
Minimum
Maximum
S.D.
Up to Rs.
10000
225
45.00
67.48
35
98
14.26
Rs.10001 to
Rs.20000
161
32.20
74.04
37
116
13.98
Rs.20001 to
Rs.30000
86
17.20
75.47
33
125
17.36
Above
Rs.30000
28
5.60
79.25
49
103
11.15
Total 500 100.00 71.63 33 125 15.08
Source: Computed from the Primary Data
Table 4.16 shows that the average score of awareness of customers in the
income group of up to Rs.10000 was found to be 67.48 which ranged between 35
and 98 with a standard deviation of 14.26. The mean score of awareness of
customers in the income group of Rs.10001 to Rs.20000 was found to be 74.04
which ranged between 37 and 116 with a standard deviation of 13.98. It is also
found that the average score of awareness of customers in the income group of
Rs.20001 to Rs.30000 was 75.47 which ranged between 33 and 125 with a standard
deviation of 17.36 while the average score of awareness of customers in the income
group of above Rs.30000 was found to be 79.25 which ranged between 49 and 103
with a standard deviation of 11.15.
It denotes that the mean score of awareness of customers in the age group of
above 40 years (79.25) was higher than the mean score of awareness of all the other
customers. However, the maximum score of customers in the income group of
Rs.20001 to Rs.30000 (125) was found to be greater than that of the other customers.

210
TABLE 4.17
MONTHLY INCOME AND AWARENESS ON RETAIL BANKING
SERVICES – TWO WAY TABLE
Monthly Income Level of Awareness
Low Medium High Total
Up to Rs. 10000 63
(64.29)
154
(41.96)
8
(22.86)
225
Rs.10001 to Rs.20000 19
(19.39)
128
(34.88)
14
(40.00)
161
Rs.20001 to Rs.30000 14
(14.29)
61
(16.62)
11
(31.43)
86
Above Rs.30000 2
(2.04)
24
(6.54)
2
(5.71)
28
Total 98 367 35 500
Source: Computed from the Primary Data
It could be understood from the Table 4.17 that the high level of awareness
was found to be higher among respondents in the income group of Rs.10001 to
Rs.20000 (40.00 per cent) while the high level of awareness was found to be lower
among the respondents in the income group of above Rs.30000 (5.71 per cent). It
is also observed from the analysis that the medium level of awareness was greater
among the respondents in the income group of up to Rs.10000 (41.96 per cent) and
it was lower among the respondents in the income group of above Rs.30000
(6.54 per cent). The proportion of customers in the income group of up to Rs.10000
having low level of awareness was found to be 64.29 per cent while the proportion
of customers in the income group of above Rs.30000 with low level of awareness
was found to be 2.04 per cent.
In order to understand the significance of relationship between
monthly income of the respondents and their level of awareness towards retail
211
banking services, the following hypotheses have been framed and tested with chi
square test:
Null Hypothesis H0: There is no significant relationship between monthly income
of the respondents and their level of awareness towards retail banking services.
Alternative Hypothesis H1: There is a significant relationship between monthly
income of the respondents and their level of awareness towards retail banking
services.
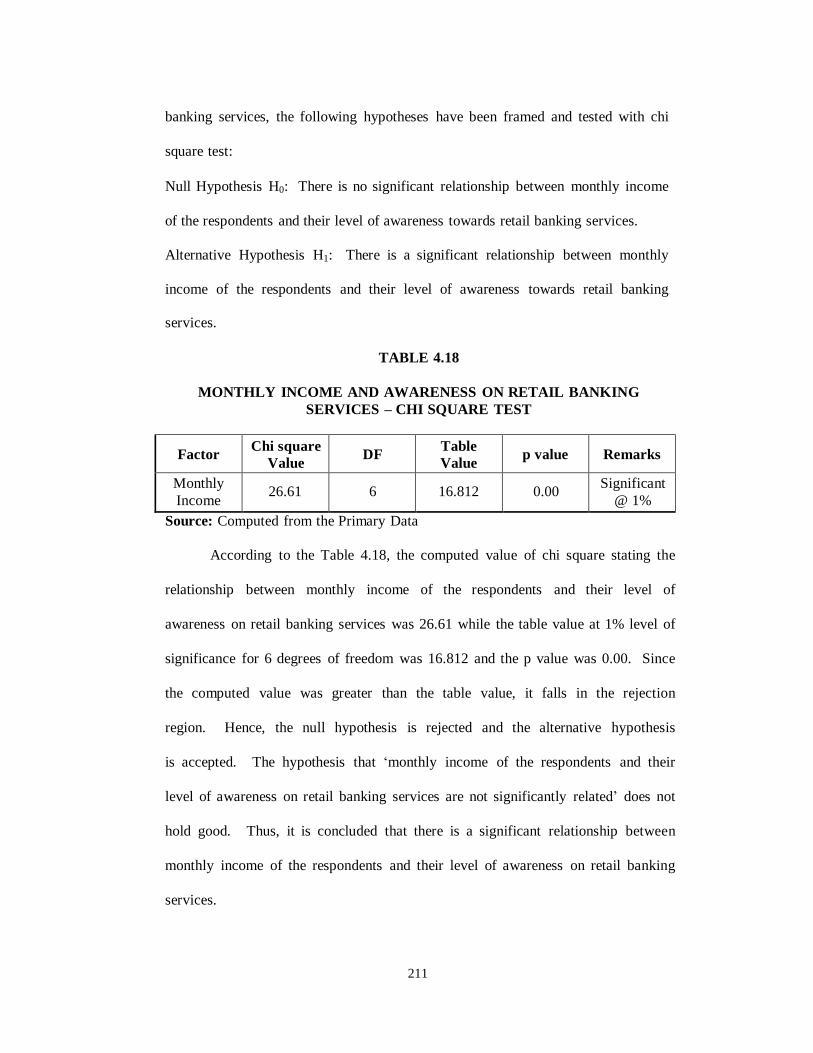
TABLE 4.18
MONTHLY INCOME AND AWARENESS ON RETAIL BANKING
SERVICES – CHI SQUARE TEST
Factor Chi square
Value
DF Table
Value
p value
Remarks
Monthly
Income
26.61
6
16.812
0.00 Significant
@ 1%
Source: Computed from the Primary Data
According to the Table 4.18, the computed value of chi square stating the
relationship between monthly income of the respondents and their level of
awareness on retail banking services was 26.61 while the table value at 1% level of
significance for 6 degrees of freedom was 16.812 and the p value was 0.00. Since
the computed value was greater than the table value, it falls in the rejection
region. Hence, the null hypothesis is rejected and the alternative hypothesis
is accepted. The hypothesis that ‘monthly income of the respondents and their
level of awareness on retail banking services are not significantly related’ does not
hold good. Thus, it is concluded that there is a significant relationship between
monthly income of the respondents and their level of awareness on retail banking
services.

212
TABLE 4.19
SIZE OF FAMILY AND AWARENESS ON RETAIL BANKING SERVICES
Size of family
No. of
respondents
%
Mean
Minimum
Maximum
S.D.
Up to 2 32 6.40 75.56 39 112 16.21
3 to 4 337 67.40 71.80 33 125 14.43
More than 4 131 26.20 70.23 35 110 16.31
Total 500 100.00 71.63 33 125 15.08
Source: Computed from the Primary Data
Table 4.19 shows that the average score of awareness of customers
in the family size of up to 2 members was found 75.56 which ranged between
39 and 112 with a standard deviation of 16.21. The mean score of awareness
of customers in the family size of 3 to 4 members was found to be 71.80 which
ranged between 33 and 125 with a standard deviation of 14.43. It is also found
that the average score of awareness of customers in the family size of more
than 4 members was 70.23 which ranged between 35 and 110 with a standard
deviation of 16.31.
It denotes that the mean score of awareness of customers in the family
size of up to 2 members (75.56) was higher than the mean score of awareness
of all the other customers. However, the maximum score of customers in the family
size of 3 to 4 members (125) was found to be greater than that of the other
customers.

213
TABLE 4.20
SIZE OF FAMILY AND AWARENESS ON RETAIL BANKING
SERVICES – TWO WAY TABLE
Size of family Level of Awareness
Low Medium High Total
Up to 2 4
(4.08)
23
(6.27)
5
(14.29)
32
3 to 4 63
(64.29)
255
(69.48)
19
(54.29)
337
More than 4 31
(31.63)
89
(24.25)
11
(31.43)
131
Total 98 367 35 500
Source: Computed from the Primary Data
It could be understood from the Table 4.20 that the high level of awareness
was found to be higher among respondents in the family size of 3 to 4 members
(54.29 per cent) while the high level of awareness was found to be lower among the
respondents in the family size of up to 2 members (14.29 per cent). It is also
observed from the analysis that the medium level of awareness was greater among
the respondents in the family size of 3 to 4 members (69.48 per cent) and it was
lower among the respondents in the family size of up to 2 members (6.27 per cent).
The proportion of customers in the family size of 3 to 4 members having low level
of awareness was found to be 64.29 per cent while the proportion of customers in
the family size of up to 2 members with low level of awareness was found to be
4.08 per cent.
In order to understand the significance of relationship between size of
family of the respondents and their level of awareness towards retail banking
services, the following hypotheses have been framed and tested with chi square test:
Null Hypothesis H0: There is no significant relationship between size of family of
the respondents and their level of awareness towards retail banking services.

214
Alternative Hypothesis H1: There is a significant relationship between size of
family of the respondents and their level of awareness towards retail banking
services.
TABLE 4.21
SIZE OF FAMILY AND AWARENESS ON RETAIL BANKING SERVICES
– CHI SQUARE TEST
Factor Chi square
Value
DF Table
Value
p value
Remarks
Size of
family
7.51
4
13.277
0.11 Not
Significant
Source: Computed from the Primary Data
According to the Table 4.21, the computed value of chi square stating the
relationship between size of family of the respondents and their level of awareness
on retail banking services was 7.51 while the table value at 5% level of significance
for 4 degrees of freedom was 13.277 and the p value was 0.11. Since the computed
value was lesser than the table value, it falls in the acceptance region. Hence, the
null hypothesis is accepted and the alternative hypothesis is rejected. The
hypothesis that ‘size of family of the respondents and their level of awareness on
retail banking services are not significantly related’ holds good. Thus, it is
concluded that there is no significant relationship between size of family of the
respondents and their level of awareness on retail banking services.

215
TABLE 4.22
OWNERSHIP PATTERN OF THE BANK AND AWARENESS ON RETAIL
BANKING SERVICES
Ownership
pattern
of the bank
No. of
respondents
%
Mean
Minimum
Maximum
S.D.
Nationalized
bank
368
73.60
70.20
33
125
14.80
Private
sector bank
127
25.40
74.93
35
116
14.99
Others 5 1.00 92.40 79 107 11.67
Total 500 100.00 71.63 33 125 15.08
Source: Computed from the Primary Data
Table 4.22 shows that the average score of awareness of nationalized bank
customers was found to be 70.20 which ranged between 33 and 125 with a standard
deviation of 14.80. The mean score of awareness of private sector bank customers
was found to be 74.93 which ranged between 35 and 116 with a standard deviation
of 14.99. It is also found that the average score of awareness of other
bank customers was 92.40 which ranged between 79 and 107 with a standard
deviation of 11.67.
It denotes that the mean score of awareness of customers of other banks
(92.40) was higher than the mean score of awareness of all the other customers.
However, the maximum score of nationalized bank customers (125) was found to
be greater than that of the other customers.

216
TABLE 4.23
OWNERSHIP PATTERN OF THE BANK AND AWARENESS ON RETAIL
BANKING SERVICES – TWO WAY TABLE
Ownership pattern of the bank Level of Awareness
Low Medium High Total
Nationalized bank 78
(79.59)
272
(74.11)
18
(51.43)
368
Private sector bank 20
(20.41)
93
(25.34)
14
(40.00)
127
Others 0
(0.00)
2
(0.54)
3
(8.57)
5
Total 98 367 35 500
Source: Computed from the Primary Data
It could be understood from the Table 4.23 that the high level of awareness
was found to be higher among nationalized bank customers (51.43 per cent) while
the high level of awareness was found to be lower among the customers of other
banks (8.57 per cent). It is also observed from the analysis that the medium level
of awareness was greater among the nationalized bank customers (74.11 per cent)
and it was lower among the customers of other banks (0.54 per cent). The
proportion of nationalized bank customers having low level of awareness was found
to be 79.59 per cent while the proportion of private sector bank customers with low
level of awareness was found to be 20.41 per cent.
In order to understand the significance of relationship between ownership
pattern of the banks of the respondents and their level of awareness towards retail
banking services, the following hypotheses have been framed and tested with chi
square test:

217
Null Hypothesis H0: There is no significant relationship between ownership pattern
of the banks of the respondents and their level of awareness towards retail banking
services.
Alternative Hypothesis H1: There is a significant relationship between ownership
pattern of the banks of the respondents and their level of awareness towards retail
banking services.
TABLE 4.24
OWNERSHIP PATTERN OF THE BANK AND AWARENESS ON RETAIL
BANKING SERVICES – CHI SQUARE TEST
Factor Chi square
Value
DF Table
Value
p value
Remarks
Ownership pattern
of the bank
28.53
4
13.277
0.00 Significant
@ 1%
Source: Computed from the Primary Data
According to the Table 4.24, the computed value of chi square stating the
relationship between ownership pattern of the bank of the respondents and their
level of awareness on retail banking services was 28.53 while the table value at 1%
level of significance for 4 degrees of freedom was 13.277 and the p value was 0.00.
Since the computed value was greater than the table value, it falls in the rejection
region. Hence, the null hypothesis is rejected and the alternative hypothesis is
accepted. The hypothesis that ‘ownership pattern of the bank of the respondents
and their level of awareness on retail banking services are not significantly related’
does not hold good. Thus, it is concluded that there is a significant relationship
between ownership pattern of the bank of the respondents and their level of
awareness on retail banking services.

218
TABLE 4.25
PERIOD OF CUSTOMERSHIP AND AWARENESS ON RETAIL
BANKING SERVICES
Period of
customer ship
No. of
respondents
%
Mean
Minimum
Maximum
S.D.
Less than 5
years
279
55.80
70.00
35
112
12.83
5 to 10 years 192 38.40 73.48 33 125 16.98
More than 10
years
29
5.80
75.00
43
110
19.77
Total 500 100.00 71.63 33 125 15.08
Source: Computed from the Primary Data
Table 4.25 shows that the average score of awareness of customers in the
period of customership of less than 5 years was found to be 70.00 which ranged
between 35 and 112 with a standard deviation of 12.83. The mean score of
awareness of customers in the period of customership of 5 to 10 years was found to
be 73.48 which ranged between 33 and 125 with a standard deviation of 16.98. It is
also found that the average score of awareness of customers in the period of
customership of more than 10 years was 75.00 which ranged between 43 and 110
with a standard deviation of 19.77.
It denotes that the mean score of awareness of customers in the period of
customership of more than 10 years (75.00) was higher than the mean score of
awareness of all the other customers. However, the maximum score of customers
in the period of customership of 5 to 10 years (125) was found to be greater than
that of the other customers.

219
TABLE 4.26
PERIOD OF CUSTOMERSHIP AND AWARENESS ON RETAIL
BANKING SERVICES – TWO WAY TABLE
Period of customership Level of Awareness
Low Medium High Total
Less than 5 years 54
(55.10)
218
(59.40)
7
(20.00)
279
5 to 10 years 35
(35.71)
136
(37.06)
21
(60.00)
192
More than 10 years 9
(9.18)
13
(3.54)
7
(20.00)
29
Total 98 367 35 500
Source: Computed from the Primary Data
It could be understood from the Table 4.26 that the high level of awareness
was found to be higher among bank customers for 5 to 10 years (60.00 per cent)
while the high level of awareness was found to be lower among the bank customers
for less than 5 years (20.00 per cent). It is also observed from the analysis that the
medium level of awareness was greater among the bank customers for less than 5
years (59.40 per cent) and it was lower among the bank customers for more than 10
years (3.54 per cent). The proportion of bank customers for less than 5 years
having low level of awareness was found to be 55.10 per cent while the proportion
of bank customers for more than 10 years with low level of awareness was found to
be 9.18 per cent.
In order to understand the significance of relationship between period of
customership of the respondents and their level of awareness towards retail banking
services, the following hypotheses have been framed and tested with chi square test:

220
Null Hypothesis H0: There is no significant relationship between period of
customership of the respondents and their level of awareness towards retail banking
services.
Alternative Hypothesis H1: There is a significant relationship between period of
customership of the respondents and their level of awareness towards retail banking
services.
TABLE 4.27
PERIOD OF CUSTOMERSHIP AND AWARENESS ON RETAIL
BANKING SERVICES – CHI SQUARE TEST
Factor Chi square
Value
DF Table
Value
p
value
Remarks
Period of
customership
30.84
4
13.277
0.00 Significant @
1%
Source: Computed from the Primary Data
According to the Table 4.27, the computed value of chi square stating the
relationship between period of customership of the respondents and their level of
awareness on retail banking services was 30.84 while the table value at 1% level of
significance for 4 degrees of freedom was 13.277 and the p value was 0.00. Since
the computed value was greater than the table value, it falls in the rejection region.
Hence, the null hypothesis is rejected and the alternative hypothesis is accepted.
The hypothesis that ‘period of customership of the respondents and their level of
awareness on retail banking services are not significantly related’ does not hold
good. Thus, it is concluded that there is a significant relationship between period of
customership of the respondents and their level of awareness on retail banking
services.

221
TABLE 4.28
FREQUENCY OF OPERATIONS AND AWARENESS ON RETAIL
BANKING SERVICES
Frequency of
operations
No. of
respondents
%
Mean
Minimum
Maximum
S.D.
Daily 15 3.00 89.33 66 110 15.45
Frequently 95 19.00 74.35 48 109 12.56
Rarely 113 22.60 70.53 39 103 15.83
As and when
needed
266
53.20
69.73
33
125
14.77
Others 11 2.20 81.18 50 100 13.82
Total 500 100.00 71.63 33 125 15.08
Source: Computed from the Primary Data
Table 4.28 shows that the average score of awareness of daily using
customers was found to be 89.33 which ranged between 66 and 110 with a standard
deviation of 15.45. The mean score of awareness of frequently using customers
was found to be 74.35 which ranged between 48 and 109 with a standard deviation
of 12.56. It is also found that the average score of awareness of rarely using
customers was 70.53 which ranged between 39 and 103 with a standard deviation of
15.83 while the average score of awareness of customers using retail banking
services as and when needed was found to be 69.73 which ranged between 33 and
125 with a standard deviation of 14.77. The average score of awareness of other
customers was found to be 81.18 with a minimum of 50 and a maximum score of
100 while the standard deviation was 13.82.
It denotes that the mean score of awareness of daily using customers (89.33)
was higher than the mean score of awareness of all the other customers. However,
the maximum score of customers using retail banking services as and when needed
(125) was found to be greater than that of the other customers.

222
TABLE 4.29
FREQUENCY OF OPERATIONS AND AWARENESS ON RETAIL
BANKING SERVICES – TWO WAY TABLE
Frequency of
operations
Level of Awareness
Low Medium High Total
Daily 0
(0.00)
7
(1.91)
8
(22.86)
15
Frequently 14
(14.29)
75
(20.44)
6
(17.14)
95
Rarely 26
(26.53)
75
(20.44)
12
(34.29)
113
As and when
needed
57
(58.16)
201
(54.77)
8
(22.86)
266
Others 1
(1.02)
9
(2.45)
1
(2.86)
11
Total 98 367 35 500
Source: Computed from the Primary Data
It could be understood from the Table 4.29 that the high level of awareness
was found to be higher among rarely using customers (34.29 per cent) while the
high level of awareness was found to be lower among the other customers
(2.86 per cent). It is also observed from the analysis that the medium level of
awareness was greater among the bank customers using retail banking services as
and when needed (54.77 per cent) and it was lower among the customers using the
retail banking services daily (1.91 per cent). The proportion of bank customers
using the retail banking services as and when needed having low level of awareness
was found to be 58.16 per cent while the proportion of other customers with low
level of awareness was found to be 1.02 per cent.
In order to understand the significance of association between frequency of
operations of the respondents and their level of awareness towards retail banking
services, the following hypotheses have been framed and tested with chi square test:

223
Null Hypothesis H0: There is no significant association between frequency of
operations of the respondents and their level of awareness towards retail banking
services.
Alternative Hypothesis H1: There is a significant association between frequency of
operations of the respondents and their level of awareness towards retail banking
services.
TABLE 4.30
FREQUENCY OF OPERATIONS AND AWARENESS ON RETAIL
BANKING SERVICES – CHI SQUARE TEST
Factor Chi square
Value
DF Table
Value
p value
Remarks
Frequency of
Operations
63.03
8
20.09
0.00 Significant
@ 1%
Source: Computed from the Primary Data
According to the Table 4.30, the computed value of chi square stating the
association between frequency of operations of the respondents and their level of
awareness on retail banking services was 63.03 while the table value at 1% level of
significance for 8 degrees of freedom was 20.09 and the p value was 0.00. Since
the computed value was greater than the table value, it falls in the rejection region.
Hence, the null hypothesis is rejected and the alternative hypothesis is accepted.
The hypothesis that ‘frequency of operations of the respondents and their level of
awareness on retail banking services are not significantly related’ does not hold
good. Thus, it is concluded that there is a significant association between frequency
of operations of the respondents and their level of awareness on retail banking
services.