chapter iii research method research designeprints.walisongo.ac.id/1644/4/093411059_bab3.pdf ·...
TRANSCRIPT

35
CHAPTER III
RESEARCH METHOD
A. Research Design
A research is an activity which analyses and critically
evaluates some problems. David Nunan said that a research is a
process which involves defining a problem, stating an objective, and
formulating an hypothesis. It involves gathering information,
classification, analysis, and interpretation to see to what extent the
initial objective has been achieved.1
Before doing research, first step which we must do is
determining a research design. A research design offers the researcher
a framework, some key concepts and ideas. Obviously, the research
design which the researcher selects is going to affect the overall
character of the research. The research design is often so persuasive
that it will start to determine what to look at, how to collect data, and
how to analyze it.
In this research, the approach used by the researcher was
quantitative approach. Quantitative approach stressed the analysis to
the numerical data that is processed by statistical method.2 It is
quantitative because the data will be gained are numeric and will be
1 David Nunan, Research Methods in Language Learning, (New
York: Cambridge University Press, 1992), p.2.
2 Burham Bungin, Metode Penelitian Kuantitatif : Komunikasi,
Ekonomi, Kebijakan Publik Serta Ilmu-Ilmu Sosial Lainnya, (Jakarta:
Kencana, 2010), p. 120.

36
analzed by using statistical computation. The method in this research
was experimental research. An experimental method is an approach to
educational research in which an idea or hypothesis is tested or
verified by setting up situation in which relationship between
participants or variables can be determined.3 According to Brown as
quoted by David Nunan, “an experimental research should exhibit
several key characteristics. It should be systematic, logical, tangible,
replicable, and reductive”.4
There were two groups in this method, they were
experimental group (X) and control group (Y). Both groups were
given a pretest and a posttest. Pre-test was given to both groups before
they are given treatment by the researcher. Post-test was given to both
groups after they was given treatment by the researcher. In this
research, new treatment was given to the students of experimental
group..They are taught using The Little Mermaid film. Meanwhile,
students of control groups were not taught simple past tense using The
Little Mermaid film.
The researcher used pre test-post test control group design.
Two groups were employed in this design. The pretest-posttest control
group design could be diagrammed as shown below: 5
3Jack C. Richard and Richard Schmidt, Longman Dictionary of
Language Teaching and Applied Linguistics, (London: Pearson Education
Limited, 2002), p. 191.
4David Nunan, Research Methods in Language Learning,p.9.
5Suharsimi Arikunto,Prosedur Penelitian Suatu Pendekatan Praktik,
Revised Edition, Vol. 14, (Jakarta; PT. Rineka Cipta, 2010), p.125.

37
E O1 X O2
C O3 Y O4
While:
E : Experimental group
C : Control group
O1 : Pre-test for the experimental group
O2 : Post-test for the experimental group
O3 : Pre-test for the control group
O4 : Post-test for the control group
X : Treatment with “The Little Mermaid” film as an aid
Y : Treatment without the film as an aid 6
From the design above, subjects of research were grouped into
an experimental group (top line) and a control group (bottom line).
The quality of subjects was first checked by pre-testing them (01 and
03). The test was held in the form of composition. Firstly, the test was
done in both groups, experimental and control group. Secondly, the
result of the test was scored by using analytic scale. Thirdly, the
means score of the two groups were determined. Finally, the two
means were compared by applying t-test formula. T-test was used to
differentiate if the students‟ result of grammar test by using film and
without using film was significant or not.
If the obtained score was higher than t-table score by using
5% alpha of significance, Ho was rejected. It means that Ha was
6Ibnu Hadjar., Dasar-dasar Metodologi Penelitian Kuantitatif
Dalam Pendidikan, (Jakarta: PT. Raja Grafindo Perasada, 1996), p.336

38
accepted if there was a significant difference in simple past tense
achievement between the experimental and control group.
1. Source of Data
a. Setting
The research was conducted in SMP N 23 Semarang.
It was located at street RM Hadi Subeno, Mijen, Semarang.
The subjects of this research was the eighth grade students of
SMPN 23 Semarang in academic year of 2012/2013. This
research was in the second semester. The researcher has done
the research on 24th March 2013 - 18
th April 2013 and the
description could be seen in the table below :
Table 3.1
Procedure and Timeline of Research
No Activity
Month/Date
March April
24th 26
th 27
th 28
th 30
th 11
th 13
th 18
th
1. Try-Out class √
2. Experimental
class
a. Pre-Test √
b. Treatment I √
c. Treatment II √
d. Post test √
3. Control class
a. Pre-Test √
b. Explaining I √
c. Explaining II
√
d. Post test √
39
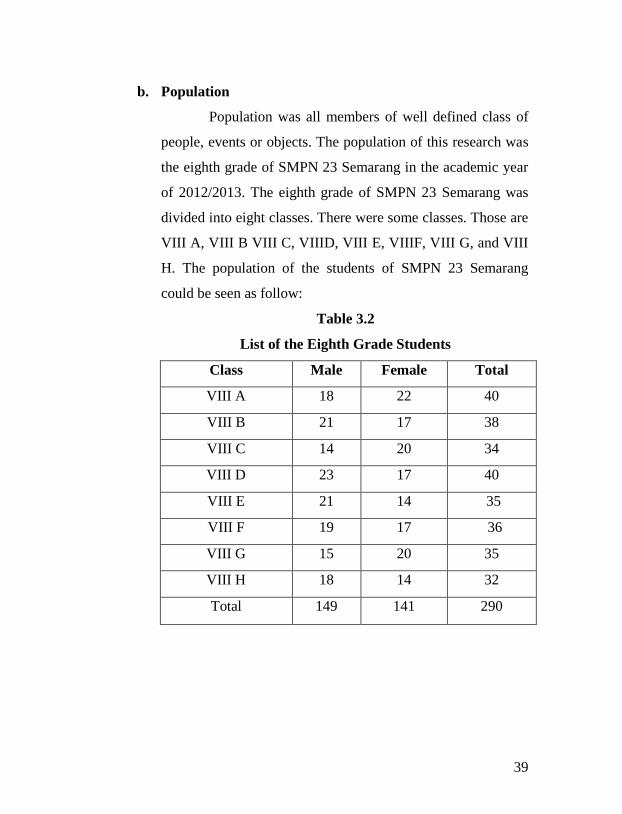
b. Population
Population was all members of well defined class of
people, events or objects. The population of this research was
the eighth grade of SMPN 23 Semarang in the academic year
of 2012/2013. The eighth grade of SMPN 23 Semarang was
divided into eight classes. There were some classes. Those are
VIII A, VIII B VIII C, VIIID, VIII E, VIIIF, VIII G, and VIII
H. The population of the students of SMPN 23 Semarang
could be seen as follow:
Table 3.2
List of the Eighth Grade Students
Class Male Female Total
VIII A 18 22 40
VIII B 21 17 38
VIII C 14 20 34
VIII D 23 17 40
VIII E 21 14 35
VIII F 19 17 36
VIII G 15 20 35
VIII H 18 14 32
Total 149 141 290

40
c. Sample and Sampling Techique
Arikunto said, “sample is a representative of
population which is studied. It is subject of population”.7 She
also said that sampel can be taken between 10% - 15% - 25%
if the number of population is more than 100.8 It is called
sample research when we want to generalize the sample
research result. David Nunan also said, “sample is a subset of
individuals from a given population”.9
The researcher selected two groups of students from
the population as sample of research. In this study, there are
two classes as sample. The process of selection used cluster
random sampling technique. It was a technique to choose a
sample by spoiling each class (population) and it was based
on lottery. Finallly, the researcher choosed VIII G as the
experimental class that consists of 35 students and VIII F as
the control class that consists of 36 students.
7Suharsimi Arikunto,Prosedur Penelitian Suatu Pendekatan Praktik,
Revised Edition, p.130.
8Suharsimi Arikunto,Prosedur Penelitian Suatu Pendekatan Praktik,
Revised Edition, p.125.
9David Nunan, Research Methods in Language Learning, p.27.

41
2. Variable
Variable is the object of research or something that
became the concern of research.10
Fred D. Kerlinger as cited by
Arikunto said, “variable is all experiments have one fundamental
idea behind them; to test the effect of one or more independent
variables on a dependent variable (it is possible to have more than
one dependent variable in experiments)”.11
In this study, there were two variables, those variables
were;
a. The independent variable (X)
Independent variable is variable that the experimenter
expects to influence the other.12
The independent variable in
this research was the use of „The Little Mermaid‟ film as a
medium in teaching simple past tense. The experimental
group taught simple past tense using the film while the control
group taught simple past tense without the film.
The indicators were as follow:
1) Understand simple past tense well.
2) Identify the verbs in simple past tense.
3) Make sentences with the verbs in simple past tense.
10
Ibnu Hadjar.Dasar-dasar Metodologi Penelitian Kuantitatif Dalam
Pendidikan, p. 51.
11Suharsimi Arikunto, Prosedur Penelitian Suatu Pendekatan
Praktik, p. 162.
12 David Nunan, Research Methods in Language Learning, p.25.
42
b. The dependent variable (Y)
Dependent variable is variable upon which the
independent variable is acting.13
Sugiyono said,“dependent
variable is variable that is affected resulting, because of the
existence of independent variable”.14
Based on the definition
above, the dependent variable in this study was the students‟
score understanding of grammar test about the material of
simple past tense.
The indicators were as follow:
1) Identify the use of simple past tense.
2) Identify the pattern of simple past tense.
3) Make sentences based on the pattern of simple past tense
well.
3. Data Collection Technique
The researcher must use instrument to get the better data.
The instrument of the research is a tool or facility that is used by
researcher for collecting data in order to get better result. To get
the accurate data, in this study the researcher choose some
instruments for collecting the data, they were:
a. Test
In this research, the researcher used test to collect
data. Brown states, “test is as a method which is used to
13
David Nunan, Research Methods in Language Learning, p.25.
14Sugiyono, Statistik Untuk Penelitian, (Bandung: CV. Alfabeta,
2008), Vol. 3, p. 4.

43
measure competence, knowledge, intelligence, and ability of
talent which is possessed by individual or group to collect
data”.15
Test is an examination or trial to find its quality,
value, composition, etc.16
The test was used to collect the
students‟ writing that must be analyzed to identify the
students‟ understanding on simple past tense. The form of test
in this study was objective test. Objective test was a test
which is organized where in each question the writer prepares
an alternatif answer. 17
Objective test was frequently criticized
on the grounds that they are simpler to answer than subjective
test. Objective tests wee divided into transformation,
completion, combination, addition, rearrangement, matching,
correct and incorrect (true/false) and multiple choice.18
The
researcher used two test types of the objective test, they were
multiple-choice and completion test.
15
H. Douglas Brown, Language Assessment: Principles and
Classroom Practices, (San Fransisco: Longman, 2004), p. 3.
16Suharsimi Arikunto, Prosedur Penelitian Suatu Pendekatan
Praktik , Edisi Revisi, p.266.
17Nurul Zuriah, Metodologi Penelitian Sosial dan Pendidikan,
(Jakarta: PT Bumi Aksara, 2006), p. 184.
18Ngalim Purwanto, Prinsip - Prinsip dan Teknik Pengajaran,
(Bandung: PT. Remaja Rosda Karya, 2002), 11th
Ed., p. 35-36.

44
The researcher used multiple choice forms. The
choice of the test type is based on the consideration that
multiple choice test are:19
1) The technique of scoring is easy.
2) It was impossible for students to avoid the grammar point
being evaluated.
3) This is sensitive measure of achievement multiple-choice
language test; it allows teachers to diagnose the students‟
problems.
In this research, the researcher used pre test and post
test, they are follows:
1) Pre-test
Before the teacher taught new material by using
film, the teacher gave pre test to the students. Pre- test
was given to the experimental class and the control class
before the treatments was run.
2) Post-test
Post-test was held after all treatments were
conducted. Post-test was given to the experimental class
and control class after received treatments. Post test was
used for measuring the improvement of students‟
understanding on simple past tense after being taught by
using film in experimental class, and without using film
19
H. Douglas Brown, Language Assessment: Principles and
Classroom Practices, p. 43.
45
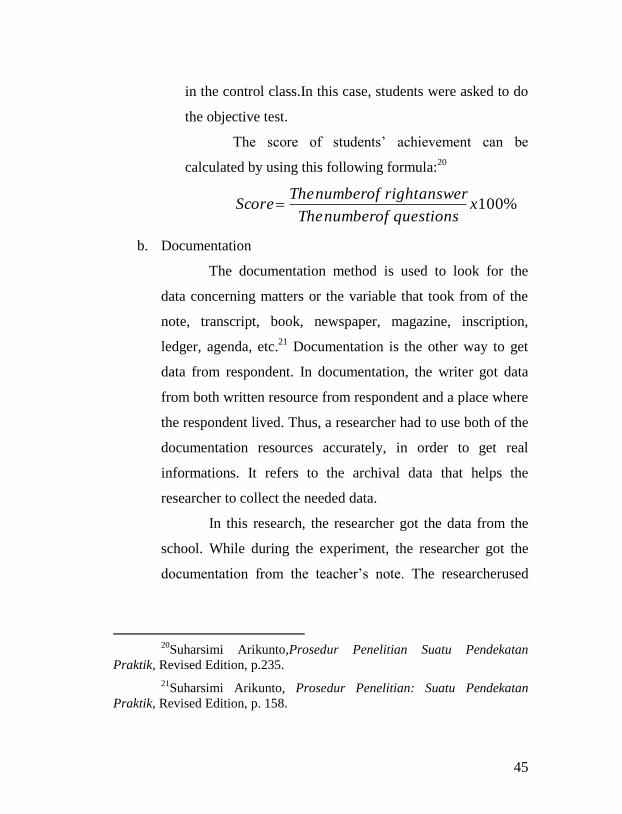
in the control class.In this case, students were asked to do
the objective test.
The score of students‟ achievement can be
calculated by using this following formula:20
%100xquestionsofnumberThe
answerrightofnumberTheScore
b. Documentation
The documentation method is used to look for the
data concerning matters or the variable that took from of the
note, transcript, book, newspaper, magazine, inscription,
ledger, agenda, etc.21
Documentation is the other way to get
data from respondent. In documentation, the writer got data
from both written resource from respondent and a place where
the respondent lived. Thus, a researcher had to use both of the
documentation resources accurately, in order to get real
informations. It refers to the archival data that helps the
researcher to collect the needed data.
In this research, the researcher got the data from the
school. While during the experiment, the researcher got the
documentation from the teacher‟s note. The researcherused
20
Suharsimi Arikunto,Prosedur Penelitian Suatu Pendekatan
Praktik, Revised Edition, p.235.
21Suharsimi Arikunto, Prosedur Penelitian: Suatu Pendekatan
Praktik, Revised Edition, p. 158.

46
the document related to the object research such as students
name list and the English subject schedule.
The researcher got the syllabus, lesson plan of
teaching and learning process, report of students‟
development, teachers‟ name list, and sketch of SMPN
23Semarang in the academic year of 2012/ 2013. The
documentation is used to know data of the students and
teachers in the school. To get the result of documentation
easily and systematically, the data was gained by the help of
English teacher and administration officers.
4. Data Analysis Technique
a. Try Out-Test
A try out test is the result will be used to make sure
that the measuring instrument has such characteristics as
validity and reliability of instrument test. The instrument to be
tried out is the composition test. The result of test will be used
to find out the validity and reliability, difficulty level and also
the discrimination power of each item.22
1) Validity
The validity is an important quality of any test. It
is a condition in which a test can measure what is
supposed to be measured.Validity is concerned with the
extent to which descriptions of events accurately capture
22
Suharsimi Arikunto,Prosedur Penelitian Suatu Pendekatan Praktik
Revised Edition, p.167.
47
these events23
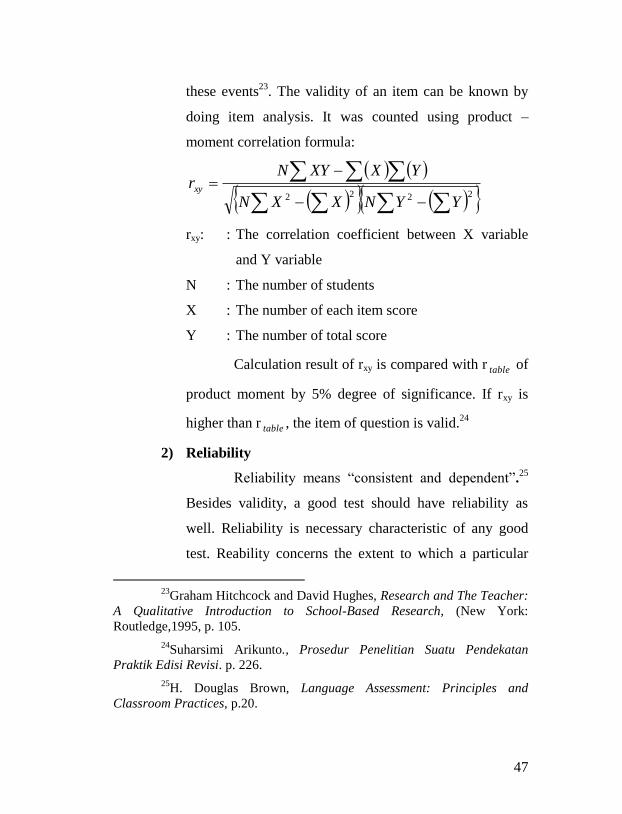
. The validity of an item can be known by
doing item analysis. It was counted using product –
moment correlation formula:
2222 YYNXXN
YXXYNrxy
rxy: : The correlation coefficient between X variable
and Y variable
N : The number of students
X : The number of each item score
Y : The number of total score
Calculation result of rxy is compared with r table of
product moment by 5% degree of significance. If rxy is
higher than r table , the item of question is valid.24
2) Reliability
Reliability means “consistent and dependent”.25
Besides validity, a good test should have reliability as
well. Reliability is necessary characteristic of any good
test. Reability concerns the extent to which a particular
23
Graham Hitchcock and David Hughes, Research and The Teacher:
A Qualitative Introduction to School-Based Research, (New York:
Routledge,1995, p. 105.
24Suharsimi Arikunto., Prosedur Penelitian Suatu Pendekatan
Praktik Edisi Revisi. p. 226.
25H. Douglas Brown, Language Assessment: Principles and
Classroom Practices, p.20.
48
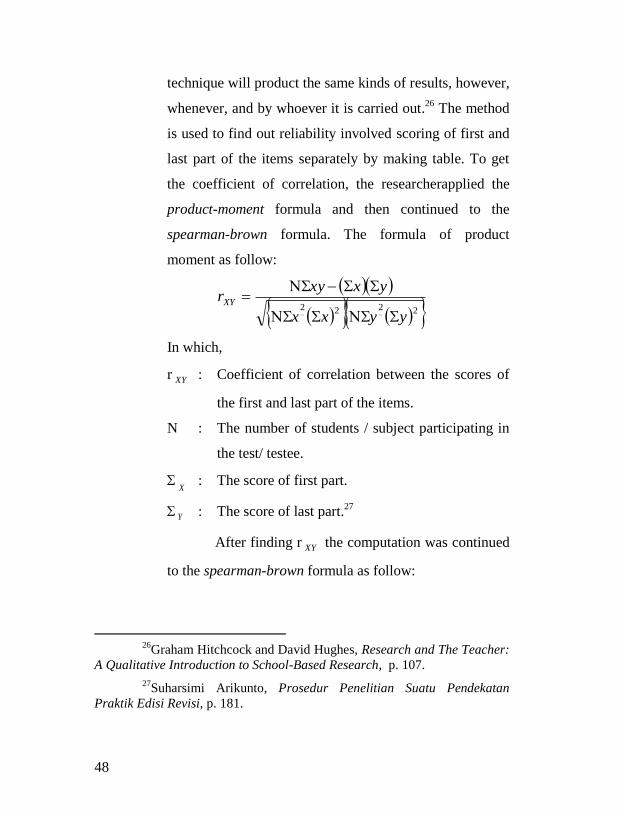
technique will product the same kinds of results, however,
whenever, and by whoever it is carried out.26
The method
is used to find out reliability involved scoring of first and
last part of the items separately by making table. To get
the coefficient of correlation, the researcherapplied the
product-moment formula and then continued to the
spearman-brown formula. The formula of product
moment as follow:
2222
yyxx
yxxyrXY
In which,
r XY : Coefficient of correlation between the scores of
the first and last part of the items.
N : The number of students / subject participating in
the test/ testee.
X
: The score of first part.
Y : The score of last part.27
After finding r XY the computation was continued
to the spearman-brown formula as follow:
26
Graham Hitchcock and David Hughes, Research and The Teacher:
A Qualitative Introduction to School-Based Research, p. 107.
27Suharsimi Arikunto, Prosedur Penelitian Suatu Pendekatan
Praktik Edisi Revisi, p. 181.

49
xy
xy
r
rr
1
211
In which,
11r
: The reliability of the instrument.
xyr : Coefficient of the correlation between the first
and last part.28
Calculation result of r 11 is compared with r table
of product moment by 5% degree of significance. If r 11 is
higher than r table , the item of question is reliable.
3) Degree of Test Difficulty
A good question is a question that is not really
difficult and not really easy. Formula for degree of test
difficulty is:29
N
RFV
In which,
FV : The index of difficulty.
R : Number of students who answered the item
correctly.
28
Suharsimi Arikunto, Prosedur Penelitian Suatu Pendekatan
Praktik Revised Edition, p.180.
29Ngalim Purwanto, Prinsip-Prinsip dan Teknik Pengajaran,
(Bandung: PT. Remaja Rosda Karya, 2002), 11th
Ed. p.119.

50
N : Number of students.30
The level of difficulty of each item was
determined by using this following categorization:
FV < 0.00 : very difficult.
0.01 - 0.30 : difficult.
0.31 - 0.70 : medium.
0.71 - 1.0 : easy.
FV > 1.0 : very easy.31
4) Discriminating Power
The discriminating power is a measure of the
effectiveness of a whole test. It is used to know how
accurate the question differ higher subject and lower
subject.32
The formula for discriminating power is Split
Half:
N
LCorrectUCorrectD
In which,
D : The discrimination index.
U : The number of the students in the upper group
who answered item correctly.
30
Harold S. Madson,Technique in Testing, (USA: Oxford University
Press. Inc., 1983) p. 181.
31Suharsimi Arikunto, Dasar-Dasar Evaluasi Pendidikan, Revised
Ed., (Jakarta: Bumi Aksara, 2002), Vol. 3, p. 207.
32Ngalim Purwanto, Prinsip-prinsip dan Teknik Pengajaran, p.120.

51
L : The number of the students in the lower group
who answered item correctly.
N : The number of the students who answered
correctly in one group.
The criteria of discriminating power as follow:
D 0.00 : Very Poor.
0.01 - 0.20 : Poor.
0.21 - 0.40 : Medium.
0.41 - 0.70 : Good.
0.71 - 1.00 : Excellent.33
b. Pre-Test
Pre-test was given before the treatments. The
researcher determined the statistic analysis technique whether
groups that have normal distribution. If the data have normal
and homogeneity distribution, the treatment and teaching can
be conducted to both classes.
1) Normality Test
It is used to know the normality of the data that is
going to be analyzed whether groups that have normal
distribution or not. The normality test with Chi-square
was done to find out the distribution data.
Step by step Chi-square test is as follows:
33
Harold S. Madson, Technique in Testing, p.183.

52
a) Determine the range (R); the largest data reduced the
smallest.
b) Determine many interval classes (K) with formula:
K = 1+ (3, 3) log n
c) Determine the length of the class, using the formula:
P = classofnumber
range
d) Make a frequency distribution table.
e) Determines the class boundaries (bc) of each class
interval.
f) Calculating the average Xi ( X ), with the formula:
X =
i
ii
f
xf
g) Calculate variants, with the formula:
1
)( 2
n
xxfS
ii
h) Calculate the value of Z, with the formula:
Z = s
xx
x = limit class
x = Average
S = Standard of Deviation
i) Define the wide area of each interval
j) Calculate the frequency expository (Ei), with formula:
53
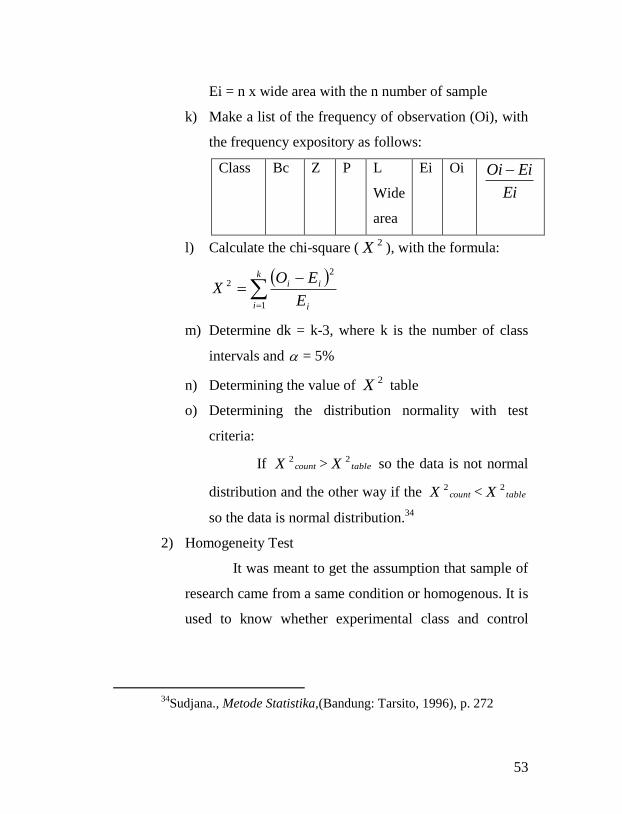
Ei = n x wide area with the n number of sample
k) Make a list of the frequency of observation (Oi), with
the frequency expository as follows:
Class Bc Z P L
Wide
area
Ei Oi
Ei
EiOi
l) Calculate the chi-square (2X ), with the formula:
k
i i
ii
E
EOX
1
2
2
m) Determine dk = k-3, where k is the number of class
intervals and = 5%
n) Determining the value of 2X table
o) Determining the distribution normality with test
criteria:
If countX 2 > tableX 2 so the data is not normal
distribution and the other way if the countX 2 < tableX 2
so the data is normal distribution.34
2) Homogeneity Test
It was meant to get the assumption that sample of
research came from a same condition or homogenous. It is
used to know whether experimental class and control
34
Sudjana., Metode Statistika,(Bandung: Tarsito, 1996), p. 272
54
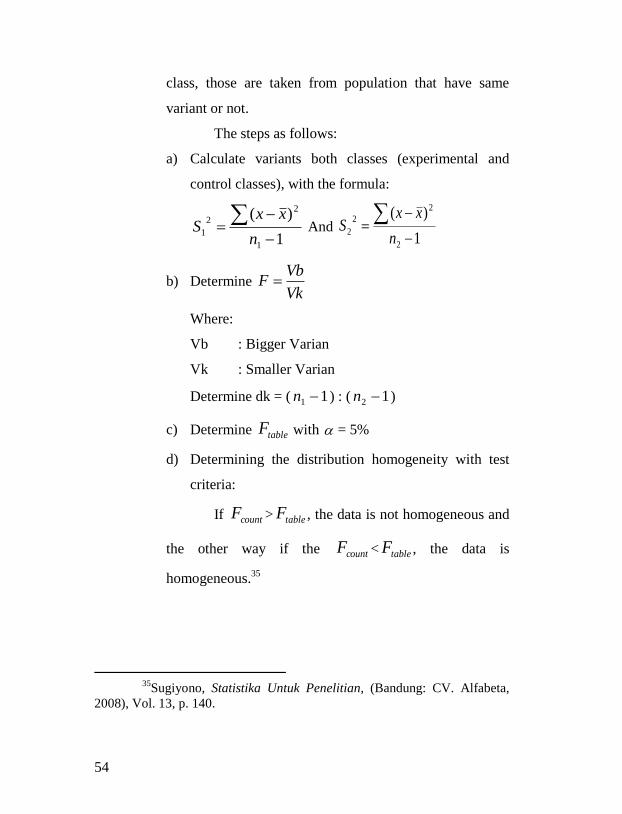
class, those are taken from population that have same
variant or not.
The steps as follows:
a) Calculate variants both classes (experimental and
control classes), with the formula:
1
)(
1
2
2
1
n
xxS And
1
)(
2
2
2
2
n
xxS
b) Determine Vk
VbF
Where:
Vb : Bigger Varian
Vk : Smaller Varian
Determine dk = ( 11 n ) : ( 12 n )
c) Determine tableF with = 5%
d) Determining the distribution homogeneity with test
criteria:
If countF > tableF , the data is not homogeneous and
the other way if the countF < tableF , the data is
homogeneous.35
35
Sugiyono, Statistika Untuk Penelitian, (Bandung: CV. Alfabeta,
2008), Vol. 13, p. 140.

55
3) Test of the Average
It is used to examine average whether
experimental group and control group have been decided
having different average. 36
T-test is used to analyze the data of this research.
A t-test would be the measure and you would use to
compare the mean scores of the two groups.37
If 12 = 2
2 (has same variant), the formula is:
21
21
11
nnS
XXt
With
2
)1()1(
21
2
22
2
11
nn
SnSnS
Where:
1X : The mean score of the experimental group
2X : The mean of the control group
n1 : The number of experimental group
n2 : The number of control group
36
Anas Sudjono, Pengantar Statistik Pendidikan, (Jakarta: PT. Raja
Grafindo Persada, 1995) 6th
Ed., p. 326-327.
37H. Douglas Brown, Language Assessment: Principles and
Classroom Practices, p. 205.

56
S12 : The standard of deviation of experimental
group
S22 : The standard of deviation of both groups
If : 122
2 (has no same variant) the formula is:
2
2
1
1
2
1
21
n
S
n
S
XXt
The hypotheses are:
Ho = 1 = 2
Ha = 1 2
1 : average data of experimental group
2 : average data of control group
If countt> tablet
so Ho is rejected and there is no
difference of average value from both of groups.
Moreover, the other way if the countt< tablet
so Ho is
accepted and there is significant difference of average
value from both of groups.38
c. Post-Test
Post-test was held after all treatments were conducted.
This test was used to measure students‟ achievement after
they were given treatments. The result of test was analyzed
statistically.
38
Anas Sudijono, Pengantar Statistik Pendidikan, ,p.272-273.

57
1) Normality Test
Steps normality second step is the same as the normality
test on the initial data.
2) Homogeneity Test
Steps homogeneity second step is the same as the
homogeneity test on the initial data.
3) Test Average (Right-hand Test)
This test proposes that hypothesis test in average is
similar with the right test as the steps right-hand test the
initial data.