chapter iii literature review - drum: home
TRANSCRIPT

ABSTRACT
Title of dissertation: THE IMPACT OF SOCIAL MARKETING ON A WEB-BASED BEHAVIORAL RISK FACTOR SURVEILLANCE SURVEY
Patrick L. Finley, Doctor of Philosophy, 2004 Dissertation directed by: Assoc. Professor Sharon M. Desmond
Department of Public and Community Health
The potential exists for Web-based health survey methods to collect, analyze, and
disseminate increasing amounts of health risk factor and health behavior data. There is a
need to establish Web-based survey methodologies that produce results equivalent to
current health survey modes. This study examined the impact a social marketing
campaign had on a Web-based Behavioral Risk Factor Surveillance Survey. It had three
dependent variables, response rate, response time, and item completion rate. An
explanatory model of response was also developed using logistic regression analysis.
Both qualitative and quantitative data collection methods were used in this study.
Qualitative data were used to develop the social marketing promotional framework.
Quantitatively, an experimental design was used, with a random sample of 847
participants randomly assigned to control and experimental groups.
A Web-based version of the 2001 Behavioral Risk Factor Surveillance System
questionnaire was adapted to create a 70 item Web-based Behavioral Risk Factor
Surveillance Survey (WBRFSS). The control group had the WBRFSS delivered without
any intervention. The experimental group was exposed to a social marketing campaign
prior to delivery of the WBRFSS.
Of the 770 who were mailed participation requests, 70 completed the survey
representing an overall response rate of 9.1 percent. Response rates were 5.96 percent for
the control group and 12.24 percent for the experimental group. Chi-Square analysis
showed that the response rate for the experimental group was significantly higher than
that of the control group.
The mean response times for the control group was 96.09 hours (SD=49.41) and
for the experimental group was 124.53 hours (SD=112.75).The item response rates were
99.50 percent for the control group and 99.82 percent for the experimental group. The t-
test for independent means found no significant difference between mean response times
or item response rates.
The regression model included the dependent variable, response, and the
independent variables, exposure to social marketing promotions, age, sex, ethnicity,
county of residence, education, perceived Internet literacy, and availability of an Internet
connection at home. The overall model was significant (p<.05). Exposure to the social
marketing campaign promotions increased WBRFSS response by more than two-and-
one-half times.
THE IMPACT OF SOCIAL MARKETING ON A WEB-BASED
BEHAVIORAL RISK FACTOR SURVEILLANCE SURVEY
by
Patrick L. Finley
Dissertation submitted to the Faculty of the Graduate School of the University of Maryland College Park in partial fulfillment
of the requirements for the degree of Doctor of Philosophy
2004
Advisory Committee: Assoc. Professor Sharon M. Desmond Professor Robert S. Gold Assoc. Professor Robin G. Sawyer Professor B. Don Franks Dr. Peggy McCardle

© Copyright by
Patrick L. Finley
2004
ii
ACKNOWLEDGEMENTS I wish to thank my dissertation committee chairman, Dr. Sharon M. Desmond, as
well as other committee members, Dr. Robert S. Gold, Dr. Robin G. Sawyer, Dr. B. Don
Franks, and Dr. Peggy McCardle, for all of their support and encouragement with this
project. It was through their guidance and inspiration that this research project became
such an incredible learning experience.
I would like to extend my thanks to Dr. Marvin Mandell, Chair of the Health
Policy department at University of Maryland, Baltimore County. His assistance on
understanding and interpreting the logistic regression analysis was invaluable.
I would also like to convey my thanks to my doctoral program advisor, Dr. Ellen
D. Schulken. Her advice provided much needed direction throughout the completion of
my doctoral coursework.
I also greatly appreciate the administration, faculty, and students of Howard
Community College in Columbia, Maryland for supporting this study.
iii
TABLE OF CONTENTS
ABSTRACT.. ...................................................................................................................... i ACKNOWLEDGEMENTS.............................................................................................. ii TABLE OF CONTENTS.................................................................................................iii LIST OF TABLES ........................................................................................................... vi LIST OF ABBREVIATIONS.........................................................................................vii CHAPTER I – INTRODUCTION................................................................................... 1
Introduction ..................................................................................................................... 1 Theoretical Foundation ................................................................................................... 4 Rationale for the Study.................................................................................................... 6 Statement of Research Hypotheses ................................................................................. 8 Research Variables.......................................................................................................... 9 Delimitations ................................................................................................................. 10 Limitations .................................................................................................................... 10 Definition of Terms....................................................................................................... 10 Summary ....................................................................................................................... 13
CHAPTER II – LITERATURE REVIEW ................................................................... 14
Introduction ................................................................................................................... 14 Public Health Surveillance............................................................................................ 15 Characteristics of Effective Health Surveillance Systems ............................................ 16 Health Survey Research Methods ................................................................................. 18
Personal Interview Surveys....................................................................................... 20 Telephone Interview Surveys.................................................................................... 22 Mail Surveys ............................................................................................................. 23 Computer-Assisted Survey Research Methods......................................................... 24 World Wide Web-Based Survey Research ............................................................... 28
Survey Response Rates ................................................................................................. 35 Social Marketing ........................................................................................................... 36
The Marketing Mix ................................................................................................... 38 The Social Marketing Process................................................................................... 39 Audience Segmentation ............................................................................................ 42 Promotional Messages .............................................................................................. 43 Promotional Channels ............................................................................................... 44 Challenges to Social Marketing Programs................................................................ 47
iv
Behavioral Risk Factor Surveillance System................................................................ 48 BRFSS Questionnaire Design ................................................................................... 50 BRFSS Methodology ................................................................................................ 52 Use of BRFSS Data................................................................................................... 54 Validity and Reliability of the BRFSS...................................................................... 55
Summary ....................................................................................................................... 57 CHAPTER III - METHODS .......................................................................................... 59
Introduction ................................................................................................................... 59 Research Hypotheses .................................................................................................... 59 Study Variables ............................................................................................................. 60 Study Design ................................................................................................................. 60 Study Population ........................................................................................................... 61 Study Procedures........................................................................................................... 62
IRB Approval ............................................................................................................ 62 Semi-Structured Interviews....................................................................................... 62 Promotional Component Questionnaire.................................................................... 63 WBRFSS Construction ............................................................................................. 65 WBRFSS Sampling................................................................................................... 66 WBRFSS-C Mail Request and Survey Placement.................................................... 67 Social Marketing Campaign Promotions .................................................................. 69 WBRFSS-E Mail Request and Survey Placement .................................................... 69
Data Analysis ................................................................................................................ 70 Summary ....................................................................................................................... 74
CHAPTER IV – RESULTS............................................................................................ 76
Introduction ................................................................................................................... 76 Semi-Structured Interviews........................................................................................... 76 WBRFSS Data Analysis ............................................................................................... 85 Overall WBRFSS Response.......................................................................................... 86 Research Hypothesis One ............................................................................................. 88 Research Hypothesis Two............................................................................................. 89 Research Hypothesis Three........................................................................................... 91 Research Hypothesis Four............................................................................................. 92 Respondent & Non-Respondent Follow-up Interviews ................................................ 98 Summary ..................................................................................................................... 101
CHAPTER V –DISCUSSION ...................................................................................... 103
Study Summary........................................................................................................... 103 Discussion ................................................................................................................... 107 Implications................................................................................................................. 111 Limitations of the Study.............................................................................................. 116 Recommendations ....................................................................................................... 118 Conclusions ................................................................................................................. 121
v
APPENDICES ............................................................................................................... 127 Appendix A - IRB Approval ....................................................................................... 127 Appendix C - Semi-Structured Interview Guide......................................................... 130 Appendix D – Promotional Component Questionnaire (PCQ)................................... 132 Appendix E - PCQ Instructor Request ........................................................................ 136 Appendix F - PCQ Student Participation Request ...................................................... 137 Appendix G - PCQ Participation Access Permission Page......................................... 138 Appendix H – Promotional Flyer and Poster .............................................................. 140 Appendix I – Web-based Behavioral Risk Factor Survey (WBRFSS)....................... 141 Appendix J – Approval from the Vice-President of Academic Affairs for HCC ....... 153 Appendix K – WBRFSS Mail Notification ................................................................ 154 Appendix L – WBRFSS Access Permission Page...................................................... 155 Appendix M – Non-Respondent Follow-up Interview Guide..................................... 156
REFERENCES .............................................................................................................. 158

vi
LIST OF TABLES
Table 1. Response Rates to Mail, Email, and Web Surveys ……………………….
Table 2. The 2001 BRFSS ……………………………………………………….
Table 3. Frequencies from Semi Structured Interviews ……………………………
Table 4. Promotional Component Questionnaire (PCQ) Items ……………………
Table 5. PCQ Promotional Component Sampling and Survey Response Rate …..
Table 6. PCQ Promotional Channel Collapsed Item Frequencies ………………..
Table 7. PCQ Promotional Message Characteristics Collapsed Item Frequencies…
Table 8. PCQ Promotional Message Content Collapsed Item Frequencies …...…
Table 9. Items Used to Develop Social Marketing Promotional Materials ……….. Table 10. Demographics for Control, Experimental, Study Sample, and HCC
student body ……………………………………………………………... Table 11. Demographics for WBRFSS Respondents, Non-Respondents, Study
Sample, and all HCC students during Spring 2003 ………………………
Table 12. Crosstabulation for Response Rate By Group ……………………………
Table 13. Chi-square Test for Response Rate ……………………………………….
Table 14. T-Test Results for Comparisons of Mean Response Times ……………… Table 15. Descriptive Statistics and T-Test for Comparisons of Mean Item
Completion Rates …………………………………………………………
Table 16. Omnibus Tests of Model Coefficients and Model Summary Outputs ……
Table 17. Classification Table ………………………………………………………
Table 18. Logistic Regression Output ……………………………………………….
Table 19. Reasons for non-response on the WBRFSS ………………………………
Table 20. Recommendations for Improving the Participation on the WBRFSS ……
35
51
77
79
81
82
83
84
85 87 89
90
91
92 93
95
96 98 100
101

vii
LIST OF ABBREVIATIONS BRFSS Behavioral Risk Factor Surveillance System WBRFSS Web-based Behavioral Risk Factor Surveillance Survey WBRFSS – C Web-based Behavioral Risk Factor Surveillance Survey
Control Group WBRFSS – E Web-based Behavioral Risk Factor Surveillance Survey
Experimental Group PCQ Promotional Component Questionnaire SSI Semi-structured Interviews HCC Howard Community College

1
CHAPTER I – INTRODUCTION Introduction
The systematic collection, analysis, interpretation, and dissemination of data
related to the incidence and prevalence of specific diseases is termed health surveillance
(Teutsch & Churchill, 2000; McQueen, 1999; Friis & Sellers, 1996). Health surveillance
provides information on acute and chronic conditions, injury, disability, risk factors,
preventive services, treatment services, and health care costs (Teutsch & Churchill, 2000;
Centers for Disease Control and Prevention, 2000a). Health surveillance is seen by many
as the foundation of public health (Teutsch & Churchill, 2000; McQueen, 1999; Harris,
McQueen & Kaplan, 1997).
Health surveys are the most common method of health surveillance (Pealer &
Weiler, Pigg, Miller, & Dorman, 2001; Sarvela & McDermott, 1999; Hoffman, 1997;
Aday, 1996). The number, complexity, scope, and cost of both privately and
governmentally-funded health surveys has increased dramatically in recent years as a
result of the growing need for information about the sources, magnitude, and impact of
health problems (Green & Kreuter, 1991; Aday, 1996). Data gathered through these
health surveys are used by policymakers, public health professionals, private providers,
insurers as well as health care professionals in the planning, implementing, and
evaluating of health-related programs and policies (Pealer et al., 2001; Sarvela &
McDermott, 1999; Hoffman, 1997; Aday, 1996).
Current methods for health survey data collection include personal interview,
telephone interview, and self-administered questionnaire (Aday, 1996). These methods of
health surveying are being increasingly augmented or replaced by computer-assisted data

2
collection methods (Biffignandi, Pratesi, Lozar Manfreda, & Vehovar, 2002; Aday, 1996;
de leeuw & Nicolls, 1996). A relatively recent extension of computer-assisted health
survey methods is the Internet or Web-based health survey (Pealer & Weiler, 2003;
McCabe, Boyd, Couper, Crawford, and D'Arcy, 2002; Bason, 2000; Cohen, 2000).
The comparatively new technology of the Internet, and its multi-media
innovation, the World Wide Web (WWW), may offer new potential for health risk factor
and behavioral surveying (Pealer & Weiler, 2003; McCabe, Boyd, Couper, Crawford, and
D'Arcy, 2002; Pealer et al., 2001; Bason, 2000). The WWW can be used for a myriad of
survey research applications including e-mail surveys, interactive surveys, virtual focus
groups, interviews using instant messaging, as well as pre-notifications, reminders, thank-
yous, and follow-ups (Pealer & Weiler, 2003; Vehovar, 2003; McCabe et al., 2002)
Review of the literature found few Web-based health-related surveys. The studies
identified in the literature targeted a specific health or medical concern in all but one
case. Targeted behaviors and issues included drug and alcohol use (McCabe et al., 2002;
Bason, 2000), dyspnea (Anderson & Ley, 2001); aging (Weibe, Eyerman, & Loft, 2001).
Pick’s disease (Yeaworth, 2001), patient satisfaction (May, 2000), medical research
(Houston & Fiore, 1998), ulcerative colitis (Soetko, Ward, Pao, & Lenert, 1997), and
chronic prostatitis (Alexander & Trissel, 1996).
Advantages of Web-based surveys over traditional methods have been identified
(McCabe et al., 2002; Pealer, Weiler, Pigg, Miller, & Dorman, 2001; Weibe et al., 2001;
Bauman, Airey, & Atak, 1998; Schmidt, 1997). These include the low cost of delivery,
quick response and turn-around times, the potential for large sample sizes, and increased
facilitation of data analysis (Pealer & Weiler, 2003; McCabe et al., 2002; Batagelj, Lozar

3
Manfreda, Vehovar, & Zaletel, 2000). Other advantages of Web surveys, in comparison
to traditional survey methods included the ability to supply formative data as well as
reconstruct participant response processes through the use of cgi scripts, java applets, and
log files (Vehovar, 2003; Bosnjak & Tuten, 2001).
Web-based surveys present certain methodological problems (Vehovar, 2003;
Biffignandi et al., 2002; Pealer et al., 2001; Batagelj et al., 2000; Schmidt, 1997). Of
primary methodological concern is the low or unmeasurable response rates associated
with Web-based surveys (Vehovar, 2003; Biffignandi et al., 2002; Pealer et al., 2001;
Bason, 2000).
Another methodological issue for Web-based surveys is the potential for the lack
of representativeness (Vehovar, 2003; Biffignandi et al., 2002; Pealer et al., 2001; Weibe,
Eyerman, & Loft, 2001). Improving representativeness is necessary to allow for greater
generalizability of Web-based surveys results (Vehovar, 2003; Biffignandi et al., 2002;
Pealer et al., 2001; Weibe et al., 2001). Finally, research is also needed which focuses on
developing methods for establishing an equivalence in Web-based surveys in terms of
response time and item completion rates as compared to traditional data collection
methods (Vehovar, 2003; Bosnjak & Tuten, 2001; Dillman, Phelps, Tortora, Swift,
Kohrell, and Berck, 2001; Stanton, 1998). This study applied social marketing to a Web-
based adaptation of the Behavioral Risk Factor Surveillance System questionnaire.
Through the use of social marketing this study sought to improve the response rate of the
Web-based survey. This study also sought to develop an explanatory model of response
to the Web-based health survey. Such a model may provide additional input for
improving the social marketing campaign and increasing response rates.
4
Theoretical Foundation
The principles and practices of marketing are being successfully applied to social
change programs (Novelli, 1990). Health-related social change programs are enacted and
promoted by health organizations including federal agencies, state and local health
departments, non-profit voluntary agencies, hospitals, and clinics (Novelli, 1990). The
marketing of such health-related social programs is termed social marketing (McKenzie
& Smelter, 1997). The theoretical framework for this study was social marketing, which
is the application of commercial marketing technologies to the analysis, planning,
execution, and evaluation of programs designed to influence the voluntary behavior of
target audiences (Bright, 2000; Kotler & Roberto, 1989). It typically emphasizes non-tan-
gible products such as ideas, attitudes, and lifestyle changes, as opposed to the more
tangible products and services that are the focus of commercial marketing (McKenzie &
Smeltzer, 1997). Similar to commercial marketing, the primary focus of social marketing
is on the consumer (Weinrich, 1999). Social marketing considers the perceptions and
perceived needs of the target audience, and centers on learning what people want and
actually need rather than on trying to persuade them to buy what is being produced
(Weinrich, 1999).
The social marketing planning process takes this consumer focus into account by
addressing the elements of the marketing mix. The marketing mix refers to the four Ps of
marketing: product, price, place, and promotion (Bright, 2000; Weinrich, 1999;
McKenzie & Smelter, 1997; Novelli, 1990). Product refers to the actual program being
planned and implemented (Weinrich, 1999, McKenzie & Smelter, 1997). A continuum of
products exists ranging from tangible, physical products to services, practices, and more
5
intangible ideas (Weinrich, 1999). Price refers to what the consumer must do in order to
obtain the product (Bright, 2000; Weinrich, 1999; McKenzie & Smelter, 1997). This cost
may be monetary, or it may require the consumer to give up intangibles such as time or
effort, or to risk embarrassment and disapproval (Weinrich, 1999; McKenzie & Smelter,
1997). Place describes the way that the product reaches the consumer (Bright, 2000;
Weinrich, 1999; McKenzie & Smelter, 1997). For a tangible product this refers to the
distribution system (Bright, 2000; Weinrich, 1999; McKenzie & Smelter, 1997). For an
intangible product, place refers to decisions about the channels through which consumers
are reached with information or training (Bright, 2000; Weinrich, 1999; McKenzie &
Smelter, 1997). Promotion consists of the integrated use of advertising, public relations,
promotions, and media advocacy (Bright, 2000; Weinrich, 1999; McKenzie & Smelter,
1997; Novelli, 1990). This can involve both the oral and written communication that
program planners use to attract those in the target population to become involved in a
program (McKenzie & Smelter, 1997). Promotion might include such elements as
posters, bulletin boards, brochures, displays, table tents, newsletters, envelope stuffers,
and public service announcements (Bright, 2000; McKenzie & Smelter, 1997; Novelli,
1990).
Social marketing has been used successfully in health programs in the U.S. and
internationally (Bright, 2000; Weinrich, 1999; Novelli, 1990). In the U.S., social
marketing campaigns have been used to address such issues as drug abuse, heart disease,
and organ donation (Weinrich, 1999; Novelli, 1990). Social marketing strategies have
also been successfully applied in the U.S. to programs related to anti-smoking, adolescent
pregnancy, seat-belt usage, breast cancer screening, mental health, immunizations, AIDS,
6
drinking and driving, smoking cessation, dietary fat reduction, and improved physical
fitness (The Social Marketing Network, 2001; Novelli, 1990; Wallack, 1990).
Internationally, socially marketing has been used with health programs that target
measles vaccinations, contraceptive use, and oral rehydration therapy (Weinrich, 1999;
Novelli, 1990).
Review of the literature showed no Web-based health surveys that have used
social marketing in design or delivery. Application of social marketing strategies and
methods in this study sought to provide a framework for improving response rates on a
Web-based health survey.
Rationale for the Study
Health care policies and priorities have been shaped by the health information
available (Teutsch & Churchill, 2000; Hoffman, 1997). Health surveillance and analysis
of the obtained data allow for better understanding of the dynamics of society’s rapidly
changing health status (Teutsch & Churchill, 2000; McQueen, 1999). The need for useful
health surveillance data is of vital importance as society deals with economic crises in the
health care system, an aging population, and increasing incidences of chronic disease
(Teutsch & Churchill, 2000; Hoffman, 1997; Sackett & Rosenburg, 1995). Health
surveys are the most common method of health surveillance (Pealer & Weiler, Pigg,
Miller, & Dorman, 2001; Sarvela & McDermott, 1999; Hoffman, 1997; Aday, 1996).
During the last century and to the present, the collection of health survey data has
been difficult for health professionals and stakeholders (Pealer & Weiler, 2003; Teutsch
& Churchill, 2000; McQueen, 1999). Production of results from such surveys has
typically been slow and tedious (Pealer & Weiler, 2003; Teutsch & Churchill, 2000;
7
McQueen, 1999). A discrepancy exists among the speed and continuity with which the
data are collected, the timeliness of analyses of those data, and the availability of the
analyses (Pealer & Weiler, 2003; Biffignandi et al,, 2002; McQueen, 1999). These
concerns reinforce the need to examine alternative strategies in the surveillance of health
risk factors and behaviors (Pealer & Weiler, 2003; McQueen, 1999).
The World Wide Web (WWW) provides the opportunity for collecting survey
data efficiently (Vehovar, 2003; Bauman et al., 1998). Web-based surveying employs
technology similar to that used in computer-assisted data collection (Pealer et al., 2001).
The results from these surveys can be provided in real time, allowing clients on-demand
access to data (Bauman et al., 1998). Fully automated tables, reports, and multimedia
presentations can also be generated quickly (Bauman et al., 1998). Instead of waiting for
all data to be collected and compiled in a written report, researchers, policy-makers, and
stakeholders can get valuable feedback to inform their policy and program decisions on a
constant, evolving basis (Bauman et al., 1998).
The cost of Web-based survey administration is low when compared with the time
and money costs associated with traditional survey techniques (Pealer & Weiler, 2003;
Forsman & Varedian, 2002; Yun & Trumbo, 2000). Web-based surveys have
demonstrated lower expenditures of time, personnel, and material resources when
compared with traditional survey methods (Pealer & Weiler, 2003; Batagelj, Lozar
Manfreda, Vehovar, and Zaletel, 2000; Yun & Trumbo, 2000). Further, as the number of
participants involved in a Web-based survey increases, cost per individual surveyed
decreases (Pealer & Weiler, 2003; Yun & Trumbo, 2000). Web surveys have also been

8
shown to reduce turnaround time for analysis and use of data collected (Miller et al.,
2002; Schleyer and Forrest, 2000).
Few Web-based surveys that solicited health behavior information have been
identified (Pealer et al., 2001; Smith, 1997). All but one of these surveys focused on
gathering information about a particular health condition or disease, as opposed to a more
general survey of health behaviors and health risk factors (Pealer et al., 200; Smith,
1997).
The advent of the World Wide Web along with a need for improved efficiency in
health surveillance necessitate further studies into Web-based health survey
methodologies. The potential exists for Web-based health survey methods that allow
researchers to, 1) collect of increasing amounts of health risk factor and health behavior
data, 2) analyze that data in a more timely fashion, 3) provide more appropriate
applications of that data for intervention and policy development, and 4) do so in a more
cost effective manner. There is a need for research that examines methods for
establishing acceptable response rates, response times, and item completion rates for
Web-based health surveys.
Social marketing may be used to address certain methodological problems
identified in Web-based health surveys. The application of the principles of social
marketing to a Web-based health survey may provide a method for improving response
rate, response time, and item completion rate.
Statement of Research Hypotheses
This study delivered a Web-based health survey to two comparable groups. The
experimental group was exposed to a social marketing campaign prior to the delivery of a
9
Web-based health survey, while the control group was not. This study tested the
following research hypotheses:
1) The response rate on the Web-based Behavioral Risk Factor Surveillance
Survey will be higher in the experimental group when compared to the control
group.
2) The response time on the Web-based Behavioral Risk Factor Surveillance
Survey will be lower in the experimental group when compared to the control
group.
3) The item completion rate will be higher on the Web-based Behavioral Risk
Factor Surveillance Survey in the experimental group when compared to the
control group.
4) An explanatory model could be fit that explains response on the Web-based
Behavioral Risk Factor Surveillance Survey from selected independent
variables.
Research Variables
The independent variable in this study was exposure to a social marketing
campaign prior to delivery of a Web-based health survey. The dependent variables of this
study included the following:
1) Response rate: the percentage of respondents in each of the control and
treatment groups who completed useable web surveys.
2) Response time: calculated as time in hours, it is the amount of time it takes
respondents to receive, complete, and submit the web surveys.
10
3) Item completion rate: the percentage of web survey items appropriately
completed by respondents in the control and treatment groups.
Delimitations
Several delimitations applied to this study. These included:
1) Participants included randomly selected individuals who enrolled in credit
classes at Howard Community College during Spring, 2003.
2) Participants included those students who had access to the Internet in the
home, work, school, and/or community.
3) Participants included those students who were Internet literate.
4) Participants included only those who voluntarily participated.
Limitations
This study had several limitations. These included:
1) Participants may not have been representative of all Howard Community
College students.
2) Participants may not have been representative of all community college
students, four-year college or university students, or the general public.
3) Participants may have had variations in computer hardware, Internet access
bandwidth, operating systems, and computer/internet literacy that may affect
participation.
Definition of Terms Behavioral Risk Factor Surveillance System (BRFSS): An ongoing, state-based telephone surveillance system supported by the Centers for Disease Control and Prevention (Centers for Disease Control and Prevention, 2001d). Browser: A client program (software) that enable you to view text and images and many other WWW features (UC Berkeley Library, 2000).
11
Common Gateway Interface (CGI): A set of rules that describe how a Web Server communicates with another piece of software on the same machine, and how the other piece of software (the “CGI program”) talks to the Web server (Internet Literacy Consultants, 2000). E-mail (Electronic Mail): Messages, usually text, sent from one person to another via computer (Internet Literacy Consultants, 2000). Health Surveillance: The systematic collection of data pertaining to the occurrence of specific diseases, the analysis and interpretation of these data, and the dissemination of that data (Friis & Sellers, 1996). Hit: As used in reference to the World Wide Web, “hit” means a single request from a Web browser for a single item from a Web server (Internet Literacy Consultants, 2000). HTML (HyperText Markup Language): The coding language used to create Hypertext documents for use on the World Wide Web (Internet Literacy Consultants, 2000). HTTP (HyperText Transfer Protocol): The protocol for moving hypertext files across the Internet. Requires a HTTP client program on one end, and an HTTP server program on the other end. HTTP is the most important protocol used in the World Wide Web (WWW) (Internet Literacy Consultants, 2000). Internet: The vast collection of inter-connected networks that use the TCP/IP protocols and that evolved from the ARPANET of the late 60’s and early (Internet Literacy Consultants, 2000). Internet Literacy: The essential knowledge needed to function independently on the Internet (adapted from Computer Literacy World Headquarters, 2001). Item completion rate: The number of responses divided by the total number of items on a questionnaire (Goyder, 1987). Netiquette: The etiquette on the Internet (Internet Literacy Consultants, 2000). Non-contact rate: Ratio of non-response not attributed to direct refusals from the potential respondents (Neutens and Rubinson, 1997). Non-response rate: Ratio of respondents who did not complete the questionnaire to those who did (Neutens and Rubinson, 1997). Response rate: Percentage of a sample that completed useable surveys (Alreck & Settle, 1995).
12
Response time: Calculated as time in days, it is the amount of time it takes respondents to receive, complete, and return questionnaires (Neutens and Rubinson, 1997). Risk Factors: Factors that increase the probability of developing a disease or health problem (Green & Kreuter, 1991). Server: A computer, or a software package, that provides a specific kind of service to client software running on other computers (Internet Literacy Consultants, 2000). Socially desirable response: Responses given based on what participants perceive to be socially acceptable or respectable (Alreck & Settle, 1995) Social Marketing: The design, implementation, and control of programs seeking to increase the acceptability of a social idea or practice in a target group (s) (Bright, 2000). URL (Uniform Resource Locator): The standard way to give the address of any resource on the Internet that is part of the World Wide Web (WWW) (Internet Literacy Consultants, 2000). WWW (World Wide Web): Frequently used (incorrectly) when referring to "The Internet", WWW has two major meanings - First, loosely used: the whole constellation of resources that can be accessed using Gopher, FTP, HTTP, telnet, USENET, WAIS and some other tools. Second, the universe of hypertext servers (HTTP servers), which are the servers, that allows text, graphics, sound files, etc. to be mixed together (Internet Literacy Consultants, 2000).

13
Summary
Chapter I introduced the study, reviewed the theoretical foundation for the study
and presented the rationale for the study. Chapter I also presented the research
hypotheses, research variables, delimitations, limitations, and provided a definition of
terms.

14
CHAPTER II – LITERATURE REVIEW
Introduction
This study examined the impact social marketing had on a web-based behavioral
risk factor surveillance survey. This literature review provides support for the study’s
purpose, need, and methodology. This chapter is organized as follows: overview of health
surveillance, an overview of health survey research methods, an examination of
computer-based and World Wide Web-based survey research methods, a review of social
marketing, and finally, an overview of the Behavioral Risk Factor Surveillance System
(BRFSS).
Chronic diseases are now our nation’s leading killers, unlike the situation a
century ago (Centers for Disease Control and Prevention, 2001d). Two chronic diseases,
cardiovascular disease and cancer, account for almost two-thirds of all deaths among
Americans (Centers for Disease Control and Prevention, 2001b). The roots of chronic
disease are certain health-damaging behaviors (Centers for Disease Control and
Prevention, 2001b). These behaviors include lack of physical activity, poor nutrition,
tobacco use, and under-use of prevention strategies such as cancer screening (Centers for
Disease Control and Prevention, 2001b). Reducing these and other behaviors that
endanger the health of Americans demands public and provider education, prevention
research, and policy and environmental changes that facilitate healthy living (Disease
Control and Prevention, 2001b).
The Centers for Disease Control and Prevention (CDC) is the nation's agency in
charge of chronic and infectious disease control (Centers for Disease Control and
Prevention, 2000b). Its mission is to promote health and quality of life by preventing,
15
identifying, and controlling disease, injury and disability. The CDC also serves to
promote healthy behavior, healthy life-style choices, and healthful environments (Centers
for Disease Control and Prevention, 2000b).
Working with its partners both domestically and internationally, the CDC
employs a wide range of strategies to make further progress against disease, disability,
and premature death (Centers for Disease Control and Prevention, 2000b). For these
strategies must be supported by ongoing surveillance of health risks (Centers for Disease
Control and Prevention, 2001b).
Public Health Surveillance
Public health surveillance is the ongoing and systematic collection, analysis, and
interpretation of health data (King, Pealer, & Bernard, 2001; McQueen, 1999; Pealer et
al., 2001; Klaucke, Buehler, Thacker, Parrish, Trowbridge & Berkelman, 1988). It is
concerned with the determinants of disease and the reasons for relatively high or low
frequency of disease in specific population subgroups (Friis & Sellers, 1996).
Health surveillance provides the necessary data to define disease burden, identify
populations at highest risk, determine the prevalence of health risks, and guide and
evaluate disease prevention efforts at the national, state, and local levels (Centers for
Disease Control and Prevention, 2001b). Further, it is used to monitor disease trends,
monitor progress toward control objectives, estimate the size of a health problem, detect
outbreaks of an infectious disease, and identify research needs (Heymann, 2001). This
information is used for planning, implementing, and evaluating public health
interventions and programs (Heymann, 2001; King et al., 2001; McQueen, 1999; Pealer
et al., 2001; Klaucke et al., 1988). Ultimately, health surveillance provides information
16
for action (Heymann, 2001).
Data collected through health behavior surveillance conducted by the National
Center for Health Statistics (NCHS) has been used to measure health and health status in
the United States and attempt to quantify health in this country (Cottrell, Girvan, &
McKenzie, 1999).
Characteristics of Effective Health Surveillance Systems
A health surveillance system contributes to the prevention and control of adverse
health events, including improved understanding of the public health implications of such
events (Klauke et al., 1988), and to determine that an adverse health event previously
thought to be unimportant is actually important (Klauke et al., 1988). A health
surveillance system is considered functional and useful if it can accomplish at least one of
the following: 1) detect trends signaling changes in the occurrence of disease? 2) provide
estimates of the magnitude of morbidity and mortality related to the health problem under
surveillance? 3) stimulate epidemiologic research likely to lead to control or prevention?
4) identify risk factors associated with disease occurrence? 5) permit the assessment of
the effects of control measures (Klauke et al., 1988). Usefulness may be affected by
several attributes (Klauke et al., 1988). These include simplicity, timeliness, flexibility,
representativeness, sensitivity, acceptability (McQueen, 1999; Klauke et al., 1988).
Surveillance systems should be as simple as possible while still meeting their
objectives (McQueen, 1999; Klauke et al., 1988). The simplicity of a surveillance system
refers to its size, structure and ease of operation (McQueen, 1999; Klauke et al., 1988). A
simple system would be one that is easy to apply and analyze (McQueen, 1999; Klauke et
al., 1988). A more complex system might involve special laboratory tests, telephone or

17
home visits, and multiple levels of reporting (Klauke et al., 1988). Simplicity is closely
related to timeliness and will affect the extent to which resources are necessary to operate
the system (McQueen, 1999; Klauke et al., 1988). Improved timeliness allows control
and prevention activities to be initiated sooner. It also allows for such activities to be
applied in a more appropriate manner (McQueen, 1999; Klauke et al., 1988). Timeliness
and flexibility are related. A flexible surveillance system can adapt to changing
information needs or operating conditions with little additional cost in time, personnel,
and/or allocated funds (McQueen, 1999; Klauke et al., 1988). Flexibility in a surveillance
system provides for a more fluid approach to health data collection (McQueen, 1999;
Klauke et al., 1988).
Representativeness relates to accuracy of data collection by the surveillance
system (Klauke et al., 1988). A surveillance system is representative if it describes the
occurrence of a health event over time and the distribution of the health event in the
population by place and person (Klauke et al., 1988). Quality of data is an important part
of representativeness (McQueen, 1999; Klauke et al., 1988). Quality of data is influenced
by the clarity of the surveillance forms, the extent of training of interviewers, the
supervision of persons who complete surveillance forms, and the care exercised in data
management (McQueen, 1999; Klauke et al., 1988).
The sensitivity of a surveillance system is the ability of the system to detect a
health event (McQueen, 1999; Klauke et al., 1988). The measurement of sensitivity in a
surveillance system requires both the validation of information collected by the system
and the collection of information external to the system to determine the frequency of the
condition in a community (McQueen, 1999; Klauke et al., 1988). Increased sensitivity
18
may afford a greater opportunity for identifying epidemics and understanding the natural
course of an adverse health event in a community (Klauke et al., 1988). Acceptability
reflects the willingness of individuals and organizations to participate in the surveillance
system (McQueen, 1999; Klauke et al., 1988). To assess acceptability, one must consider
the points of interaction between the system and its participants (McQueen, 1999; Klauke
et al., 1988). Quantitative indicators of acceptability include subject participation rates,
rate at which the participation rate was achieved, completion and refusal rates,
completeness of forms, and timeliness of reporting (McQueen, 1999; Klauke et al.,
1988).
Health Survey Research Methods
Health surveys represent a primary source of health behavior surveillance,
research, and evaluation for health care policymakers, public health professionals, private
providers, insurers, and health care consumers in planning, implementing, and evaluating
health-related programs and policies (King et al., 2001; Pealer et al., 2001; Sarvela &
McDermott, 1999; Aday, 1996).
Health surveys yield accurate results when four kinds of errors are avoided.
These include coverage errors, sampling errors, measurement errors, and non-response
errors (Salant & Dillman, 1994). Coverage error occurs when a survey does not produce
accurate results due to a lack of appropriate survey completion by members of the target
population or sample (Salant & Dillman, 1994). This may happen as a result of
inaccessibility and/or problems in contacting the individuals involved in the survey study
(Salant & Dillman, 1994). The level of coverage error depends on how different the
missing, ineligible, or duplicate entries are from the target population (Salant & Dillman,
19
1994). Coverage error occurs when there is a discrepancy between the set of people who
are the focus of the research project (i.e., the target population) and the subset that are
actually included in the sampling frame (i.e., the survey population) (Salant & Dillman,
1994).
Sampling error occurs when sample size is too small and so not representative of
the population of interest (Salant & Dillman, 1994). It is a function of the heterogeneity
of what is being measured, sample size, and population size (Salant & Dillman, 1994).
Sampling error can be controlled by increasing the sample size (Salant & Dillman, 1994).
Measurement error occurs when a survey contains inappropriate measures and so
does not provide useful information (Salant & Dillman, 1994). These errors occur when
data is collected, not when samples are selected (Salant & Dillman, 1994). Measurement
errors could come from four sources – the survey method, the questionnaire, the
interviewer, and the respondents (Salant & Dillman, 1994).
Non-response error occurs when the number of responses (response rate) is too
low to generalize to the population (Dodd, D. K. & Markwiese, B. J., 1986; Rossi,
Wright, & Anderson, 1983; Fowler, 1993). Non-response bias is the potential difference
between those who respond to a specific survey and those who do not (Fowler, 1993;
Mangione, 1995). Non-response can be differentiated into unit and item non-response
(Groves & Couper, 1998).
Unit non-response refers to the complete loss of a survey unit, while item non-
response refers to missing responses to individual questions (Bosnjak & Tuten, 2001).
Non-response is of particular importance to researchers because the unknown
characteristics and attitudes of non-respondents may cause inaccuracies in the results of
20
the study in question (Bosnjak & Tuten, 2001). It is often nearly impossible to receive a
response on every item from all participants in a sample, and non-response bias is a
critical limitation to mail survey research (Rossi et al., 1983; Fowler, 1993). Error due to
non-response can be offset by techniques designed to increase participation (Rossi et al.,
1983; Fowler, 1993).
Data collection methods for health survey research include personal or face-to-
face interview, telephone interview, mail survey, and computer-assisted questionnaire
(Baumgartner & Strong, 1998; Aday, 1996; Fowler, 1993; Alreck & Settle, 1984; Rossi
et al., 1983). Six aspects of survey research have been identified and provide a basis for
comparison of the advantages and disadvantages of these traditional health survey
research data collection methods (Aday, 1996). These include sampling, question
development, questionnaire formatting, conducting the survey, data preparation and
analysis, and cost (Aday, 1996).
Personal Interview Surveys
Personal survey interviews are conducted face-to-face with research participants
(Pealer et al., 2001) and allow for data collection from participants at their homes, work
places, or public places (Alreck & Settle, 1995; Fowler, 1993). The personal interview
may take one or a combination of three forms: 1) a structured interview that asks each
participant the same specific questions; 2) a semi-structured interview that asks each
participant the same general questions; and 3) the unstructured interview that allows
conversation to develop (Baumgartner & Strong, 1998).
In personal interviews information may be recorded in different manners
(Baumgartner & Strong, 1998). The interviewer may use a tape recorder, paper-and-
21
pencil records, or a computer to record the responses of the participants (Baumgartner &
Strong, 1998).
In a personal, face-to-face survey, interviewers control the pace and sequence
(Salant & Dillman, 1994). Respondents must rely on what they hear when formulating
their answers and the only context comes from what they remember of previous questions
(Salant & Dillman, 1994). Often people are influenced by what they think the interviewer
would consider an acceptable response (Salant & Dillman, 1994).
Advantages of the personal interview over other methods include a greater
completeness of response, an ability to clear up misconceptions, the opportunity for
follow up responses, and an increased likelihood that the respondent will be more
conscientious with the interviewer present (Baumgartner & Strong, 1998; Aday, 1996;
Salant & Dillman, 1994). Additional advantages include the ability to personalize the
questionnaire for the participant, flexibility so that further probing may occur, questions
can be repeated if necessary, observation of both verbal and nonverbal behavior, control
over question order that cannot be accomplished by certain other survey methods,
spontaneity, and the ability to ensure that there is no help from others (Baumgartner &
Strong, 1998; Aday, 1996; Salant & Dillman, 1994).
Disadvantages include cost in terms of money and time (including training period
and travel allowance), potential for interview and/or participant manipulation or bias,
vulnerability to personality clashes between interviewer and participant, and the lack of
anonymity (Baumgartner & Strong, 1998; Aday, 1996; Salant & Dillman, 1994).
Additional disadvantages of personal surveys are inconvenience to the respondent, lack
of standardization in questions due to probing or question repetition, lack of access to

22
respondents because of distance or other factors, and difficulty in summarizing the
findings (Baumgartner & Strong, 1998; Aday, 1996; Salant & Dillman, 1994).
Factors that may potentially influence data collection from personal interviews
include differences in social status and distance, education, and age (Salant & Dillman,
1994). Differences in race, sex, and ethnicity between the respondent and the interviewer
may also bias the results (Salant & Dillman, 1994).
Telephone Interview Surveys
In the 1980s, at about the same time as personal health behaviors were receiving a
wider recognition in relation to chronic disease morbidity and mortality, telephone
surveys emerged as an acceptable method for determining the prevalence of many health
risk behaviors among populations (Centers for Disease Control and Prevention, 2001d).
The use of the telephone in interviewing has greatly increased since then (Baumgartner &
Strong, 1998; Neutens & Rubinson, 1997; Aday, 1996).
The chief advantage of telephone over face-to-face interviewing is cost savings
(Baumgartner & Strong, 1998; Neutens & Rubinson, 1997). One study estimated a
savings of 50 percent by telephone while another reported a reduction of 75 to 80 percent
(Baumgartner & Strong, 1998; Neutens & Rubinson, 1997). In addition to their cost
advantages, telephone surveys are especially desirable at the state and local level, where
the necessary expertise and resources for conducting area probability sampling for
personal interviews were not likely to be available (Centers for Disease Control and
Prevention, 2001d).
Other advantages of telephone interviews are that they tend to be faster than either
face-to-face or mail surveys, the researcher can select subjects from a much broader area,
23
and monitoring of interviews and quality control are much easier (Baumgartner & Strong,
1998; Neutens & Rubinson, 1997). Telephone interviewing may also be better than face-
to-face interviews for collecting sensitive data since telephone interviewing provides a
less intimate interaction between interviewer and the individual interviewee
(Baumgartner & Strong, 1998; Neutens & Rubinson, 1997).
Disadvantages of telephone interviewing have also been identified. These include
lower motivation levels of the respondents, less control over the interview situation,
slightly lower response rates as compared with face-to-face interviewing, and coverage
problems associated with a lack of telephones, unlisted numbers, and/or screened calls
(Baumgartner & Strong, 1998; Neutens & Rubinson, 1997).
Mail Surveys
The mail survey has long been an economic alternative to labor-intensive and
expensive face-to-face and telephone interviews (Smith, 1997). In a mail survey,
respondents control question pace and sequence (Salant & Dillman, 1994).
Mailed survey advantages, as compared to personal and telephone surveys,
include a savings of money and time, no interviewer bias, greater assurance of
anonymity, completion by the respondent at his or her convenience, accessibility to a
wide geographic region, potentially more accurate information because respondents can
consult records before answering, and identical wording for all respondents (Neutens &
Rubinson, 1997).
Disadvantages of mailed surveys include a lack of flexibility, greater likelihood of
unanswered questions, low response rates when compared to telephone interviews, and
inability to record spontaneous reactions and/or nonverbal responses (Neutens &

24
Rubinson, 1997). Additional disadvantages include a lack of control over the order in
which questions are answered, lack of control over the immediate environment, no
guarantee of return by the deadline date, no assurance that the targeted individual is the
one who actual answers the questionnaire, and inability of the participant to use a
complex questionnaire format (Neutens & Rubinson, 1997). Another weakness of mail
surveys occurs when respondents have limited or no literacy (Bloom, 1998).
Computer-Assisted Survey Research Methods
Computer-assisted data collection (CADAC) methods have become the
fundamental tools for governmental, academic, and commercial data collection (Aday,
1996). Characteristic of all forms of computer-assisted interviewing is that questions are
read from the computer screen, and responses are entered directly in the computer, either
by the interviewer or by the respondent (de Leeuw & Nicholls, 1996). An interactive
program presents the questions in the proper order and can be programmed to include
skip patterned questioning when necessary (de Leeuw & Nicholls, 1996). This helps the
researcher avoid potentially confounding effects of cross-interviewer differences (Bloom,
1998).
Computers can perform consistency checks by identifying out-of-bounds and
internally inconsistent answers (Bloom, 1998). Instead of resorting to the laborious and
questionable practice of data cleaning, computers can perform relevant checks on the spot
that result in clearer, more accurate data (Bloom, 1998).
Computer-Assisted Telephone Interviewing (CATI) is the oldest form of
computer-assisted interviewing (de Leeuw & Nicholls, 1996). Originally CATI would be
employed centrally using a minicomputer system (de Leeuw & Nicholls, 1996). Each
25
interviewer would sit behind a terminal and ask the questions that appeared on the screen.
The respondent’s answer was then typed into the computer by the interviewer (de Leeuw
& Nicholls, 1996). The microcomputer now allows for a more decentralized approach to
the CATI survey, which may be conducted from the interviewer’s home, work, or other
location (de Leeuw & Nicholls, 1996).
Computer-Assisted Personal Interviewing (CAPI) involves the interviewers
visiting a respondent’s home with a portable computer and conducting a face-to-face
interview using the computer (de Leeuw & Nicholls, 1996). The survey questions are
presented on the computer’s screen, which the interviewer presents to the participant, and
then records the participant’s responses (de Leeuw & Nicholls, 1996). After the interview
the data are sent to a central computer, either electronically via modem or by data disk
(de Leeuw & Nicholls, 1996). Interviewer instructions and newly sampled addresses can
also be sent to the interviewer via modem or disk (de Leeuw & Nicholls, 1996).
Computer-Assisted Self-Interviewing (CASI) allows respondents to read the
questions on the screen and enter the answers (Clayton, 1995; de Leeuw & Nicholls,
1996). In the U.S. the term CASI is gaining broad acceptance as the descriptive term for
self-interviewing introduced by an interviewer (Clayton, 1995; de Leeuw & Nicholls,
1996).
Self-administered computerized interviewing without an interviewer uses the term
CSAQ (Computerized Self Administered Questionnaires) (Clayton, 1995; de Leeuw &
Nicholls, 1996). In CSAQ, there is no interviewer; the program guides the respondent
through the questionnaire (Clayton, 1995; de Leeuw & Nicholls, 1996). This method
takes advantage of the growing access of advanced microcomputers (Clayton, 1995; de

26
Leeuw & Nicholls, 1996). Using CSAQ, respondents load the provided software on their
PCs, and use the system for entering and editing their own data (Clayton, 1995; de Leeuw
& Nicholls, 1996). CSAQ methods are much like CATI except the software acts as the
interviewer, and like CATI, CSAQ can contain branching and on-line editing (Clayton,
1995; de Leeuw & Nicholls, 1996).
Two computer-assisted equivalents of the mail survey are the disk-by-mail
(DBM) and the electronic mail survey (EMS) (Farmer, 1998; Batagelj & Vehovar, 1998;
de Leeuw & Nicholls, 1996; Kiesler & Sproull, 1986). In DBM, a disk containing the
interviewing program is sent to the respondent, who runs the program on his or her own
computer and then returns the disk to the researcher (Farmer, 1998; Batagelj & Vehovar,
1998; de Leeuw & Nicholls, 1996; Kiesler & Sproull, 1986). In EMS the survey is sent
by electronic mail through existing computer networks, electronic mailing systems, and
bulletin boards (de Leeuw & Nicholls, 1996; Kiesler & Sproull, 1986). Users of such
systems receive a request to participate; upon agreeing, they are then asked a number of
questions by an interviewing program or they receive an electronic form to fill in (de
Leeuw & Nicholls, 1996; Kiesler & Sproull, 1986).
Compared to an optimally implemented paper-and-pen interview (PAPI), the
optimally implemented computer-assisted interview has five apparent advantages
identified by de Leeuw & Nicholls, 1996:
1) No routing errors. Based on previously given answers the program
decides what the next question must be, and so both interviewer and
respondent are guided through the questionnaire. Missing data
because of routing and skipping errors do not occur. Questions that do
27
not apply to a specific respondent are automatically skipped.
2) Immediate data checks. An optimally implemented CADAC program
will perform some internal validity checks. The simplest checks are
range checks that compare the given response to the range of possible
responses. In PAPI, internal validity checks have to be conducted in
the data cleaning stage that usually follows the data collection stage.
However, when errors are detected, they can only be recoded to a
missing data code because it is no longer possible to ask the
respondents what they really meant. In a CADAC session there is an
opportunity to correct range and consistency errors, and therefore
CADAC should lead to fewer data entry errors and missing data.
3) Immediate question reformulation. One example is the possibility to
randomize the order of questions in a scale, giving each respondent a
unique question order. This will eliminate systematic question order
effects. Response categories can also be randomized, which avoids
question format effects. The computer can also assist in the interactive
field coding of open questions using elaborate coding schemes, which
would be unmanageable without a computer.
4) No separate data entry phase. This means that the first tabled results
can be available soon after the data collection phase. A well-planned
CADAC survey has a real advantage when the results must be quickly
available.
5) The system accurately records information about the interview process

28
itself (e.g. time and duration of the interview, the interval between
interviews and the order in which they are carried out) which can
inhibit an interviewer 'cheating'. Computer assisted interviewing
provides a research organization with greater interviewer control and
offers a protection against unwanted interviewer behavior.
An additional advantage of computer-aided data collection is that respondents will
experience a higher degree of privacy and anonymity, which should lead to more self-
disclosure and less social desirability bias (Bloom, 1998; Weisband and Kiesler, 1996).
World Wide Web-Based Survey Research
The World Wide Web (WWW) is an aspect of the Internet that allows people to
connect through documents, pictures, sound or video (History Highlights of the Internet
and the Web, 1998). It allows users to interface using texts, graphics, sound, and video
(History Highlights of the Internet and the Web, 1998).
An extension of computer-assisted survey methods is the World Wide Web-based
(Web-based) survey methods. Research has shown advantages of Web-based surveys
over traditional surveys (Crawford, McCabe, Couper, & Boyd, 2002; Sheehan, 2001;
McCullough, 1998). Unlike other survey data collection methods, Web-based surveys
can accommodate a wide range of surveys and survey operations (Clayton, 1995). The
use of in-person, telephone, and mail survey collection procedures are often limited by
the length and complexity of the questionnaire, the frequency of the collection cycle, and
the range of survey operations for which these methods could be used in a cost effective
manner (Crawford, et al., 1995). Compared with other survey methods, Web-based
surveys are less evasive and disruptive, it can be answered at the respondent's leisure, and

29
it does not require postage or physical effort to return it (Crawford, et al., 2002; Bauman
et al., 1998).
Using the Web-based for survey research has been shown to save time and money
(Pealer & Weiler, 2003; Forsman & Varedian, 2002; Batagelj, Lozar Manfreda, Vehovar,
and Zaletel, 2000; Bauman et al., 1998). Traditional costs are associated with paper
survey publication and distribution, respondent reminding, data collection, data entry,
feedback publication, and feedback distribution methods (Pealer & Weiler, 2003;
Crawford, Crawford, et al., 2002; Batagelj, Lozar Manfreda, Vehovar, and Zaletel, 2000).
Outside of start-up costs for equipment and web page design, the actual implementation
of a survey is relatively low, with no costs for paper or postage (Crawford, et al., 2002;
McCullough, 1998). Watt (1999) provided evidence that the costs of web-based surveys
decrease as the sample size goes up.
A Web-based survey can take advantage of the graphic power available through
programming languages such as HTML and JavaScript to create an attractive, interesting,
and compelling survey that is inviting to respondents (Schillewaert, Langerak, &
Duhamel, 1998). Good graphics have long been held as important in paper surveying and
it is the Web survey that can approach or surpass the graphic sophistication of the well-
designed paper survey (Yun & Trumbo, 2000; Bauman et al., 1998). Researchers can
present color images and texts, and also present audio, video, and interactive images
(Yun & Trumbo, 2000).
An interactive instrument such as a Web-based survey has been identified as a
better methodology than a flat file instrument (e-mail survey) (Farmer, 1998). The use of
CGI scripts allow adaptive questioning, which means that the questions that a respondent

30
is asked depend on his or her answers to previous questions (Bauman et al., 1998; Kehoe
and Pitkow, 1996). Such methods allow for follow-up questions that can enrich responses
and for easier navigation for respondents (Sheehan & Hoy, 1999; Bauman et al., 1998).
Stanton (1998) points out that the Web-based survey has the advantage of being able to
apply stricter boundaries in how it allows answers. In traditional mail and e-mail surveys,
respondents can write or type whatever they want in the marginal space of the paper or in
the e-mail reply. The Web-based survey typically does not allow this (other than in an
open-ended question screen) (Schmidt, 1997).
Another benefit of Web-based surveys is the ability to reconstruct the response
process through use of cgi scripts, java applets, and log files (Bosnjak & Tuten, 2001). In
order to log individual response patterns, three conditions must be fulfilled: each question
must be displayed separately (screen-by-screen design), the participants must not be
forced to provide an answer before being allowed to move on (non-restricted design), and
each page of the questionnaire must be downloaded separately from the server, and
should not be allowed to reside in the Web browser’s cache (cache passing pages)
(Bosnjak & Tuten, 2001).
Web-based surveys allow for anonymity in responses, since the respondent can
choose whether to provide his or her name or not (Kiesler and Sproull, 1986). Previous
research (Kiesler and Sproull, 1986) has indicated that anonymity may affect response
rates positively, as respondents may be more willing to respond without fear that their
answers may be identifiable.
Web-based surveys can benefit both survey respondents and administrators
through the use of dynamic or interactive forms (Yun & Trumbo; Houston & Fiore, 1998;
31
Schmidt, 1997). With such forms, feedback can be displayed that is specifically tailored
to the content of the responses supplied by the user, thereby giving the respondent instant
feedback (Yun & Trumbo; Houston & Fiore, 1998; Schmidt, 1997). Depending on the
survey content, it may be desirable to give feedback about the respondent’s individual
results, to provide summary statistics about the results of all respondents to date, or to
present the respondents with a separate, specialized set of questions (Yun & Trumbo;
Houston & Fiore, 1998; Schmidt, 1997). This dynamic presentation method enables the
survey administrator to create interactive surveys; such a process would be difficult, or
impossible with conventional methods because they require special instructions and
actions on the part of the respondent (Yun & Trumbo; Houston & Fiore, 1998; Schmidt,
1997). Actions such as scoring responses, selectively presenting information based on a
set of responses, and selectively presenting survey questions are all tasks that are
perfectly suited to the World Wide Web medium (Yun & Trumbo; Houston & Fiore,
1998; Schmidt, 1997).
A direct transfer from the form to the analysis software can simplify data analysis,
where limited data cleaning would be necessary (McCullough, 1998). A Web site can
dynamically provide statistical results of the survey (even on a daily or hourly basis)
(Yun & Trumbo, 2000; Houston & Fiore, 1998). The administrator’s need for data entry
can be entirely eliminated because survey respondents carry out the task. Time-
consuming data entry errors can be eliminated through automated data checking at the
time of data collection, and administrators have immediate access to data as it is received,
allowing them to track the data collection process (Yun & Trumbo, 2000; Houston &
Fiore, 1998; Schmidt, 1997).
32
Since respondents type in their answers directly to a form on a web page, there is
no need for an interviewer to have contact with the respondents (Schillewaert et al.,
1998). Therefore, survey responses tend to be free from errors caused by interviewers
during data cleaning (McCullough, 1998). Similarly, the lack of an interviewer eliminates
any potential for bias that the interviewer brings to the survey. An interviewer's mood,
prejudices or opinions will not be reflected in the data (McCullough, 1998).
Web-based surveys do present certain limitations (Brennan, Rae, & Parackal,
1999; Houston & Fiore, 1998). Potential limitations include self-selection of survey
respondents, attrition or loss of data; browser incompatibility, multiple responses, and
responses from individuals outside of the selected sample (Brennan et al., 1999; Houston
& Fiore, 1998). Web-based surveys are also vulnerable to malicious data entry (Houston
& Fiore, 1998).
All Internet users do not use the same browsers, and different browsers may not
present images and text on web pages in the same manner (Pitkow and Recker, 1994;
Schillewaert et al., 1998). Some Internet users have only a text-based web browser and
may not be able to respond to a Web-based survey (Pitkow and Recker, 1994;
Schillewaert et al., 1998). However, as browser technology has improved, less than one
percent of all Internet users use a non-graphics capable browser (WebSnapshot.com,
2001).
Another concern with Web-based surveys is that more precise and reliable means
of determining web page access has not been adequately researched (Smith, 1997). Smith
(1977) has suggested the use of a hit counter which tracks the number of times a page is
called from the server; however, these counters do not distinguish repeat from unique
33
visitors, nor do they reflect whether a page is allowed to fully load in the browser.
Perhaps the most valid means of determining an approximate visitor count is log file
analysis, whereby server activity logs are examined for complete page loads and calls
from unique DNS identifiers which effectively discern redundant calls from the same
browser (Smith, 1997). Log files are not perfect because many Internet users are assigned
IP addresses dynamically, which means their DNS identifiers differ from dialup session
to dialup session, and it is possible for the same person to access a page at different times
under two or more completely unique identifiers (Smith, 1997).
Review of the literature provides some suggestions for the methodology and
design of Web-based surveys. Based on a summary of nine Web surveys, Knapp and
Heidingsfelder (1999) showed that increased dropout rates could be expected when using
open-ended questions or questions arranged in tables. Frick, Baechtinger and Reips
(1999) also investigated the effect of the order of topics on the amount of dropping-out in
a web survey. In one condition, personal details were requested at the beginning of the
investigation (socio-demographic data and e-mail address) (Frick et al., 1999). In the
other condition, these items were positioned at the end of the questionnaire (Frick et al.,
1999). Surprisingly, drop-outs were significantly lower in the first condition (10.3 percent
versus 17.5 percent) (Frick et al., 1999). In other words, when personal data were
requested at the beginning, fewer dropouts occurred. While this is contrary to
expectations, it provides valuable information for survey design (Frick et al., 1999).
Research has found that a Web-based instrument, which takes more than 15
minutes to complete, has a very high probability of containing non-response error (that
error caused by questions not answered or instruments not fully completed) (Farmer,
34
1998). Question type has been reported to make a difference in respondent completion
(Farmer, 1998). The best type of survey questions included single response, dichotomous
or multichotomous question, scaled question (nominal ordinal data), and paired
comparison or trade-off (Farmer, 1998).
Salience of an issue to the sampled population has been found to have a strong
positive correlation with response rate for postal, e-mail and Web-based surveys
(Sheehan & McMillan, 1999; Watt, 1999). A single topic may have higher salience to
some sample populations than others (Sheehan & McMillan, 1999; Watt, 1999).
Sheehan (2001) cited previous research that identified university affiliation as a
positive influence on postal mail survey response rates. New ways to create university
affiliation in web-based surveys must be considered (Sheehan, 2001).
In addition to quantitative data collection, there are qualitative data collection
methods that can be applied to the WWW. Examples include virtual focus groups and ad
or product testing (Farmer, 1998; Bauman et al., 1998). The advantages of using the
WWW for qualitative research include responses and tabulations that can be displayed
instantaneously, anonymity that is ensured thereby providing the freedom for individuals
to say exactly what they feel, minimization of dominant participants, and facilitation of
groups among elites who are historically difficult audiences to bring together for this type
of research (Bauman et al., 1998).

35
Survey Response Rates
Table 1 shows the results of a literature review of research concerning mail,
email, and Web-based survey response rates conducted in November 2003. The review
was made to determine proportions to be used for sample size determination. No health
survey studies that were Web-based and used mail notification or solicitation were found
at that time.
Table 1. Response Rates to Mail, Email, and Web Surveys
Author (s)/Survey Type Mail Email Email with email notices
Web Web with mail notices
Bachman et al. (1996) 52.5 65.5
Comley (1996) 3 31.4 45.0 1.0
Couper et al. (1997) 2 71.0 43.0
Kiesler & Sproull (1986) 67.0 75.0
Kittleson (1995) 76.5 28.1
Mehta & Sivadas (1995) 56.5 54.3
Parker (1992) 38.0 68.0
Schaefer & Dillman (1998) 57.5 58.0
Schillewaert et al. (1998) 31.0 0.7
Schuldt & Totten (1994) 56.5 19.3
Sheehan & Hoy (1997) 47.2
Sheehan & Hoy (1999) 24.0
Smith (1997) 8.0 11.3
Swoboda et al. (1997) 1 21.0
Tse, et al. (1995) 27.0 6.0
Walsh et al. (1992) 76.0
Weible & Wallace (1998) 35.7 29.8 32.7
Yun & Trumbo (2000) 70.4 14.4 15.2
Mean response rates 51.6 39.8 28.2 16.7 8.1
36
The table identifies two studies that used mail-solicited participation in Web-
based surveys (Yun & Trumbo, 2000; Comley, 1996). The first study surveyed a list of
magazine subscribers and reported only a one percent response rate (Comley, 1996). In a
second study, members of the National Association Science Writers were surveyed. This
survey reported a 15.2 percent response rate (Yun & Trumbo, 2000). The mean response
rate for the mail solicited Web-based surveys identified in Table 1 was 8.1 percent. The
mean response rate for Web-based surveys without notification was 16.7 percent,
representing a mean difference of 8.6 percent. Table 2.1 also identifies the mean response
rate for studies that used mail survey methods. The mean response rate for mail surveys
identified in Table 1 was 51.6 percent.
Social Marketing
Marketing is based on the theory of exchange, which puts forth that individuals,
groups, and organizations have resources that they are willing to exchange for perceived
benefits (Novelli, 1990; Syre and Wilson, 1990). Although the objectives of social
organizations differ from those of profit-motivated groups, the principles of marketing
involve similar processes (Novelli, 1990, Syre & Wilson, 1990). The essential marketing
model of creating voluntary exchanges with carefully targeted marketing strategies
remains valid (Novelli, 1990, Syre & Wilson, 1990). Increasingly, the principles and
practices of marketing are being successfully applied to social change programs (Novelli,
1990). In the forefront of this trend to initiate health-related social change programs are
health organizations, including federal agencies, state and local health departments, non--
profit voluntary agencies, hospitals, and clinics (Novelli, 1990).
Syre and Wilson (1990) have identified five distinct functions of the marketing
37
process as they relate to the health care field. These include: using marketing research to
determine the needs and desires of present and prospective clients from the target
population, developing a product that satisfies the needs and desires of the clients,
developing informative and persuasive communication flows between those offering the
program and clients, ensuring that the product is provided in the appropriate form, at the
right time and place, and at the best price, and keeping clients satisfied and loyal after the
exchange has taken place (Syre and Wilson,1990).
The application of commercial marketing technologies to the analysis, planning,
execution, and evaluation of programs designed to influence the voluntary behavior of
target audiences in order to improve their personal welfare and that of their society is
termed social marketing (Kotler & Roberto, 1989). Numerous studies have shown that
social marketing can be a pragmatic, affordable, and systematic method that yields results
(Novelli, 1990). It contributes to successful health and social interventions (Novelli,
1990). Examples of the effective use of social marketing programs include the National
High Blood Pressure Education Program (National Heart, Lung, and Blood Institute,
1984), "Break Free" - the National Program To Reduce Tobacco Use (Mintz, 2001a),
"Really Me" - Action on Drug Abuse (Mintz & May, 2001), and ENABL - the California
State's teen pregnancy prevention program (Mkt4change.com, 1999).
The total cost of adopting a social idea or practice often goes beyond the
monetary price alone (Novartis Foundation for Sustainable Development, 2001; Bright,
2000; Lefebvre & Flora, 1988). In addition to economic costs, there are social,
behavioral, psychological, temporal, structural, geographic, and physical reasons for
exchanging or not exchanging (Novartis Foundation for Sustainable Development, 2001;
38
Bright, 2000; Lefebvre & Flora, 1988). Reducing such costs and creating incentives to
adopt and maintain the new idea or practice over time is a central task of social marketing
(Novartis Foundation for Sustainable Development, 2001; Bright, 2000; Lefebvre &
Flora, 1988).
The Marketing Mix
Strategies designed to effect behavior change through social marketing comprise
all four elements of the traditional marketing mix (Bright, 2000; McKenzie & Smelter,
1997). These four elements, often termed the four Ps, are product, price, place, and
promotion (Bright, 2000; McKenzie & Smelter, 1997).
Product refers to the actual program being planned and implemented (Weinrich,
1999, McKenzie & Smelter, 1997). A product may be a tangible object or outcome such
as physical products, services, or practices, as well as more intangible ideas such as ideas,
attitudes, and lifestyle changes (Weinrich, 1999; McKenzie & Smeltzer, 1997).
Price refers to what the consumer must do in order to obtain the social marketing
product (Bright, 2000; Weinrich, 1999; McKenzie & Smelter, 1997). This cost may be
monetary, or it may instead require the consumer to give up intangibles, such as time or
effort, or to risk embarrassment and disapproval (Weinrich, 1999; McKenzie & Smelter,
1997).
Place describes the way that the product reaches the consumer (Bright, 2000;
Weinrich, 1999; McKenzie & Smelter, 1997). Promotion consists of the integrated use of
mass media advertising, public relations, promotions, and media advocacy (Weinrich,
1999). The place or placement of the product may be thought of as its distribution
(McKenzie & Smelter, 1997). By determining the activities and habits of the target
39
audience, as well as their experience and satisfaction with the existing delivery system,
researchers can pinpoint the most ideal means of distribution for the offering (McKenzie
& Smelter, 1997). Another element of place is deciding how to ensure accessibility of the
offering and quality of the service delivery (McKenzie & Smelter, 1997). The timing of a
program is closely associated with its placement (McKenzie & Smelter, 1997). Social
marketing program planners should be concerned about placing their program in a
desirable locale at the best possible time (McKenzie & Smelter, 1997).
Promotion consists of the integrated use of mass media advertising, public
relations, promotions, and media advocacy (Weinrich, 1999). Promotional aspects should
be both informative and persuasive, and take into consideration the need for segmentation
of the target population when promoting the program (McKenzie & Smelter, 1997).
Promotion can be thought of as advertising the program (McKenzie & Smelter, 1997).
The Social Marketing Process
The social marketing process is circular, or iterative (National Cancer Institute,
1992; Novelli, 1990). Novelli (1990) has identified aspects of the social marketing
process including analysis, planning, development testing and refinement,
implementation, assessment, and feedback (National Cancer Institute, 1992; Novelli,
1990).
Analysis in social marketing is first applied to the marketplace itself (Novelli,
1990). It is important to know how the current market is structured and how current
products compare with the (Bright, 2000; McKenzie & Smelter, 1997; Novelli, 1990). A
second target of social marketing analysis is the consumer who is involved in the
marketing exchange (Bright, 2000; McKenzie & Smelter, 1997; Novelli, 1990). Data on

40
demographic and geographic characteristics are usually the easiest to gather (Novelli,
1990). Other consumer attributes examined may include life-style and behaviors (Bright,
2000; McKenzie & Smelter, 1997; National Cancer Institute, 1992; Novelli, 1990).
Consumers may be analyzed according to the benefits they are seeking and their user or
behavior status (Novelli, 1990). Media patterns of target audiences are important traits for
social marketing analysis (Kotler & Roberto, 1989).
The planning phase must result in clear, specific directions for action (Novelli,
1990). Once objectives have been set and the analysis completed, strategies can be
devised for each element in the marketing mix (Novelli, 1990). The first of these is the
product, or offering (Novelli, 1990). Product strategy decisions involve the selection of
product characteristics (Novelli, 1990). While it is often difficult to alter the product in
social change programs to meet consumer expectations, it may be possible to shape some
attributes of the offering that affect consumer perceptions (Novelli, 1990).
Distribution strategies are also part of social marketing planning (Novelli, 1990).
The channels for disseminating the offering to the target market may be direct or may
utilize intermediaries (Novelli, 1990). Another aspect of developing a distribution
strategy is to determine the place at which the offering will be made available to the
consumer (Novelli, 1990).
Price strategies often involve understanding the consumers’ perceptions of
monetary, psychic, energy, and time costs (Novelli, 1990). Decisions must be made on
how to reduce these costs and/or otherwise facilitate adoption of the behavior being
promoted (Novelli, 1990).
A solid communication strategy should contain the primary benefits that the target

41
consumer can expect, supporting points to bolster the promised benefits, the specific
action the consumer is encouraged to take, and the tone or image of the communication
that is to be conveyed over time (Novelli, 1990). It should also establish the tactics for
program advertising, public relations, direct marketing, promotion, and face-to-face
communication (Novelli, 1990).
The next step in the social marketing process is product concept development and
testing (National Cancer Institute, 1992; Novelli, 1990). Pretesting provides direction for
improving the impact of the message being conveyed (Novelli, 1990). Methods for doing
this include focus groups and interviews (Baumgartner, & Strong, 1998). After the
selected concepts are transformed into full messages they are pretested in nearly final
form to assess the target audience’s comprehension and reaction (Novelli, 1990).
Once these elements have been completed the social marketing program is
implemented (National Cancer Institute, 1992; Novelli, 1990). During and throughout
implementation, the marketplace and distribution channel performance should be
monitored (Novelli, 1990).
As implementation proceeds, a systematic assessment of the social marketing
plan’s effectiveness helps to determine what changes should be made during and
following the program (Novelli, 1990). The purpose of the social marketing program is to
gather, process, and report timely, adequate, and accurate data for marketing decision-
making (Novelli, 1990).
Finally, all information is collected and reviewed to uncover problems, disclose
weaknesses, and identify marketing opportunities (Novelli, 1990). This information is
used to refine and improve the initial social marketing program and plan (Novelli, 1990).
42
Audience Segmentation
The starting point of social marketing is getting to know the target audience
thoroughly through market research (Novartis Foundation for Sustainable Development,
2001). This includes social and demographic makeup, psychosocial features, and needs
(Novartis Foundation for Sustainable Development, 2001). Social marketing also
underscores the importance of strategically delivering programs that overcome the
barriers to a target group’s engaging in a particular behavior (McKenzie-Mohr, 2000).
The key to developing a marketable product is knowing as much as possible about
the target population (Bright, 2000; McKenzie & Smelter, 1997). By describing the
population, one can divide the population based upon certain characteristics, a process
called audience or market segmentation (Bright, 2000; McKenzie & Smelter, 1997).
Audience segmentation has two major goals: 1) to define homogeneous subgroups for
message and product design purposes, and 2) to identify segments that will target
distribution and communication channel strategies (Sabogal, 1996; Lefebvre & Flora,
1988).
The segmentation of groups of people may occur initially by examining
demographic variables (Lefebvre & Flora, 1988). Groups may also be segmented on the
basis of a relevant model or theory (Lefebvre & Flora, 1988). Additionally, segmentation
may also be conducted with the target population after surveying and collecting data (a
posteriori) (Lefebvre & Flora, 1988).
Describing the characteristics of the target audience involves considering all of
the physical, demographic, and psychographic characteristics of the people you are trying
to reach to help divide "the public" into more manageable groups or target audiences
43
(National Cancer Institute, 1992). Physical characteristics include sex, age, health history
of family, and type and degree of exposure to health risks, medical conditions, disorders,
and illnesses (National Cancer Institute 1992). Behavioral characteristics include media
exposure, membership in organizations, health-related activities, and other lifestyle
characteristics (National Cancer Institute, 1992). Demographic characteristics include
occupation, income, educational attainment, family situation, places of residence and
work, and cultural characteristics (National Cancer Institute, 1992). Psychographic
characteristics include attitudes, opinions, beliefs, values, self-appraisal and other
personality traits (National Cancer Institute, 1992). The more complete a profile or
description that can be developed of the target audience, the better the program which can
be developed that is suited to them (National Cancer Institute, 1992).
Promotional Messages
Materials should be developed based on the literacy levels of the target audience
(Sabogal, 1996; National Cancer Institute 1992). Promotional messages should
emphasize clarity in content and delivery (Sabogal, 1996; National Cancer Institute
1992). For the message to be successful the target audience must trust it. Media messages
must convey legitimacy and credibility to the audience and should be stressed and
repeated through various channels (Sabogal, 1996). The message must be relevant and
useful to the audience for it to be absorbed (Sabogal, 1996). As much as possible,
messages should be consistent in the information conveyed across the communication
channels (Sabogal, 1996).
Chaiken and Eagly (1976) found that complex messages were presented more
effectively in written form than in audio or video forms (Bernhardt, 2001). A related
44
advantage of printed (and some electronic) materials is that they allow the receivers to
control the pace at which the message is reviewed (O’Keefe, 1990).
The message may be a single item, or the program and budget may call for a
range of message-related materials (National Cancer Institute 1992). All messages in all
the media chosen should reinforce each other and follow the communications strategy
(National Cancer Institute 1992). The style being used should be echoed in all campaign
elements (National Cancer Institute 1992).
Design guidelines for social marketing promotional messages have been
identified. Promotional messages must provide information clearly and accurately to limit
misunderstandings (Sabogal, 1996; National Cancer Institute 1992). Unnecessary
information should be eliminated and clinical, technical, and complicated terminology
should be avoided (Sabogal, 1996; National Cancer Institute 1992). With print materials,
use the same or compatible colors, types of illustrations, and typefaces throughout the
campaign (National Cancer Institute 1992). Use illustrations to gain attention and aid
understanding and recall; make sure they reinforce, and don't compete, with your
message (National Cancer Institute 1992). Use captions, headlines, and summary
statements for additional reinforcement (National Cancer Institute 1992).
Promotional Channels
Channel refers to the medium or means through which messages can be
communicated to the target audience (Bernhardt, 2001). Common channels for health
promotion materials include printed materials, promotional materials, audio or video
materials, and electronic materials (Bernhardt, 2001).
As a rule, the communication channels selected should be ones the target
45
audience comes into contact with on a regular basis (Novartis Foundation for Sustainable
Development, 2001). The target audience should also perceive the channel as being
credible, since familiarity with a medium and with the components makes it easier to get
the message accepted (Novartis Foundation for Sustainable Development, 2001). The
message should also make the target groups feel they are being personally addressed and
taken seriously, with due respect to their human dignity and their private sphere (Novartis
Foundation for Sustainable Development, 2001).
Determining the most appropriate channel for any specific material should be
based on the objectives of the intervention and the characteristics of the target audience
(Bernhardt, 2001). Print-based channels may be most appropriate for complex messages
such as detailed instructions or resource lists but may not be appropriate for audiences
with low literacy levels (Bernhardt, 2001). Promotional channels may be most
appropriate as message reinforcements or reminders when combined with other channels
and messages (Bernhardt, 2001). Audio and video materials may be most appropriate for
low literacy audiences and for simple messages with wide reach, but often are expensive
to produce and disseminate (Bernhardt, 2001).
Electronic materials can include the strengths of many of the other channels and
can incorporate elements such as interactivity, tailoring, and multimedia, but they may be
expensive to produce and maintain and may not be accessible to all target audience
members (Bernhardt, 2001). The new technology of the Internet and the World Wide
Web offer untested potential as a message channel.
Mass media have been suggested as the most important channel for creating
awareness of social products as well as for distributing non-tangible products (Novartis

46
Foundation for Sustainable Development, 2001). However, the impact of mass media
may be temporary and so the message should be periodically repeated to reinforce it
(Novartis Foundation for Sustainable Development, 2001).
When presenting written material, it is important that print materials are easy to
read and understand (National Cancer Institute 1992). The way the message is presented,
the writing style, vocabulary, typography, layout, graphics, and color can favorably affect
whether it is read and understood (National Cancer Institute, 1992). Text should be
introduced, stating the purpose, presented in short sentences within short paragraphs, and
with visuals placed to emphasize key points and text (National Cancer Institute, 1992).
Major points should be summarized; bullets and titles or subtitles should be used to
reinforce important points; and messages should be written in the active, not passive,
voice (National Cancer Institute, 1992). Key text should be underlined, boldfaced, or
"boxed" for reinforcement, clarified with the use of examples, tested for readability, and
evaluated by an audience (National Cancer Institute, 1992). Avoid jargon, technical terms
or phrases, abbreviations and acronyms (National Cancer Institute, 1992).
Text that is easy to read and graphics that help the reader understand and
remember the text are valuable aids to conveying the message (National Cancer Institute
1992). Graphics should be immediately identifiable, relevant to the subject matter and
reader, simple, uncluttered and used to reinforce (National Cancer Institute 1992). Try to
avoid small type (less than 10-point), lines of type that are too long or too short, large
blocks of print, "justified" right margins, photographs that won't reproduce well, and less
than professional-quality drawings; and technical diagrams should be avoided (National
Cancer Institute 1992).

47
Posters and media spots may become monotonous such that the target groups no
longer even notice the message (Novartis Foundation for Sustainable Development,
2001). This suggests that the promotional campaign should be changed from time to time
(Novartis Foundation for Sustainable Development, 2001).
Effective promotional messages and channels can be effectively developed by
using qualitative interviews with members of the target population (Baumgartner, &
Strong, 1998; Hoepfl, 1997). Using the information gathered from interviews, the
messages and channels can then be pretested in nearly final form to assess the target
audience’s comprehension and reaction (Novelli, 1990).
Challenges to Social Marketing Programs
Challenges to social marketing have been identified (Novelli, 1990). These
include access to secondary consumer information, inability to identify key market
segments, difficulty adjusting program offerings, difficulty formulating simple,
meaningful product concepts, and lack of data concerning consumers’ perceptions of
pricing options (Novelli, 1990). Communications problems such as inability to acquire
paid advertising due to economic or policy issues and pressure not to use certain types of
communication appeals may affect the implementation of social marketing programs
(Novelli, 1990).
Measuring effectiveness is difficult for social marketing programs since
immediately quantifiable measures such as morbidity and mortality typically cannot be
assessed right away (Novelli, 1990). As a result, intermediate measures such as changes
in knowledge, awareness, or behavior are used, but may not indicate whether the long-
term goals have been reached (Novelli, 1990)
48
The issue of ethics is becoming more and more a factor in the development of
social marketing programs (Mintz, 2001b). Social marketers have to weigh diverse and
often conflicting values (Mintz, 2001b). The idea that social marketing campaigns have
to incorporate ethical questions and perhaps pursue ethical evaluations is a relatively new
concept (Mintz, 2001b). Social marketers must apply three different ethical criteria: the
ethical consequence of a program's impact; the rightness or desirability of the program's
objectives; and. selection of means to achieve the program's objectives (the means - end
ethical issue) (Mintz, 2001b).
Behavioral Risk Factor Surveillance System
The purpose of the BRFSS is to collect uniform, state-based data on preventive
health practices and risk behaviors that are linked to chronic diseases, injuries, and
preventable infectious diseases that are the leading causes of morbidity and mortality in
the U.S. population (Frederick, Bloom, Figgs, Baker, & Dugbatey, 2000; BRFSS User’s
Guide, 2001). Data are collected through monthly telephone interviews conducted among
a sample of each state’s adult population. When aggregated, the data show the prevalence
of risk behaviors and preventive health practices on an annual basis (Frederick et al.,
2000; BRFSS User’s Guide, 2001).
The goal was for states to collect, analyze, and interpret locally relevant data on
risk behaviors and preventive health practices for use in planning, implementing, and
measuring the progress of their risk-reduction programs and for developing appropriate
policies and legislation (BRFSS User’s Guide, 2001). The BRFSS data have been used to
identify emerging health issues, document health trends, compare health behaviors across
states, and measure progress toward health goals (Centers for Disease Control, 2001a).

49
The BRFSS data provides data that are used for assessing risk for chronic diseases,
identifying demographic differences, measuring trends in health-related behaviors,
designing and monitoring health intervention and services, addressing emergent and
critical issues, formulating policy and proposing legislation for health initiatives, and
measuring progress toward achieving state and national health objectives (Centers for
Disease Control and Prevention, 2001a).
Now active in all 50 states, the BRFSS is the primary source of information on
major health risk behaviors among Americans (Centers for Disease Control and
Prevention, 2001b). States use standard procedures to collect data through a series of
monthly telephone interviews with U.S. adults (Centers for Disease Control and
Prevention, 2001b). State and local health departments rely heavily on data from the
BRFSS to determine priority health issues and identify populations at highest risk,
develop strategic plans and target prevention programs, monitor the effectiveness of
intervention strategies and progress toward achieving prevention goals as well as educate
the public, the health community, and policy makers about disease prevention, and
support community policies that promote health and prevent disease (Centers for Disease
Control and Prevention, 2001b).
In addition, BRFSS data enable public health professionals to monitor progress
toward achieving the nation's health objectives outlined in Healthy People 2010 (Centers
for Disease Control and Prevention, 2001b). BRFSS information is also used by
researchers, voluntary and professional organizations as well as managed care
organizations to target prevention efforts (Centers for Disease Control and Prevention,
2001b).
50
The BRFSS is flexible enough to satisfy individual state needs while also meeting
information needs at the national level. Several benefits of the BRFSS for states have
been identified (Centers for Disease Control and Prevention, 2001b).
These include the ability to analyze data by a variety of demographic variables,
examine trends over time, readily address urgent and emerging health issues, and
examine the effects of programs (Centers for Disease Control and Prevention, 2001b).
Additional benefits include quick response to needed changes in tracking immediate
concerns and state-to-state comparability (Centers for Disease Control and Prevention,
2001a).
BRFSS Questionnaire Design
The BRFSS questionnaire has five sections: the fixed core, two rotating modules,
optional modules, emerging core questions, and state-added questions (Centers for
Disease Control and Prevention, 2001a). The fixed core questions are asked by all states
every year and include questions about health insurance, routine checkups, diabetes,
smoking, pregnancy, women’s health, HIV/AIDS, and demographics (Centers for
Disease Control and Prevention, 2001a). Rotating core questions include two sets of
questions with each set being asked in alternating years (Centers for Disease Control and
Prevention, 2001a). The odd-numbered year rotating core includes questions on
hypertension, injuries, alcohol use, vaccinations, colorectal screening, and cholesterol
(Centers for Disease Control and Prevention, 2001a). Even-numbered year rotating core
include questions on physical activities, fruit and vegetable consumption, and weight
control (Centers for Disease Control and Prevention, 2001a).
Optional module questions are asked based on the needs of the individual states,
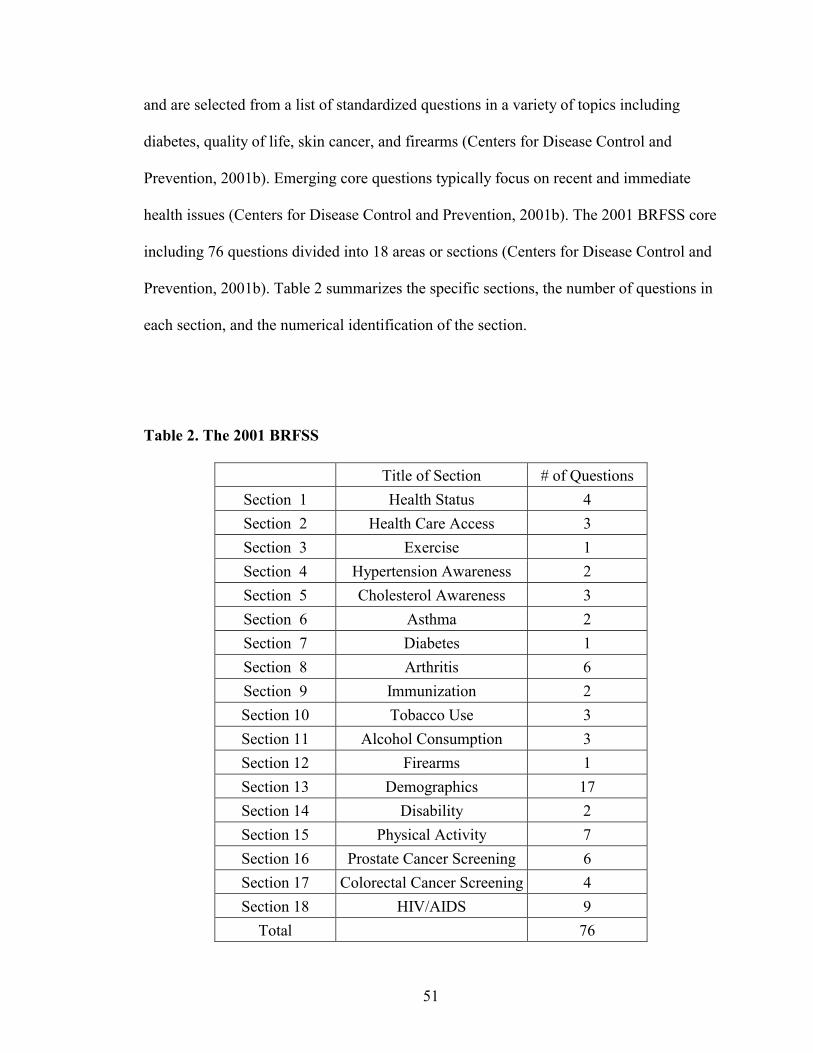
51
and are selected from a list of standardized questions in a variety of topics including
diabetes, quality of life, skin cancer, and firearms (Centers for Disease Control and
Prevention, 2001b). Emerging core questions typically focus on recent and immediate
health issues (Centers for Disease Control and Prevention, 2001b). The 2001 BRFSS core
including 76 questions divided into 18 areas or sections (Centers for Disease Control and
Prevention, 2001b). Table 2 summarizes the specific sections, the number of questions in
each section, and the numerical identification of the section.
Table 2. The 2001 BRFSS
Title of Section # of Questions
Section 1 Health Status 4
Section 2 Health Care Access 3
Section 3 Exercise 1
Section 4 Hypertension Awareness 2
Section 5 Cholesterol Awareness 3
Section 6 Asthma 2
Section 7 Diabetes 1
Section 8 Arthritis 6
Section 9 Immunization 2
Section 10 Tobacco Use 3
Section 11 Alcohol Consumption 3
Section 12 Firearms 1
Section 13 Demographics 17
Section 14 Disability 2
Section 15 Physical Activity 7
Section 16 Prostate Cancer Screening 6
Section 17 Colorectal Cancer Screening 4
Section 18 HIV/AIDS 9
Total 76
52
BRFSS Methodology
The methodology of the BRFSS includes sampling people aged 18 and over who
are randomly called and asked to take part in the survey (Centers for Disease Control and
Prevention, 2001a). It is completely anonymous (Centers for Disease Control and
Prevention, 2001a). Questions focus on health behaviors related to leading causes of
death (Centers for Disease Control and Prevention, 2001a). The nationwide survey items
remain relatively constant from year to year and the state specific questions are changed
quickly to track changing health concerns (Centers for Disease Control and Prevention,
2001a).
Phone numbers are randomly selected throughout the state (Centers for Disease
Control and Prevention, 2001a). Business and non-working numbers are omitted (Centers
for Disease Control and Prevention, 2001a). Individuals age 18 years and older are
randomly selected from each household (Centers for Disease Control and Prevention,
2001a). Most interviewers use computer-assisted telephone interviewing (CATI) (Centers
for Disease Control and Prevention, 2001a). Responses are entered directly into the
computer by interviewers (Centers for Disease Control and Prevention, 2001a). The
standardized CATI interview takes 10 to 20 minutes (Centers for Disease Control and
Prevention, 2001a).
States make calls seven days a week (Centers for Disease Control and Prevention,
2001a). Each completes between 125 and 625 interviews a month (Centers for Disease
Control and Prevention, 2001a). This represents more than 150,000 completed interviews

53
each year (Centers for Disease Control and Prevention, 2001a).
Most states use the disproportionate stratified sample method (Centers for Disease
Control and Prevention, 2001a). BRFSS data are directly weighted for the probability of
selection of a telephone number, the number of adults in a household, and the number of
phones in a household (Centers for Disease Control and Prevention, 2001e). Almost all
projects use a design in which the probability of selection of a number is constant within
a stratum, a discrete subset of telephone numbers from which samples are drawn
independently of the samples in other strata, but varies between strata (Centers for
Disease Control and Prevention, 2001e).
Most projects use a design in which telephone numbers are assigned to a stratum
that is either presumed to contain many households (a high density stratum) or to a
stratum that is presumed to contain few households (a low density stratum) (Centers for
Disease Control and Prevention, 2001e). The high-density stratum is then sampled at a
higher rate than the low-density stratum, usually at a 4:1 ratio (Centers for Disease
Control and Prevention, 2001e).
The weights for number of adults in a household and number of phones are
needed because there is a need to make statistically valid inferences about individuals but
we are sampling telephone numbers (Centers for Disease Control and Prevention, 2001e).
Because only one person per household is interviewed, respondents in larger households
have a smaller probability of selection than respondents in smaller households (Centers
for Disease Control and Prevention, 2001e).
The value for each of the weighting factors is determined by the sample design
used, is precisely calculable, and makes no assumptions about missing respondents
54
(Centers for Disease Control and Prevention, 2001e). Two other factors are determined
by the outcome of the data collection process: attempts to estimate missing values and the
assumption that missing respondents are, on the average, just like the respondents in the
sample (Centers for Disease Control and Prevention, 2001e). Although this assumption
is, strictly speaking, unlikely to be true, the assumption is that the adjustment gets the
data closer to the true value (Centers for Disease Control and Prevention, 2001e).
Use of BRFSS Data
The BRFSS is available to public health groups both publicly and privately
funded (Frederick et al., 2000). Many of these groups were aware of the BRFSS but were
not aware of the extent and specificity of the data collected (Frederick et al., 2000). The
data from the BRFSS were not accessible by all, especially small state and local health
organizations (Frederick et al., 2000). The timeliness of the data when made available
was questioned (Frederick et al., 2000). The most frequent uses of the BRFSS data
included public health education, establishment of prevalence estimates and trend
analysis, community needs assessments and program planning, support of policy efforts,
and as an evaluation tool (Frederick et al., 2000).
Barriers to the use of BRFSS data have been identified and included the lack of
analytical abilities among group professionals, limited access to subgroup and/or
regional data, survey methodology, question variables, and survey
construction.(Frederick et al., 2000).
Concerns over the limitations of the BRFSS telephone surveying methodology
have been expressed (Frederick et al., 2000). These concerns were based predominantly
on the use of self-reported data, the response rate, and the lack of telephone coverage in
55
certain populations of interest (Frederick et al., 2000). Periodic non-household surveying
has been suggested as a complement to the current methodology of the BRFSS (Frederick
et al., 2000).
Validity and Reliability of the BRFSS
Studies examining the reliability and validity of general BRFSS risk and
demographic factors have been reported (Centers for Disease Control, 2001c). Brownson,
Jackson-Thompson, Wilkerson, & Kiani (1994) studied core BRFSS subjects of HTN,
Diabetes, BMI, smoking status, mammography, pap tests, mammography, and digital
rectal examination. Individual level reliability estimates for demographics, chronic
conditions, and risk factors were high (Kappa values 0.82-1.00) (Brownson et al., 1994).
A 1992 reliability study of multiple BRFSS questions from a statewide sample
found no statistically significant differences for prevalence estimates for any
demographic or risk factors (Stein, Lederman, Shea, 1993). Individual level reliability
was >0.70 for nearly all risk factors in all populations (Stein et al., 1993). Reliability for
demographics were slightly lower among minorities than among whites but still high (>
0.60) (Stein et al., 1993).
Shea, Stein, Lantigua, & Basch (1991) found prevalence rates were highly
consistent among Blacks, White, and Hispanics (Shea et al., 1991). Individual test-retest
reliability were high (>.60) among 19 demographic and risk factors, intermediate (0.40-
0.76) for food consumption measures, and low routine checkup and blood pressure
checks in the past two years (0.54 and 0.23, respectively) (Shea et al., 1991).
Gentry, Kalsbeek,, Hogelin, Jones, Gaines, Forman, & Marks (1985) compared
the pooled BRFSS estimates on alcohol, smoking, overweight, hypertension, and safety

56
belt use with national estimates from 1979 NIAAA study on alcohol, 1979 NHLBI
survey, 1979 National survey of Personal Health Practices and Consequences, 1980
NHIS (Gentry et al., 1985). The BRFSS estimates were found to be very close to national
estimates for all risk factors except for safety belt use (Gentry et al., 1985).
Studies that examined the reliability and validity of specific questions and/or
module of the BRFSS have also been identified (Centers for Disease Control, 2001c).
The Centers for Disease Control and Prevention provides a bibliography of 31 articles
related to studies of the validity and reliability of self-reported data on the BRFSS
(Centers for Disease Control and Prevention, 2001f). A second CDC publication
identifies and describes these 31 methodological studies of the Behavioral Risk Factor
Surveillance System in detail (Centers for Disease Control and Prevention, 2001c).
A reliability and validity study using 1989- 90 BRFSS male and female
respondents in upstate New York for CVD risk factors was conducted by Bowlin,
Morrill, Nafziger, Lewis, & Pearson (1996). Reliability of estimates was high (>0.60) for
the questions, “ ever told your BP is high”, “are you a current smoker”, “what is the
number of cigarettes per day you smoke”, “do you have diabetes”, “the ever had
cholesterol checked”, “are you trying to lose weight”, “your weight”, “your height”, and
“time since your last checkup” (Bowlin et al., 1996). Reliability was lower (<0.50) for the
question “is your hypertension under control and what are the numeric values for blood
pressure” (Bowlin et al., 1996).
In a 1992 study of reliability of women’s health questions on the BRFSS were
compared to those from a statewide sample. The study examined the reliability of BRFSS
questions on mammography, clinical breast exam, pap tests, hysterectomy, and
57
pregnancy status (Stein al., 1996). Reliability measures exceeded 80 percent for all areas,
ranging from 81 percent for the time interval since last mammogram to 97 percent for the
forever had a pap test (Stein et al., 1996).
Smith, Remington, Williamson, & Anda (1990) compared state self- reported
alcohol prevalence with state alcohol consumption data from the 1985 BRFSS.
Correlation coefficients between BRFSS and alcohol consumption data were generally
high, 0.81 for per capita alcohol consumption, 0.74 for chronic drinking, 0.51 for
drinking and driving (Smith et al., 1990).
Numerous other studies have examined validity and reliability of the BRFSS
modules (Centers for Disease Control and Prevention, 2001c). These includesuch topics
as safety belt use (Robertson, 1992), cardiovascular disease (Jackson, Jatulis, &
Fortmann, 1992), nutrition (Smith-Warner, Elmer, Fosdick, Tharp, & Randall, 1997),
quality of life (Newschaffer, 1997), and smoking (Anda, Williamson, Dodson, &
Remington 1989).
Summary
Health surveys are the most common method of health surveillance (Pealer et al.,
2001; Sarvela & McDermott, 1999). The current methods for health survey data
collection are being increasingly augmented or replaced by computer-assisted data
collection methods including Web-based health surveys (Pealer & Weiler, 2003;
McCabe, et al., 2002; Bason, 2000; Cohen, 2000).
Web-based surveys present certain methodological problems including low or
unmeasurable response rates and lack of representativeness. Social marketing may
provide a method for improving response rate on the Web-based health survey.
58
Application of social marketing strategies and methods may provide a framework for
improving response rates on the Web-based health survey
This chapter provided support for the rationale for the study, as well as for the
theoretical foundation of the study. This chapter included an overview of health
surveillance, an overview of health survey research methods, an examination of
computer-based and World Wide Web-based survey research methods, a review of social
marketing research, and an overview of the Behavioral Risk Factor Surveillance System
(BRFSS).
59
CHAPTER III - METHODS
Introduction
This study examined the impact of social marketing on a Web-based Behavioral
Risk Factor Surveillance Survey (WBRFSS). Through the application of social marketing
this study sought to increase the response rate, decrease response time, increase item
completion rate as well as generate an explanatory model of response on the WBRFSS.
The process of social marketing addresses the elements of the marketing mix
including product, price, place, and promotion (Bright, 2000; Weinrich, 1999; McKenzie
& Smelter, 1997; Novelli, 1990). The product of this study was the WBRFSS. The price
of this study was the time and effort that the participant expended to complete the survey.
The WBRFSS was placed on the World Wide Web for access and participation. Various
strategies were developed to promote the WBRFSS.
Research Hypotheses
This study attempted to develop promotional message (s) and channels that
improved participant response for the students at Howard Community College. This
study tested the following research hypotheses:
1) The response rate on the Web-based Behavioral Risk Factor Surveillance
Survey will be higher in the group that was exposed to a social marketing
campaign than the one that was not.
2) The response time on the Web-based Behavioral Risk Factor Surveillance
Survey will be lower in the group that was exposed to a social marketing
campaign than the one that was not.
60
3) The item completion rate will be higher on the Web-based Behavioral Risk
Factor Surveillance Survey in the group that was exposed to a social
marketing campaign than the one that was not.
4) An explanatory model will be fitted that explains response on the Web-
based Behavioral Risk Factor Surveillance Survey from selected
independent variables.
Study Variables
This study had one independent variable: exposure to the social marketing
campaign. This study’s dependent variables included response rate, response time, and
item completion rate. Response rate was defined as the percentage of individuals in the
study sample who completed and submitted the WBRFSS. Response time was defined as
the amount of time, in hours, it took respondents to receive the study’s mail solicitation,
access the WBRFSS, and complete it. Item completion rate was defined as the total
number of items completed by a respondent divided by the total number of items on the
WBRFSS.
Study Design
Both qualitative and quantitative methods were used to collect and interpret data.
For the purposes of this study, qualitative methods were used to help in formative
development of components of the social marketing campaign. Qualitative methods were
also used to help interpret the findings from the quantitative study.
Quantitatively, this study used an experimental, posttest-only control group
design with random selection of the sample and random assignment to control and
treatment groups. Randomization was used to ensure the equalization of the two groups,

61
without a pretest (Cook and Campbell, 1979; Sarvela and McDermott, 1993). The post-
test only design can be depicted in the following way:
R X O1
R O2
X represents the exposure to social marketing, O represents the WBRFSS, and R
represents random assignment
Study Population
The study population included students enrolled in credit classes at Howard
Community College (HCC) in Columbia, Maryland during the Spring, 2003 semester.
Howard Community College enrolls approximately 5500-6000 undergraduate freshman
and sophomore-level students. As a two-year institution of higher education, HCC offers
a variety of associate-level degrees. HCC also offers industry and technology
certifications, program certifications, and letters of recognition in various areas.
HCC provides 114 student-accessible computers with high-speed Internet
connections in a variety of counties of residence around its campus. The on-campus
Student Computer Lab contains 64 windows-based PC-type computers. The Learning
Resources Center houses another 22 windows-based PC-type computers, including two
for physically- and/or visually challenged individuals. A student cyber-café located in the
college galley includes 10 windows-based computers. Finally, the Macintosh Computer
Lab maintains 18 Macintosh-based computers.
62
Study Procedures
IRB Approval
Approval for this study was obtained from the University of Maryland, College
Park Institutional Review Board. Appendix A presents the IRB approval letter.
Semi-Structured Interviews
Semi-structured interviews (SSI) were used as the first step in developing the
social marketing campaign for this study. All interviews were conducted with this
researcher acting as interviewer. Students were conveniently sampled at common areas
around the Howard Community College campus. These included the cafeteria, the
galleria, the athletic and fitness building, and the learning resources center. An attempt by
this researcher was made to sample a diversity of students in terms of age, sex, and
ethnicity.
Potential participants were given a verbal invitation to take part in an interview
with this researcher. An introduction and explanation of the purpose of the interview was
given to the student (Appendix C). Students were told that participation was voluntary,
that all information was confidential, and that he/she could stop the interview at any time.
The student was then given the opportunity to accept or decline participation.
If the student agreed to participate, an informed consent (Appendix B) was
obtained in writing. A series of questions were posed to each of the interview participants
(Appendix C). Interview questions fell into four categories established for social
marketing campaigns promotions; included promotional channels, promotional design,
barriers to participation, and methods for improving participation.
63
Responses were recorded in written notation. Where necessary, the interviewer
expanded on the question content to gather further information. Student names were not
associated with their answers.
Student participants continued to be interviewed until the overall content of the
responses became redundant. The results of the interviews were placed into one of the
four categories and frequencies for each response determined. The frequencies were then
used to develop an online questionnaire that assisted in further refining the study
procedures and establishing the social marketing program.
Promotional Component Questionnaire
Information gathered from the SSI was used to develop a Web-based promotional
component questionnaire that identified 1) the most effective and appropriate
promotional channels, 2) barriers to participation, 3) the most effective and appropriate
promotional messages, and 4) recommendations for improving participation. The
promotional component questionnaire (PCQ) consisted of twenty likert-scale questions
and four open-ended questions. The PCQ was then adapted for delivery on the World
Wide Web (WWW) as a single webpage. Appendix D presents a text version of the PCQ.
Perseus SurveySolutions 4 was used to create the Web-based version of the PCQ.
Perseus SurveySolutions 4 is a software package which allows for the creation,
distribution, collection, analysis, and reporting of surveys and their results (Perseus
Development Corporation, 2001).
Eighteen classes were randomly sampled from a list of all credit classes offered
during the Spring 2003 semester. The time frame for completion of the PCQ was three
weeks from the initial delivery of the packets to the instructors. At the end of the third
64
week following distribution of the packets, the PCQ URL was deactivated and the results
analyzed. Instructors were contacted after the study and semester were completed to
determine whether they chose to distribute the student participation requests.
Instructors received packets that included an instructor’s request as well as
student PCQ participation requests (Appendix E). The instructor request asked that he/she
distribute the student requests included in the packet. The instructor request explained the
purpose of the PCQ. It also explained that participation was voluntary and confidential.
The instructor request asked instructors to discard the packet if they chose not to
participate.
The student request (Appendix F) asked for the student’s participation on the
PCQ. It stated that participation was voluntary and confidential. The request explained
that the students could access the PCQ from any Internet-accessible computer and
identified public libraries, HCC, and their own home as potential sites. The student
request also gave directions on how to access the PCQ and provided the appropriate URL
for locating the questionnaire.
Students who accessed the PCQ URL were presented with an access permission
page (Appendix G). The access permission page again explained to participants that their
participation was completely voluntary and strictly confidential. The page also served as
an electronic informed consent form. The informed consent asked participants to enter
their name and click on the submit button which took them to the survey. The access
permission page provided an assurance of confidentiality and explained to participants
that their names were not linked to their answers on the questionnaire in any way. After
65
completing the PCQ and clicking the submit button, students were then presented with a
thank you page.
Hit counters were placed on the questionnaire access page, the PCQ, and the
thank you page. The hit counter on the access permission page allowed for determination
of the number of times that page was accessed. The hit counters on the PCQ and thank
you pages provided the rate of click-through to the PCQ. Finally, the hit counter on the
thank you page provided PCQ completion rates.
Frequencies for each of the likert scale items on the PCQ were calculated. Items
with frequencies of less than fifty percent were eliminated. Items that were not excluded
were used in development of the social marketing campaign’s promotional channels,
messages, and materials. Qualitative information provided in the four open-ended items
supplemented the development of the promotional materials.
WBRFSS Construction
The BRFSS is a telephone-based survey used annually by the Centers for Disease
Control and Prevention (CDC) to assess health risk factor behaviors and patterns in the
U.S. population (CDC, 2001d). The 2001 BRFSS core questions were adapted for Web-
based delivery and information gathering.
The order and wording of the 2001 BRFSS core questions were used in the Web-
based adaptation. To allow for equity of questions for male and female respondents, sex
specific question were not included. One question addressing pregnancy and six
questions related to prostate health were not included. Questions that asked about the
number of telephones and lines in the home were replaced by questions that addressed
Internet access from home and perceived Internet literacy. This resulted in the seventy
66
item Web-based Behavioral Risk Factor Surveillance Survey (WBRFSS). Appendix H
provides the text-based example of the WBRFSS to be developed for placement on the
World Wide Web.
The WBRFSS was created using Perseus SurveySolutions 4. Construction of the
WBRFSS was made according to the guidelines for online surveys identified by Boznjak
& Tuten (2001) and Dillman et al. (1998). Each question was displayed separately,
participants were not required to answer a question before being allowed to move on, and
no incentive for participation was offered or provided.
WBRFSS Sampling
Lemeshow, Hosmer, Klar, & Lwanga (1990) identified the following formula for
estimating sample size for each group in a two group proportional comparison in health
studies:
n = Z21-alpha/2[P1(1-P1)] + P2(1-P2)]/d
2
where
Z1-alpha/2 = standard error associated with confidence intervals
P1 = estimated proportion (larger)
P2 = estimated proportion (smaller)
d = desired precision
The Lemeshow et al. (1990) formula was used to estimate the size of the study sample.
Using Table 2.1 in Chapter 2, the estimated smaller proportion was the mean
response rate for mail surveys or 51.6 percent. Using the mean of the Web-based surveys
with mail notification (8.1 percent) as the estimated difference between the two
proportions, the estimated larger proportion was 59.7 percent.

67
The standard error associated with a 95 percent confidence interval is 1.96 (Aday,
1996). The probability level to be used was .05. Three hundred and eighty-five (385)
participants were needed in each of the control and experimental groups to detect a
difference of 8.1 percent between the groups on response rate with a 95 percent level of
confidence.
The sample for this study was drawn from Howard Community College students
enrolled in credit classes for the Spring 2003 semester. A randomly generated list of 847
students enrolled at Howard Community College during the Spring, 2003 was generated
in database format by the Administrative Information Office. This included the 770
participants needed for the control (WBRFSS-C) and experimental (WBRFSS-E) groups
and a 10 percent increase to account for participants who were excluded. Exclusionary
criteria included students who were under 18, employees of HCC, students who
participated in the semi-structured interviews, and students who participated in the social
marketing promotional component questionnaire.
Approval for use of HCC students as participants in this study was obtained from
the Vice President/Dean of Instruction at Howard Community College (Appendix I).
Approval by the Vice President/ Dean of Instruction at Howard was contingent on
maintenance of student confidentiality, use of written recording only, and approval of the
University of Maryland, College Park Institutional Review Board. All contingencies were
met for this study.
WBRFSS-C Mail Request and Survey Placement
WBRFSS participation requests (Appendix J) were mailed to members of the
WBRFSS-C. The request included an introduction to the researcher, an explanation of the

68
purpose of the survey, and instructions on accessing the survey URL
(www.howardcc.edu/websurvey) and completing the survey. The instructions indicated
the approximate amount of time the survey would take to complete and included a
request to complete the survey by the appropriate date.
The WBRFSS-C’s WBRFSS website was activated on the same day that
participation requests were mailed. The survey website remained active for seventeen
days. This allowed for a three-day mail delivery time, and fourteen-day completion time
frame. At the end of the seventeen-day time frame, the WBRFSS was removed from the
URL site and a thank you page put in its place. Those WBRFSS mailed requests that
were returned as undeliverable were excluded from the WBRFSS-C sample.
Students who accessed the WBRFSS were presented with an access permission
page (Appendix K) prior to being allowed to access the survey itself. The access
permission page explained to the participants that their participation was completely
voluntary and all information was kept strictly confidential. The page also acted as an
electronic informed consent form. The electronic informed consent asked participants to
enter their name and click on the submit button to go to the survey. The access
permission page also explained to participants that their names were not linked to their
answers on the WBRFSS in any way.
Student names from the access permission page were stored in a tab-delimited
text file located on a secure server at HCC. After each individual completed the
WBRFSS, the results were also stored in a tab-delimited text file located on the secure
server. There was no linkage between the student’s name and his/her answers on the
WBRFSS.

69
Social Marketing Campaign Promotions
At the end of the WBRFSS-C’s time frame of seventeen days, the promotional
materials developed through the semi-structured interviews and the promotional
component questionnaires were put in place. The promotional materials, including
posters and flyers, were put in place one week prior to WBRFSS-E’s participation
requests being mailed. The promotional materials remained in place through the end of
the experimental group’s participation period.
WBRFSS-E Mail Request and Survey Placement
WBRFSS participation requests were mailed to members of the WBRFSS-E one
week after the promotional materials were delivered to the study population. The
WBRFSS requests mailed to the WBRFSS-E were identical in content and form to those
sent to the WBRFSS-C.
The WBRFSS-E’s WBRFSS website was activated on the same day that the
WBRFSS requests were mailed out. The survey website remained active for seventeen
days, allowing for a three-day mail delivery time, and fourteen-day completion time
frame. At the end of the seventeen-day time frame, the WBRFSS was removed from the
URL site and a thank you page put in its place. Those WBRFSS requests that were
returned as undeliverable were excluded from the WBRFSS-C sample.
After each individual completed the WBRFSS, the results for each participant in
the WBRFSS-E was stored in a tab-delimited text file located on a secure server at HCC.
There was no linkage between the student’s name and his/her answers on the WBRFSS.

70
Data Analysis
The tab-delimited file that contained both the WBRFSS-C and WBRFSS-E
response data were imported into SPSS 11.5 for analyses. Descriptive statistics were
generated for demographic variables. For the study’s only continuous demographic
variable, age, the mean, standard deviations and range were calculated. For the
categorical demographic variables including sex, ethnicity, education, county of
residence, internet-accessibility from home, and internet-literacy, crosstabulations were
calculated. The purpose of crosstabulation is to show in tabular format the relationship
between two or more categorical variables (George & Mallery, 1999).
T-test analyses were generated to determine if statistical differences existed
between the WBRFSS-C and the WBRSS-E on the age variables. Chi-square analyses
were conducted to determine if an assication existed between the WBRFSS-C and
WBRFSS-Es on the categorical demographic variables.
Research hypothesis one stated that the response rate on the WBRFSS would be
higher in the WBRFSS-E than in the WBRFSS-C. To investiate hypotheses one,
descriptive statistics for the response for the WBRFSS-C and WBRFSS-E were first
generated. To determine if a statistically significant association existed between the two
groups’ response rates a chi-square analysis for independence was conducted.
Research hypothesis two stated that the response time on the WBRFSS would be
lower in the WBRFSS-C than in the WBRFSS-E. The means, standard deviations, and
ranges of the response times for the WBRFSS-E and WBRFSS-C were calculated. The t-
test for independent samples was used to determine whether a statistically significant
difference existed between the means of two groups on response time.
71
Research hypothesis three postulated that the item completion rate would be
higher on the WBRFSS in the WBRFSS-C than in the WBRFSS-E. The means, standard
deviations, and ranges of the item completion rates for the WBRFSS-E and WBRFSS-C
were calculated. The t-test for independent groups was used to determine whether a
statistically significant difference existed between the means of the two groups on item
completion rates.
Research hypothesis four stated that a regression model could be developed which
explains likelihood of response on the WBRFSS from selected independent variables.
The independent variables included exposure to the social marketing campaign, internet-
accessibility from home, perceived Internet literacy, age, sex, education, ethnicity, and
county of residence. The variables exposure to social marketing and internet-accessibility
from home each included the categories yes or no. Sex included the categories male and
female. The education variable included the categories high school graduate, some
college, and college graduate.
The continuous variable age was recoded into an age group variable with three
categories: 18-38 years of age, 39-57 years of age, and older than 57 years of age.
Brenner (1998) identified four generational categories that have unique characteristics.
The age categories were defined as under 18, 18-38, 39-57, and over 57 years of age
(Brenner, 1998). The latter three of the four of these categories are applicable to this
study.
Several independent variables were adjusted to allow for more salient analyses
and application. The ethnicity variable included the categories of White, African-
American, Asian, Unknown, and Other. The Unknown category was collapsed into the

72
“Other” category. The county of residence variable included the categories Howard
county, Prince Georges county, Carroll county, Baltimore county, and Alexandria city.
County of residence categories other than Howard county were collapsed into a new
category of Other.
The logistic regression model was fitted to a sample of 116. This included
WBRFSS-C respondents (n=23), WBRFSS-E respondents (n=47), randomly sampled
WBRFSS-C non-respondents (n=23), and randomly sampled WBRFSS-E non-
respondents (n=23). The model was represented as follows: D = βE x γV1 x γV2 x γV3 x
γV4 x γV5 x γV6 x γV7, where D is response rate, E is exposure to social marketing
promotional materials, β is the coefficient of the exposure variable E, V1 is age, V2 is sex,
V3 is ethnicity, V4 is county of residence, V5 is education, V6 is the internet accessible
from home, V7 is perceived internet-literacy, and γ is the coefficient of the potential
confounding variable denoted previously by Vn.
Follow-up interviews were conducted with respondents and non-respondents in
both the WBRFSS-C and WBRFSS-E groups. Sample size was to be based on the table
by Krejcie & Daryle (1970) for determining sample size for a population of a given size.
The number of WBRFSS-C respondents did not meet the recommended sample
size given by the Krejcie & Daryle table. Using the 23 WBRFSS-C respondents as the
basis for sample size determination, random samples of 23 were drawn from each of the
WBRFSS-C non-respondents and WBRFSS-E respondents and non-respondents for
follow-up interviews. A total of 92 follow-up interviews were completed.

73
Follow-up interviews were conducted via telephone. Telephone numbers were
obtained from the study sample dataset. Each potential follow-up interviewee was
contacted via telephone. Up to five attempts were made to contact the interviewee.
Interviews were conducted with this researcher acting as interviewer. Participants
were given a verbal invitation to take part in the follow-up interview. An introduction and
explanation of the purpose of the follow-up interview was given to the student. Students
were told that participation was voluntary, that all information was confidential, and that
he/she may stop the interview at any time. The student was then given the opportunity to
accept or decline participation. All students agreed to participate in the follow-up
interviews.
Each student had several questions (Appendix M) posed to the student. Their
responses were recorded in written notation format. The interviewer expanded on
question content when necessary to gather the additional information. The data gathered
during the follow-up interviews were used in the logistic regression analysis as well as
for the qualitative analysis.
WBRFSS-C non-respondents were asked about why they did not participate in the
WBRFSS, other potential barriers to participation, additional promotional strategies,
whether they had Internet access in the home, what they felt their Internet literacy was,
and their level of education. WBRFSS-C respondents were asked about why they
participated, potential barriers to participation, and additional promotional strategies.
WBRFSS-E non-respondents were asked why they did not participate in the
WBRFSS, if they noticed any of the promotional components, which promotional
components they noticed, which promotional components they felt were effective, other
74
potentially effective promotional strategies, potential barriers to participation for non-
respondents, whether they had Internet access in the home, what they felt their Internet
literacy was, and their level of education. WBRFSS-E respondents were asked if they
noticed any of the promotional components, which promotional components they noticed,
which promotional components they felt were effective, other potentially effective
promotional strategies, potential barriers to participation for non-respondents, and
education.
Responses were placed into one of the group categories and overall frequency for
each category determined. Results will be used to further refine the social marketing
campaign and potentially improve future response rates on the WBRFSS.
Summary
Chapter III described the framework, methods, and materials used to conduct this
study. Chapter III also described research hypotheses, study variables, the study design,
the study population, IRB approval, the study procedures and data analyses methods
used. This study involved the examination of response rate, response time, and item
completion rate on a Web-based health survey. A Web-based version of the Behavioral
Risk Factor Surveillance System questionnaire was developed for this study.
This study conducted both qualitative and quantitative data collection methods.
Qualitatively, data was gathered for the purposes of developing a social marketing
campaign for promoting the Web-based Behavioral Risk Factor Surveillance Survey
(WBRFSS).
Semi-structured interviews were used to develop a promotional channel
questionnaire that assessed students’ perspectives on the promotion of a Web-based

75
health survey. The questionnaire also assessed student opinions on improving
participation by students in such a survey. From the data gathered, social marketing
promotional channels and messages were developed and determined.
Quantitatively, a Web-based version of the Behavioral Risk Factor Surveillance
Survey (BRFSS) was developed and delivered to both control (WBRFSS-C) and
experimental groups (WBRFSS-E). Prior to delivery of the Web-based BRFSS
(WBRFSS), the WBRFSS-E was exposed to the social marketing promotions developed
through the qualitative methods of this study.
WBRFSS data was gathered that included response rate, response time, item
completion rate. The independent variables were used to fit an explanatory model of
response to the WBRFSS.
76
CHAPTER IV – RESULTS
Introduction
This study examined the impact of social marketing on participation of a random
sample of HCC students on a Web-based Behavioral Risk Factor Surveillance Survey
(WBRFSS). This chapter presents the data gathered by the methods described in chapter
three. The results from development of the social marketing campaign as well as data
analysis related to the research hypotheses are reported in this chapter.
Semi-Structured Interviews
A total of 28 students were approached to participate in the semi-structured
interviews. Five declined participation and twenty-three students agreed to be
interviewed. A series of ten questions that explored the student’s perception of survey
participation and promotional strategies were posed to each of the students interviewed
(Appendix C). Responses were collected in detailed written form and placed into
categories based on question topic and response pattern. Collection of data was stopped
when overall interview response patterns began to repeat themselves. Responses were
then placed into categories including identified promotional channels, promotion design
recommendations, identified barriers to participation, and recommendations for
improving participation. Simple frequencies were determined for each response pattern
(Table 3).
The promotional channels most frequently identified by students on the semi-
structured interviews included postings on bulletin boards posters (n=23), flyers (n=22),
handouts (n=22), website (n=16), email (n=14), and (n=10). Frequently identified
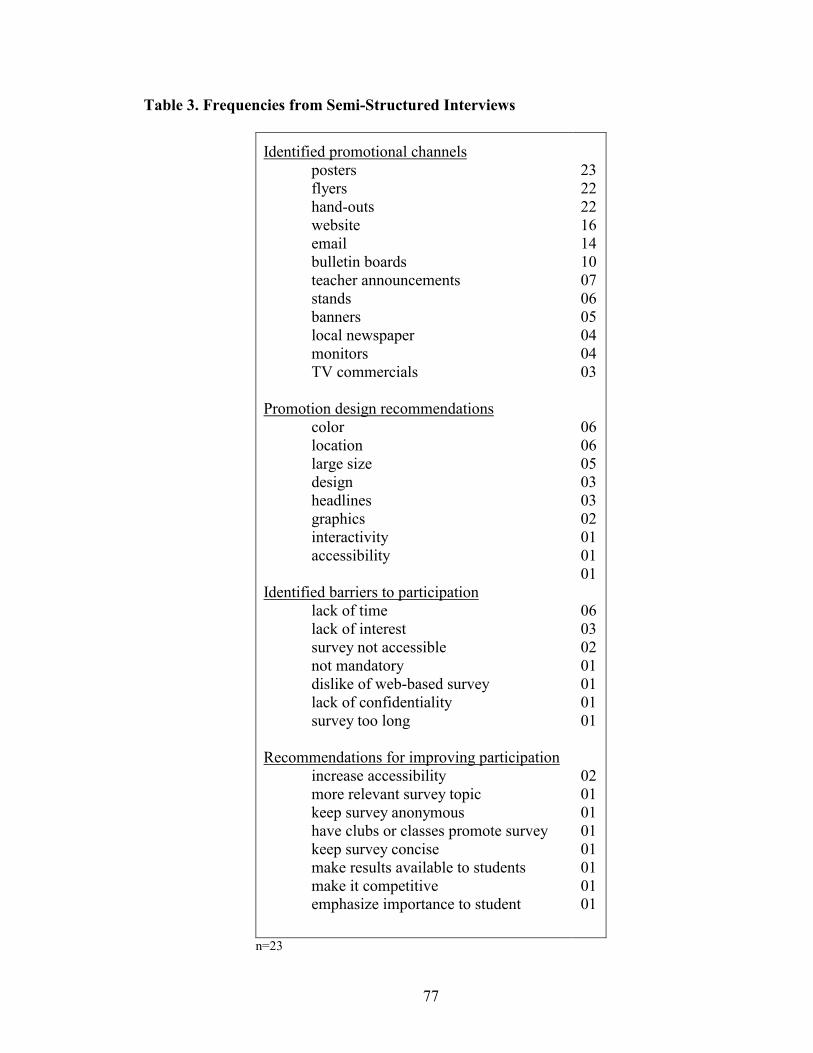
77
Table 3. Frequencies from Semi-Structured Interviews
Identified promotional channels posters flyers hand-outs website email bulletin boards teacher announcements stands banners local newspaper monitors TV commercials
Promotion design recommendations
color location large size design headlines graphics interactivity accessibility
Identified barriers to participation
lack of time lack of interest survey not accessible not mandatory dislike of web-based survey lack of confidentiality survey too long
Recommendations for improving participation
increase accessibility more relevant survey topic keep survey anonymous have clubs or classes promote survey keep survey concise make results available to students make it competitive emphasize importance to student
23 22 22 16 14 10 07 06 05 04 04 03 06 06 05 03 03 02 01 01 01 06 03 02 01 01 01 01 02 01 01 01 01 01 01 01
n=23
78
promotion design recommendations included campus location (n=6), coloring (n=6), and
large letter size (n=5).
Few recommendations for improving participation were identified by students in
the semi-structured interviews. Those that were identified included accessibility, relevant
survey topic, and anonymity. The most frequently identified barriers to participation
included lack of time, lack of interest, and lack of accessibility.
Responses with a count of two or more were incorporated into the promotional
component questionnaire. The results of the interviews were then used to develop an
online questionnaire to further refine study procedures and development of the social
marketing campaign.
Promotional Component Questionnaire
A 24-item questionnaire (Appendix D) was developed using the information
gathered during the semi-structured interviews. The promotional component
questionnaire (PCQ) included four open-ended questions and 20 likert scale items (Table
4). The questions were divided into three areas that provided information on various
aspects of the promotional message development and delivery. The three areas included,
1) promotional channels, 2) promotional message characteristics, and 3) promotional
message content. The PCQ was developed for delivery on the WWW using Perseus
SurveySolutions 4 and placed on a secure server at HCC.
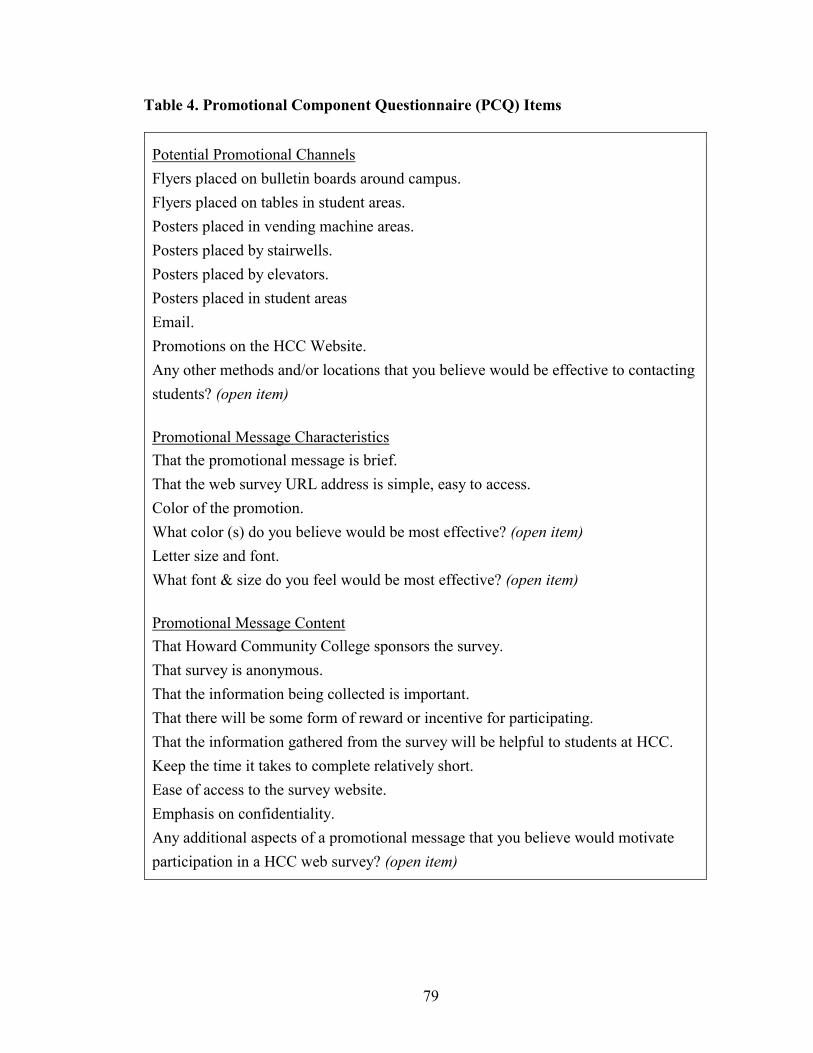
79
Table 4. Promotional Component Questionnaire (PCQ) Items
Potential Promotional Channels
Flyers placed on bulletin boards around campus.
Flyers placed on tables in student areas.
Posters placed in vending machine areas.
Posters placed by stairwells.
Posters placed by elevators.
Posters placed in student areas
Email.
Promotions on the HCC Website.
Any other methods and/or locations that you believe would be effective to contacting
students? (open item)
Promotional Message Characteristics
That the promotional message is brief.
That the web survey URL address is simple, easy to access.
Color of the promotion.
What color (s) do you believe would be most effective? (open item)
Letter size and font.
What font & size do you feel would be most effective? (open item)
Promotional Message Content
That Howard Community College sponsors the survey.
That survey is anonymous.
That the information being collected is important.
That there will be some form of reward or incentive for participating.
That the information gathered from the survey will be helpful to students at HCC.
Keep the time it takes to complete relatively short.
Ease of access to the survey website.
Emphasis on confidentiality.
Any additional aspects of a promotional message that you believe would motivate
participation in a HCC web survey? (open item)

80
Eighteen classes were randomly sampled and sent invitations to participate in the
PCQ (Table 5). The decision of the instructors to distribute the participation requests to
students in their classes was voluntary and confidential. Instructors were contacted after
the study and semester were completed to determine whether they chose to distribute the
student participation requests. Instructors in eleven out of the eighteen classes (61%)
reported having distributed the participation requests to students in their classes.
A total of 254 students were enrolled in the eleven classes in which the instructors
distributed the student participation requests. Thirty-three students completed the online
PCQ representing a response rate of 12.99 percent. The actual number of students present
on the day of distribution was not known and as such the true response rate for the PCQ
may have actually been higher.
The PCQ permission page was accessed 50 times, the PCQ itself was accessed 46
times, and 33 were completed. This represents a 92 percent click through rate for the
PCQ. This also represents an approximate 72 percent completion rate for the PCQ.
Frequencies and percentages for the 20 likert scale item responses made by the 33
PCQ respondents were determined for the three areas, promotional channels, promotional
message characteristics, and promotional message content. Response categories 4
(effective/ important), and 5 (very effective/ important) were collapsed to determine
which promotional components students believed were most important/effective. The
other response categories 1 (don’t know/not sure), 2 (not effective/important), and 3
(somewhat effective/ important), were not included in the social marketing development
process. Those items that fell into the upper 50th percentile of each area were used in
developing the social marketing promotions for this study.
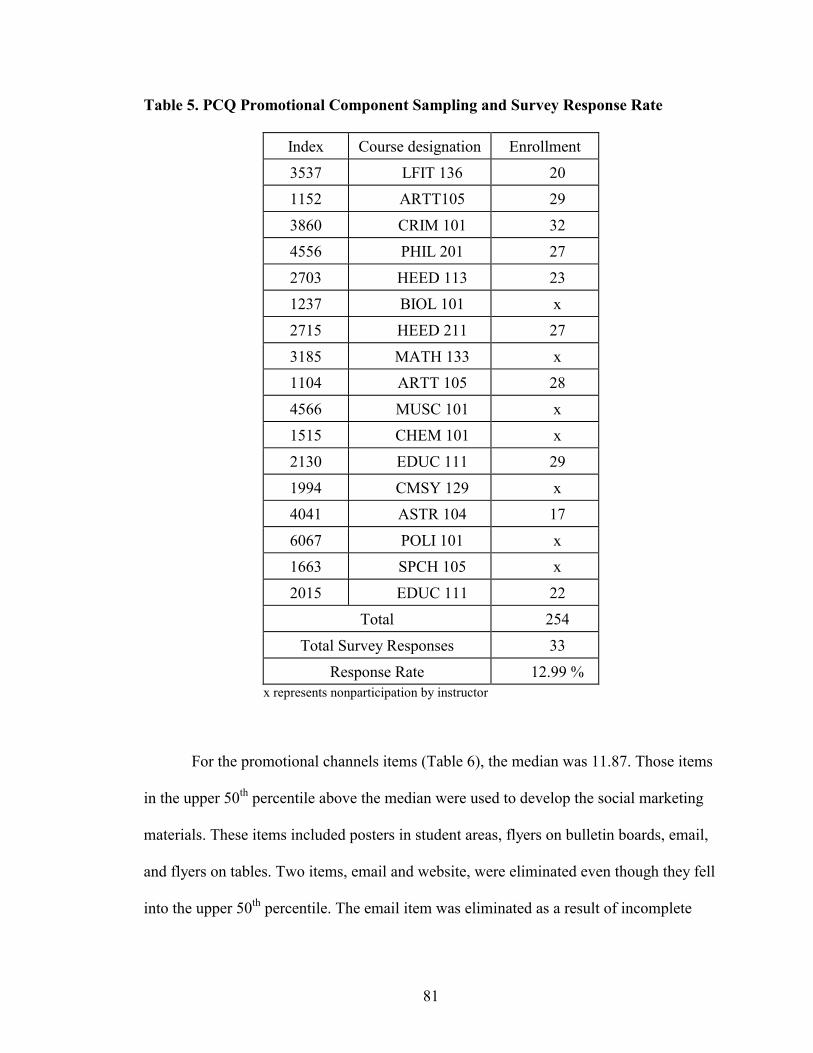
81
Table 5. PCQ Promotional Component Sampling and Survey Response Rate
Index Course designation Enrollment
3537 LFIT 136 20
1152 ARTT105 29
3860 CRIM 101 32
4556 PHIL 201 27
2703 HEED 113 23
1237 BIOL 101 x
2715 HEED 211 27
3185 MATH 133 x
1104 ARTT 105 28
4566 MUSC 101 x
1515 CHEM 101 x
2130 EDUC 111 29
1994 CMSY 129 x
4041 ASTR 104 17
6067 POLI 101 x
1663 SPCH 105 x
2015 EDUC 111 22
Total 254
Total Survey Responses 33
Response Rate 12.99 % x represents nonparticipation by instructor
For the promotional channels items (Table 6), the median was 11.87. Those items
in the upper 50th percentile above the median were used to develop the social marketing
materials. These items included posters in student areas, flyers on bulletin boards, email,
and flyers on tables. Two items, email and website, were eliminated even though they fell
into the upper 50th percentile. The email item was eliminated as a result of incomplete

82
student email access. The website item was eliminated due to lack of access for the
promotional purposes of this study.
Table 6. PCQ Promotional Channel Collapsed Item Frequencies
Perceived as Effective/ Important
N %
posters in student areas 16 48.5
website 16 48.5
flyers on bulletin boards 14 42.4
email 14 42.4
flyers on tables 12 36.4
posters in vending areas 10 30.3
posters at elevators 7 21.2
posters at stairs 6 18.2
median 11.87 35.97
n=33
In the promotional message area (Table 7), the median was 26.25. The items that
were in the upper 50th percentile, included in the development of the promotional
materials, were accessibility (web survey URL address is simple) and message length
(keeping the message relatively short). Items eliminated included color (color of
promotion), and letter size and font. The four open-ended items were used in
development of the promotional materials.

83
Table 7. PCQ Promotional Message Characteristics Collapsed Item Frequencies
Perceived as Effective/Important
N %
accessibility 32 97.0
message length 29 87.9
color 22 66.7
letter, size, and font 22 66.7
median 26.25 79.55
n=33
For the promotional message content area (Table 8), the median was 24.25. Those
items in the upper 50th percentile were used in development of the promotional materials.
Items to be included in development of the promotional materials from this area were
ease of access (ease of access to the survey website), importance (information being
collected is important), value to students (information gathered from the survey will be
helpful to the students at HCC) and confidentiality (there is an emphasis on
confidentiality). The HCC sponsorship item (survey is sponsored by Howard Community
College) was included to meet the college administrators requirements.
One item, length of survey (keep the time it takes to complete the health behavior
survey relatively short), could not be used in development of the promotional materials
due to the length of the BRFSS that was adapted for this study.
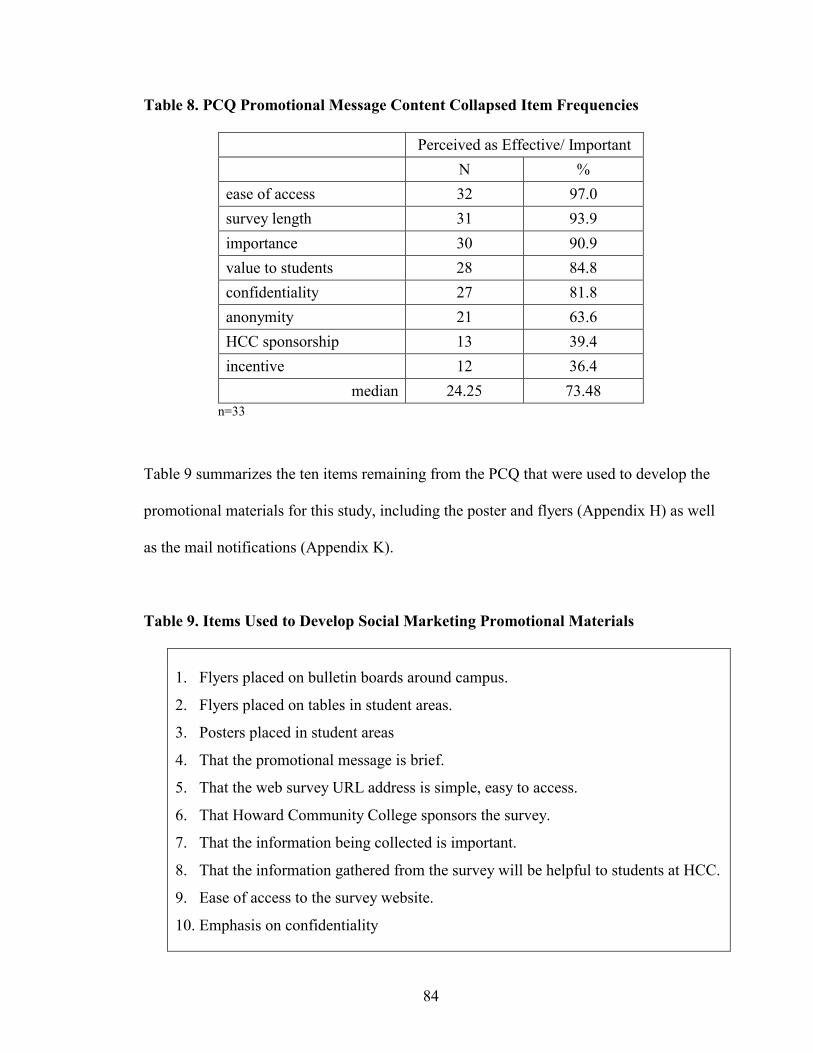
84
Table 8. PCQ Promotional Message Content Collapsed Item Frequencies
Perceived as Effective/ Important
N %
ease of access 32 97.0
survey length 31 93.9
importance 30 90.9
value to students 28 84.8
confidentiality 27 81.8
anonymity 21 63.6
HCC sponsorship 13 39.4
incentive 12 36.4
median 24.25 73.48 n=33
Table 9 summarizes the ten items remaining from the PCQ that were used to develop the
promotional materials for this study, including the poster and flyers (Appendix H) as well
as the mail notifications (Appendix K).
Table 9. Items Used to Develop Social Marketing Promotional Materials
1. Flyers placed on bulletin boards around campus.
2. Flyers placed on tables in student areas.
3. Posters placed in student areas
4. That the promotional message is brief.
5. That the web survey URL address is simple, easy to access.
6. That Howard Community College sponsors the survey.
7. That the information being collected is important.
8. That the information gathered from the survey will be helpful to students at HCC.
9. Ease of access to the survey website.
10. Emphasis on confidentiality
85
WBRFSS Data Analysis
The defined population for this study was all Howard Community College
students who were enrolled in the Spring, 2003 semester (N=5800). Based on the
Lemeshow, Hosmer, Klar, & Lwanga (1990) formula for estimating sample size, eight
hundred and forty-seven students at Howard Community College were randomly
sampled. The sample dataset included the demographic variables age, sex, ethnicity,
address (county of residence), telephone number, and email address.
Exclusionary criteria were then applied to the sampled dataset. These included 1)
anyone under the age of 18, 2) employees of Howard Community College, 3) participants
in the semi-structured interviews, and 4) participants of the promotional component
questionnaire. This resulted in a final adjusted sample size of 774 students. Counts and
percentages for sex, ethnicity, and county of residence as well as median age for all
students enrolled for the Spring 2003 semester and the study sample were calculated
(Table 10).
The 774 students were then randomly assigned to control (WBRFSS-C) and
experimental groups (WBRFSS-E). An independent samples t-test was used to examine
if a statistically significant difference (p<.05) existed between the WBRFSS-C and
WBRFSS-E for age. No statistically significant difference was found.
Chi-square analyses of independence were conducted to determine if statistically
significant associations existed between the WBRFSS-C and WBRFSS-E for the
categorical demographic variables including sex, ethnicity, and county of residence.
Again, no statistically significant associations were found. Education was not included
due to incomplete reporting in the original dataset.
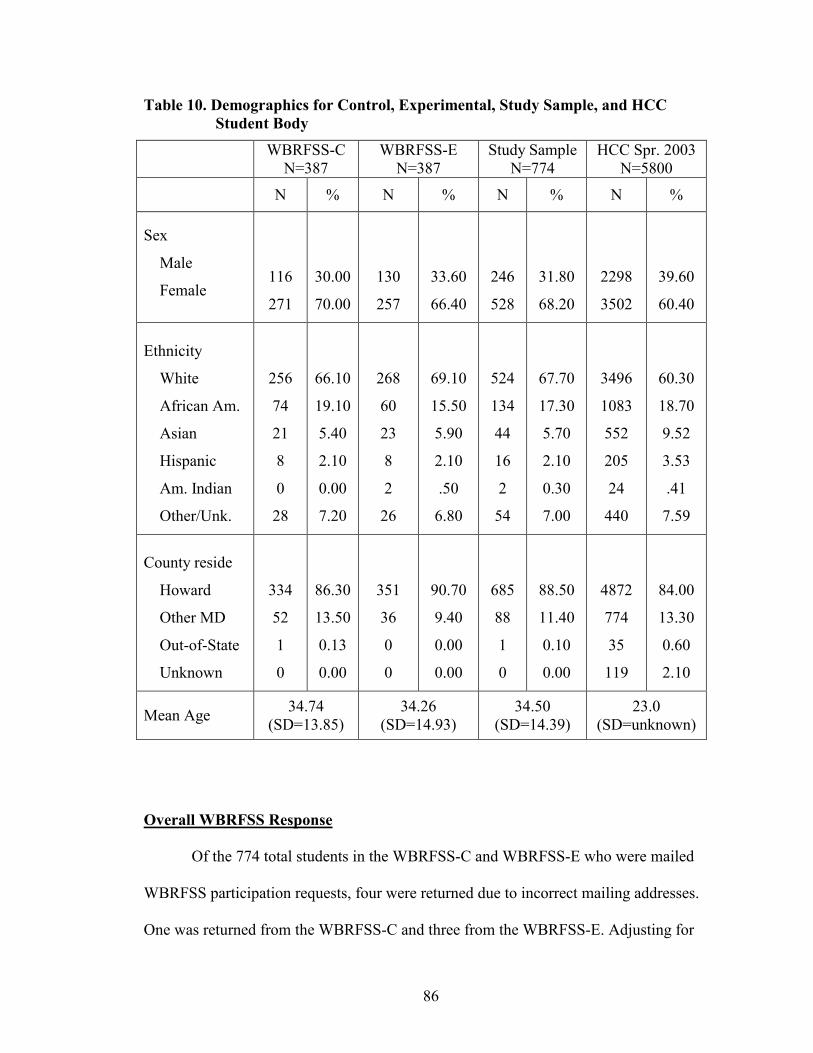
86
Table 10. Demographics for Control, Experimental, Study Sample, and HCC Student Body
Overall WBRFSS Response
Of the 774 total students in the WBRFSS-C and WBRFSS-E who were mailed
WBRFSS participation requests, four were returned due to incorrect mailing addresses.
One was returned from the WBRFSS-C and three from the WBRFSS-E. Adjusting for
WBRFSS-C
N=387 WBRFSS-E
N=387 Study Sample
N=774 HCC Spr. 2003
N=5800
N % N % N % N %
Sex
Male
Female
116
271
30.00
70.00
130
257
33.60
66.40
246
528
31.80
68.20
2298
3502
39.60
60.40
Ethnicity
White
African Am.
Asian
Hispanic
Am. Indian
Other/Unk.
256
74
21
8
0
28
66.10
19.10
5.40
2.10
0.00
7.20
268
60
23
8
2
26
69.10
15.50
5.90
2.10
.50
6.80
524
134
44
16
2
54
67.70
17.30
5.70
2.10
0.30
7.00
3496
1083
552
205
24
440
60.30
18.70
9.52
3.53
.41
7.59
County reside
Howard
Other MD
Out-of-State
Unknown
334
52
1
0
86.30
13.50
0.13
0.00
351
36
0
0
90.70
9.40
0.00
0.00
685
88
1
0
88.50
11.40
0.10
0.00
4872
774
35
119
84.00
13.30
0.60
2.10
Mean Age 34.74
(SD=13.85) 34.26
(SD=14.93) 34.50
(SD=14.39) 23.0
(SD=unknown)

87
these undelivered notifications, within group counts for delivered participation requests
were 386 for the WBRFSS-C, and 384 for the WBRFSS-E for a total of 770.
Of the 770 students who were successfully mailed WBRFSS participation
requests, 23 in the WBRFSS-C and 47 in the WBRFSS-E completed the survey. This
represented a total of 70 completed surveys and an overall response rate of 9.1 percent.
The WBRFSS access permission page was accessed 26 times by members of the
WBRFSS-C sample. Twenty-three were completed which represented an 89 percent
survey completion rate for the WBRFSS-C. The WBRFSS access permission page was
accessed 51 times by members of the WBRFSS-E sample. Forty-seven were completed
which represented a 92 percent survey completion rate.
Demographics were calculated for respondents and non-respondents (Table 11).
Chi square analysis found significant associations (p>.05) for sex and ethnicity between
respondents and non-respondents. No significant association was found for county of
residence. A significant difference (p<.05) was found for age using the t-test for
independent samples. The respondents were, on average, approximately seven years
older. Education was not included due to incomplete reporting in the original dataset.
Additional characteristics were identified for the respondents. The majority of
respondents accessed the Internet and completed the WBRFSS from home (74.3 %).
Also, 18.6 % responded from work and 7.1% from the HCC campus. Additionally, the
majority of respondents (95.7 percent) identified having access to the Internet from home.
More than half of the respondents rated their ability to use the Internet (Internet literacy)
as high (55.7 percent), with 35.7 percent rating themselves as average, and 8.6 percent as
low.
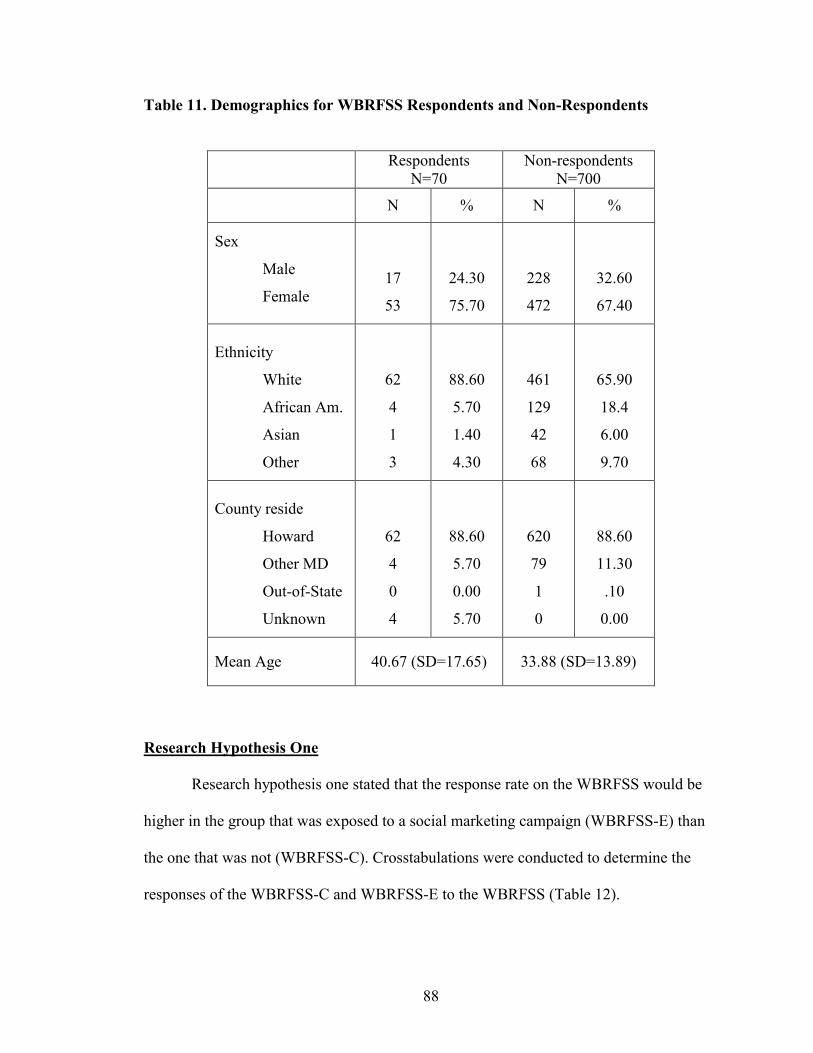
88
Table 11. Demographics for WBRFSS Respondents and Non-Respondents
Respondents
N=70 Non-respondents
N=700
N % N %
Sex
Male
Female
17
53
24.30
75.70
228
472
32.60
67.40
Ethnicity
White
African Am.
Asian
Other
62
4
1
3
88.60
5.70
1.40
4.30
461
129
42
68
65.90
18.4
6.00
9.70
County reside
Howard
Other MD
Out-of-State
Unknown
62
4
0
4
88.60
5.70
0.00
5.70
620
79
1
0
88.60
11.30
.10
0.00
Mean Age 40.67 (SD=17.65) 33.88 (SD=13.89)
Research Hypothesis One
Research hypothesis one stated that the response rate on the WBRFSS would be
higher in the group that was exposed to a social marketing campaign (WBRFSS-E) than
the one that was not (WBRFSS-C). Crosstabulations were conducted to determine the
responses of the WBRFSS-C and WBRFSS-E to the WBRFSS (Table 12).
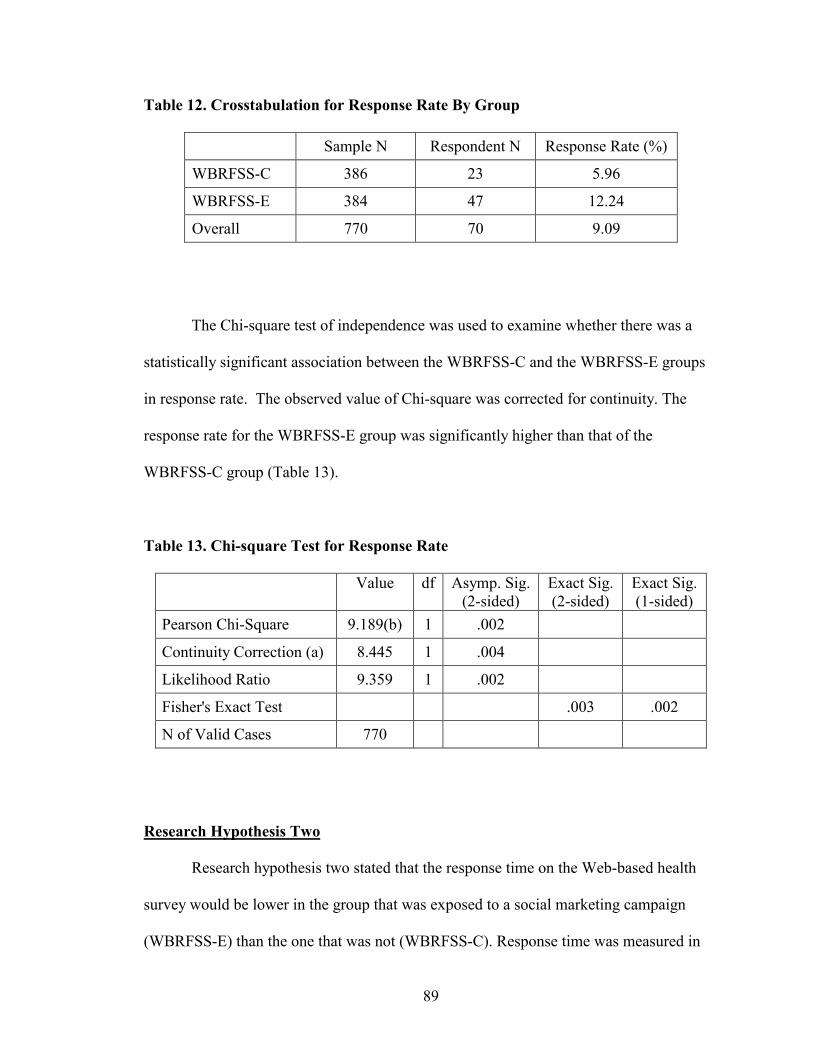
89
Table 12. Crosstabulation for Response Rate By Group
Sample N Respondent N Response Rate (%)
WBRFSS-C 386 23 5.96
WBRFSS-E 384 47 12.24
Overall 770 70 9.09
The Chi-square test of independence was used to examine whether there was a
statistically significant association between the WBRFSS-C and the WBRFSS-E groups
in response rate. The observed value of Chi-square was corrected for continuity. The
response rate for the WBRFSS-E group was significantly higher than that of the
WBRFSS-C group (Table 13).
Table 13. Chi-square Test for Response Rate
Value df Asymp. Sig. (2-sided)
Exact Sig. (2-sided)
Exact Sig. (1-sided)
Pearson Chi-Square 9.189(b) 1 .002
Continuity Correction (a) 8.445 1 .004
Likelihood Ratio 9.359 1 .002
Fisher's Exact Test .003 .002
N of Valid Cases 770
Research Hypothesis Two
Research hypothesis two stated that the response time on the Web-based health
survey would be lower in the group that was exposed to a social marketing campaign
(WBRFSS-E) than the one that was not (WBRFSS-C). Response time was measured in
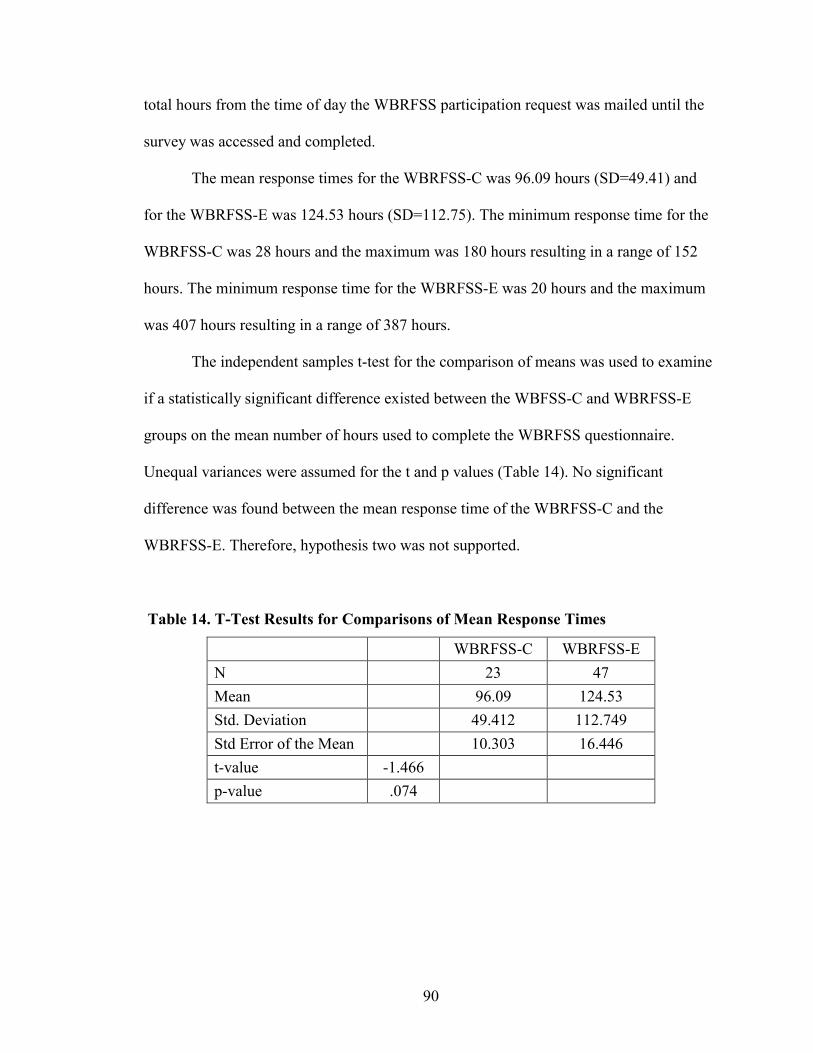
90
total hours from the time of day the WBRFSS participation request was mailed until the
survey was accessed and completed.
The mean response times for the WBRFSS-C was 96.09 hours (SD=49.41) and
for the WBRFSS-E was 124.53 hours (SD=112.75). The minimum response time for the
WBRFSS-C was 28 hours and the maximum was 180 hours resulting in a range of 152
hours. The minimum response time for the WBRFSS-E was 20 hours and the maximum
was 407 hours resulting in a range of 387 hours.
The independent samples t-test for the comparison of means was used to examine
if a statistically significant difference existed between the WBFSS-C and WBRFSS-E
groups on the mean number of hours used to complete the WBRFSS questionnaire.
Unequal variances were assumed for the t and p values (Table 14). No significant
difference was found between the mean response time of the WBRFSS-C and the
WBRFSS-E. Therefore, hypothesis two was not supported.
Table 14. T-Test Results for Comparisons of Mean Response Times
WBRFSS-C WBRFSS-E
N 23 47
Mean 96.09 124.53
Std. Deviation 49.412 112.749
Std Error of the Mean 10.303 16.446
t-value -1.466
p-value .074
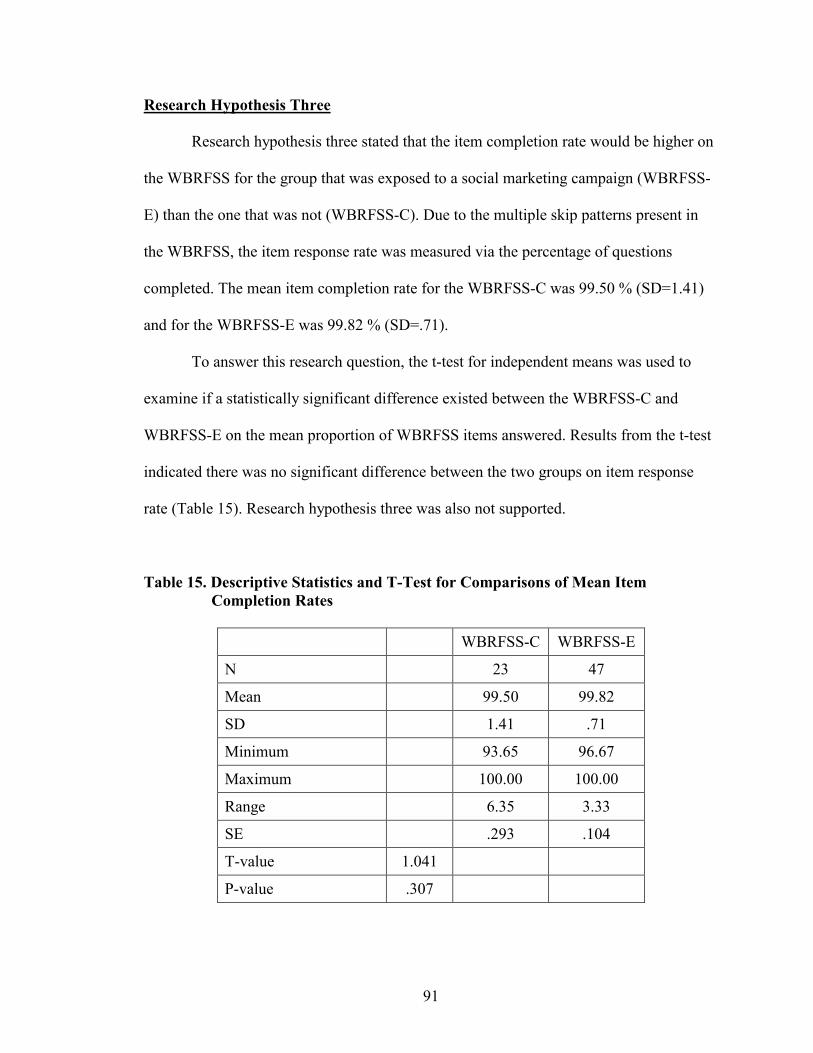
91
Research Hypothesis Three
Research hypothesis three stated that the item completion rate would be higher on
the WBRFSS for the group that was exposed to a social marketing campaign (WBRFSS-
E) than the one that was not (WBRFSS-C). Due to the multiple skip patterns present in
the WBRFSS, the item response rate was measured via the percentage of questions
completed. The mean item completion rate for the WBRFSS-C was 99.50 % (SD=1.41)
and for the WBRFSS-E was 99.82 % (SD=.71).
To answer this research question, the t-test for independent means was used to
examine if a statistically significant difference existed between the WBRFSS-C and
WBRFSS-E on the mean proportion of WBRFSS items answered. Results from the t-test
indicated there was no significant difference between the two groups on item response
rate (Table 15). Research hypothesis three was also not supported.
Table 15. Descriptive Statistics and T-Test for Comparisons of Mean Item Completion Rates
WBRFSS-C WBRFSS-E
N 23 47
Mean 99.50 99.82
SD 1.41 .71
Minimum 93.65 96.67
Maximum 100.00 100.00
Range 6.35 3.33
SE .293 .104
T-value 1.041
P-value .307
92
Research Hypothesis Four
Research hypothesis four stated that a regression model could be developed which
predicted the likelihood of response on the WBRFSS from selected independent variables
which included exposure to social marketing promotions, age, sex, ethnicity, county of
residence, education, perceived Internet literacy, and availability of an Internet
connection at home. A logistic regression model was fitted to the sample of 116 surveys
that included WBRFSS-C respondents (n=23), WBRFSS-E respondents (n=47),
randomly sampled WBRFSS-C non-respondents (n=23), and randomly sampled
WBRFSS-E non-respondents (n=23).
The logistic regression model included the dependent variable, response to the
WBRFSS, and the following independent variables, exposure to social marketing
promotions, age, sex, ethnicity, county of residence, education, perceived Internet
literacy, and availability of an Internet connection at home. The continuous variable age
was recoded into three categories: 18-38 years of age, 39-57 years of age, and older than
57 years of age. The subcategory unknown in the variable ethnicity was collapsed into
the other subcategory. The county of residence variable was collapsed and recoded into
Howard County and Other categories.
The Omnibus Tests of Model Coefficients indicated the model significantly
improved on the constant term-only model. The large Model Chi-square value and small
p value (X2(13)=26.309, p=.015) indicated that one or more of the independent variables
in the model were significantly associated with response rate.
The Model Summary demonstrated that the –2 log-likelihood statistic (129.500)
for the model showed an adequate performance of the data. The model explained 27.5

93
percent of the variance in response rate as measured by the Nagelkerke R2. Table 16
provides the outputs for the Omnibus Tests of Model Coefficients and Model Summary
outputs.
Table 16. Omnibus Tests of Model Coefficients and Model Summary Outputs
–2 log-likelihood
Cox & Snell - R2
Nagelkerke - R2
- 129.500
- .203
- .275
Step
Block
Model
26.309
26.309
26.309
13
13
13
.015
.015
.015
The Hosmer and Lemeshow tests further demonstrated the model had a good fit to
the data (X2(7)=9.716, p=.205). The Hosmer and Lemeshow test statistic indicated that
the variance in the dependent variable explained by the model was significant.
The model showed 50.0 percent of the non-respondents and 78.6 percent of the
respondents were correctly classified, yielding a total correct classification of 67.2
percent. This represented an approximate seven percent increase over the constant-only
model. Table 17 presents the model classification table.
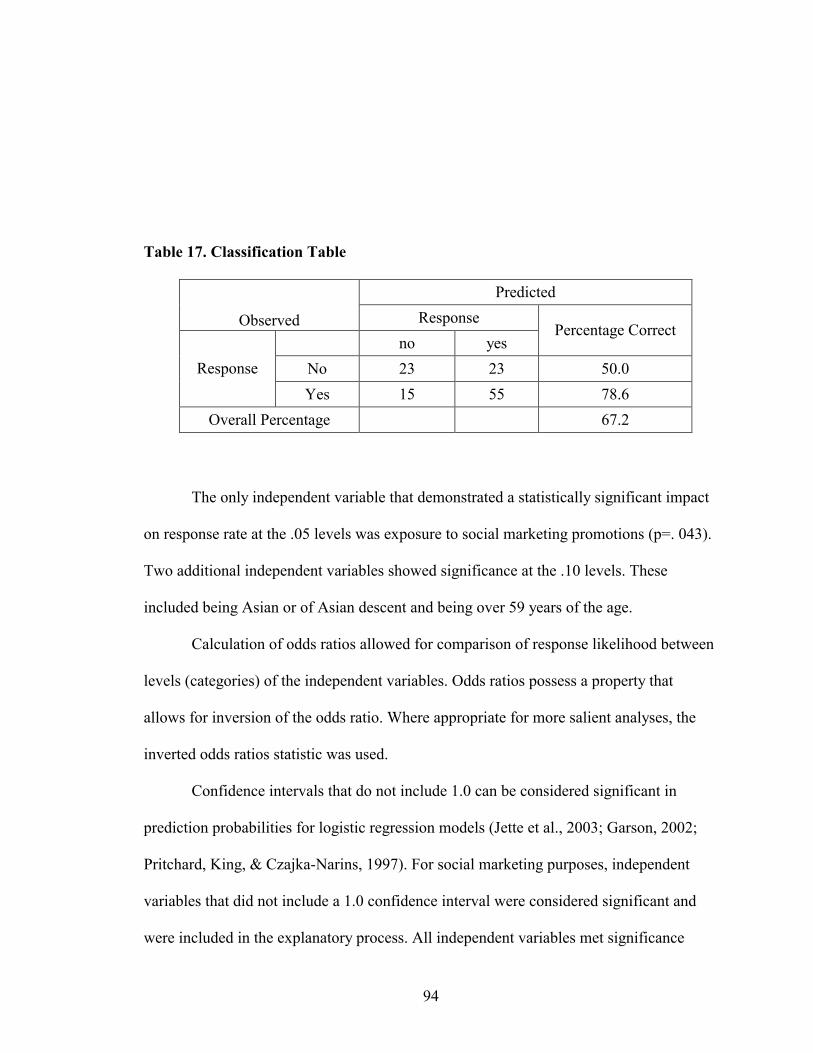
94
Table 17. Classification Table
Predicted
Observed Response
no yes Percentage Correct
No 23 23 50.0 Response
Yes 15 55 78.6
Overall Percentage 67.2
The only independent variable that demonstrated a statistically significant impact
on response rate at the .05 levels was exposure to social marketing promotions (p=. 043).
Two additional independent variables showed significance at the .10 levels. These
included being Asian or of Asian descent and being over 59 years of the age.
Calculation of odds ratios allowed for comparison of response likelihood between
levels (categories) of the independent variables. Odds ratios possess a property that
allows for inversion of the odds ratio. Where appropriate for more salient analyses, the
inverted odds ratios statistic was used.
Confidence intervals that do not include 1.0 can be considered significant in
prediction probabilities for logistic regression models (Jette et al., 2003; Garson, 2002;
Pritchard, King, & Czajka-Narins, 1997). For social marketing purposes, independent
variables that did not include a 1.0 confidence interval were considered significant and
were included in the explanatory process. All independent variables met significance
95
criteria either through Wald significance or confidence interval significance and were
included in the explanation of the model.
The study participants exposed to the promotional components of the social
marketing program were more than two-and-one-half times more likely to participate in
the WBRFSS. The confidence interval indicated that even after allowing for sampling
error the estimated odds for responding was three percent higher for those exposed to
social marketing promotions than those who were not (Table 18).
Those over 57 years of age were six-and-a-half times more likely to respond than
those under 39 years of age and 3.7 times more likely to respond than 39-57 year olds.
Those 39-57 years of age were 1.7 times more likely to respond than those under 39
(Table 18).
Males were 71 percent less likely to respond to the WBRFSS than females. Those
who lived outside of Howard County were 40 percent less likely to respond to the
WBRFSS than those who were in-county residents (Table 18).
African-Americans were almost 31 percent less likely to respond than Whites.
Asian study sample members were 11 percent less likely to respond than Whites (Table
18).
Those with some college were two-and-a-half times more likely to respond than
those with a high school diploma only and one-and-a-half times more likely to respond
than college graduates. College graduates were 1.7 times more likely to respond than
high school graduates (Table 18).
Those without Internet access in the home were approximately 31 percent less
likely to respond than those with Internet access in the home. Those with a high
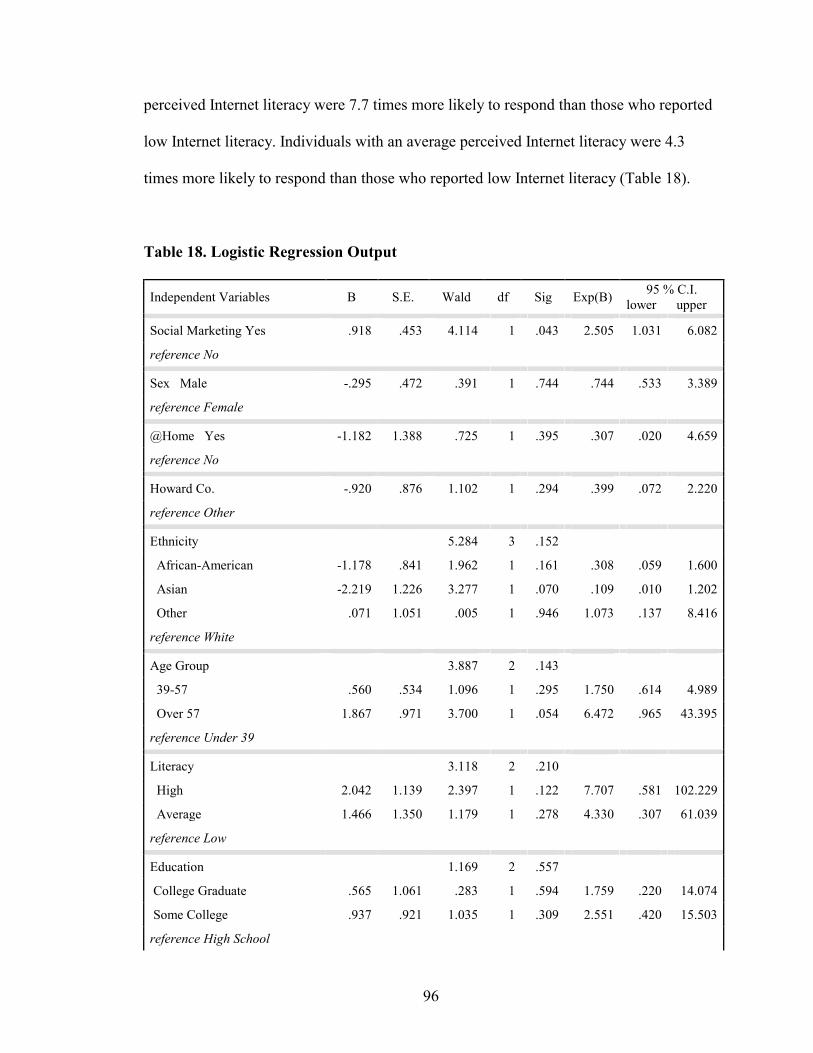
96
perceived Internet literacy were 7.7 times more likely to respond than those who reported
low Internet literacy. Individuals with an average perceived Internet literacy were 4.3
times more likely to respond than those who reported low Internet literacy (Table 18).
Table 18. Logistic Regression Output
Independent Variables B S.E. Wald df Sig Exp(B) 95 % C.I.
lower upper
Social Marketing Yes .918 .453 4.114 1 .043 2.505 1.031 6.082
reference No
Sex Male -.295 .472 .391 1 .744 .744 .533 3.389
reference Female
@Home Yes -1.182 1.388 .725 1 .395 .307 .020 4.659
reference No
Howard Co. -.920 .876 1.102 1 .294 .399 .072 2.220
reference Other
Ethnicity 5.284 3 .152
African-American -1.178 .841 1.962 1 .161 .308 .059 1.600
Asian -2.219 1.226 3.277 1 .070 .109 .010 1.202
Other .071 1.051 .005 1 .946 1.073 .137 8.416
reference White
Age Group 3.887 2 .143
39-57 .560 .534 1.096 1 .295 1.750 .614 4.989
Over 57 1.867 .971 3.700 1 .054 6.472 .965 43.395
reference Under 39
Literacy 3.118 2 .210
High 2.042 1.139 2.397 1 .122 7.707 .581 102.229
Average 1.466 1.350 1.179 1 .278 4.330 .307 61.039
reference Low
Education 1.169 2 .557
College Graduate .565 1.061 .283 1 .594 1.759 .220 14.074
Some College .937 .921 1.035 1 .309 2.551 .420 15.503
reference High School

97
Constant 2.858 1.699 2.828 1 .093 17.427
98
Respondent & Non-Respondent Follow-up Interviews
Follow-up interviews were conducted by telephone with respondents and non-
respondents in both the WBRFSS-C and WBRFSS-E groups. Twenty-three interviews
were completed for each of the four groups for a total of 92 follow-up interviews. The
data gathered during the follow-up interviews were used in the logistic regression
analysis as well as for the qualitative analysis.
Follow-up interviewees (N=92) were posed a series of questions (Appendix M).
Non-respondents were asked why they did not participate in the WBRFSS, whether they
had Internet access in the home, and what they felt their perceived Internet literacy was.
Respondents were asked about why they participated, potential barriers to participation,
and additional promotional strategies. Additionally, WBRFSS-E respondents and non-
respondents were also asked if they noticed any of the promotional components, which
promotional components they noticed, and which promotional components they felt were
effective.
Fifty-two percent of non-respondents and 100 percent of respondents identified
observing one or more of the study’s promotions. The Chi-square test of independence
(x2 = 7.131, df = 1, p = .028) was used to determine whether a statistically significant
association existed between the WBRFSS-E respondents and non-respondents for
observation of one or more of the WBRFSS social marketing promotions. The WBRFSS-
E respondents viewed the social marketing promotions at a significantly higher rate than
the WBRFSS-E non-respondents.
Reasons for non-response included 1) not interested, 2) lack of time, 3) not
important, 4) forgot, 5) didn’t apply, 6) lack of access, 7) too personal, and 8)
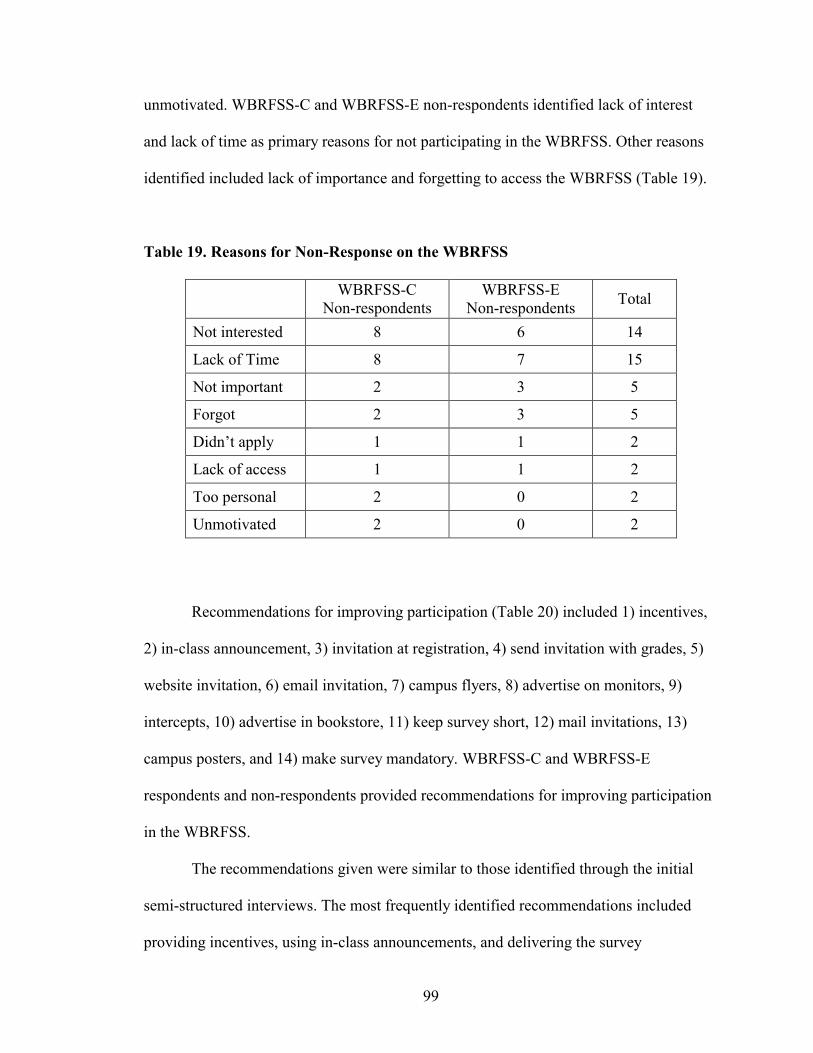
99
unmotivated. WBRFSS-C and WBRFSS-E non-respondents identified lack of interest
and lack of time as primary reasons for not participating in the WBRFSS. Other reasons
identified included lack of importance and forgetting to access the WBRFSS (Table 19).
Table 19. Reasons for Non-Response on the WBRFSS
WBRFSS-C
Non-respondents WBRFSS-E
Non-respondents Total
Not interested 8 6 14
Lack of Time 8 7 15
Not important 2 3 5
Forgot 2 3 5
Didn’t apply 1 1 2
Lack of access 1 1 2
Too personal 2 0 2
Unmotivated 2 0 2
Recommendations for improving participation (Table 20) included 1) incentives,
2) in-class announcement, 3) invitation at registration, 4) send invitation with grades, 5)
website invitation, 6) email invitation, 7) campus flyers, 8) advertise on monitors, 9)
intercepts, 10) advertise in bookstore, 11) keep survey short, 12) mail invitations, 13)
campus posters, and 14) make survey mandatory. WBRFSS-C and WBRFSS-E
respondents and non-respondents provided recommendations for improving participation
in the WBRFSS.
The recommendations given were similar to those identified through the initial
semi-structured interviews. The most frequently identified recommendations included
providing incentives, using in-class announcements, and delivering the survey
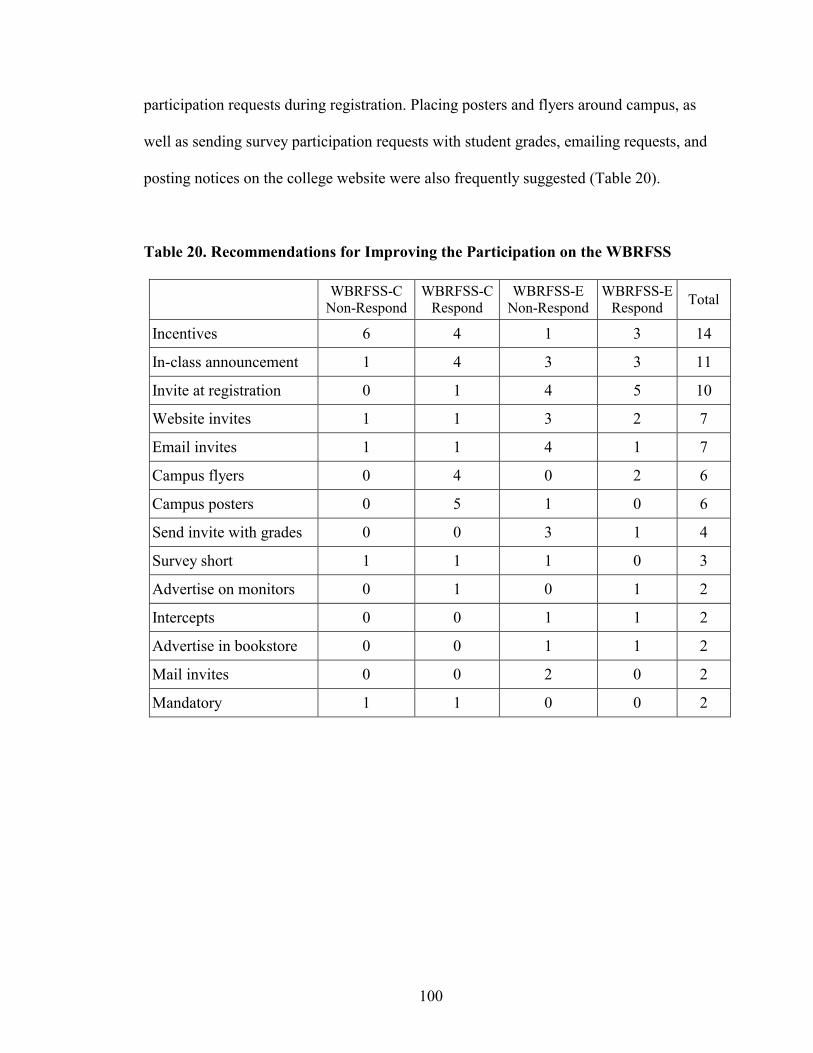
100
participation requests during registration. Placing posters and flyers around campus, as
well as sending survey participation requests with student grades, emailing requests, and
posting notices on the college website were also frequently suggested (Table 20).
Table 20. Recommendations for Improving the Participation on the WBRFSS
WBRFSS-C
Non-Respond WBRFSS-C
Respond WBRFSS-E
Non-Respond WBRFSS-E
Respond Total
Incentives 6 4 1 3 14
In-class announcement 1 4 3 3 11
Invite at registration 0 1 4 5 10
Website invites 1 1 3 2 7
Email invites 1 1 4 1 7
Campus flyers 0 4 0 2 6
Campus posters 0 5 1 0 6
Send invite with grades 0 0 3 1 4
Survey short 1 1 1 0 3
Advertise on monitors 0 1 0 1 2
Intercepts 0 0 1 1 2
Advertise in bookstore 0 0 1 1 2
Mail invites 0 0 2 0 2
Mandatory 1 1 0 0 2
101
Summary
This chapter reported the data and analyses associated with the semi-structured
interviews (SSI), the Promotional Component Questionnaire (PCQ), and the Web-based
Behavioral Risk Factor Surveillance Survey (WBRFSS). This chapter also reported the
results associated with the study’s four research hypotheses and post-survey follow-up
interviews.
Semi-structured interviews (SSI) were used to develop the 24-item promotional
component questionnaire (PCQ). After analysis, the 24-item questionnaire resulted in 10
items that provided the framework for the social marketing promotional components that
included posters, flyers, and mail notifications for the study.
The 2001 Behavioral Risk Factor Surveillance System (BRFSS) was adapted to a
70 item Web-based Behavioral Risk Factor Surveillance Survey (WBRFSS). Seven
hundred and seventy four students were then randomly assigned to control (WBRFSS-C)
and experimental groups (WBRFSS-E). Seven hundred and seventy students were
successfully mailed WBRFSS participation requests. Seventy completed the WBRFSS,
representing an overall response rate of 9.1 percent.
Research hypothesis one examined whether there was a statistically significant
association between the WBRFSS-C and the WBRFSS-E groups on response rate. Chi-
Square and Fisher’s Exact Test showed the response rate for the WBRFSS-E group was
significantly higher than that of the WBRFSS-C group.
Research hypothesis two examined whether the response time on the Web-based
health survey was lower in the group exposed to social marketing strategies (WBRFSS-

102
E) compared to the one that was not (WBRFSS-C). The independent samples t-test for
the comparison of means showed no significant difference was found.
Research hypothesis three examined whether item completion rate would be
higher on the WBRFSS for the group exposed to social marketing strategies (WBRFSS-
E) than the one that was not (WBRFSS-C). Again, no significant association between the
two groups on item response rate was found.
Research hypothesis four sought to develop an explanatory model of response on
the WBRFSS using selected independent variables. The logistic regression model
included the dependent variable, response to the WBRFSS, and the independent
variables, exposure to social marketing promotions, age, sex, ethnicity, county of
residence, education, perceived Internet literacy, and availability of an Internet
connection at home. The Model Chi-square indicated one or more of the independent
variables in the model were significantly associated with response rate.
The only independent variable that demonstrated a statistically significant impact
on response rate using the Wald statistic was exposure to social marketing promotions.
Exposure to the promotional components of the social marketing campaign increased
likelihood of response to the WBRFSS by more than two-and-one-half times. Two
additional independent variables showed Wald significance at the .10 level. These
included being of Asian ethnicity and being over the age of 59. Inclusion of confidence
level significance resulted in all independent variables meeting significance criteria and
being included in the model.
103
CHAPTER V –DISCUSSION
Study Summary
This study examined the impact of social marketing on the response rate, response
time, and item completion rate of a Web-based Behavioral Risk Factor Surveillance
Survey (WBRFSS). This study also sought to generate an explanatory model of response
on the WBRFSS from selected independent variables.
The independent variable in this study was exposure to social marketing
promotions prior to delivery of a Web-based health survey. The dependent variables
included response rate, response time, and item completion rate. This study tested the
following research hypotheses:
1. The response rate on the WBRFSS will be higher in the group that is
exposed to the social marketing promotions than the one that is not.
2. The response time on the WBRFSS will be lower in the group that is
exposed to social marketing promotions than the one that is not.
3. The item completion rate will be higher on the WBRFSS in the group
that was exposed to social marketing promotions than the one that is not.
4. A regression model will be fit which explains response on the WBRFSS
from selected independent variables.
This study used both qualitative and quantitative data collection methods.
Qualitatively, data were gathered for the purposes of developing a social marketing
campaign for promoting the WBRFSS. Semi-structured interviews (SSI) were used as the
first step in developing the social marketing campaign of this study. A total of twenty-
104
three students were interviewed. A series of eleven questions (Appendix M) explored the
student’s perception of survey participation and promotional strategies.
A 24-item Web-based Promotional Component Questionnaire (PCQ) was
developed using the information gathered during the semi-structured interviews that
identified 1) the most effective and appropriate promotional channel(s), 2) barrier(s) to
participation, 3) the most effective and appropriate promotional message(s), and 4)
recommendations for improving participation. The PCQ included four open-ended
questions and 20 likert-scale items (Appendix D). Thirty-three out of a total of 254
students completed the online PCQ. This represented an estimated response rate of
approximately 7.5 percent. The results of the PCQ were analyzed. Those items in the
upper 50th percentile were retained from PCQ and resulted in 10 items that provided the
framework for the design, construction, and placement of the social marketing
promotional messages and channels for the Web-based health survey.
The 2001 Behavioral Risk Factor Surveillance System (BRFSS) questionnaire
was adapted for Web-based delivery and information gathering (Appendix I). The order
and wording of the 2001 BRFSS core questions were used in the Web-based adaptation.
To allow for equity of questions, sex specific questions were not included. One question
addressing pregnancy and six questions related to prostate health were not included.
Questions that asked about the number of telephones and lines in the home were replaced
by questions that addressed Internet access from home and Internet literacy. This resulted
in a 70 item Web-based Behavioral Risk Factor Surveillance Survey (WBRFSS).
Quantitatively, this study used an experimental design. The WBRFSS was
delivered first to the control group (WBRFSS-C) and then 24 days later to the

105
experimental group (WBRFSS-E). Prior to delivery of the WBRFSS, the WBRFSS-E
group was exposed to the social marketing campaign; the WBRFSS-C group was not.
The study population included students enrolled in credit classes at Howard
Community College (HCC) in Columbia, Maryland during the spring, 2003 semester
(N=5800). Eight hundred and forty-seven students were randomly selected for the study.
Exclusionary criteria were applied which included students who were under 18,
employees of HCC, students who participated in the semi-structured interviews, and
students who participated in the social marketing promotional component questionnaire.
This resulted in a total sample size of 774 who were then randomly assigned to either the
control (WBRFSS-C) or experimental (WBRFSS-E) groups.
Of the 770 students who were successfully mailed WBRFSS participation request
70 completed the WBRFSS. This represents an overall response rate of 9.1 percent. Of
respondents who completed the WBRFSS, 75.7 percent were female and 24.3 percent
were male. The mean age was 40.07 years of age (SD=17.65). Ethnically, 87.1 percent
were Caucasian, 8.6 percent were African-American, 1.4 percent were Asian, and 2.9
percent identified themselves as other or unknown. Educationally, respondents included
27.1 percent college graduates, 67.1 percent with some college, and 5.7 percent with less
than a year of college. Most respondents lived in Howard county (90.1 percent), with the
remaining living in Prince Georges county (7.1 percent), Anne Arundel county (1.4
percent), and Baltimore county (1.4 percent).
Respondents identified the place from which they accessed the Internet to
complete the WBRFSS; 74.3 percent accessed the Internet from home, 18.6 percent from
work, and 7.1 percent from HCC. More than half (55.7 percent) of the respondents rated
106
their ability to use the Internet (Internet literacy) as high, 35.7 percent rated themselves as
average, and 8.6 percent rated themselves as low.
Research hypothesis one examined whether there was a statistically significant
association between the WBRFSS-C and the WBRFSS-E groups on response rate. Chi-
Square and Fisher’s Exact Test showed that the response rate for the WBRFSS-E group
was significantly higher than that of the WBRFSS-C group. Response rates were 5.96
percent for the WBRFSS-C group, and 12.24 percent for the WBRFSS-E group.
Research hypothesis two examined whether the response time on the Web-based
health survey was lower in the WBRFSS-E than the WBRFSS-C. The mean response
times for the WBRFSS-C was 96.09 hours (SD=49.41) and 124.53 hours (SD=112.75)
for the WBRFSS-E. The independent samples t-test for the comparison of means found
no significant difference between the mean response time of the WBRFSS-C and that of
the WBRFSS-E.
Research hypothesis three examined whether item completion rates would be
higher on the WBRFSS for the WBRFSS-E than for the WBRFSS-C. The item response
rate was measured as the percentage of questions completed. The mean item completion
rate for the WBRFSS-C was 99.50 percent and for the WBRFSS-E was 99.82 percent.
The t-test for independent means indicated that there was no significant difference
between the two groups on item response rate.
Research hypothesis four sought to develop an explanatory model of response on
the WBRFSS using selected independent variables. The logistic regression model
demonstrated that exposure to social marketing promotions had a statistically significant
impact on response rate. The study participants exposed to the promotional components
107
of the social marketing campaign were two-and-one-half times more likely to participate
in the WBRFSS.
The regression model also demonstrated other characteristics that influenced
response rate, although these differences were not significant (p>.05). The younger a
study participant was the less likely he/she was to respond. Male participants were much
less likely to respond than females. Asian and African-American participants were less
likely to respond than White students. Those who lived outside of Howard County were
less likely to respond to the WBRFSS than those who were in-county residents.
The lower the level of education of a participant, the less likely he/she was to
respond. Lack of Internet access in the home reduced the likelihood of response on the
WBRFSS. The lower the level of perceived Internet literacy, the less likely the
participant was to respond.
Discussion
The response rate (9.1 percent) was surprisingly low. Due to the low response rate
results of this study must be interpreted with extreme caution. The data seems to indicate
that it is correct to accept the research hypothesis that exposure to social marketing
promotions would increase participation in the WBRFSS. However, because of the low
response rate this interpretation may be incorrect. The small sample size decreases power,
which increases the potential for a type II (beta) error.
The WBRFSS-C had the WBRFSS delivered just prior to Spring Break, and the
WBRFSS-E had it delivered at the end of the semester. It is likely that both delivery
times may have affected motivation to participate.
108
During Spring Break, students do not have access to the campus and are often
engaged in social and/or personal activities that remove them from their homes and
Internet access. As the semester comes to an end, students tend to be focused on
preparing for final exams and finishing required class assignments. In both cases,
motivation for participating may be reduced.
The use of additional mail or email reminders may have helped increase overall
response rate. It is also possible that such follow-up reminders may have had different
impacts on the WBRFSS-C and WBRFSS-E groups. Mail reminders or follow-up
notifications were not used in this study in an attempt to reduce overall cost of the study.
Email reminders or follow-up notifications were not used due to incomplete identification
of student email addresses..
Even though overall response rate was low, the response rate for the WBRFSS-E
(12.24 percent) was significantly higher than that for the WBRFSS-C (5.96 percent).
Logistic regression analysis showed when all other independent variables were held
constant, exposure to the social marketing campaign increased participant response on the
WBRFSS more than two and a half times. This result demonstrated the positive impact
the social marketing campaign had on the response rate of this study’s Web-based health
survey.
The findings of this study agree with other programs and studies which found
that social marketing can contribute to successful outcomes (Novelli, 1990). Examples of
the effective use of social marketing programs include the National High Blood Pressure
Education Program (National Heart, Lung, and Blood Institute, 1984), "Break Free" - the
National Program To Reduce Tobacco Use (Mintz, 2001a), "Really Me" - Action on
109
Drug Abuse (Mintz & May, 2001), and ENABL - the California State's teen pregnancy
prevention program (Mkt4change.com, 1999).
There was no significant difference on mean response times between the
WBRFSS-C and the WBRFSS-E. The overall group response time for the WBRFSS-E
(387 hours) was more than two and a half times greater than that for the WBRFSS-C (152
hours).
Even though no differences were found on mean response times for the two
groups, there were differences found on other characteristics related to response time
which may provide insight into the impact the social marketing had on WBRFSS
participation. The WBRFSS-E respondents completed the WBRFSS 28 hours earlier than
the respondents on the WBRFSS-C. Also, the initial response of the WBRFSS-E was
quicker than that for the WBRFSS-C. This suggests that exposure to the social marketing
campaign may influence the immediacy of response as well as maintain motivation
among participants to respond and as such, extend the overall response period. The
campaign may have also acted to remind WBRFSS-E group members to complete the
WBRFSS.
The length of the WBRFSS did not seem to affect item completion rate for the
study sample. While the WBRFSS was a relatively long survey, both the WBRFSS-C and
the WBRFSS-E had, on average, a nearly 100 percent item completion rate. This may be
attributed to a high level of motivation on the part of respondents, the relatively high
level of Internet literacy present in the study sample, or a combination of the two.
Additionally, the WBRFSS-C and WBRFSS-E groups demonstrated no statistically
significant differences on mean item completion rates and as such, the impact exposure to
110
the social marketing campaign had on item completion rates, if any, could not be
determined.
This study’s logistic regression analysis demonstrated that the social marketing
promotions had a significant impact on response rate. However, response rate was still
unacceptably low. This may indicate that the development of the social marketing
promotions was not inclusive enough for the population of study. The social marketing
developmental strategies used in this study may require improvement, supplementation,
and/or replacement.
Logistic regression analysis determined that individuals with certain demographic
characteristics were less likely to respond to the WBRFSS. The identification of the
demographic characteristics that produced lower response rates on the WBRFSS may
help to improve the social marketing campaigns developed for promoting Web-based
health surveys within this study’s population. These characteristics included being
younger in age, being male, being a minority, being a non-Howard County resident,
lower educational level, and lower perceived Internet literacy.
Follow-up telephone interviews were conducted with WBRFSS-C and WBRFSS-
E respondents and non-respondents (N=88) and provided input into additional methods
for improving the response rate. These included providing incentives, in-class
announcements, sending survey participation requests with student grades, emailing
requests, and delivering the survey participation requests during registration. Further
inclusion of these strategies may help to positively impact response. The interviews
further identified reasons for non-response including lack of importance, lack of time,
111
lack of interest, fear of lack of confidentiality, and lack of accessibility. Efforts to
address these issues may result in improved response rates.
However, the previous suggestions for improving response rate were the result of
data collection from a relatively limited sample of the study population. Additional
qualitative techniques such as focus groups and interviews could be used to identify
additional audience characteristics. This would allow for the development of promotional
strategies, channels, and messages that better motivate response in individuals with those
particular demographic characteristics. Such targeted marketing of groups and/or
individuals with those particular demographic characteristics may help to increase
response rate. Further, improving access to the Internet and/or Internet literacy may also
improve response rate.
Implications
This study examined the impact of social marketing on a Web-based health
survey. Results suggest that social marketing might significantly increase participation on
a Web-based Risk Factor Surveillance Survey (WBRFSS).
Of concern for this study is the low response rate. External validity may have
been relatively low due to demographic differences between the study sample, study
population, and the U.S. population. Even with this concern, certain aspects of this
study’s methodology, including the use of mailed notification for more universal
coverage and use of a list-based population may be useful in improving the response rate
and reducing the coverage error typically found with Web-based health surveys.
Also, the use of a social marketing framework may help to improve response rates
on Web-based health surveys. Several of the social marketing strategies used in this study
112
helped to segment the audience (study population). The semi-structured interviews, the
promotional component questionnaires, and the follow-up interviews provided
information on consumer demographic characteristics and promotional and product
preferences of the study population as they relate to promotion of the Web-based survey.
The use of logistic regression analysis further helped to analyze the study
population and examined response and non-response patterns. The follow-up interviews
also helped to further refine the target population’s promotional preferences as well as
identify additional barriers to participation.
Fifty-two percent of non-respondents and 100 percent of respondents identified
observing one or more of the study’s promotions. This indicates that 48 percent more of
the WBRFSS-E respondents were actually exposed to the social marketing campaign.
Strategies to increase the exposure of the social marketing campaign to the target
population may help to further boost the response rate. These might include insertion of
promotions in various college mailings such as registration announcements, and in-class
promotional reminders by instructors. Additionally, more campus flyers and posters,
website promotions, and promotions on campus monitors might also be used. Even
though financial incentives could not be used in this study due to administrative and
resource limitations, such incentives may be effective in improving response rates in
populations that are not prevented from using them. Additionally, creative incentives
such as providing health related information after completion of the survey may be useful
in situations which do not allow financial incentives, as well in those that do.
113
Both control (WBRFSS-C) and experimental (WBRFSS-E) groups had universal
Internet access through the home, the college, or public access. Those respondents in the
group exposed to the to social marketing campaign (WBRFSS-E) demonstrated a higher
response rate than those in the group that was not (WBRFSS-C). This suggests that the
application of a social marketing campaign may further increase response rate in a
population with universal or near-universal Internet access, such as colleges, universities,
government agencies, and certain businesses.
Additionally, both the WBRFSS-C and WBRFSS-E identified similar rates of
Internet access from home, 95.65 percent of the WBRFSS-C and 97.14, respectively.
Almost 77 percent of the WBRFSS-E respondents accessed the survey from home as
compared to approximately 70 percent of the WBRFSS-C respondents. This may suggest
that exposure to a social marketing campaign may increase response in those with home
Internet access.
The presence of Internet access in the home may have increased participation
independently of exposure to social marketing. If this is the case, then increasing Internet
access in the homes of a given population of interest should increase response rates on
Web-based surveys given to that population. The U.S. government has identified the need
and importance of increasing the number of households with access to the Internet at
home (Centers for Disease Control and Prevention, 2001c). Dissemination of health
messages through public education campaigns seek to encourage healthy behaviors,
create awareness, change attitudes, and motivate individuals to adopt recommended
behaviors. Campaigns traditionally have relied on mass communication and educational
messages in printed materials to deliver health messages (Centers for Disease Control and

114
Prevention, 2001c). The advent of the Internet provides a means of greater distribution of
these messages. Increasingly, health improvement activities are taking advantage of the
World Wide Web that can target audiences, tailor messages, and engage people in
interactive, ongoing exchanges about health (Centers for Disease Control and Prevention,
2001c).
Whether it is the exposure to the social marketing campaign, the presence of
Internet access in the home, or an interaction between the two, increasing Internet access
in the home is likely to increase response rate on Web-based health surveys. In general,
increased access to the Internet from the home, colleges and universities, work, and
government buildings is likely help to increase response rate and decrease coverage error
on Web-based health surveys.
A low level of perceived Internet literacy correlated with low response rate on the
WBRFSS for this study. Perceived Internet literacy relates to Internet self-efficacy and
has been positively correlated to Internet usage (Easton and LaRose, 2000). Internet self-
efficacy, or the belief in one's capabilities to organize and execute sequences of Internet
actions required to produce given attainments, is a potentially important factor in efforts
to close the digital divide that separates experienced Internet users from novices (Easton
and LaRose, 2000).
Use of a list-based sampling method has been identified as an effective method of
survey sampling for increasing response rate and controlling coverage error (McCabe et
al 2002). An advantage to having a list-based sample is that it enables one to determine
who responded and if necessary, follow-up with non-respondents (McCabe et al 2002).

115
The present study used a list-based sample with selected demographic information
available regarding non-respondents. This made it possible to examine demographic
differences between respondents and non-respondents. For the population of study, the
list-based sample reduced coverage error by allowing identification of non-respondents.
The methodology of this study may also be useful in improving other Web-based
and non-Web based health surveys. There are at least six survey modes that have been,
currently are being, or could be used for health surveillance today. These include self-
administered paper surveys, face-to-face procedures, telephone interviews, mail surveys,
Internet surveys, and touch-tone entry or interactive voice response surveys. Multi-mode
surveying involves using two or more survey methods to improve data gathering. The
potential for continuous collection of health data, as well as improvement of response
rates and decreasing coverage error may be achieved by using multi-mode methods
(Dillman, 2000; Schaefer & Dillman, 1998; Aday, 1996). Web-based health surveys
could serve as one method in a multi-mode survey methodology.
The main reason for using a multi-mode method for surveys is that developing
technologies may not be available to all members of a population, therefore eliminating
the chance for being selected (Cobanoglu, Warde, & Moreo, 2001). Within each group
there may be subgroups of people who can only be reached by, or prefer to answer, a
particular survey method (Dillman, 2000). This suggests that implementation of a multi-
mode survey may be capable of generating responses from a greater range of individuals
and so boost response rates and increase coverage.
Additionally, while a Web-based version may represent only one mode of
delivery for the survey, data that are collected via other modes (in-person interview,
116
telephone, etc) could conceivably, using wired and wireless Internet connection
technology, be entered into a common website and the data almost instantaneously
analyzed and quickly made available to stakeholders and researchers.
The social marketing campaign used for this study may also be implemented in a
multi-mode survey to improve awareness of a survey and maintain motivation to
participate in the survey. Additional analysis of audience demographics, psychographics,
and behavioral characteristics would provide the means for further audience segmentation
and development of targeted promotional components. Use of promotional marketing
strategies for the multi-mode survey would most likely improve its data gathering
outcomes.
Limitations of the Study
There are several important limitations to this research. The most significant
limitation of this study is the low response rate. As a result of the low response rate,
interpretation of results must be made with extreme caution. Results of the various
hypotheses analyses, including the logistic regression modeling may not be valid. The
low response rate may also increase the potential for a type II error.
The Behavioral Risk Factor Surveillance System (BRFSS) questionnaire was
adapted for delivery on the World Wide Web. The health behavior data gathered by the
WBRFSS was not analyzed initially. The WBRFSS data will be analyzed in the future to
determine health status and behaviors of the study sample. Comparison of the WBRFSS
analysis to existing BRFSS data for individuals with similar demographics might allow
for validation of the Web-based adaptation of the BRFSS.
117
Demographic differences existed between the study sample, study population, and
the U.S. population in general. The study sample and the study population under-
represented males and over-represented females when compared to the U.S. population.
Both the study sample and population had an over-representation of minorities and an
under-representation of whites when compared to the U.S. population.
The levels of Internet access were higher in the study sample than in the general
population. The under-representation of people without access to the Internet and/or
without significantly appropriate Internet literacy may cause biased results.
There were also demographic differences between the study sample and study
population. A significant difference between the mean age of the study sample (34.5
years) and the study population (23 years) was observed. Within the study sample, males
were under-represented and women over-represented by approximately eight percent.
Howard County residents were over-represented four and a half percent more in the study
population than in the study sample.
Whites were over-represented by approximately seven and a half percent more in
the sample than in the study population. Asian ethnicities were approximately four
percent lower and African-American and Hispanic ethnicities were each approximately
one and a half percent lower in the study sample than in the study population. American
Indian ethnicities were approximately the same in the study sample and population.
Results may be biased and should be interpreted with caution. Existence of
multicollinearity inflates the variances of the parameter estimates (Center For Statistical
Computing Support, 2001). For small and moderate sample sizes, this may result in a
lack of statistical significance of individual independent variables even though the overall

118
model may be significant (Center For Statistical Computing Support, 2001).
Multicollinearity may also result in incorrect conclusions about relationships between
independent and dependent variables (Center For Statistical Computing Support, 2001).
Recommendations
Based on the findings and conclusions of this study, recommendations for this
study are made in three categories. These include recommendations related to the study
method as conducted at Howard Community College, recommendations related to the
study methodology in general, and recommendations for extending the use of Web-based
health surveys.
In relation to the study as it was conducted at Howard Community College, the
following recommendations are made:
1. Conduct additional qualitative research on the Howard
Community College population to improve audience
segmentation and develop targeted promotional materials.
2. Conduct additional research using this study’s design to
determine impact on response rate and coverage error if the
WBRFSS were delivered at different times during the school
year.
3. Conduct additional research using this study’s design that
excludes mailed participation requests and uses only social
marketing promotions to determine impact on response rate
and coverage error.
119
4. Conduct additional research using this study’s design with
participation requests being included with registration and
grade mailings to determine impact on response rate and
coverage error.
5. Revise the content of the Web-based survey based on the needs
of the college community so as to gather more relevant and
useable health data.
6. Conduct additional research that incorporates a time series
design to determine both changes in health status over time as
well as continuous response rates.
In relation to the using this study’s methodology, the following recommendations
are made:
1. Conduct additional research that compares the use of this
study’s social marketing framework and strategies to other
standard methods for improving response rates..
2. Conduct additional research using this study’s social marketing
framework and strategies with a population that is more
demographically heterogeneous to determine the impact on
response rate.
3. Conduct additional research using this study’s social marketing
framework and strategies with a population that has a
perceived Internet literacy level and home Internet access that

120
is more heterogeneous to determine the impact on response
rate.
4. Using this study’s social marketing framework and strategies,
deliver the WBRFSS to a population in which participation is
mandatory and determine the impact such a practice would
have on response rate. Mandatory participation could be
established through organizational policy.
5. Conduct additional research using this study’s social marketing
framework and strategies with a business, organizational, or
governmental population and determine the impact on response
rate.
In relation to extending this study’s methodology to the use of Web-based health
surveys, the following recommendations are made:
1. Conduct additional Web-based health survey research using
social marketing techniques applied to larger populations (e.g.,
county, state, local).
2. Conduct additional research to determine the validity and
comparability of responses between the BRFSS and the Web-
based version.
3. Conduct additional research using social marketing techniques
applied to different Web-based versions of governmental
health surveys (e.g., National Health and Nutrition
Examination Survey, National Health Care Survey, National
121
Health Interview Survey) to determine impact on response rate
and coverage error.
4. Conduct additional research that examines the impact a multi-
mode delivery of a Web-based health survey would have on
equivalence of response, response rate and coverage error.
5. Conduct additional research that examines the impact social
marketing has on the response rate and coverage error of a
mixed mode methodology of a health survey of which a Web-
based method would be included.
Conclusions
Health surveillance is the tool that provides the necessary data to define disease
burden, identify populations at highest risk, determine the prevalence of health risks, and
guide and evaluate disease prevention efforts at the national, state, and local levels
(Centers for Disease Control and Prevention, 2001b). Health surveys are the most
common method of health surveillance (Pealer et al., 2001; Sarvela & McDermott, 1999;
Hoffman, 1997; Aday, 1996). Data gathered through health surveys are used by
policymakers, public health professionals, private providers, insurers, and health care
professionals in the planning, implementing, and evaluating of health-related programs
and policies (Pealer et al., 2001; Sarvela & McDermott, 1999; Hoffman, 1997; Aday,
1996).
The use of Web-based health surveys for gathering data is relatively new. Review
of the literature found few Web-based health-related surveys. This study examined the
impact social marketing had on a Web-based behavioral risk factor survey. The results

122
seemed to demonstrate that social marketing could have a significant impact on response
rate of a Web-based health survey.
At the completion of this study, only two studies that used mail-solicited
participation in Web-based surveys had been identified in the literature (Yun & Trumbo,
2000; Comley, 1996). These surveys reported one percent (Comley, 1996) and 15 percent
(Yun & Trumbo, 2000) response rates. Neither of these surveys was a health-oriented
Web-based survey. However, each did use list-based populations.
Comparison of this study’s overall response rate (9 percent) shows it to be much
higher than Comley’s (1996) one percent response rate and much lower than Yun &
Trumbo’s (2000) 15 percent response rate. When the response rate for those exposed to
the social marketing promotions in this study is examined (12.24 percent) there is a
smaller gap between that group’s response rate and that for the similar Yun & Trumbo
(2000) study.
However, the viability of using Web-based surveys to gather health-related data
is dependent on raising the response rates and establishing adequate coverage. Even the
15 percent response rate of Yun & Trumbo (2000) is significantly lower than that
produced by mail and/or telephone surveys.
The rate of Internet use in the U.S. is currently growing at a pace of two million
new Internet users per month (U.S. Department of Commerce, 2002). Between 2000 and
mid-2002, every demographic gained ground in access (Lenhart, 2003; U.S. Department
of Commerce, 2002). Forty-two percent of American adults identified themselves as non-
users (Lenhart, 2003). Of the non-users, 74 percent reported having access to the Internet
123
through family members or close friends and sixty percent reported knowing a place in
their community where the Internet is publicly available (Lenhart, 2003).
As access to the Internet more closely approaches saturation levels in our society,
the potential for obtaining acceptable levels of coverage and response in Web-based
health surveys increases. Access to the Internet also provides for application of Web-
based health surveys to both targeted populations as well as the U.S. population at large.
This potential for using the Web for health surveying must translate in coverage and
response rate numbers which approach those of the current mail and telephone surveys if
they are to be useful.
A major concern regarding surveying in the U.S. has been identified. Sheehan
(2001) reports that the US population is being over-surveyed: the growth in the amount of
survey research being undertaken has resulted in an increase in the number of requests to
individuals to complete surveys. This may lower response rates, since individuals' overall
attitudes toward surveys in general may be unfavorable and the aura of 'uniqueness' to the
participation in the survey process diminishes (Sheehan, 2001). Also, as technology
which allows potential survey participants to screen and block telephone calls access to
potential survey participants is reduced, response rate is likely to decrease and coverage
error to increase. Similar technology is currently being developed for email users which
would improve their ability to screen and block incoming email.
Social marketing may present an opportunity to overcome these concerns and
improve response rates and decrease coverage error. Social marketing also provides a
framework for developing and delivering local, state, and national health surveys via the
World Wide Web. Using social marketing campaigns to promote new Web-based health

124
surveys, Web-based versions of existing health surveys, or delivering multi-mode surveys
that include a Web-based method could serve to increase awareness of and involvement
by potential participants.
Policy aspects of a social marketing campaign for a Web-based health survey
might focus on increasing public access to the Internet, lowering Internet service costs in
the home, or perhaps even through making survey participation mandatory. Any of these
would require significant governmental resources. Making any survey mandatory would
require addressing legal concerns which might include privacy, accessibility, and
accommodation issues.
Politically, lobbying groups which are actual or potential stakeholders, such as
federal, state, and local governments, physicians, insurance companies, and health
organizations to assist in funding and/or promotion would also increase the awareness,
response, and data collection potential of Web-based health surveys. Promotion, funding,
sponsorship, or delivery of Web-based surveys by such government, private, or non-
profit organizations would also require addressing added issues. In addition to the legal
issues previously mentioned when considering policy concerns, another issue would
include establishing and/or maintaining trust by the consumer for the organization (s)
involved with the Web-based health survey.
Additionally, ethical considerations must be given to use of the Internet as a
vehicle for gathering survey data. Internet research raises a number of complex issues for
the scientific community, research subjects, and policy makers (Cohen, 2000). Research
is necessary to examine whether these issues have different qualities and/or concerns
when delivered on the Internet as compared to the physical world (Cohen, 2000). Issues
125
of privacy, confidentiality, and anonymity are in the forefront of the ethics of Internet
research, especially when one considers that it is health data that is being gathered.
There are two sources of potential harm to subjects from research (Cohen, 2000).
These include harm resulting from participation in the research and harm resulting from
breach of confidentiality (Cohen, 2000). Since there is generally no direct contact with
subjects participating in research over the Internet, it may be difficult or impossible to
deal with individual subject reactions (Cohen, 2000). Breach of confidentiality is the
primary source of harm in most Internet research (Cohen, 2000).
Investigators need to address how they intend to assure confidentiality, keeping in
mind that the degree of concern over confidentiality is directly related to the sensitivity of
the data. Data submitted over the Web can only be anonymous if software is used to store
the information directly in a database without identifiers (Cohen, 2000). The risk of
access to personal health information and the linkage of that information to a particular
individual must be considered and protected when gathering health behavior data in an
online survey.
Development of real-time data analysis through the use of interactive Web-based
health surveys is necessary if such surveys are to serve and meet the expectation of near-
instantaneous data analysis and availability. One of the great strengths of online health
behavior surveys is the potential for quick access by researchers and stakeholders.
Future plans call for the WBRFSS or some other Web-based health survey to be
implemented on a continuous data collection basis at Howard Community College.
Collection and analysis of the health behaviors of the study population will hopefully
allow for development of better information and interventions for the individual students

126
who make up the study population. In the long term, it is hoped that the data gathered
from the on-going Web-based health survey will be used to improve the health status of
the study population.
127
APPENDICES
Appendix A - IRB Approval

128

129
Appendix B - Semi-Structured Interview Informed Consent
I state that I am over 18 years of age, in good physical health, and wish to participate in this interview being conducted by Patrick Finley at Howard Community College in Columbia, Maryland as part of his dissertation research through the Department of Public and Community Health at University of Maryland, College Park. I understand that the purpose of this interview is to gather information about effective promotion messages and methods of presenting those messages. I understand that the interview will last between 20 and 30 minutes. I understand that participation is voluntary. I understand that I don’t have to answer any question I don’t want to and am free to end the interview at any time. There are no anticipated risks or benefits to participants. I understand that all information collected in this interview and all aspects of the study is strictly confidential and that my name will not be identified at any time. The information I provide will be grouped with information others provide for reporting and presentation. I understand that this interview, and the study it is a component of, are not designed to help me personally but to help the investigator learn more about effective promotion among Howard Community College students. I understand that I am free to ask questions or withdraw from participation at any time and without any penalty. I understand that the investigator, Howard Community College, University of Maryland, or the Department of Public and Community Health do not provide any compensation for participation in this interview. Print Name _______________________________________________ Signature ________________________________________________ Date _______________________ Patrick Finley (410) 772-4885 [email protected]
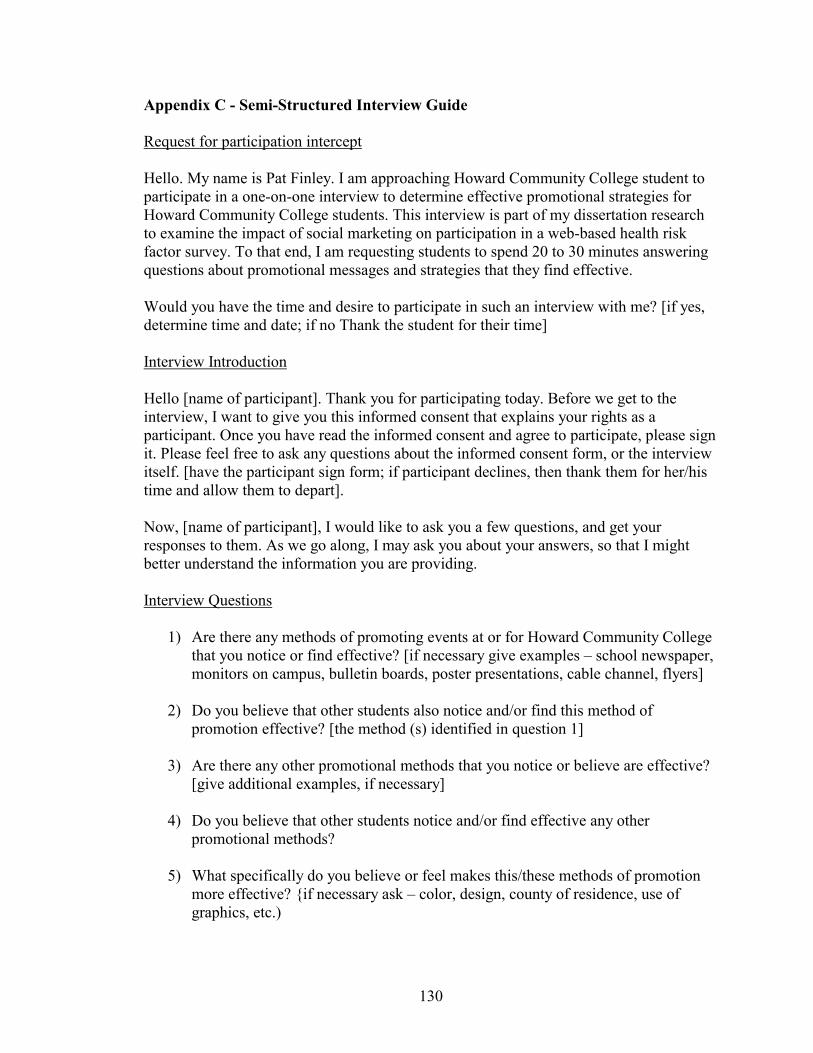
130
Appendix C - Semi-Structured Interview Guide Request for participation intercept Hello. My name is Pat Finley. I am approaching Howard Community College student to participate in a one-on-one interview to determine effective promotional strategies for Howard Community College students. This interview is part of my dissertation research to examine the impact of social marketing on participation in a web-based health risk factor survey. To that end, I am requesting students to spend 20 to 30 minutes answering questions about promotional messages and strategies that they find effective. Would you have the time and desire to participate in such an interview with me? [if yes, determine time and date; if no Thank the student for their time] Interview Introduction Hello [name of participant]. Thank you for participating today. Before we get to the interview, I want to give you this informed consent that explains your rights as a participant. Once you have read the informed consent and agree to participate, please sign it. Please feel free to ask any questions about the informed consent form, or the interview itself. [have the participant sign form; if participant declines, then thank them for her/his time and allow them to depart]. Now, [name of participant], I would like to ask you a few questions, and get your responses to them. As we go along, I may ask you about your answers, so that I might better understand the information you are providing. Interview Questions
1) Are there any methods of promoting events at or for Howard Community College that you notice or find effective? [if necessary give examples – school newspaper, monitors on campus, bulletin boards, poster presentations, cable channel, flyers]
2) Do you believe that other students also notice and/or find this method of
promotion effective? [the method (s) identified in question 1]
3) Are there any other promotional methods that you notice or believe are effective? [give additional examples, if necessary]
4) Do you believe that other students notice and/or find effective any other
promotional methods?
5) What specifically do you believe or feel makes this/these methods of promotion more effective? {if necessary ask – color, design, county of residence, use of graphics, etc.)
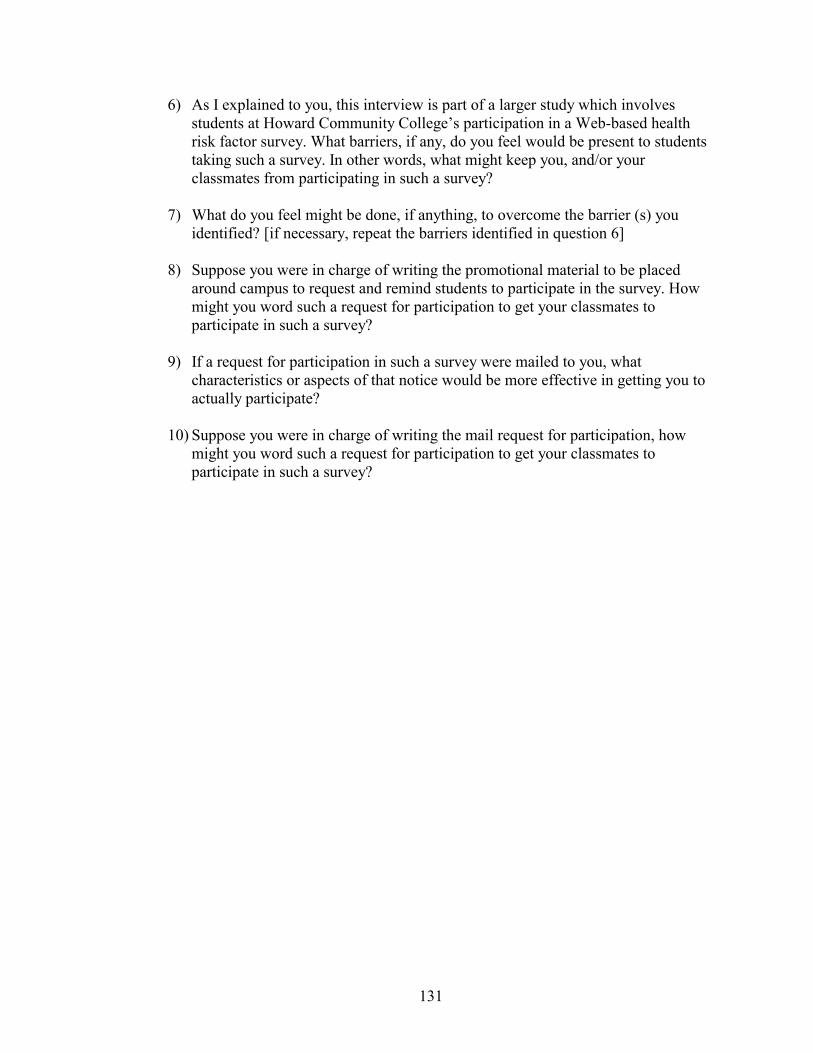
131
6) As I explained to you, this interview is part of a larger study which involves students at Howard Community College’s participation in a Web-based health risk factor survey. What barriers, if any, do you feel would be present to students taking such a survey. In other words, what might keep you, and/or your classmates from participating in such a survey?
7) What do you feel might be done, if anything, to overcome the barrier (s) you
identified? [if necessary, repeat the barriers identified in question 6]
8) Suppose you were in charge of writing the promotional material to be placed around campus to request and remind students to participate in the survey. How might you word such a request for participation to get your classmates to participate in such a survey?
9) If a request for participation in such a survey were mailed to you, what
characteristics or aspects of that notice would be more effective in getting you to actually participate?
10) Suppose you were in charge of writing the mail request for participation, how
might you word such a request for participation to get your classmates to participate in such a survey?
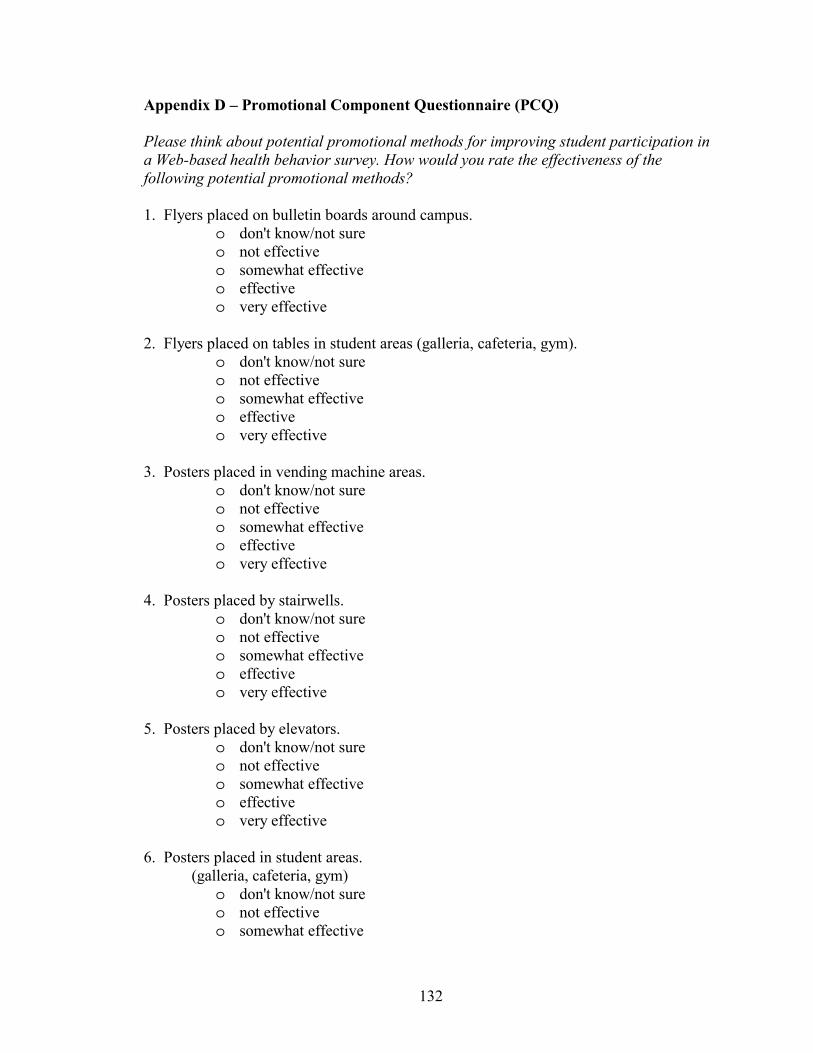
132
Appendix D – Promotional Component Questionnaire (PCQ) Please think about potential promotional methods for improving student participation in a Web-based health behavior survey. How would you rate the effectiveness of the following potential promotional methods? 1. Flyers placed on bulletin boards around campus.
o don't know/not sure o not effective o somewhat effective o effective o very effective
2. Flyers placed on tables in student areas (galleria, cafeteria, gym).
o don't know/not sure o not effective o somewhat effective o effective o very effective
3. Posters placed in vending machine areas.
o don't know/not sure o not effective o somewhat effective o effective o very effective
4. Posters placed by stairwells.
o don't know/not sure o not effective o somewhat effective o effective o very effective
5. Posters placed by elevators.
o don't know/not sure o not effective o somewhat effective o effective o very effective
6. Posters placed in student areas.
(galleria, cafeteria, gym) o don't know/not sure o not effective o somewhat effective

133
o effective o very effective
7. Email
o don't know/not sure o not effective o somewhat effective o effective o very effective
8. Promotions on the HCC Website.
o don't know/not sure o not effective o somewhat effective o effective o very effective
9. Any other promotional methods and/or county of residences that you believe would be
effective in contacting students (open ended). Now thinking about potential messages to be used in these promotions, how would you rate the effectiveness of the following aspects of those messages to improve student participation? 10. That the promotional message is brief.
o don't know/not sure o not important o somewhat important o important o very important
11. That the web survey URL address is simple.
o don't know/not sure o not important o somewhat important o important o very important
12. Color of the promotion.
o don't know/not sure o not important o somewhat important o important o very important
13. What color/colors do you believe would be most effective? (open ended)
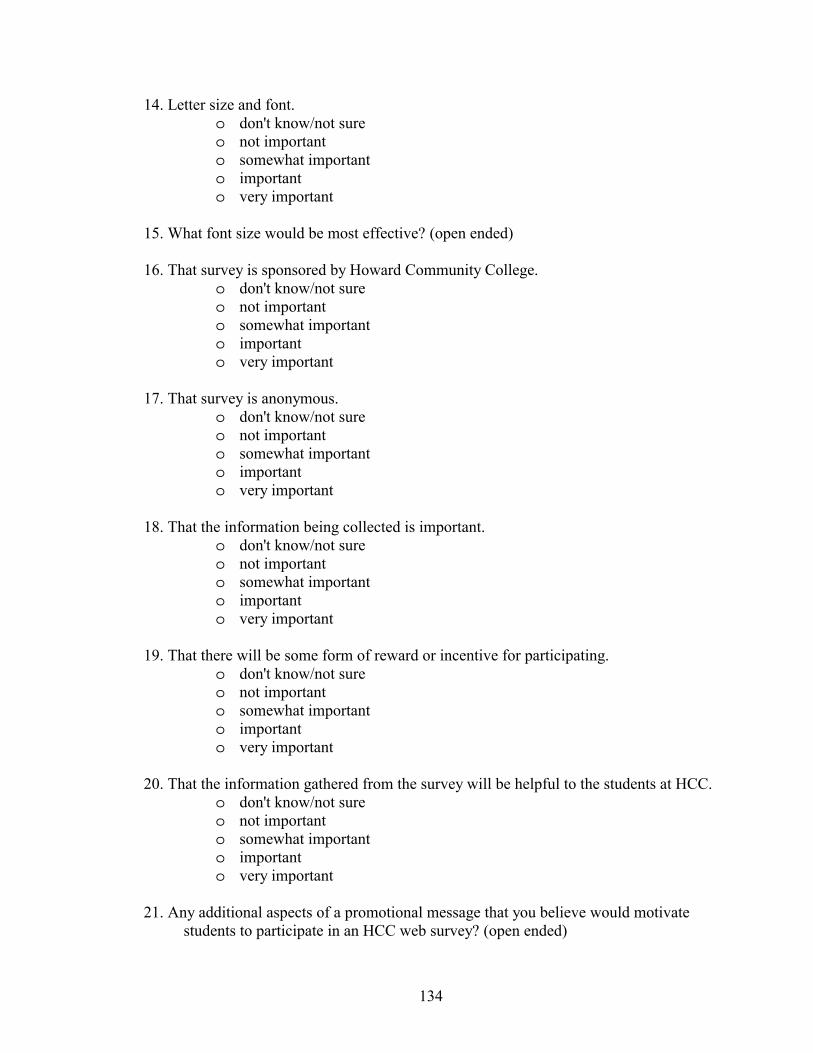
134
14. Letter size and font. o don't know/not sure o not important o somewhat important o important o very important
15. What font size would be most effective? (open ended) 16. That survey is sponsored by Howard Community College.
o don't know/not sure o not important o somewhat important o important o very important
17. That survey is anonymous.
o don't know/not sure o not important o somewhat important o important o very important
18. That the information being collected is important.
o don't know/not sure o not important o somewhat important o important o very important
19. That there will be some form of reward or incentive for participating.
o don't know/not sure o not important o somewhat important o important o very important
20. That the information gathered from the survey will be helpful to the students at HCC. o don't know/not sure o not important o somewhat important o important o very important
21. Any additional aspects of a promotional message that you believe would motivate
students to participate in an HCC web survey? (open ended)
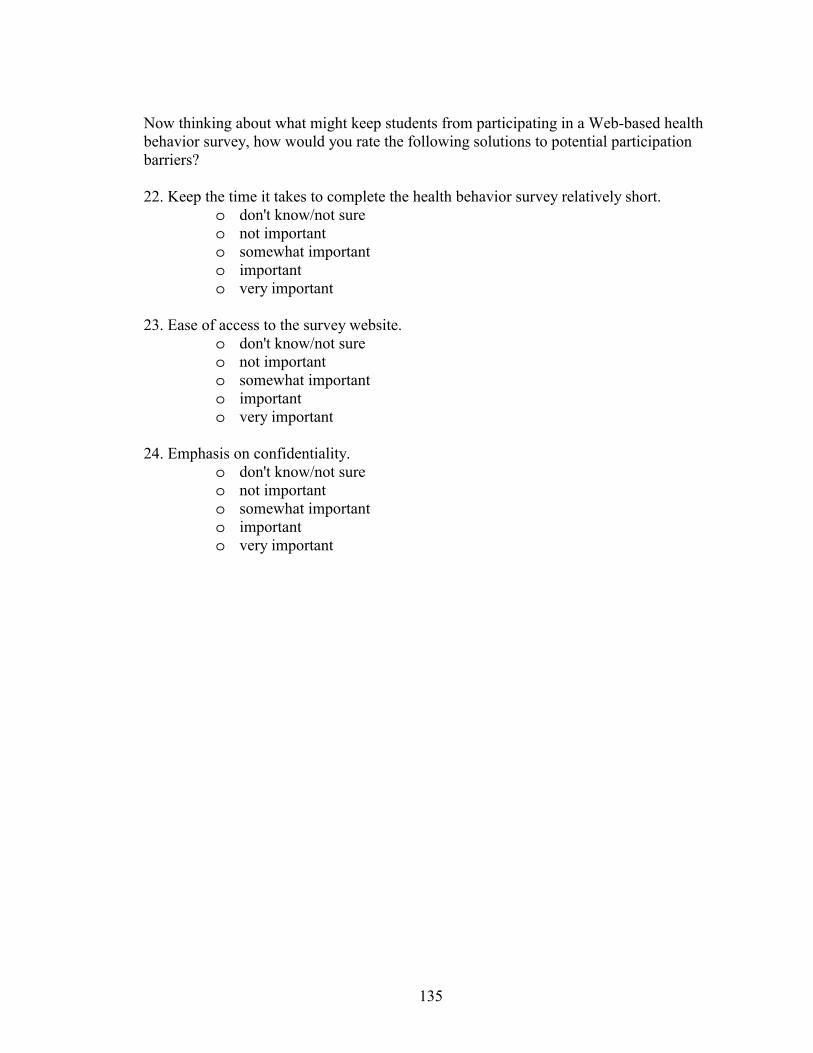
135
Now thinking about what might keep students from participating in a Web-based health behavior survey, how would you rate the following solutions to potential participation barriers? 22. Keep the time it takes to complete the health behavior survey relatively short.
o don't know/not sure o not important o somewhat important o important o very important
23. Ease of access to the survey website.
o don't know/not sure o not important o somewhat important o important o very important
24. Emphasis on confidentiality.
o don't know/not sure o not important o somewhat important o important o very important

136
Appendix E - PCQ Instructor Request Dear [instructor’s name]
My name is Patrick Finley, and I am an Associate Professor in the Health Sciences Division and Coordinator of Health Education at Howard Community College.
As part of my dissertation research, I have developed an online questionnaire to assess students’ perceptions and perspectives on what promotional messages and channels are most effective for motivating participation in an online health risk factor survey. The students in your class have been randomly chosen to receive an invitation to participate in this online questionnaire. I hope you will assist me by taking a few minutes to distribute the accompanying participation requests to your students. Your participation is completely voluntary and confidential. There are no benefits or risks in participation for you or your students. No information has been or will be recorded that identifies which students participate.
Please feel free to contact me via the phone number or email given below if you have questions regarding any aspect of my research. Thank you for your time and consideration.
Patrick Finley Associate Professor, Health Sciences Division Howard Community College (410) 772-4885 [email protected]

137
Appendix F - PCQ Student Participation Request Hello,
My name is Patrick Finley, and I am an Associate Professor in the Health Sciences Division and Coordinator of Health Education at Howard Community College. As part of my dissertation research, I have developed an online questionnaire to assess students’ perceptions and perspectives on what promotional messages and methods are most effective for motivating participation in an online health risk factor survey.
You have been randomly chosen to participate in a World Wide Web-based
questionnaire opinion about effective promotional messages and ways of delivering them. I hope you will assist me by taking a few minutes to complete the online questionnaire.
The questionnaire can be accessed by entering the following World Wide Web
address:
http://howardcc.edu/PCQ
Participation in this survey is completely voluntary. The survey does not ask for your name, address, or any other personal information. There are no anticipated risks or benefits to participants. Your participation or lack thereof will not affect your grade for this class in any way.
The questionnaire will take approximately 5 to 10 minutes to finish. All
information you provide will be kept completely confidential and will only be used as part of the total data gathered from the Howard Community College students who participate in the questionnaire.
If you have any questions about the questionnaire, please feel free to contact me
at the phone number or email below. Thank you for your time and participation, Patrick Finley, (410) 772-4885 Health Sciences Division, Howard Community College Associate Professor, [email protected]
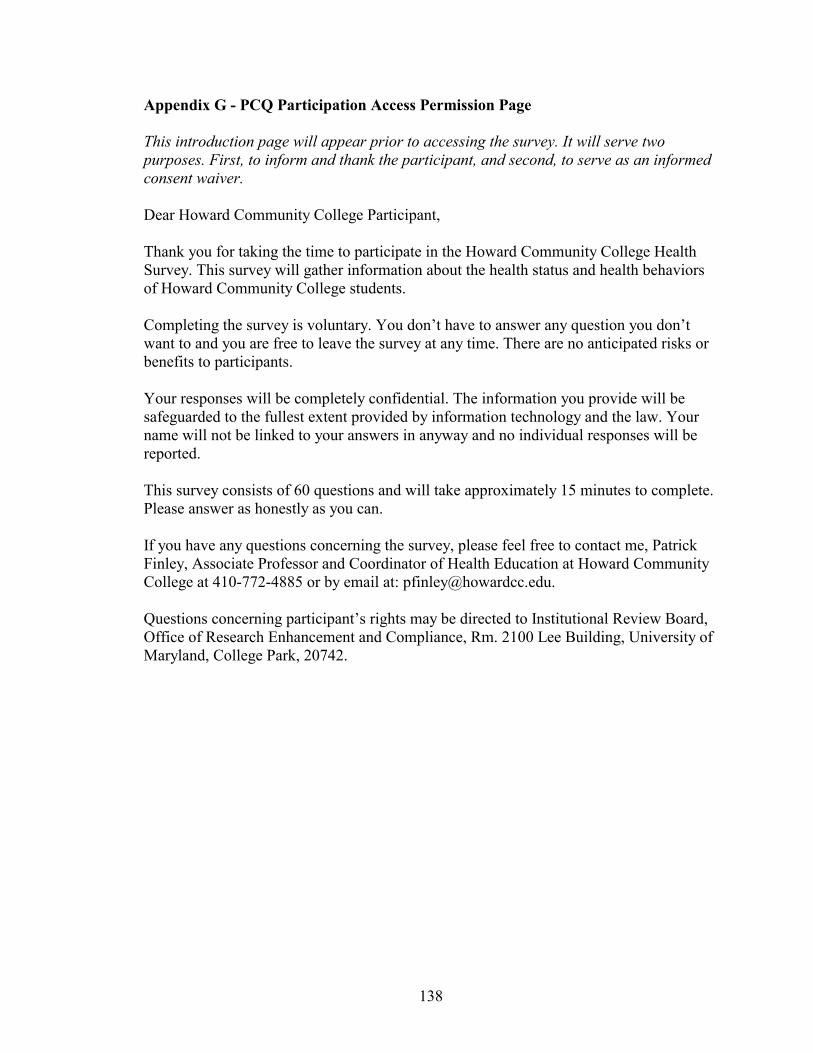
138
Appendix G - PCQ Participation Access Permission Page This introduction page will appear prior to accessing the survey. It will serve two purposes. First, to inform and thank the participant, and second, to serve as an informed consent waiver. Dear Howard Community College Participant, Thank you for taking the time to participate in the Howard Community College Health Survey. This survey will gather information about the health status and health behaviors of Howard Community College students. Completing the survey is voluntary. You don’t have to answer any question you don’t want to and you are free to leave the survey at any time. There are no anticipated risks or benefits to participants. Your responses will be completely confidential. The information you provide will be safeguarded to the fullest extent provided by information technology and the law. Your name will not be linked to your answers in anyway and no individual responses will be reported. This survey consists of 60 questions and will take approximately 15 minutes to complete. Please answer as honestly as you can. If you have any questions concerning the survey, please feel free to contact me, Patrick Finley, Associate Professor and Coordinator of Health Education at Howard Community College at 410-772-4885 or by email at: [email protected]. Questions concerning participant’s rights may be directed to Institutional Review Board, Office of Research Enhancement and Compliance, Rm. 2100 Lee Building, University of Maryland, College Park, 20742.

139
By typing your name and clicking on the “Go to the Survey” button below, you are showing that you have read and understand the information provided above and voluntarily agree to participate in this survey. Your name will not be linked to the information you provide on the survey. Your name is only for identification purposes and will be stored in different file than your responses. Once you have clicked on the button, you will be taken to the Howard Community College Health Survey. Thank you for your help, time, and participation.
Name _____________________________________________________
GO TO THE SURVEY [button]

140
Appendix H – Promotional Flyer and Poster
DO IT FOR THE HEALTH OF IT
Help us to understand the health needs of HCC students by participating in the
Howard Community College On-line Student Health Survey
Students at HCC will be randomly chosen to complete an on-line survey of student health behaviors. If you are chosen, you will be mailed instructions on how to access the on-line survey
Your participation will play an important part in helping us direct potential health resources in the most effective way.
Your participation is voluntary and confidential.

141
Appendix I – Web-based Behavioral Risk Factor Survey (WBRFSS) 1.How are you currently connected to the Internet? � from home � from Howard Community College � from public library � from work � other � Prefer not to answer 2.Which one of these groups would you say best represents your race?
� White � Black or African American � Hispanic � Asian � Native Hawaiian or Other Pacific Islander � American Indian, Alaska Native � Bi-racial or Multi-racial � Other ____ � Don’t know/Not sure � Prefer not to answer
3. You described yourself as bi-racial or multi-racial. Which of the previous groups best describes your racial composition? (please fill in up to four groups)
1. ___________________________________ 2. ___________________________________ 3. ___________________________________ 4. ___________________________________ 4. Are you:
� Married � Divorced � Widowed � Separated � Never married � A member of an unmarried couple � Prefer not to answer
5. How many children less than 18 years of age live in your household? � Number of children�___ � Don't know � Prefer not to answer
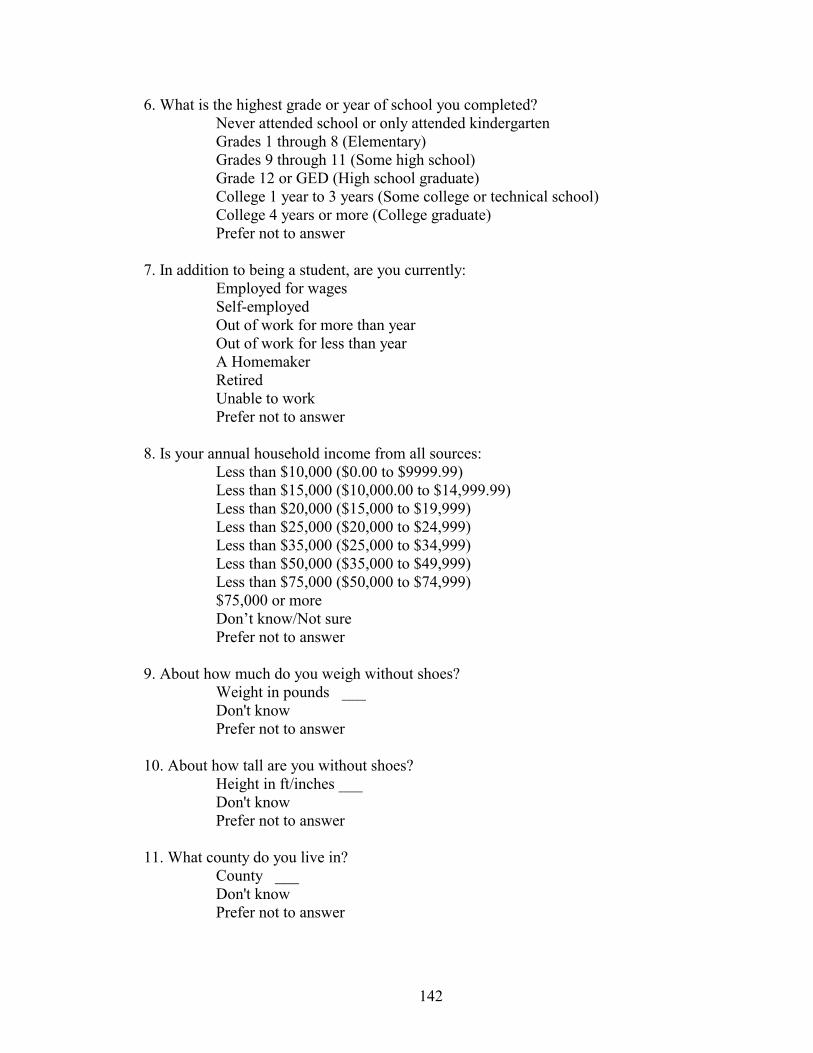
142
6. What is the highest grade or year of school you completed? � Never attended school or only attended kindergarten � Grades 1 through 8 (Elementary) � Grades 9 through 11 (Some high school) � Grade 12 or GED (High school graduate) � College 1 year to 3 years (Some college or technical school) � College 4 years or more (College graduate) � Prefer not to answer 7. In addition to being a student, are you currently: � Employed for wages � Self-employed � Out of work for more than year � Out of work for less than year � A Homemaker � Retired � Unable to work � Prefer not to answer 8. Is your annual household income from all sources: � Less than $10,000 ($0.00 to $9999.99) � Less than $15,000 ($10,000.00 to $14,999.99) � Less than $20,000 ($15,000 to $19,999) � Less than $25,000 ($20,000 to $24,999) � Less than $35,000 ($25,000 to $34,999) � Less than $50,000 ($35,000 to $49,999) � Less than $75,000 ($50,000 to $74,999) � $75,000 or more � Don’t know/Not sure � Prefer not to answer 9. About how much do you weigh without shoes? � Weight in pounds�___ � Don't know � Prefer not to answer 10. About how tall are you without shoes? � Height in ft/inches ___ � Don't know � Prefer not to answer 11. What county do you live in? � County�___ � Don't know � Prefer not to answer
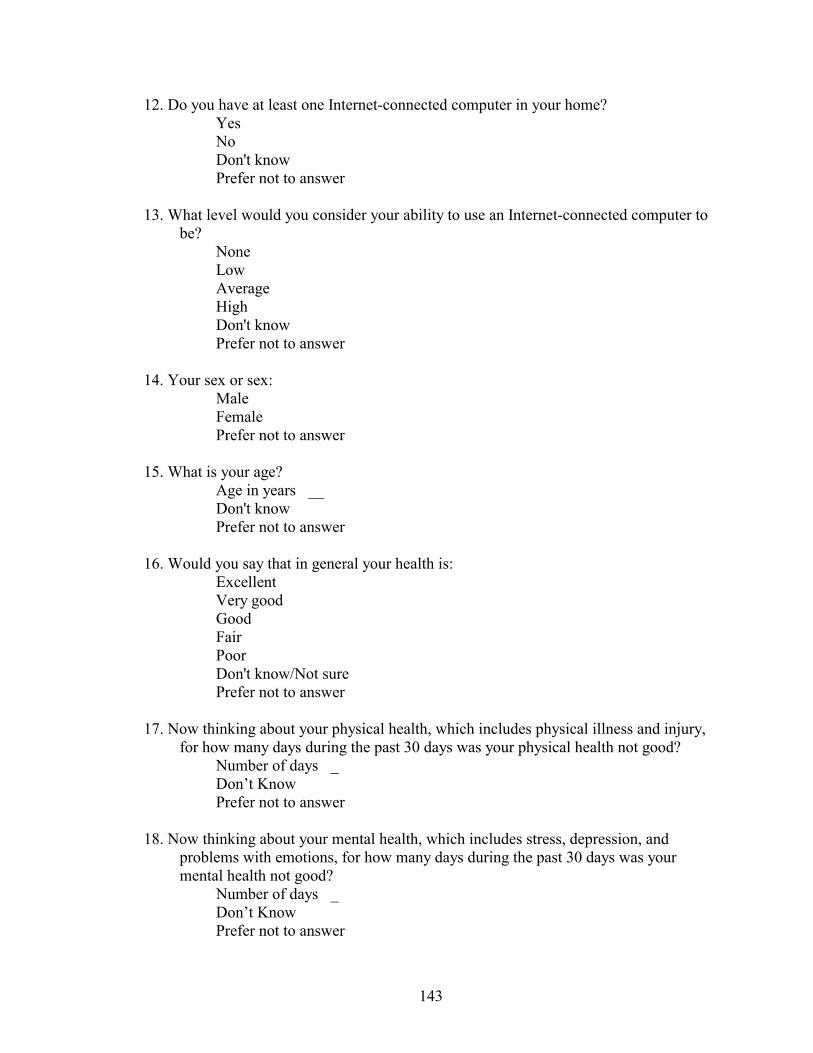
143
12. Do you have at least one Internet-connected computer in your home? � Yes � No � Don't know � Prefer not to answer 13. What level would you consider your ability to use an Internet-connected computer to
be? � None � Low � Average � High � Don't know � Prefer not to answer 14. Your sex or sex: � Male � Female � Prefer not to answer 15. What is your age?
� Age in years�__ � Don't know � Prefer not to answer 16. Would you say that in general your health is:
� Excellent � Very good � Good � Fair � Poor � Don't know/Not sure � Prefer not to answer
17. Now thinking about your physical health, which includes physical illness and injury,
for how many days during the past 30 days was your physical health not good? � Number of days�_
� Don’t Know � Prefer not to answer
18. Now thinking about your mental health, which includes stress, depression, and
problems with emotions, for how many days during the past 30 days was your mental health not good?
� Number of days�_ � Don’t Know � Prefer not to answer
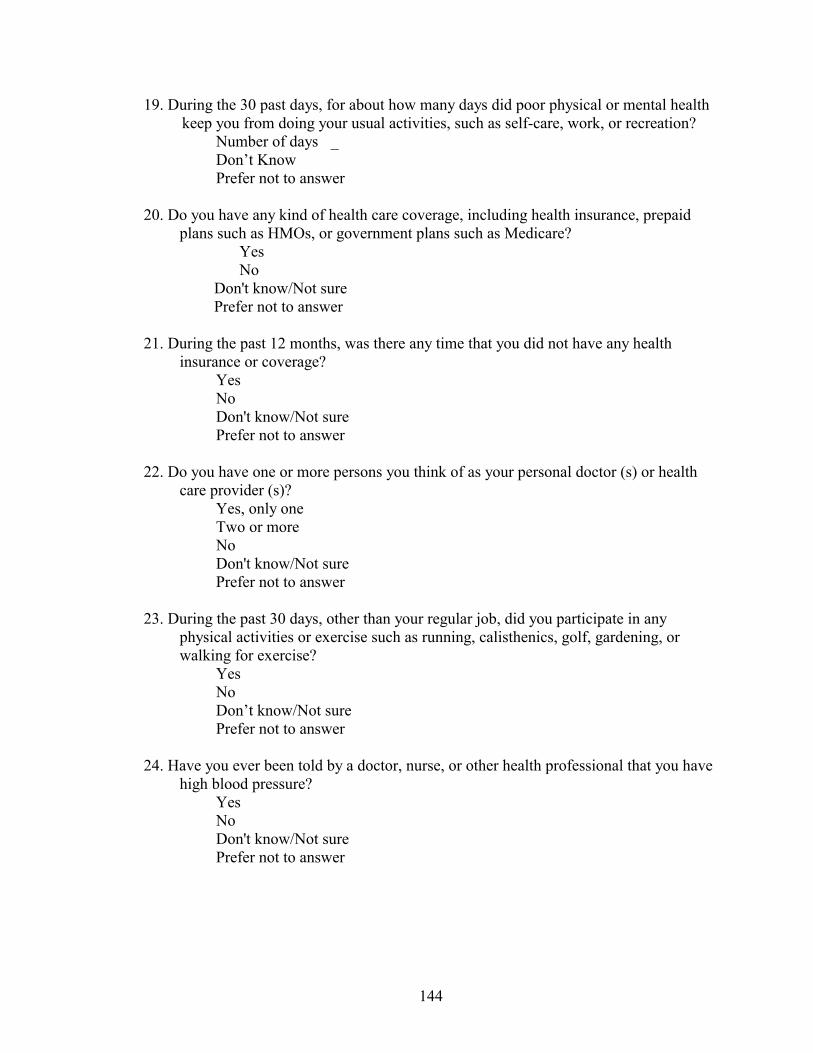
144
19. During the 30 past days, for about how many days did poor physical or mental health keep you from doing your usual activities, such as self-care, work, or recreation?
� Number of days�_ � Don’t Know � Prefer not to answer
20. Do you have any kind of health care coverage, including health insurance, prepaid
plans such as HMOs, or government plans such as Medicare? � Yes � No
� Don't know/Not sure � Prefer not to answer
21. During the past 12 months, was there any time that you did not have any health
insurance or coverage? � Yes � No
� Don't know/Not sure � Prefer not to answer
22. Do you have one or more persons you think of as your personal doctor (s) or health care provider (s)?
� Yes, only one � Two or more � No
� Don't know/Not sure � Prefer not to answer
23. During the past 30 days, other than your regular job, did you participate in any
physical activities or exercise such as running, calisthenics, golf, gardening, or walking for exercise?
� Yes � No
� Don’t know/Not sure � Prefer not to answer
24. Have you ever been told by a doctor, nurse, or other health professional that you have
high blood pressure? � Yes � No
� Don't know/Not sure � Prefer not to answer

145
25. Are you currently taking medicine for your high blood pressure? � Yes � No
� Don't know/Not sure � Prefer not to answer
26. Blood cholesterol is a fatty substance found in the blood. Have you ever had your
blood cholesterol checked? � Yes � No
� Don't know/Not sure � Prefer not to answer
27. About how long has it been since you last had your blood cholesterol checked? � Within the past year (anytime less than 12 months ago) � Within the 2 past years (1 year but less than 2 years ago) � Within the 5 past years (2 years but less than 5 years ago) � 5 or more years ago
� Don't know/Not sure � Prefer not to answer
28. Have you ever been told by a doctor, nurse, or other health professional that your
blood cholesterol is high? � Yes � No
� Don't know/Not sure � Prefer not to answer
29. Have you ever been told by a doctor, nurse, or other health professional that you had
asthma? � Yes � No
� Don’t know/Not sure � Prefer not to answer
30. Do you still have asthma? � Yes � No
� Don’t know/Not sure � Prefer not to answer
31. Have you ever been told by a doctor that you have diabetes? � Yes � Yes, I am a female told only during pregnancy � No
� Don’t know/Not sure � Prefer not to answer
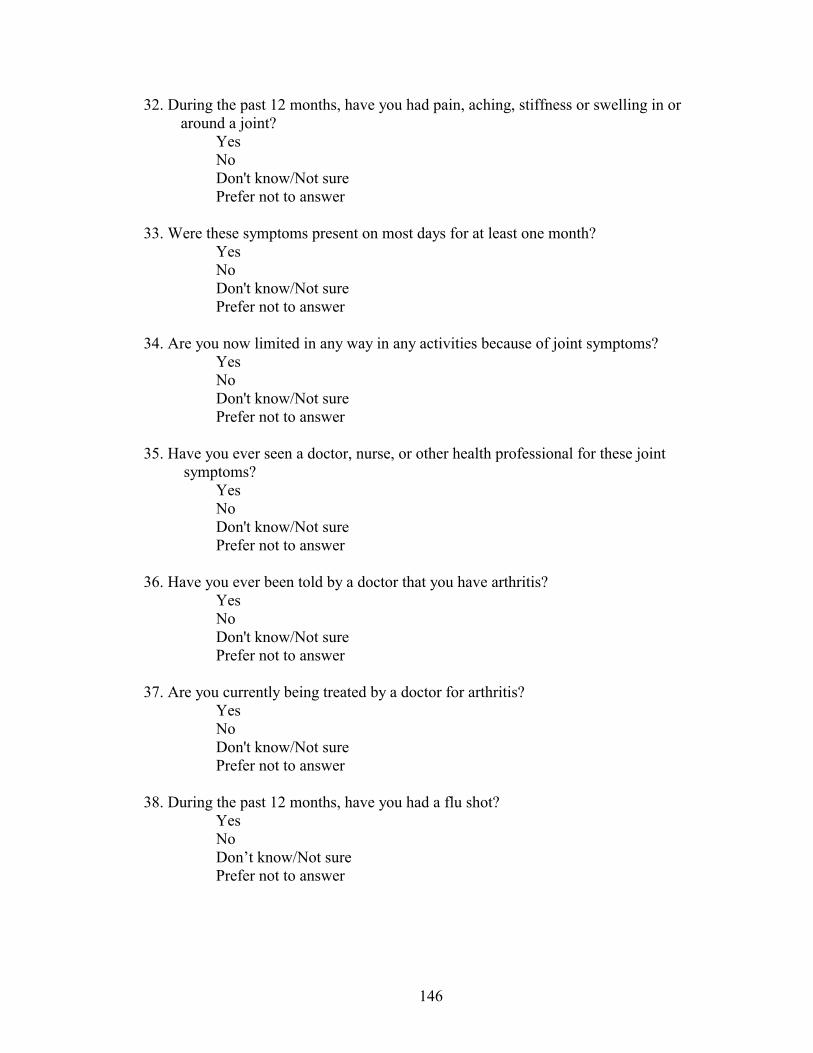
146
32. During the past 12 months, have you had pain, aching, stiffness or swelling in or around a joint?
� Yes � No � Don't know/Not sure � Prefer not to answer
33. Were these symptoms present on most days for at least one month? � Yes
� No � Don't know/Not sure � Prefer not to answer
34. Are you now limited in any way in any activities because of joint symptoms? � Yes � No
� Don't know/Not sure � Prefer not to answer
35. Have you ever seen a doctor, nurse, or other health professional for these joint
symptoms? � Yes � No
� Don't know/Not sure � Prefer not to answer
36. Have you ever been told by a doctor that you have arthritis? � Yes � No
� Don't know/Not sure � Prefer not to answer
37. Are you currently being treated by a doctor for arthritis? � Yes � No
� Don't know/Not sure � Prefer not to answer
38. During the past 12 months, have you had a flu shot? � Yes � No
� Don’t know/Not sure � Prefer not to answer
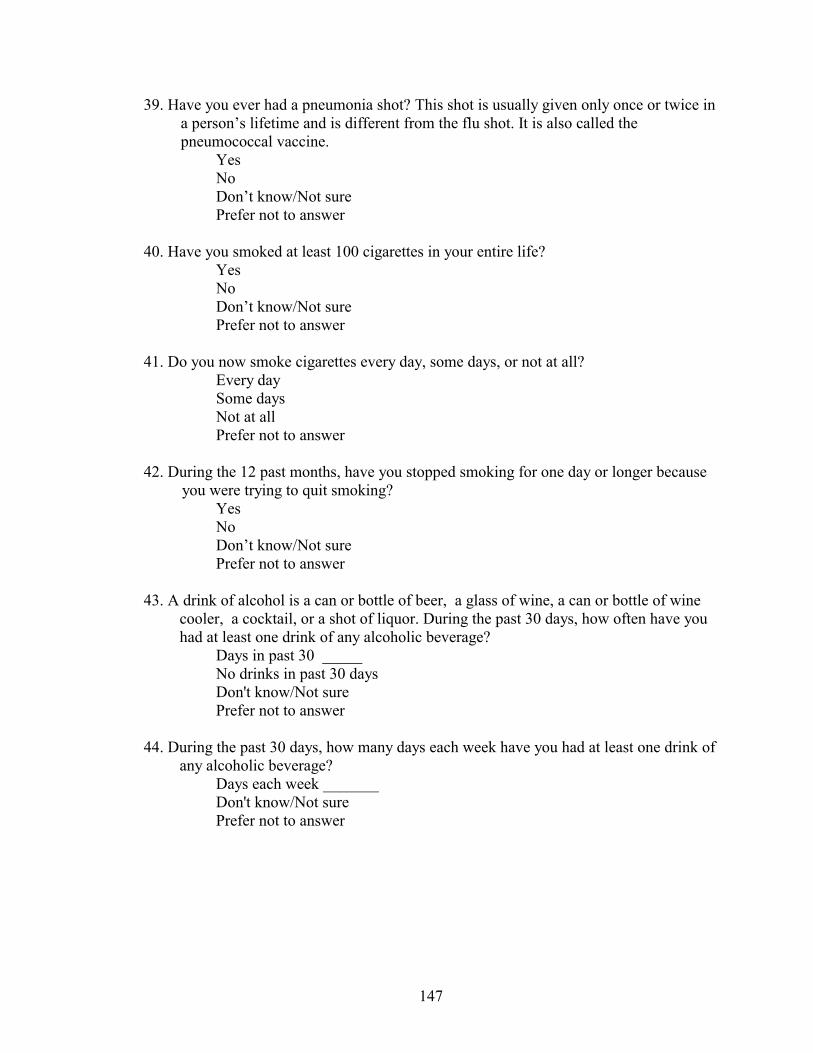
147
39. Have you ever had a pneumonia shot? This shot is usually given only once or twice in a person’s lifetime and is different from the flu shot. It is also called the pneumococcal vaccine.
� Yes � No
� Don’t know/Not sure � Prefer not to answer
40. Have you smoked at least 100 cigarettes in your entire life? � Yes � No
� Don’t know/Not sure � Prefer not to answer
41. Do you now smoke cigarettes every day, some days, or not at all? � Every day � Some days
� Not at all � Prefer not to answer
42. During the 12 past months, have you stopped smoking for one day or longer because
you were trying to quit smoking? � Yes � No
� Don’t know/Not sure � Prefer not to answer
43. A drink of alcohol is a can or bottle of beer, a glass of wine, a can or bottle of wine
cooler, a cocktail, or a shot of liquor. During the past 30 days, how often have you had at least one drink of any alcoholic beverage?
� Days in past 30 _____ � No drinks in past 30 days
� Don't know/Not sure � Prefer not to answer
44. During the past 30 days, how many days each week have you had at least one drink of
any alcoholic beverage? � Days each week _______ � Don't know/Not sure � Prefer not to answer�

148
45. On the days when you drank, about how many drinks did you drink on the average? � Number of drinks _____ � Don't know/Not sure � Prefer not to answer
46. Considering all types of alcoholic beverages, how many times during the past days
did you have or more drinks on an occasion? � Number of times _____ � None
� Don't know/Not sure � Prefer not to answer
47. The next question is about firearms, including weapons such as pistols, shotguns, and
rifles; but not BB guns, starter pistols, or guns that cannot fire. Are any firearms now kept in or around your home? Include those kept in a garage, outdoor storage area, car, truck, or other motor vehicle.
� Yes � No
� Don’t know/Not sure � Prefer not to answer
48. The following questions are about health problems or impairments you may have.
Are you limited in any way in any activities because of physical, mental, or emotional problems?
� Yes � No � Don’t know/Not sure � Prefer not to answer
49. Do you now have any health problem that requires you to use special equipment, such
as a cane, a wheelchair, a special bed, or a special telephone? � Yes
� No � Don’t know/Not sure � Prefer not to answer
50. If you are employed or self-employed, which of the following best describes what
you do when at work? � Mostly sitting or standing � Mostly walking
� Mostly heavy labor or physically demanding work � Currently not employed � Don’t know/Not sure � Prefer not to answer

149
51. We are interested in two types of physical activity: vigorous and moderate. Vigorous activities cause large increases in breathing or heart rate while moderate activities cause small increases in breathing or heart rate. Now, thinking about the moderate physical activities you do in a usual week, do you do moderate activities for at least 10 minutes at a time, such as brisk walking, bicycling, vacuuming, gardening, or anything else that causes small increases in breathing or heart rate?
� Yes � No � Don’t know/Not sure � Prefer not to answer
52. How many days per week do you do these moderate activities for at least 10 minutes
at a time? � Days per week _____
� Do not exercise at least 10 minutes weekly � Don’t know/Not sure � Prefer not to answer
53. On days when you do moderate activities for at 10 least minutes at a time, how much
total time per day do you spend doing these activities? � Hours and minutes per day _____ � Don’t know/Not sure � Prefer not to answer
54. Now thinking about the vigorous physical activities you do in a usual week (vigorous
activities cause large increases in breathing or heart rate), do you do vigorous activities for at least 10 minutes at a time, such as running, aerobics, heavy yard work, or anything else that causes large increases in breathing or heart rate?
� Yes � No � Don’t know/Not sure � Prefer not to answer
55. How many days per week do you do these vigorous activities for at least 10 minutes
at a time? � Days per week _____
� Do not exercise at least minutes weekly � Don’t know/Not sure
� Prefer not to answer 56. On days when you do vigorous activities for at least minutes at a time, how much
total time per day do you spend doing these activities? Hours and minutes per day .
150
57. A blood stool test is a test that may use a special kit at home to determine whether the stool contains blood. Have you ever had this test using a home kit?
� Yes � No � Don't know/Not sure � Prefer not to answer
58. How long has it been since you had your last blood stool test using a home kit? � Within the past year (anytime less than 12 months ago) � Within the past 2 years (1 year but less than 2 years � ago) � Within the past 5 years (2 years but less than 5 years ago)
� 5 or more years ago � Don't know/Not sure � Prefer not to answer
59. Sigmoidoscopy and colonoscopy are exams in which a tube is inserted in the rectum
to view the bowel for signs of cancer or other health problems. Have you ever had either of these exams?
� Yes � No � Don’t know/Not sure � Prefer not to answer
60. How long has it been since you had your last sigmoidoscopy or colonoscopy? � Within the past year (anytime less than months ago) � Within the past 2 years (1 year but less than 2 years ago) � Within the past 5 years (2 years but less than 5 years ago) � Within the past 10 years (5 years but less than 10 years ago)
� 10 or more years ago � Don't know/Not sure � Prefer not to answer
61. The next few questions are about the national health problem of HIV, the virus that
causes AIDS. Please remember that your answers are strictly confidential and that you don't have to answer every question if you don't want to.
Please answer the following statements as best you can.
A pregnant woman with HIV can get treatment to help reduce the chances that she will pass the virus on to her baby.
� True � False � Don't know/Not Sure � Prefer not to answer

151
62. There are medical treatments available that are intended to help a person who is infected with HIV to live longer.
� True � False � Don't know/Not Sure � Prefer not to answer
63. How effective do you think these treatments are helping persons with HIV to live
longer? Would you say: � Very effective � Somewhat effective
� Not at all effective � Don’t know/Not sure � Prefer not to answer
64. How important do you think it is for people to know their HIV status by getting
tested? Would you say: � Very important � Somewhat important
� Not at all important � Don’t know/Not sure � Prefer not to answer
65. As far as you know, have you ever been tested for HIV? Do not count tests you may
have had as part of a blood donation. � Yes
� No � Don’t know/Not sure � Prefer not to answer
66. Not including blood donations, in what month and year was your last HIV test? � Month and Year _____ � Don’t know/Not sure � Prefer not to answer
67. How important do you think it is for people to know their HIV status by getting
tested? Would you say: � Very important � Somewhat important
� Not at all important � Don’t know/Not sure � Prefer not to answer

152
68. As far as you know, have you ever been tested for HIV? Do not count tests you may have had as part of a blood donation.
� Yes � No � Don’t know/Not sure � Prefer not to answer
69. Not including blood donations, in what month and year was your last HIV test?
� Month and year __ � Don’t know/Not sure � Prefer not to answer
70. What was the main reason you had your test for HIV in? � For hospitalization or surgical procedure � To apply for health insurance � To apply for life insurance � For employment � To apply for a marriage license � For military induction or military service � For immigration � Just to find out if you were infected � Because of referral by a doctor � Because of pregnancy � Referred by your sex partner � For routine check-up � Because of occupational exposure � Because of illness � Because I am at risk for HIV
� Other � Don’t know/Not sure � Prefer not to answer
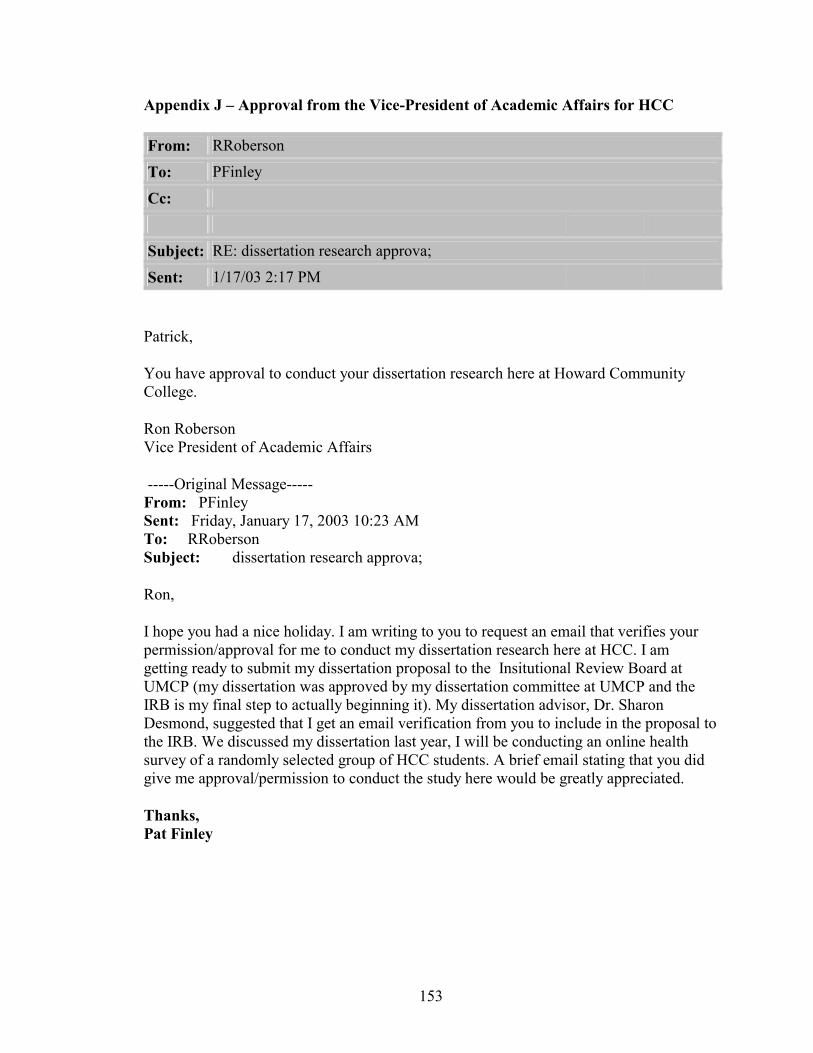
153
Appendix J – Approval from the Vice-President of Academic Affairs for HCC
From: RRoberson
To: PFinley
Cc:
Subject: RE: dissertation research approva;
Sent: 1/17/03 2:17 PM
Patrick,
You have approval to conduct your dissertation research here at Howard Community College.
Ron Roberson Vice President of Academic Affairs
-----Original Message----- From: PFinley Sent: Friday, January 17, 2003 10:23 AM To: RRoberson Subject: dissertation research approva;
Ron,
I hope you had a nice holiday. I am writing to you to request an email that verifies your permission/approval for me to conduct my dissertation research here at HCC. I am getting ready to submit my dissertation proposal to the Insitutional Review Board at UMCP (my dissertation was approved by my dissertation committee at UMCP and the IRB is my final step to actually beginning it). My dissertation advisor, Dr. Sharon Desmond, suggested that I get an email verification from you to include in the proposal to the IRB. We discussed my dissertation last year, I will be conducting an online health survey of a randomly selected group of HCC students. A brief email stating that you did give me approval/permission to conduct the study here would be greatly appreciated.
Thanks, Pat Finley

154
Appendix K – WBRFSS Mail Notification Dear Howard Community College Participant,
My name is Patrick Finley, and I am an Associate Professor in the Health Sciences Division and Coordinator of Health Education at Howard Community College. I am currently collecting information about the health status and health behaviors of Howard Community College students.
You have been randomly chosen to participate in a World Wide Web-based survey that will ask you questions about your current health status and health behaviors. I hope you will assist me by taking time to complete this survey by the [two weeks from mailing date].
The Health Survey can be accessed by entering the following World Wide Web address:
http://howardcc.edu/healthsurvey
Participation in this survey is completely voluntary. You don’t have to answer any question you don’t want to and you are free to leave the survey at any time. The survey does not ask for your name, address, or any other personal information. Your answers are anonymous, and there will be no names or identification numbers attached to your answers. Your mailing address will be deleted from the survey database at the end of the survey period [date above]. There are no anticipated risks or benefits.
The survey will take approximately 20 minutes to finish. All information you provide is anonymous and will only be used as part of the total data gathered from the Howard Community College students who participate in this survey.
If you have any questions about the questionnaire, please feel free to contact me at the phone number or email below. Thank you for your time and participation, Patrick Finley, (410) 772-4885 Health Sciences Division, Howard Community College Associate Professor, [email protected]

155
Appendix L – WBRFSS Access Permission Page Dear Howard Community College Participant,
Thank you for taking the time to participate in the Howard Community College Health Survey. This survey will gather information about the health status and health behaviors of Howard Community College students. This survey is also part of dissertation research involving participation in Web-based health risk factor surveys.
Participating in the survey is voluntary. You don’t have to answer any question you don’t want to and you are free to leave the survey at any time. There are no anticipated risks or benefits to participants.
Your responses are anonymous. Your answers will not be connected to you in any way and no individual responses will be reported. The information you provide will be safeguarded to the fullest extent provided by information technology and the law. Your mailing address will be deleted from the survey database at the end of the survey period [date above]. There are no anticipated risks or benefits to participants.
This survey consists of 75 questions and will take approximately 20 - 30 minutes to complete. Please answer as honestly as you can.
If you have any questions concerning the survey, please feel free to contact me, Patrick Finley, Associate Professor and Coordinator of Health Education at Howard Community College at 410-772-4885 or by email at: [email protected].
Questions concerning rights as a participant may be directed to Institutional Review Board, Office of Research Enhancement and Compliance, Rm. 2100 Lee Building, University of Maryland, College Park, 20742, 301-405-4212.
By typing your name and clicking on the “Go to the Survey” button below, you are showing that you have read and understand the information provided above and voluntarily agree to participate in this survey. Your name will not be linked to the information you provide on the survey and will be stored in different file than your responses. Your name will only be used to identify respondents and non-respondents for the purpose of possible follow-up telephone interviews by the investigator. Once you have clicked on the button, you will be taken to the Howard Community College Health Survey. Thank you for your help, time, and participation. Name _____________________________________________________
GO TO THE SURVEY [button]
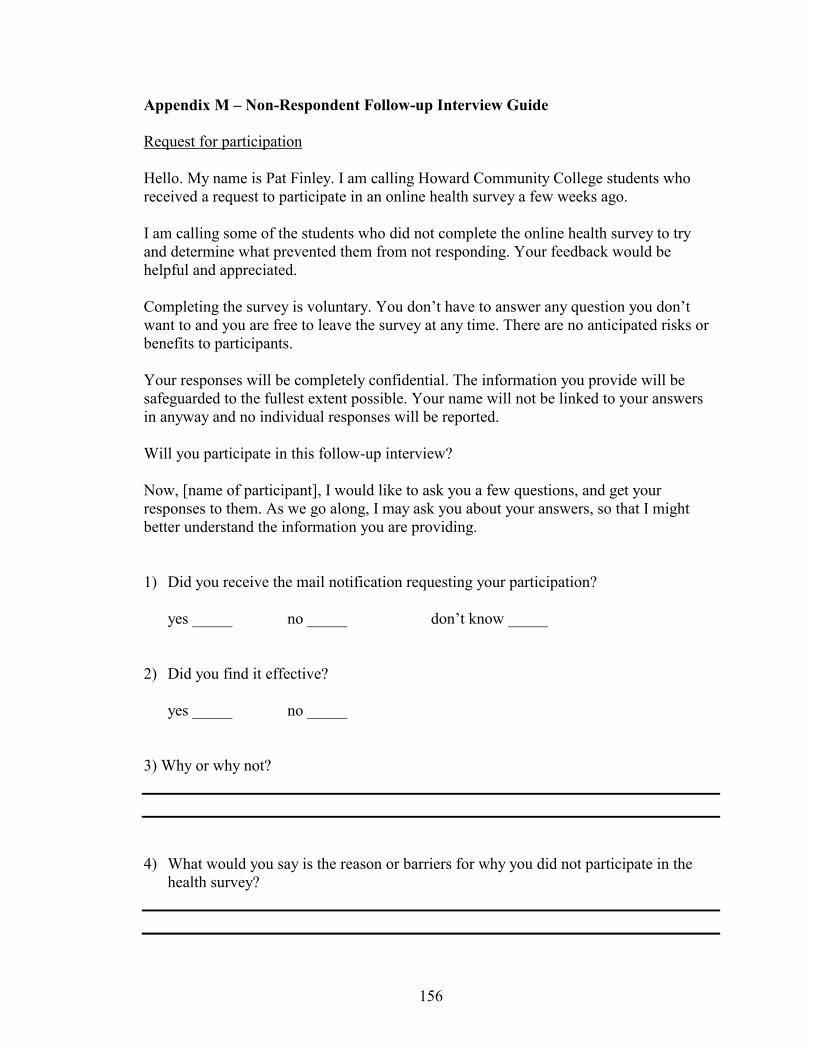
156
Appendix M – Non-Respondent Follow-up Interview Guide Request for participation Hello. My name is Pat Finley. I am calling Howard Community College students who received a request to participate in an online health survey a few weeks ago. I am calling some of the students who did not complete the online health survey to try and determine what prevented them from not responding. Your feedback would be helpful and appreciated. Completing the survey is voluntary. You don’t have to answer any question you don’t want to and you are free to leave the survey at any time. There are no anticipated risks or benefits to participants. Your responses will be completely confidential. The information you provide will be safeguarded to the fullest extent possible. Your name will not be linked to your answers in anyway and no individual responses will be reported. Will you participate in this follow-up interview? Now, [name of participant], I would like to ask you a few questions, and get your responses to them. As we go along, I may ask you about your answers, so that I might better understand the information you are providing. 1) Did you receive the mail notification requesting your participation?
yes _____ no _____ don’t know _____
2) Did you find it effective?
yes _____ no _____
3) Why or why not?
4) What would you say is the reason or barriers for why you did not participate in the
health survey?

157
5) What do you feel might be done, if anything, to overcome the barrier (s) you
identified? [if necessary, repeat the barriers identified in question 2]
6) Did you notice any of the heath survey promotions located around campus?
yes _____ no _____
7) Which one (s) do you remember seeing (cite if necessary)
8) Did find them effective in promoting the survey?
yes _____ no _____
9) Why or why not? ________________________________________________________
10) How many computers with Internet access do you have in
your home? _____ 11) How would you rate your ability to use a computer and
the Internet?
_____ don’t know how to use computer or the Internet _____ am a beginning computer and Internet user _____ am an average computer and Internet user _____ am an advanced computer and Internet user
158
REFERENCES Aday, L. A. (1996). Designing and conducting health surveys. 2nd ed. San Francisco: Jossey-Bass. Albers, A. B. & Biener, L. (2003). Adolescent participation in tobacco promotion: The role of psychosocial factors. Pediatrics, 111, 2, 402-406. Alreck, P. L. & Settle, R. B. (1995). The survey research handbook:Guidelines and strategies for conducting a survey. Chicago: Irwin. Alexander, R. B. & Trissel, D. (1996). Chronic prostatitis: Results of an internet survey. Urology. 48, 4, 570-574. Anda, R. F., Williamson, D. F., Dodson, D., & Remington P. L. (1989). Telephone versus in-person reporting of smoking and alcohol use: A comparison of two statewide surveys. American Journal of Health Promotion. 4, 32-36. Anderson, B. & Ley, R. (2001). Dyspnea during panic attacks. An Internet survey of incidences of changes in breathing. Behavior Modification. 25, 4, 546-54. Anderson, S. (2002). Logistic Regression. Available: http://schatz.sju.edu/multivar/guide/Logistic.pdf Bachmann, D., Elfrink, J., & Vazzana, D. (1996). Tracking the progress of e-mail vs. snail-mail. Marketing Research, 8 (2), 31-35. Bason, J. J. (2000). Comparing Results From Telephone, Mail, Internet, And Interactive Voice Recognition Surveys Of Drug And Alcohol Use Among University Of Georgia Students. Poster presented at the 55th Annual Conference of American Association for Public Opinion Research. Portland, Oregon, USA, May 18-21, 2000. Batagelj, Z., Lozar Manfreda, K., Vehovar, V., and Zaletel, M. (2000). Cost and Errors of Web Surveys in Establishment Surveys. Paper presented at the International Conference on Establishement Surveys - II, Buffalo, New York, USA, June 17-21, 2000. Available: http://www.websm.org/nase/ICESII2000.ppt. Bauman, S., Airey, J., & Atak, H. (1998): "Effective Use of Web-Based Technology: Using the Internet for Data Collection and Communication Applications". Paper presented at the 53rd Annual Conference of American Association for Public Opinion Research. St. Louis, Missouri, May 14-17, 1998. Baumgartner, T. A. & Strong, C. H. (1998). Conducting and reading research in health and human performance. Boston : WCB McGraw-Hill

159
Bernhardt, J. M. (2001). Developing health promotion materials for health care settings. Health Promotion Practice. 2, 4, 290-294. Biffignandi S., Pratesi M., Lozar Manfreda K., Vehovar V. (2002). List assisted Web Surveys: quality, timeliness and non-response in the steps of the participation flow. ICIS 2002 International Conference on Improving Surveys. Copenhagen, Denmark. Bloom, D. E. (1998). Technology, experimentation, and the quality of survey data. Science, 280, 847-848. Bosnjak, M. & Tuten, T. L. (2001). Classifying response behaviors in web-based surveys. Journal of Computer-Mediated Communication. 6 (3). Available: http://www.ascusc.org/jcmc/vol6/issue3/boznjak.html Bowlin, S. J., Morrill, B. D., Nafziger, A. N., Lewis, C., & Pearson, T. A. (1996). Reliability and changes in validity of self-reported cardiovascular disease risk factors using dual response: the Behavioral Risk Factor Survey. Journal of Clinical Epidemiology. 49, 511-517. Brennan, M., Rae, N., & Parackal, M. (1999). Survey-based experimental research via the Web: some observations. Marketing Bulletin, 10, 83-92. Brenner, R. C. (1998). Selling to the generations: Part 1 – age groups and attitudes. Available: http://www.brennerbooks.com/sellgen.html Bright, A. (2000). The Role of Social Marketing in Leisure and Recreation Management. Journal of Leisure Marketing. 32, 1, 12. Brownson, R. C., Jackson-Thompson, J., Wilkerson, J. C., & Kiani, F. (1994). Reliability of information on chronic disease risk factors collected in the Missouri Behavioral Risk Factor Surveillance. System. Epidemiology. 5, 545-549. BRFSS User’s Guide. (2001). Available: http://cdc/gov/nccdphp/brfss/usersguide.htm Center For Statistical Computing Support. (2001). Multicollinearity in logistic regression. Available: http://www.uky.edu/ComputingCenter/SSTARS/MulticollinearityinLogisticRegression.ht Centers for Disease Control and Prevention. (2001). Public health infrastructure: Healthy people 2010. Available:http://www.health.gov/healthypeople/document/pdf/tracking/od23.pdf Centers for Disease Control and Prevention. (2000a). Health Communications: Healthy people 2010. Available:http://www.health.gov/healthypeople/document/pdf/tracking/od23.pdf
160
Centers for Disease Control and Prevention. (2000b). Integration Project: National Electronic Disease Surveillance System. Available: http://www.cdc.gov/od/hissb/act_int.htm Centers for Disease Control and Prevention. (2000c). Health Communications: Healthy people 2010. Available:http://www.health.gov/healthypeople/document/pdf/tracking/od11.pdf Centers for Disease Control and Prevention. (2001a). Online Training: BRFSS Overview. Available: http://www2.cdc.gov/nccdphp/brfss2/training_ov/default.htm Centers for Disease Control and Prevention. (2001b). Tracking Major Health Risks Among Americans. Available: http://www.cdc.gov/nccdphp/brfss/at-a-gl.htm Centers for Disease Control and Prevention. (2001c). Methodologic Studies of the BRFSS. Available: http://www.cdc.gov/nccdphp/brfss/pdf/mvr.pdf Centers for Disease Control and Prevention. (2001d). About the BRFSS. Available: http://www.cdc.gov/nccdphp/brfss/about.htm Centers for Disease Control and Prevention. (2001e). FAQs: Frequently asked questions. Available: http://www.cdc.gov/nccdphp/brfss/faqs.htm Chaiken, S., & Eagley, A. H. (1976). Communication modality as a determinant of message persuasiveness and message comprehensibility. Journal of Personality and Social Psychology. 34, 605-614. Clayton, R.L. & Werking, G. S. (1995). Using email/world wide web for establishment survey data collection. Bureau of Labor Statistics: Washington, D.C. Cobanoglu, C. & Moreo, P. (2001). Hospitality research: Educators’ perspective. Journal of Hospitality and Tourism Education, 13 (5), 9-20. Cohen, J. M. (2000). Human subjects issues in internet research. Health Law News, 13, 3, 5 & 14. Comley, P. (1996.). The use of the Internet as a data collection method. Available: WWW URL http://www.sga.co.uk/esomar.html. Computer Literacy World Headquarters. (2001). Computer Literacy issues. Available: http://www.virtualbill.net/qamain/qamain.html#q1 Connor, E. F. (2002). Logistic regression. Available:
161
http://online.sfsu.edu/~efc/classes/biol710/logistic/logisticreg.htm Cook, T. D., & Campbell, D. T. (1979). Quasi-experimentation: Design & analysis for field settings. Chicago: Rand McNally. Cottrell, R. R., Girvan, J. T., & McKenzie, J. F. (1999). Principles and foundations of health promotion and education. Boston: Allyn and Bacon Couper, M. P., Blair, J., & Triplett, T. (1997). A comparison of mail and e-mail for a survey of employees in federal statistical agencies. Paper presented at the American Association for Public Opinion Research, Norfolk, VA. de Leeuw, E. & Nicholls, W. (1996). Technological innovations in data collection: acceptance, data quality and costs. Sociological Research Online, vol. 1, no. 4. Available:http://www.socresonline.org.uk/socresonline/1/4/leeuw.html Decision 411: Forecasting. (2003). Stepwise and all-possible-regressions. Available: http://www.duke.edu/~rnau/regstep.htm Deeks, J. (1996). What is an odds ratio. Available: http://www.jr2.ox.ac.uk/bandolier/band25/b25-6.html Dillman, D. (2002). Navigating the rapids of change: some observations on survey methodology in the early 21stcCentury. Available: http://survey.sesrc.wsu.edu/dillman/papers/AAPOR percent20Presidential percent20Address.pdf Dillman, D., Totora, R. D., Conradt, J., & Bowker, D. (1998). Influence of plain versus fancy design on response rates for web surveys. Paper presented at annual meeting of the American Statistical Association, Dallas, TX. Dodd, D. K. & Markwiese, B. J. (1986). Survey response rate as a function of personalized signature on cover letter. Journal of Social Psychology, 127, 97-98. Eastin, M. S. & LaRose, R. (2000). Internet self-efficacy and the psychology of the digital divide. Avalable: wwww.ascusc.org/jcmc/vol6/issue1/eastin.html Farmer, T. (1998). Using the Internet for primary research data collection. Available: http//www.researchinfo,com/library/infotek/index.html. Flay, B. R. & Burton, D. (1988) “Effective mass communication campaigns for public health. Paper presented at the Conference on Mass Communications and Public Health: Complexities and Conflicts, the Annenberg Center, Rancho Mirage, CA. Forsman, G., & and Varedian, M. (2002) Mail and Web Surveys: A Cost and Response Rate Comparison in a Study on Students Housing Conditions. Paper presented at the ICIS

162
2002 - International Conference on Improving Surveys. Copenhagen, Denmark, August 25-28, 2002. Fowler, F. J. (1993). Survey research methods. Newbury Park, Ca: Sage Frick, A., Bächtinger, M. T., & Reips, U-D.(1999). Financial incentives, personal information and drop-out rate in online studies. In U-D. Reips et al.(Eds.), Current Internet science. Trends, techniques, results. Available: http://www.dgof.de/tband99/pdfs/a_h/frick.pdf Friis, R. H. & Sellers, T. A. (1996). Epidemiology for Public Practice. Aspen Publishers: Gaithersburg. Garson, D. (2002). Logistic regression. Available: http://www2.chass.ncsu.edu/garson/pa765/logistic.htm Gentry, E. M., Kalsbeek, W. D., Hogelin, G. C., Jones, J. T., Gaines, K. L., Forman, M. R., & Marks, J. S. (1985). The Behavioral Risk Factor Surveys: II. Design, methods, and estimates from combined state data. Americsn Journal of Preventive Medicine. 1, 6, 9-14. George, D. & Mallery, P. (1999). SPSS for windows: Step by step. Allyn & Bacon:Boston. Goyder, J. (1987). The silent minority: Non-respondents on sample surveys. Boulder: Westview Press. Green, L. W. & Kreuter, M. W. (1991). Health promotion and planning: An educational and environmental approach. London: Mayfield Publishing. Harris, J.R., McQueen, D. & Kaplan, J.P. (1997). Chronic disease control. In: Scutchfield D, Keck CW, eds. Principles of Public Health Practice. Albany, NY: Delmar Publishers. Heymann, D. L. (2001). Disease Surveillance. Available: http://www.who.int/emc/surveill/index.html#surveillance History Highlights of the Internet and Web. (1998). Available: http://www.wbri.com/history.htm Hoepfl, M. C. (1997). Choosing qualitative research: a primer for technology researchers. Journal of Technology Education. 9,1. Available: http://borg.lib.vt.edy/ejournals/JTE/lte-v9n1/hoepfl.htm Hoffman, C. (1997). A History of Health Indicators. In Newcomer, R. J. & Benjamin, A. E., eds., Indicators of chronic health conditions. Baltimore: Johns Hopkins University Press. Hosmer, D. & Lemeshow, S. (1989). Applied Logistic Regression. New York: John
163
Wiley. Houston, J. D. & Fiore, D. C. (1998). Online medical surveys: using the internet as a research tool. M. D. Computing, 15, 2, 116-120. Internet Literacy Consultants. (2000). ILC glossary of internet terms. Available: http://www.matisse.net/files/glossary.html Jette, D. U., Bacon, K., Batty, C., Carlson, M., Ferland, A., Hemingway, R. D., Hill, J. C., Ogilvie, L., & Volk, D. (2003). Evidence-based practice: Beliefs, attitudes, knowledge, and behaviors of physical therapists. Physical Therapy, 83, 9, 786-805. Kehoe, C., & Pitkow, J. (1996). Surveying the territory: GVU’s five WWW user surveys. The World Wide Web Journal, 1, (3). Available:http://www.cc.gatech.edu/gvu/user_surveys/papers/w3j.html Kiesler, S., & Sproull, L.S. (1986). Response effects in the electronic survey. Public Opinion Quarterly, 50: pp. 402-13. Kittleson, M. J. (1995). An assessment of the response rate via the postal service and e-mail. Health Values, 18(2), 27-29. King, K. A., Pealer, L. N., & Bernard, A. L. (2001). Increasing response rates to mail questionnaires: a review of inducement strategies. American Journal of Health Education. 32, 1, 4-15. Klaucke, D. N., Buehler, J. W., Thacker, S. B., Parrish, R. G., Trowbridge, F. L., & Berkelman, R. L.. (1988). Guidelines for evaluating surveillance systems. CDC MMWR Supplements, 37, S5, 1-18 Kleinbaum, D. G. & Klein, M. (2002). Logisitic regression: a self-learning text. Springer Verlag: New York. Kleinbaum, D. G. , Kupper, L. L., Muller, K. E. & Nizam, A. (1998). Applied regression analysis and other multivariate methods. Duxbury Press: Pacific Grove. Knapp, F., & Heidingsfelder, M. (1999). Drop-out analyse: Wirkungen des untersuchungsdesigns [Drop-out analysis: The effect of research design]. In U-D. Reips et al. (Eds.), Current Internet science. Trends, techniques, results. Available: http://www.dgof.de/tband99/pdfs/i_p/knapp.pdf Kotler P., & Roberto, E. (1989). Social Marketing: Strategies for Changing Public Behavior. New York: The Free Press. Krejcie, R. V., & Margan, D. W. (1970). Determining sample size for research activities. Educational and Psychological Measurement, 30, 607-610.

164
Lefebvre, R. C., & Flora, J. A. (1988). Social marketing and public health intervention. Health Education Quarterly, 15, 3, 299-315. Lea, Stephen (2002). Logistic regression and discriminant analysis. Available: http://www.ex.ac.uk/~SEGLea/multvar2/disclogi/html Lemeshow, S., Hosmer, D. W., Klar, J., & Lwanga, S. K. (1990). Adequacy of sample size in health studies. New York: Wiley Lenhart, A. (2003). The ever-shifting Internet population: A new look at Internet access and the digital divide. Available: http://www.pewinternet.org/reports/toc.asp?Report=88 Lomax, R. G. (1992). Statistical concepts: A second course for education and the New Tork: Longman Publishingbehavioral sciences. Martin, K. & Acuna, C. (2002). SPSS for institutional researchers. Workshop for the Association of Independent Colleges and Universities in Pennsylvania, Bucknell University, Lewisburg, PA. May, D. (2000). Web survey. September survey: patient satisfaction. Modern Healthcare. 30, 46, 90 McCabe, E., Boyd, C. J., Couper, C. J.,Crawford, S., and D'Arcy, H. (2002). Mode effects for collecting alcohol and other drug use data: Web and U.S. Mail. Journal of Studies on Alcohol, 63, 6, 755-782. McCullough, D. (1998). Web-based market research, the dawning of a new era. Direct Marketing 61, (8), pp. 36-9. McKenzie, J. F., & Smelter, J. L. (1997). Planning, implementing, and evaluating health promotion programs. Boston: Allyn and Bacon. McQueen, D.V. (1999). A world behaving badly: the global challenge for behavioral surveillance. American Journal of Public Health. 89, 9, 1312-1314. Mehta, R. & Sivadas, E. (1995). Comparing response rates and response content in mail versus e-mail surveys. Journal of the Market Research Society, 37, 429-439. Miller, E. T., Neal, D. J., Roberts, L. J., Baer, J. S., Cressler, S. O., Metrik, J. and Marlatt, G.A. (2002). Test-retest reliability of alcohol measures: is there a difference between internet-based assessment and traditional methods? Psychol. Addict. Behav. 16: 56-63. Mintz, J. H. (2001a). "Break Free" - the National Program To Reduce Tobacco Use. Available: http://www.hc -sc.gc.ca/hppb/socialmarketing/resources/somarhpe/smhp16e.htm
165
Mintz, J. H. (2001b). Ethics of Social Marketing. Available: http:// http://www.hc-sc.gc.ca/hppb/socialmarketing/resources/somarhpe/smhp20e.htm. Mintz, J. H. & May, C. (2001). "Really Me" - Action on Drug Abuse. Available: http://www.hc-sc.gc.ca/hppb/socialmarketing/resources/somarhpe/smhp18e.htm. Motulsky, H. (1995). Intuitive Biostatistics. New York: Oxford University Press. (Whitehead, 2002; Deeks, 1996). Mkt4change.com. (1999). The social marketing locomotive. Available: http://www.mkt4change.com/locomotive.htm. National Cancer Institute (1992). Making Health Communications Work. NIH Publication No. 92-1493. National Heart, Lung, and Blood Institute. (1984). Tenth Report of the Director. Vol. 1: Progress and Promise. National Institutes of Health Publication no. 84-2356. Neutens, J. J. & Rubinson, L. (1997). Research Techniques for the Health Sciences. Bostopn: Allyn and Bacon Newschaeffer C. J. (1997). Validation of BRFSS health-related quality of life questions in a statewide sample. CDC seminar on quality of life measures. Novartis Foundation for Sustainable Development. (2001). A short course in social marketing. Available: http://foundation.novartis.com/social_marketing.htm Novelli, D. N. (1990). Applying social marketing to health promotion and disease prevention. in Glanz, K., Lewis, F. M., & Rimer, B. K. Health Behavior and Health Education.Jossey-Bass: San Francisco. Parker, L. (1992). Collecting data the e-mail way. Training and Development, 52-54. Pealer, L. & Weiler, R. M. (2003). Guidelines for designing a web-delivered college health risk behavior survey: Lessons learned from the University of Florida health behavior survey. Health Promotion Practice, 4, 2, 171-9. Pealer, L. N., Weiler, R. M., Pigg, R. M., Miller, D., & Dorman, S. M. (2001). The feasibility of a web-based surveillance system to collect health risk behavior data from college students. Health Education & Behavior, 28, 5, 547-559. Perseus Development Corporation. (2001). Perseus SurveySolutions 4 – User Guide. Pitkow, J. E. & Recker, M. M. (1995). Using the Web as a survey tool: results from the second WWW user survey. Journal of Computer Networks and ISDN Systems, 27, 6 Available:http://www.gvu.gatech.edu/user_surveys/papers/survey_2_paper.html.
166
Pritchard, M. E., King, S. L. & Czajka-Narins, D. M. (1997). Adolescent body mass indices and self-perception. Adolescence, 32, 128, 863-880. Ringold, D. J. (1995). Social criticisms of target marketing: process or product? American Behavioral Scientist. 38, 4, 578-593. Robertson, L. S. (1992). The Validity of self-reported behavioral risk factors: seatbelt and alcohol use. The Journal of Trauma. 32, 1, 58-59. Rossi, P. H., Wright, J. D., & Anderson, A. B. (1983). Handbook of survey research. Orlado: Academic Press. Sabogal, F. (1996). Promoting cancer sScreening in ethnically diverse groups. Health Education and Behavior. 23, 123-141. Sackett, D.L. & Rosenburg, W.M.L. (1995). On the need for evidence-based medicine. Health Econ. 4:249—254. Salant, P. & Dillman, D. A. (1994). How to conduct your own survey. New York: John Wiley & Sons, Inc. Sarvela, P.D. & McDermott, R. J. (1999). Health education evaluation and measurement: A practitioner’s perspective. Madison: WCB/McGraw-Hill. Schaefer, D. R., & Dillman, D. A. (1998). Development of standard e-mail methodology: Results of an experiment. Public Opinion Quarterly, 62(3), 378-397. Scheleyer, T.K. & Forrest, J.L. (2000). Methods for the design and administration of web-based surveys. J. Amer. Med. Inform. Assoc. 7: 416-425. Schillewaert, N., Langerak, F. & Duhamel, T. (1998). Non probability sampling for WWW surveys: A comparison of methods. Journal of the Market Research Society, 4, (40), pp. 307-313. Schmidt, W. C. (1997). World-Wide Web survey research: Benefits, potential problems, and solutions. Behavior Research Methods, Instruments, & Computers. 29, 2, 274-279. Schuldt, B. A., & Totten J.W. (1994). Electronic mail vs. mail survey response rates. Marketing Research. pp. 1-7. Shea S., Stein, A. D., Lantigua, R., & Basch, C. E. (1991). Reliability of the Behavioral Risk Factor Survey in a triethnic population. American Journal of Epidemiology 133:489-500.
167
Sheehan, K. (2001). E-mail Survey Response Rates: A Review. Journal of Computer-Mediated Communication. 6, 2. Available: http://www.ascusc.org/jcmc/vol6/issue2/sheehan.html Sheehan, K. B. & M. G. Hoy. (1999). Using E-mail To Survey Internet Users In The United States: Methodology And Assessment. Journal of Computer-Mediated Communication. 4, 3. http://www.ascusc.org/jcmc/vol4/issue3/sheehan.html Sheehan, K. B., & Hoy, M. G. (1997). E-mail surveys: Patterns, process and potential. Paper presented at the Academy of American Advertising Conference, St. Louis. Sheehan, K. B., & McMillan, S. J. (1999). Response variation in e-mail surveys: An exploration. Journal of Advertising Research, 39, 4, 45-54. Simon, S. (2002). Guidelines for logistic regression models. Available: http://www.cmh.edu/stats/model/logistic.asp Smith, C. (1997). Casting the net: Surveying an Internet population. Journal of Computer Mediated Communication, 3, (1). Available: http://www.ascusc.org/jcmc/vol3/issue1/smith.html. Smith, P. F., Remington, P. L., Williamson, D. F., & Anda, R. F. (1990). A comparison of alcohol sales data with survey data on self-reported alcohol use in 21 states. Am J Public Health. 80, 309-312. Smith-Warner, S. A., Elmer, P. J., Fosdick, L., Tharp, T. M., & Randall, B. (1997). Reliability and comparability of three dietary assessment methods for estimating fruit and vegetable intakes. Epidemiology. 8, 196-201. Social Marketing Network, The. (2001). Social Marketing. Available: http://www.hc-sc.gc.ca/hppb/socialmarketing/index.html Soetko, R. M., Ward, R., Pao, V. & Lenert, L. (1997). Quality of life research on the internet: feasibility and potential biases in patients with ulcerative colitis. JAMA. 4, 426-435. Stanton, J. M. (1998). An empirical assessment of data collection using the Internet. Personnel Psychology, 51(3), 709-726. Stein, A. D., Lederman, R. I., Shea, S. (1996). Reproducibility of the women’s health module of the Behavioral Risk Factor Surveillance System questionnaire. Annals of Epidemiology. 6, 47-52. Sturgis, P. (2002). Principles of statistical modeling. Available: http://www.soc.surrey.ac.uk/~scs1ps/SOCM20 percent20LECTURE percent208.pdf

168
Swoboda, S. J., Muehlberger, N., Weitunat, R., & Schneeweiss, S. (1997). Internet surveys by direct mailing: An innovative way of collecting data. Social Science Computer Review, 15, 3,242-255. Syre, T. R. & Wilson, R. W. (1990). Health care marketing: Role evolution of the community health educator. Health Education, 21, 1, 6-8. Tansey, R., White, M., Long, R. G., & Smith, M. (1996). A comparison of loglinear and logistic regression in management research. Journal of Management, 22, 2, 339-358. Teutsch, S.M., Churchill, R.E., eds. (2000). Principles and Practice of Public Health Surveillance (2nd ed.). New York: Oxford University Press. Tse, A. C. B., Tse, K. C., Yin, C. H., Ting, C. B., Yi, K. W., Yee, K. P., & Hong, W. C. (1995). Comparing two methods of sending out questionnaires: email versus mail. Journal of the Market Research Society, 37, 441-446. UC Berkeley Library. (2000). Glossary: Web Searching and Netscape Jargon. Available:http://www.lib.berkeley.edu/TeachingLib/Guides/Internet/Glossary.html University of Maryland Institutional Review Board. (2000). IRB Home. Available: http://www.umresearch.umd.edu/IRB/index.html U.S. Department of Commerce. (2002). A nation online: how Americans are expanding their use of the internet. Available: http://www.esa.doc.gov/pdf/anationonline2.pdf Vehovar, V. (2003). Web Surveys: A meta-analysis . Presentation at the Institute of Statistical MathematicsTokyo, March 25th, 2003. Wallack, L. (1990). Media advocacy: Promotion through mass communication. in Glanz, K., Lewis, F. M., & Rimer, B. K. Health Behavior and Health Education.Jossey-Bass: San Francisco. Walsh, J. P., Kiesler, S., Sproull, L. S., & Hesse, B. W. (1992). Self-selected and randomly selected respondents in a computer network survey. Public Opinion Quarterly, 56, 241-244. Watt, J.H. (1999). Internet systems for evaluation research. In G. Gay and T.L. Bennington (Eds.), Information technologies in evaluation: Social, moral, epistemological, and practical implications (pp. 23-44). San Francisco, Jossey-Bass. WebSnaphot.com. (2001). Global web data and trends. Available: http://websnapshot.mycomputer.com Weibe, E. F., Eyerman, J., & Loft, J. (2001). Evaluating Non-response in a Web-Enabled Survey on Health and Aging. Presentation at the 2001 Conference of the American
169
Association for Public Opinion Research Montreal, Canada. May 17 - 20, 2001. Available: http://www.rti-knowledgenetworks.org/AAPOR-Non-response.pdf Weible, R., & Wallace, J. (1998). The impact of the Internet on data collection. Marketing Research, 10, 3, 19-23. Weinrich, N. K. (1999). What is social marketing. Social-Marketing.com. Available: http://www.social-marketing.com/whatis.html Weisband, S. & Kiesler, S. (1996) Self- Disclosure on Computer Forms: Meta-Analysis and Implications. Tucson: University of Arizona. Available: http://www.al.arizona.ed u/~weisband/chi/chi96.html.
Whitaker, J. S. (1997). Use of Stepwise Methodology in Discriminant Analysis. Available: http://ericae.net/ft/tamu/STEPWIS.htm
Whitehead, J. (2002). An introduction to logistic regression. Available: http://personal.ecu.edu/whiteheadj/data/logit/ Williams, R. (2002). Analytic Strategies: Simultaneous, hierarchical, and stepwise regression. Available: http://www.nd.edu/~rwilliam/zsoc592/fall2002/lectures/x51.pdf
Williams, S. (2003). Logistic regression. Available: http://www.cogs.susx.ac.uk/users/sianw/spss percent201/week8handout.pdf Yeaworth, R. C. (2001). Use of the Internet in survey research. Journal of Professional Nursing 17, 4, 187-93 Yun, G. W. & Trumbo, C. W. (2000). Comparative response rates to a survey executed by post, e-mail, & web form. Journal of Computer-Mediated Communication. 6 (1). Available: http://www.ascusc.org/jcmc/vol6/issue1/yun.html