chapter i chapter iv - science to understand creation of life
TRANSCRIPT

Chapter IChapter IChapter IChapter IVVVV
Comparative Analysis of Differential Protein
Expression in Different Organs by
Two-Dimensional Electrophoresis
and Mass Spectrometry

Identification and Characterzation of Novel Proteins in Diabetic and Diabetic Treated [Cynodon dactylon (L.) Pers] Albino Rats
59
Ch
ap
ter–
4
CHAPTER – 4
COMPARATIVE ANALYSIS OF DIFFERENTIAL PROTEIN
EXPRESSION IN DIFFERENT ORGANS BY TWO-DIMENSIONAL
ELECTROPHORESIS AND MASS SPECTROMETRY
4.1. GENERAL INTRODUCTION-PROTEOMICS
espite continued advances in our understanding of the complex molecular
mechanisms underlying the development of diabetes mellitus (DM) and its
complications, it is clear that our knowledge is still limited (White, 2002; Pickup and
Williams, 1997). Given the predicted explosion in the number of cases of DM
worldwide (Zimmet, 2004), continued research is essential, particularly with a view to
understanding the impact of environmental stimuli on the physiological processes
contributing to the development and progression of disease.
DM and its complications arise as a consequence of defects in a variety of
different tissues (Pickup and Williams, 1997). The liver, pancreas and skeletal muscle
are intimately involved in glucose homoeostasis and insulin resistance and as such are
important targets for research into the pathophysiology of diabetes and drug
development. Adipose tissue is increasingly being viewed as key in the development of
insulin resistance, by virtue of the activity of the hormones and cytokines it produces,
and as a result of the epidemiological link between obesity and the development of
T2DM/insulin resistance (Goldfine and Kahn, 2003). In the wider context of insulin
resistance, dyslipidaemia is an important component, involving adipose tissue and the
liver in its pathogenesis and expression. Ultimately, the main clinical manifestation of
diabetes is vascular disease: (Stern, 1996) macrovascular ischaemic heart disease and
stroke are the main causes of death, dramatically reducing life expectancy and
microvascular complications such as retinopathy, nephropathy and neuropathy) are a
major cause of morbidity (Pickup and Williams, 1997).
D

Identification and Characterzation of Novel Proteins in Diabetic and Diabetic Treated [Cynodon dactylon (L.) Pers] Albino Rats
60
Ch
ap
ter–
4
4.1.1. Genomics to Proteomics
The term proteome was first introduced in 1994 by Wilkins and co-workers in
Siena, Italy (Wilkins et al., 1994). Proteome refers to the already established terms
genome and
transcriptome and
describes all proteins
present in a given cell
or organism. Although
researchers realized
that a systematic
analysis of the proteins
expressed by a cell or
organism would be
essential to understand
the mechanisms and
pathways involved in
all aspects of cell
growth and
differentiation many
years earlier, it was only until the completion of the first genome projects that this
proteome investigation boosted enormously is shown in figure 4.1 (Gygi et al., 1999).
This was the start of the post-genomic era, where researchers realized that many
processes occur in a cell from the transition from genome to proteome, which could not
be explained solely by genomics and transcriptomics.
It is undoubtedly clear that the availability of the human genome has aided
greatly to our understanding of many genetic disorders and is a great step forward in
the diagnosis and treatment possibilities for their associated diseases. However, the
majority of diseases, even if they are genetic, are not caused by a single mutation.
Rather, they are a combinatorial effect of multiple genetic mutations or an unfavourable
combination of common alleles. In addition, environmental factors may also contribute
Figure 4.1 – Miniaturization in functional genomics
and proteomics.

Identification and Characterzation of Novel Proteins in Diabetic and Diabetic Treated [Cynodon dactylon (L.) Pers] Albino Rats
61
Ch
ap
ter–
4
to initiation of the disease, which is true for type 1 diabetes. Concurrently with the
sequencing of the human genome, RNA-based assays, such as microarrays and the real-
time reverse transcriptase PCR technique were a major research topic, both in
fundamental research and in clinical diagnostics (Overbergh et al., 2006). Although our
knowledge of the pathways involved in many diseases greatly improved, no
information whatsoever could be obtained from these RNA-based studies regarding the
importance of translational regulation and the role of post-translational modifications
(PTMs). Moreover, some authors proved a very poor correlation between mRNA levels
and protein levels (Anderson and Seilharner, 1997; Gygi et al., 1999). From this
perspective, proteomics covers the real executing molecules that change expression in a
diseased state or after application of a candidate medical compound.
The International Human Genome Sequencing Consortium has estimated that
there are most likely 30,000–40,000 protein coding genes in Homo sapiens (Baltimore,
2001). The number of proteins present in human has been estimated to be as high as 2
million, due to a variety of protein isoforms generated by PTMs, alternative splicing or
mRNA editing. More than 200 different types of protein modifications have been
described, including phosphorylation, glycosylation and proteolysis cleavage. These
numbers undoubtedly point to an important role for proteomics. Proteomic studies can
be applied to a range of biological systems to answer the desired research question,
including human studies, animal models and/or cell culture systems.
4.1.2. Proteomics and Diabetes
Proteomics studies in diabetic research aim to provide a detailed
characterisation of proteins in aberrant cells. The belief is that by applying this
information along with gene expression data and knowledge of metabolic and
signalling pathways, deductions can be made as to the mechanisms underlying the
initiation and development of diabetes (Peng and Gygi, 2001). In principle, proteomics
has the potential to identify all aberrantly expressed proteins in cells. The expectation is
that it may be possible to characterise the proteome of a cell in such detail that the key
aberrant changes in the cellular proteome can be identified and related to the diabetes.
Identification and Characterzation of Novel Proteins in Diabetic and Diabetic Treated [Cynodon dactylon (L.) Pers] Albino Rats
62
Ch
ap
ter–
4
This is an optimistic ’assumption’ as current technology cannot fully answer this
question. Despite significant advances, proteomics is still constrained by the
concentration-sensitive detection limits of mass-spectrometry. In addition, mass
spectrometry does not easily lend itself to high-throughput systems, similar to those
developed for microarray studies, nor does it have the ability of using amplification
strategies such as PCR (Wohlschlegel and Yates, 2003).
This being the case, why should we attempt to derive proteomic data? An
important answer lies in the fact that the knowledge that mRNA microarray data
produces on genome wide expression does not necessarily translate through to protein
expression. Thus, proteins are subject to numerous post-translation modifications
(PTMs), such as phosphorylation, glycosylation, methylation and proteolytic cleavage
which can vary according to different stages in the life of a cell and are affected by
metabolism, cell cycle, differentiation and cell death (Peng et al., 2003). Proteomics
can now be used to identify changes in not only whole cells but also identify more
insightful and informative changes in discrete organelles and the various sub-cellular
compartments of the cell, which may be related to the cause and/or onset of neoplasia.
In this review we highlight the advantages of fractionation, separation and affinity
purification techniques. By applying targeted mass spectrometric analysis of particular
organelles or metabolic pathways we can better understand the disease processes and
enhance the chances of developing new therapeutic treatments (Cronshaw et al., 2002).
4.1.3. Proteomics and Biomarkers
The National Academy of Sciences defines “biomarker” as an indicator that
signals events in biological samples or systems. Molecular biomarkers hold the promise
of transforming almost every field in biology and medicine. With the recent emergence
of new technologies such as genomics-based and proteomics-based approaches, the
field of biomarker discovery, development and application has been the subject of
intense interest and activity (Petricoin et al., 2002) are shown in figure 4.2. Ultimately,
biomarkers offer the promise of more efficient discovery and development of novel
therapies as well as improved and more individualized disease prevention and

Identification and Characterzation of Novel Proteins in Diabetic and Diabetic Treated [Cynodon dactylon (L.) Pers] Albino Rats
63
Ch
ap
ter–
4
treatment. And one of the most valuable classes of biomarker over the past century has
been protein biomarkers (Rapkiewicz et al., 2004).
The proteomic scale capabilities now enable thousands of proteins to be
identified from complex mixtures. Despite the success of existing platforms, the current
approaches are unable to tackle some important research problems of great interest to
many scientists and clinicians. For instance, it is highly desirable for protein markers
that will be used in medical practice to be detected and measured in body fluids such as
plasma (Rosenblatt et al., 2004). These fluids are highly complex mixtures of proteins
and exhibit a very broad dynamic range of protein relative abundances (up to 12 orders
of magnitude). Therefore, it is believed that many important proteins and potentially
important markers
escape detection by the
current proteomics
technologies. The
“omics” tools are
becoming very useful in
the development of new
biomarkers in
cardiovascular disease.
Among them,
proteomic is especially
fitted to look for new
proteins in health and
disease and is playing a
significant role in the
development of new
diagnostic tools in
cardiovascular
diagnosis and prognosis
(Arab et al., 2006).
Figure 4.2 – Schematic representation of discovery of
biomarker protein from cell by using advance protein
technologies.

Identification and Characterzation of Novel Proteins in Diabetic and Diabetic Treated [Cynodon dactylon (L.) Pers] Albino Rats
64
Ch
ap
ter–
4
4.1.4. Proteomics and Biomedicine
In biomedical research, understanding and defining the origin of diseases and
their effect on multiple organs is a necessity. It has to be done at several levels:
genomic, transcriptomic, proteomic and metabolomic. When the origin of a disease is
suspected to be monogenic, the best approach to unravel its cause is obviously genomic
(Lander, 2001). When the behaviour or the aggression of a cancer and its response to
therapy are related to multiple gene modifications or expression deregulation, tissue
biopsies should be analysed at transcriptomic levels by reverse transcription PCR and
DNA microarrays. When the disease impacts mostly on the internal environment and is
due to the accumulation of ‘toxic’ material affecting multiple organs, proteomic and
metabolomic approaches are required. Substantial advances have recently been made in
the fundamental understanding of human biology, resulting in important new medical
treatments. Proteomics can be used in medicine for basic or applied research, in
fundamental or clinical domains, to unravel disease processes or to discover biomarkers
and therapeutic targets. So far, the value of proteomics has mainly been shown in
fundamental applications such as discovery tools (Dasgupta et al., 2005). Proteomics
has provided valuable results in highlighting protein complexes such as nucleoli,
ribosomes or other organelles or identifying proteins involved in major biochemical
pathways. It demonstrated its power to identify and classify, with the help of
bioinformatics, proteins from pathogenic microorganisms or from several cell fractions
such as membrane, nuclei or other components. At present, proteomics seems to be the
most promising tool for biomedical research to target the molecular candidate for
disease (DeKosky and Marek, 2003).
4.1.5. Proteomic Technologies
Proteomic analyses have two different aspects – expression proteomics and
functional proteomics (Wang and Hanash, 2003). Expression proteomics broadly
involves the identification and quantification of proteins and characterisation of splice
variants, PTMs and cellular localisation. Expression proteomics technologies involve
one or more separation steps followed by identification using mass spectrometry. The

Identification and Characterzation of Novel Proteins in Diabetic and Diabetic Treated [Cynodon dactylon (L.) Pers] Albino Rats
65
Ch
ap
ter–
4
classical proteomic technique is two-dimensional gel electrophoresis (2-DE), followed
by protein identification by matrix-assisted laser desorption ionisation (MALDI) mass
spectrometry (MS). More recent developments include liquid chromatography coupled
to electrospray ionisation (ESI) MS/MS and surface-enhanced laser desorption
ionisation (SELDI) MS. The above techniques are generally used for comprehensive
protein profiling. However, they can be preceded by a variety of procedures for
reduction of sample complexity, including multidimensional liquid chromatography,
cellular fraction, immunoprecipitation (IP) and affinity chromatography. Functional
proteomics includes techniques for analysis of protein-protein interactions and protein
networks such as the two-hybrid systems, surface plasmon resonance (SpR) and
nuclear magnetic resonance (NMR) (Aebersold and Mann, 2003; Zhu et al., 2003). It is
beyond the scope of this review to cover all aspects of proteomics and therefore in this
study providing a brief overview of two dimensional electrophoresis and mass
spectrometry technologies and their application to the study of diabetes mellitus and its
complication is different tissues.
4.1.6. Two Dimensional Electrophoresis and Mass Spectrometry-Diabetes
Associated Proteomic Analysis
In this system, complex
mixtures of proteins are separated by
gel electrophoresis. In the first
dimension, separation is based on
relative charge according to
isoelectric point [isoelectric focusing
(IEF)); in the second dimension,
separation is based on molecular
mass (O'Farrell, 1975). Once
separated, the proteins are visualised
as an array of apparent ‘spots’ by
treating the gel with one of a variety
Figure 4.3 – Schematic diagram of
proteome analysis by using 2-DE and
mass spectrometry (MALDI-TOF-MS).

Identification and Characterzation of Novel Proteins in Diabetic and Diabetic Treated [Cynodon dactylon (L.) Pers] Albino Rats
66
Ch
ap
ter–
4
of protein stains, including Coomasie Blue, silver and Sypro Ruby, or by pre-staining
with Cy dyes (100s to 1,000s of spots can be resolved on a single gel). The stained
protein spots are imaged by specialised equipment and differences in protein expression
between samples can be determined using specialised software (Sivakumar, 2002). A
variety of analysis programs are available which allow for comparison of multiple
samples by aligning gel images. Assessment can then be made of changed protein
patterns (often characteristic of PTMs) or levels (indicative of variant expression). For
protein identification, protein spots of interest are excised from the gel, fragmented by
proteases (most often trypsin) and the resulting mixture of peptides is then spotted onto
a MALDI-MS plate. The samples are then dried and coated with MALDI matrix to
promote peptide ionisation for MS analysis. This involves separation of peptides
according to their time of flight (TOF), which is dependent upon mass to charge (m/z)
ratio. The resultant peptide m/z ‘fingerprint’ is then compared against databases (such
as Mascot, www.matrixscience.com) of theoretical peptide fingerprints of all proteins
to identify the protein(s) of interest is shown in figure 4.3 (Henzel et al., 2003).
The field of diabetes research has expanded as the laboratory and bioinformatics
tools for unravelling complex phenotypes have evolved. Proteomics is the latest
research tool to be employed in this context and it perhaps holds more promise than the
genetic analyses that have been prevalent for the past decade or so. The aim of this
research is to provide an overview of proteomic techniques and their potential
application to the study of diabetes and its complication.
4.2. ORGANS AND ORGAN SYSTEMS
An organ is the group of different tissues that is integrated to perform a specific
function. Generally, one tissue performs the primary function characteristic of the
organ and the other tissues perform the supporting function, such as providing the
vascular and connective-tissues framework for the organ. The functional cells of an
organ are often called the parenchymal cells and the total mass of functional tissue is
called the parenchyma. The supporting framework the organ is called the stroma. In the
liver, for example the parenchymal cells are formed by cords of epithelial cells that

Identification and Characterzation of Novel Proteins in Diabetic and Diabetic Treated [Cynodon dactylon (L.) Pers] Albino Rats
67
Ch
ap
ter–
4
perform the many metabolic functions characteristic of the liver, such as the synthesis
of protein and the excretion of bile. The cord cells are supported by a framework of
connective tissues fibers. Numerous thin-walled blood vessels are interspersed between
the cell cords and the entire liver is surrounded by a capsule composed of dense fibrous
tissue. An organ system is a group of organs that is organised to perform
complementary functions, such as the reproductive system, the respiratory system and
the digestive system (Toro et al., 1991).
The highly complex structure of the entire body evolves from a single cell, the
fertilized ovum, by a complex process that includes periods of cell multiplication,
differentiation and organization to form organs and organ systems. Each normal cell in
the body is the part of a community of cells and is integrated with its neighbours so that
it functions along with other cells to meet the body’s needs (Ben et al., 1963).
4.2.1. PANCREAS
The pancreas is a small
organ, approximately six inches
long, located in the upper
abdomen and adjacent to the small
intestine. The head of the pancreas
is on the right side of the
abdomen. It is connected upper
end of the small intestine
(posterior wall of stomach). The
narrow end of the pancreas called
the tail extends to the left side of
the body (splenic vein and left
kidney) (Hellman et al., 2007).
The pancreas is a dual-function
gland, having features of both
endocrine and exocrine glands are presented in figure 4.4. Endocrine pancreatic cell
Figure 4.4 – Anatomy and cross section of
pancreas.

Identification and Characterzation of Novel Proteins in Diabetic and Diabetic Treated [Cynodon dactylon (L.) Pers] Albino Rats
68
Ch
ap
ter–
4
contains clusters of Islet of Langerhans, which have four types of hormone secreting
cells: A-cells secrete glucagon, B-cells secrete insulin, D-cells secrete somatostatin and
PP-cells secrete pancreatic polypeptide. A failure of B-cells results in the condition of
diabetes (Piper et al., 2004). Exocrine pancreatic cell contains clusters of acini cell
(singular acinus). It secretes pancreatic juice that contains digestive enzymes; help
digest food in the small intestine (Ben et al., 1963). The embryological development of
pancreas from the embryonic foregut and is therefore of endodermal origin. Pancreatic
development begins [with] the formation of a ventral and dorsal anlage
(Carlson and Bruce, 2004).
4.2.1.1. Pancreas Physiology Associated with Glucose Regulation
The multi-cellular structure constitutes the endocrine unit of the pancreas and is
responsible for the regulation of blood glucose homeostasis. Approximately one million
islets are distributed throughout a healthy adult human pancreas, representing 1 and 2%
of the total mass of the organ. Each islet, with sizes varying from 100 to 500 mm, is
made up of 1000–3000 cells (Brissova et al., 2005). The principle level of control on
glycaemia by the islet of Langerhans depends largely on the coordinated secretion of
glucagon and insulin by alpha and beta-cells respectively. Both cell types respond
oppositely to changes in blood glucose concentration: while hypoglycaemic conditions
induce a-cell secretion, b-cells release insulin when glucose levels increase
(Nadal et al., 1999; Quesada et al., 2006a). Insulin and glucagon have opposite effects
on glycaemia as well as on the metabolism of nutrients. Insulin acts mainly on muscle,
liver and adipose tissue with an anabolic effect, inducing the incorporation of glucose
into these tissues and its accumulation as glycogen and fat. By contrast, glucagon
induces a catabolic effect, mainly by activating liver glycogenolysis and
gluconeogenesis, which results in the release of glucose to the bloodstream.
An abnormal function of these cells can generate failures in the control of glycaemia,
which can lead to the development of diabetes (Dunning et al., 2005). Actually,
diabetes is associated with disorders in the normal levels of both insulin and glucagon.
An excess of glucagon plasma levels relative to those of insulin can be determinant in

Identification and Characterzation of Novel Proteins in Diabetic and Diabetic Treated [Cynodon dactylon (L.) Pers] Albino Rats
69
Ch
ap
ter–
4
the higher rate of hepatic glucose output, which seems to be critical in maintaining
hyperglycaemia in diabetic patients (Dunning et al., 2005).
4.2.1.2. Diabetes Mellitus Occurring as a Consequence of Pancreas Pathology
4.2.1.2.1. Genetics
Diabetes is a polygenic disease, meaning many different genes contribute to its
expression. Depending on locus or combination of loci, it can be dominant, recessive or
somewhere in between. The strongest gene, IDDM1, is located in the MHC Class II
region on chromosome 6, at staining region 6p21. Certain variants of this gene
increases the risk for decreased histocompatibility characteristic of diabetes such as
DRB1 0401, DRB1 0402, DRB1 0405, DQA 0301, DQB1 0302 and DQB1 0201,
which are common in North Americans of European ancestry and in Europeans
(Bluestone et al., 2010).
4.2.1.2.2. Diet
Diet, is also a major factor responsible for causing diabetes. Eating too much of
Carbohydrates, fats and proteins, are all harmful to the body. Our body in general needs
a balanced diet to produce energy for performing vital functions. Too much of food,
hampers the pancreas from performing its function of insulin secretion. Hence, with
insufficient insulin secretion, the blood sugar level rises, leading to diabetes mellitus.
(Seshiah et al., 2004).
4.2.1.2.3. Pancreatic Cancer
Pancreatic cancer (cancer of the pancreas) is the fifth leading cause of cancer
the United States and tenth most common cancer in Europe and the incidence is
increasing in India. The median survival is 8–12 months for patients presenting with
locally advanced and unrespectable disease is only 3–6 months for those with
metastatic condition (Spinelli et al., 2006). The most common type of pancreatic cancer
Identification and Characterzation of Novel Proteins in Diabetic and Diabetic Treated [Cynodon dactylon (L.) Pers] Albino Rats
70
Ch
ap
ter–
4
arises from the exocrine glands and is called adenocarcinoma of the pancreas. About
80% of pancreatic cancer patients have glucose intolerance or frank diabetes
(Feng et al., 2003).
4.2.1.2.4. Autoimmune Diabetes
In type 1 autoimmune diabetes there is a selective destruction of insulin-
secreting beta cells. Around the time of clinical presentation, insulitis, a chronic
inflammatory infiltrate of the islets affecting primarily insulin containing islets. The
inflammatory infiltrate consists primarily of T lymphocytes; CD8 cells and CD4 cells,
there are fewer B lymphocytes and macrophages are relatively scarce. Beta cell death
may involve the Fas apoptotic pathway since they have been shown to express Fas,
infiltrating T lymphocytes express Fas-L and apoptotic beta cells have been described
(Foulis, 2008).
4.2.1.2.5. Pancreatitis
Pancreatitis is an inflammation of the pancreas. Pancreatitis may be acute or
chronic. In acute pancreatitis, the patient develops an attack of pancreatitis rapidly and
it lasts for a few days to weeks and then the disease subsides. After the acute attack, the
pancreas returns to normal and healthy state. However, in a small number of patients,
the disease can become serious and can, even lead to death.
(Frossard et al., 2008; Nair et al., 2007).
4.2.1.2.6. Obesity
Obesity is also one of the major factors causing diabetes. Excessive body
weight as compared to the height of an individual, serves as a predisposing factor for
diabetes mellitus. It is commonly seen in patients at 40 years of age suffering from type
2 non-Insulin dependent diabetes mellitus. Due to extra amount of fat in the body, the
insulin does not function properly in the body (Parvez et al., 2007).

Identification and Characterzation of Novel Proteins in Diabetic and Diabetic Treated [Cynodon dactylon (L.) Pers] Albino Rats
71
Ch
ap
ter–
4
4.2.1.2.7. Virus infection
Virus infections can also lead to diabetes. Certain virus like Coxsackie B virus
may infect the pancreas, leading to destruction of Beta (B) cells of Islets of Lange
home, finally impairing the release of insulin and increased blood sugar levels
(Marc et al., 1998).
4.2.1.2.8. Chemicals and drugs
Zanosar is the trade name for streptozotocin, an antibiotic and antineoplastic
agent used in chemotherapy for pancreatic cancer; it kills beta cells, resulting in loss of
insulin production. Alloxan (2,4,5,6-tetraoxypyrimidine; 2,4,5,6-pyrimidinetetrone) is
an oxygenated pyrimidine derivative. It also kills beta cells, resulting in loss of insulin
production. The cytotoxic action of both these diabetogenic agents is mediated by
reactive oxygen species. These radicals undergo dismutation to hydrogen peroxide.
Thereafter highly reactive hydroxyl radicals are formed by the Fenton reaction. The
action of reactive oxygen species with a simultaneous massive increase in cytosolic
calcium concentration causes rapid destruction of B cells
(Szkudelski, 2001; Wilson et al., 1984).
4.2.1.3. Pancreas Pathology Associated Proteomics
Recently, there has been substantial interest in applying proteomic methods for
the discovery of new therapeutic targets and new biomarkers for diagnosis and early
detection (Hanash, 2003). Numerous other studies have identified disease-related
changes in protein expression, primarily using 2D-PAGE and mass spectrometry. The
first comprehensive study of the pancreatic cancer proteome by quantitative global
protein profiling using ICAT technology. In total, 656 proteins were discovered and
151 proteins were differentially expressed in cancer compared with normal pancreas
(Naomi et al., 2009). Proteomic technologies provide an excellent means for analysis of
body fluids for cataloging protein constituents and identifying biomarkers for early
detection of cancers. The “pancreatic juice’’ contains pancreatic cancer tumor markers

Identification and Characterzation of Novel Proteins in Diabetic and Diabetic Treated [Cynodon dactylon (L.) Pers] Albino Rats
72
Ch
ap
ter–
4
(e.g., CEA, MUC1) and proteins over-expressed in pancreatic cancers
e.g., hepatocarcinoma-intestine-pancreas/pancreatitis-associated protein (HIP/PAP) and
lipocalin 2 (Mads et al., 2004). The pancreatic cancer biomarkers were identified from
AsPC-1 (metastatic) and BxPC-3 (primary) cells also. The differentially expressed
membrane proteins may serve as potential targets for diagnostic and therapeutic
interventions (Xiaojun et al., 2010). Pancreatic secretory trypsin inhibitor (PSTI) is a
potent low–molecular-weight inhibitor of trypsin synthesized in the acinar cells of the
pancreas. In pancreatitis condition, PSTI variants occurring at nanomolar
concentrations in urine can be detected and quantified by immunoaffinity purification
and mass spectrometry (Leena et al., 2006). The changes in expression patterns of
proteins that are specific to disease tissues can be characterized using proteomic
technologies. At the protein level, distinct changes occur during the transformation of a
healthy cell into a disease cell, including altered expression, differential protein
modification, changes in specific activity and aberrant localization (Hanash, 2001).
Pancreatic proteomics involves cataloging those changes that arise as a result of
diabetes mellitus. In an effort to systematic studies of protein profiles in pancreatic
function associated diabetes with the aim of identifying potential biomarkers, we used
the 2–DE and MALDI–TOF–MS/MS technology to identify protein profiling of
diabetic pancreas tissues and normal pancreas.
4.2.2. BRAIN ANATOMY
The anatomy of the brain is
complex due its intricate structure
and function. This amazing organ
acts as a control centre by
receiving, interpreting and
directing sensory information
throughout the body. There are
three major divisions of the brain
are shown in figure 4.5. They are,
Figure – 4.5 Anatomy of Brain.

Identification and Characterzation of Novel Proteins in Diabetic and Diabetic Treated [Cynodon dactylon (L.) Pers] Albino Rats
73
Ch
ap
ter–
4
forebrain, midbrain and hindbrain (Toro et al., 1991). The forebrain is responsible for a
variety of functions including receiving and processing sensory information, thinking,
perceiving, producing and understanding language and controlling motor function. For
anatomical study the forebrain is divided into two subdivisions: the telencephalon and
the diencephalon. The primary structures of the telencephalon include the cerebral
cortex, basal ganglia and the limbic system. Most of the actual information processing
in the brain takes place in the cerebral cortex. The diencephalon includes the thalamus
and the hypothalamus, which are responsible for such functions as motor control,
relaying sensory information and controlling autonomic functions (Murre and Sturdy,
1995). The midbrain and the hindbrain together make up the brainstem. The midbrain is
the portion of the brainstem that connects the hindbrain and the forebrain. This region
of the brain is involved in auditory and visual responses as well as motor function. The
hindbrain extends from the spinal cord and is composed of the metencephalon and
myelencephalon. The metencephalon contains structures such as the pons and
cerebellum. These regions assist in maintaining balance and equilibrium, movement
co-ordination and the conduction of sensory information. The myelencephalon is
composed of the medulla oblongata which is responsible for controlling such
autonomic functions as breathing, heart rate and digestion (Marner et al., 2003).
4.2.2.1. Brain Physiology Associated with Glucose Regulation
Brain monitors and regulates the energy needs of the body. The carbohydrate
and lipid metabolism are monitored by the brain using combinations of metabolic and
neural signals from the periphery. These signals enter the brain and trigger
neuroendocrine and autonomic responses that maintain energy homeostasis over a
fairly wide variety of environmental perturbations. Mayer proposed the glucostatic
hypothesis (Mayer, 1955) whereby glucose-sensing neurons participated in the short-
term regulation of energy intake. These neurons increase their firing rate when ambient
glucose levels rise and cease firing when glucose is removed (Oomura et al., 1969).
This response is modulated by a K+ channel that is sensitive to the intracellular ratio of
ATP to ADP. Thus, it is called the ATP-sensitive K+ channel (KATP) (Trapp and
Ashcroft, 1997). The KATP channel is inactivated by direct binding of ATP, whereas

Identification and Characterzation of Novel Proteins in Diabetic and Diabetic Treated [Cynodon dactylon (L.) Pers] Albino Rats
74
Ch
ap
ter–
4
phosphorylation of the channel increases its activity (Routh et al., 1997). Similar to the
pancreatic beta-cell, the KATP channel on GR neurons is inactivated by an increased
intracellular ATP-to-ADP. This leads to accumulation of intracellular K+ with
subsequent membrane depolarization and cell firing (Ashford et al., 1990). Both
GLUT-2 and the insulin-sensitive GLUT-4 transporters are found in the brain on
neurons and/or glia (Leloup et al., 1994). However, in the highly interconnected
conditions of obesity and non-insulin-dependent diabetes mellitus (NIDDM), there
appear to be major resetting of normal homeostatic mechanisms. In particular, the
brain’s ability to monitor and respond to alterations in glucose metabolism becomes
aberrant in both individuals predisposed to become obese (obesity prone) and those
already obese and diabetic. Such dysregulation also occurs in insulin-dependent
diabetes mellitus (IDDM) (Kumagai, 1999).
During starvation, ketone bodies account for approximately 60% of the fuel
needs of brain and that glucose oxidation is decreased to less than one-third of the value
in the post-absorptive state. Ruderman et al. observed that acetoacetate and
3-hydroxybutyrate are also utilized by the brain of the rat during starvation
(Ruderman et al., 1974).
The neural control of secretion occurs at several different levels, including both
the central and peripheral nervous systems. Sympathetic (adrenergic) α2: decreases
secretion from beta cells, increases secretion from alpha cells, β2: increases secretion
from beta cells. Parasympathetic (muscarinic) M3: increases stimulation of alpha cells
and beta cells. (Verspohl et al., 1990). Somatostatin is a peptide hormone that regulates
the endocrine system i.e. secretion of glucagons and insulin
(Florio and Schettini, 2002).
4.2.2.2. Brain-Diabetes is related to Several Pathologies
Diabetes mellitus is a heterogeneous metabolic disorder characterized by
hyperglycemia resulting from defective insulin secretion, resistance to insulin action, or
both. Diabetes is associated with moderate cognitive deficits and neurophysiological

Identification and Characterzation of Novel Proteins in Diabetic and Diabetic Treated [Cynodon dactylon (L.) Pers] Albino Rats
75
Ch
ap
ter–
4
and structural changes in the brain (Gavin et al., 1997). In particular there is increasing
evidence supporting a relation between type II diabetes and dementia in elderly. The
relative risk for developing dementia in elderly patients was doubled with diabetes, as
shown in a cohort study (Biessels et al., 2002). In addition, an elevated risk for
alzheimer's disease (AD) was observed in diabetic patients The AD impairment of the
insulin signalling in the brain was shown in central nervous system dysfunctions such
as Huntington’s disease or parkinsonism (Gasparini et al., 2002). An increasing number
of data implicate insulin itself in the pathogenesis of age-related memory decline and
diabetic encephalopathy. Dysregulation of insulin secretion or reduction in the levels of
both insulin and its receptor in the brain was reported in aging, obesity, diabetes, and
serious mental disorders in humans in postmortem studies and in animal models in vitro
and in vivo (Zhao and Alkon, 2002). Reduced glucose use with a consequent reduction
in available energy has been found to correlate with a decline in memory and cognitive
functions in aged or pathological subjects (Messier and Gagnon, 2000).
Neuropathy is the disease of the nervous system. Neuropathy is a disturbance in
the function of a nerve or particular group of nerves. Many people who have had
diabetes for a while have nerve damage. Neuropathy can lead to disability, amputation,
decreased ambulation as well as foot and leg ulceration because of loss or damage to
nerves which feel sensation in the lower limbs (Kanji et al., 2010).
4.2.2.3. Brain Pathology Associated with Proteomics
The brain is the most complex organ of higher organisms, differing from other
organs due to its many different cell types, its structure at the cellular and tissue level.
At the same time, the brain is of highest paramount interest in medical research and
pharmaceutical industry because of the widespread public caused by the more common
neurological diseases such as Alzheimer‘s Disease and Parkinson‘s Disease
(Peterson, 2002). Therefore, one aim of the HUPO Brain Proteome Project is the
characterization of the brain proteomes and the use of the gained utility of this data
(identified proteins, mRNA profiles, protein/protein interactions, protein modifications,
localization and validated targets) to compare in comparison to mouse models of

Identification and Characterzation of Novel Proteins in Diabetic and Diabetic Treated [Cynodon dactylon (L.) Pers] Albino Rats
76
Ch
ap
ter–
4
human disease and to relevant human tissue-autopsy materials for human
neurodegenerative diseases (Wilkins et al., 2006). In order to reach this goal, it is
necessary to coordinate the neuroproteomic activities worldwide. Proteomics is a
systematic approach for studying the identity and function of all proteins expressed in a
cell, tissue or organ. New drug targets for diseases are often identified by comparing
the proteome of the disease state to the normal state. As a result, proteomics has
become increasingly important in the pharmaceutical and biotechnology. In brain,
redox proteomics has identified oxidatively modified protein targets in various
pathological conditions, consequently providing insight into the pathways involved in
the pathogenesis of these conditions. This approach also can be used to identify
possible protective mechanisms to prevent or delay these disorders (Sultana and
Butterfield, 2011). Recently, several attempts have been made to describe changes
related to certain anxiety states in the proteome of experimental animal models. This
proteomics data suggest that alterations in serotonin receptor-associated proteins, in the
carbohydrate metabolism, in the cellular redox system and in synaptic docking are all
involved in anxiety (Eva et al., 2010). Hashimoto’s encephalopathy (HE) is a rare
autoimmune disease associated with Hashimoto’s thyroiditis (HT). Alpha-enolase as a
novel autoantigen for HE using a brain proteomic screening system. These results
suggest that the detection of anti-alpha-enolase antibody is useful for defining HE-
related pathology and this proteomic strategy is a powerful method for identifying
autoantigens of various central nervous system diseases with unknown autoimmune
etiologies (Hirofumi et al., 2002). Drug administration can cause addiction and lead to
organ damage. Its significant effects have been identified at the molecular, cellular,
structural and functional levels. Brain subjected to morphine reveals eleven potential
dependence markers, mainly cytoplasmic and mitochondrial enzymes, e.g. proteins that
belong to GTPase and GST superfamilies, ATPase, asparaginase or proteasome subunit
p27 families (Anna et al., 2006). The molecular mechanisms underlying the
neurotoxicity of methylmercury (MeHg), a ubiquitous environmental contaminant, are
not yet fully understood. Karin et al. describe about the molecular mechanisms
underlying MeHg neurotoxicity and defense responses and provide a large panel of
protein biomarker candidates for aquatic environmental monitoring (Karin et al., 2010).
Cerebral microdialysis has been established as a monitoring tool in neurocritically ill

Identification and Characterzation of Novel Proteins in Diabetic and Diabetic Treated [Cynodon dactylon (L.) Pers] Albino Rats
77
Ch
ap
ter–
4
patients suffering from severe stroke. The technique allows to sample small molecules
in the brain tissue for subsequent biochemical analysis. Martin et al. were analysed the
proteome map in human cerebral microdialysate and the identified proteins might be
useful predictors for disease characteristics in stroke for tissue at risk in the
contralateral hemisphere (Martin et al., 2003). Proteomics finds a wide application in
neuroscience nowadays. It has mainly been used for protein screening in brain tissue in
healthy and diseased states for the detection of drug targets and diagnostic markers. An
understanding of the diabetes-related changes in brain proteome composition in
diabetes and treatment with C. dactylon may provide insights to understand the brain
function associated diabetes and metabolic protein mechanism responsible for this
disease and in order to discover novel preventive and therapeutic drugs.
4.2.3. HEART ANATOMY
The heart is the muscular organ of the circulatory system that constantly pumps
blood throughout the body. The heart weighs between 200–425 grams and is a little
larger than the size of fist. In fact, each day,
the average heart beats 100,000 times,
pumping about 2,000 gallons (7,571 litres)
of blood. The heart is composed of cardiac
muscle tissue that is very strong and able to
contract and relax rhythmically throughout
a person's lifetime (Maton et al., 1993).
Heart is located between your lungs in the
middle of your chest, behind and slightly to
the left of the breastbone (sternum). A
double-layered membrane called the
pericardium surrounds heart like a sac. The
outer layer of the pericardium surrounds the roots of the heart's major blood vessels and
is attached by ligaments of spinal column, diaphragm and other parts of the body. The
mammalian heart has four chambers: right and left atria and right and left ventricles is
presented in figure 4.6. The two atria act as collecting reservoirs for blood returning to
Figure – 4.6 Heart Anatomy.

Identification and Characterzation of Novel Proteins in Diabetic and Diabetic Treated [Cynodon dactylon (L.) Pers] Albino Rats
78
Ch
ap
ter–
4
the heart while the two ventricles act as pumps to eject the blood to the body. As in any
pumping system, the heart comes complete with valves to prevent the back flow of
blood. The essential function of the heart is to pump blood to various parts of the body
i.e. Deoxygenated blood: superior and inferior vena cava-right atrium and ventricle-
pulmonary artery-lungs; oxygenated blood: lungs-pulmonary veins- left atrium and
ventricle-aorta-all part of the body (Kim et al., 2006).
The heart is composed primarily of muscle tissue. A network of nerve fibers
coordinates the contraction and relaxation of the cardiac muscle tissue to obtain an
efficient, wave-like pumping action of the heart. The Sinoatrial Node (SA node) serves
as the natural pacemaker for the heart. Nestled in the upper area of the right atrium, it
sends the electrical impulse that triggers each heartbeat. The impulse that originates
from the SA node strikes the Atrioventricular node (AV node) which is situated in the
lower portion of the right atrium. The electrical network serving the ventricles leaves
the AV node through the Right and Left Bundle Branches. These nerve fibers send
impulses that cause the cardiac muscle tissue to contract (Maton et al., 1993).
4.2.3.1. Insulin and Glucose Regulation of Heart Function
They are studies have informed more recent investigations into cardiovascular
actions of insulin that play an important role in coupling metabolic and cardiovascular
physiology (Kim et al., 2006). Insulin regulates metabolism in the heart by modulating
glucose transport, glycolysis, glycogen synthesis, lipid metabolism, protein synthesis,
growth, contractility and apoptosis in cardiomyocytes (Abel, 2005). Insulin-stimulated
glucose uptake in cardiomyocytes is mediated primarily by the insulin responsive
GLUT4. However, in addition to the basal cardiac glucose uptake mediated by GLUT1,
contraction-mediated GLUT4 translocation to the sarcolemma may contribute
significantly to myocardial glucose uptake (Abel, 2004). As in other insulin-sensitive
tissues, insulin signalling via PI3K/Akt pathways plays a key role in cardiac glucose
uptake. Insulin stimulated activation of Akt also promotes cardiac glycogen
accumulation by simultaneously inhibiting activity of both glycogen synthase kinase 3
and AMP-activated protein kinase (Kovacic et al., 2003). Moreover, in the heart,

Identification and Characterzation of Novel Proteins in Diabetic and Diabetic Treated [Cynodon dactylon (L.) Pers] Albino Rats
79
Ch
ap
ter–
4
insulin-stimulated Akt phosphorylates the transcription factor FOXO-1, which is
known to affect glucose and lipid metabolism (Ouwens et al., 2005). Insulin also acts
as a vasodilation and increased blood flow in an NO-dependent fashion (Vollenweider
et al., 1993). In insulin-resistant conditions, impairment of shared insulin signalling
pathways in metabolic and cardiovascular tissues contributes to reciprocal relationships
between insulin resistance and endothelial dysfunction (Kim et al., 2006).
4.2.3.2. Diabetes and Specific Cardiovascular Disease
Diabetes mellitus is associated with cardiac impairments in humans and in
experimental animals. The complications include coronary heart disease (CHD), stroke
and cardiomyopathy (Garber and Neely, 1983)
4.2.3.2.1. Atherosclerotic CHD
Both type 1 diabetes and type 2 diabetes are independent risk factors for CHD.
Moreover, myocardial ischemia due to coronary atherosclerosis commonly occurs
without symptoms in patients with diabetes. A delayed recognition of various forms of
CHD undoubtedly worsens the prognosis for survival for many diabetic patients
(Wilson, 1998).
4.2.3.2.2. Diabetic Cardiomyopathy
Diabetes and ischemic heart disease seems to be an enhanced myocardial
dysfunction leading to accelerated heart failure (diabetic cardiomyopathy). Thus,
diabetes is unusually prone to congestive heart failure. Several factors probably
underlie diabetic cardiomyopathy: severe coronary atherosclerosis, prolonged
hypertension, chronic hyperglycemia, microvascular disease, glycosylation of
myocardial proteins and autonomic neuropathy (Spector, 1998).

Identification and Characterzation of Novel Proteins in Diabetic and Diabetic Treated [Cynodon dactylon (L.) Pers] Albino Rats
80
Ch
ap
ter–
4
4.2.3.2.3. Stroke
Mortality from stroke is increased almost 3-fold in diabetes are matched to
those without diabetes. The most common site of cerebrovascular disease with diabetes
is occlusion of small paramedial penetrating arteries. Diabetes also increases the
likelihood of severe carotid atherosclerosis. In diabetes, moreover likely cause
irreversible brain damage with carotid emboli that otherwise would produce only
transient ischemic attacks in persons without diabetes (Bell, 1994).
4.2.3.3. Proteomics of Heart Disease
The ultimate goal in the study of any disease is to identify and define possible
causative agents involved in the disease outcome. According to the WHO,
cardiovascular disease resulting in cardiac dysfunction and heart failure is among the
leading causes of morbidity and mortality in developed countries. Although the science
of genomics has formed the basis for our understanding of the cellular and molecular
mechanisms underlying cardiovascular disease, many downstream processes still
remain largely unknown. Further development of proteomic technologies will not only
allow the monitoring of changes in protein expression, but together with genomic data,
promise to be valuable in broadening our knowledge of the pathogenic pathways that
lead to heart failure (Lien et al., 2006). Proteomic investigations also related to
mitochondrial signaling in the myocardium have been used to reveal alterations in
mitochondrial signaling mechanisms in different cardiac phenotypes (Yan et al., 2004).
Proteomic analysis of ischemic/reperfused rabbit hearts (examining whole cell lysates,
cytosolic fractions, and myofilament compartments) elucidated gel shift and protein
abundance changes via 2-DE in multiple proteins, particularly those associated with
stress response (see above) as well as energy metabolism in mitochondria
(White et al., 2005). Diabetic cardiomyopathy has been documented as an underlying
etiology of heart failure (HF) among diabetics. Hamblin et al. were characterized a
specific ‘type 1 diabetic’ pattern of cardiac proteome changes indicative of diabetic
cardiomyopathy and this study may be useful diagnostically to assess the efficacy of
antioxidant therapies as prophylactic treatments against type I diabetes mellitus

Identification and Characterzation of Novel Proteins in Diabetic and Diabetic Treated [Cynodon dactylon (L.) Pers] Albino Rats
81
Ch
ap
ter–
4
complications involving the heart (Hamblin et al., 2007). The development of type 2
diabetes (T2D) is strongly associated with obesity. In humans, T2D increases the risk
for end organ complications. Among these, heart disease has been ranked as the leading
cause of death. Cruz-Topete et al. test the hypothesis that changes in proteins related to
heart function and structure by using proteomic methodology. The results suggest that
changes in the levels of several heart proteins may have implications in the
development of the cardiac phenotype associated to T2D (Cruz-Topete et al., 2011).
The key concept of proteomics opens new search for clinically useful biomarkers of
disease and treatment response. A set of 177 candidate biomarker proteins with
reported associations to cardiovascular disease and stroke are presented as a starting
point for such a ‘directed proteomics’ approach (Anderson, 2005). Recent studies have
demonstrated that the expression as well as the activity of Ca/calmodulin-dependent
protein kinase IIδC (CaMKIIδC) is increased in heart failure. Transgenic overexpression
of CaMKIIδC in mouse hearts results in severe dilated cardiomyopathy (Schott et al.,
2010). Proteomic investigations in the field of cardiovascular disease involve the
characterisation of these modifications and elucidation of novel therapeutic targets and
strategies to prevent the development of heart failure. The broad strategy taken when
carrying out any proteomic study is to analyse differences or changes between
experimental conditions and controls. Proteomic studies can be applied to a range of
biological systems to answer the desired research question, including human studies,
animal models and/or cell culture systems. In this study, we review the status of
proteomic technologies and describe how these are being applied to studies of human
heart disease associated with diabetes mellitus.
4.2.4. LIVER ANATOMY
Liver is one of the vital organs in the body and have monumental role in various
body functions including digestion, synthesis and excretion etc. The liver is the largest
glandular organ of the body. It weighs about 1.3 to 1.7 kg and constitutes about 1.8% to
3.1% of the total body weight. It measures about 8 inches (20 cm) horizontally (across)
and 6.5 inches (17 cm) vertically (down) and is 4.5 inches (12 cm) thick
(Maton et al., 1993). It is reddish brown in colour and is divided into four lobes of

Identification and Characterzation of Novel Proteins in Diabetic and Diabetic Treated [Cynodon dactylon (L.) Pers] Albino Rats
82
Ch
ap
ter–
4
unequal size and shape. The liver lies on
the right side of the abdominal cavity
beneath the diaphragm are shown in figure
4.7. The liver is the only internal human
organ capable of natural regeneration of
lost tissue; as little as 25% of a liver can
regenerate into a whole liver. Blood is
carried to the liver via two large vessels
called the hepatic artery and the portal
vein. The hepatic artery carries oxygen-
rich blood from the aorta (a major blood
vessel in the heart). The portal vein carries
blood containing digested food from the
small intestine (Marieb, 2001). Life is incompatible without the liver as this organ
performs essential metabolic functions. Estimates suggest an excess of > 10,000
biochemical reactions at any given time point and this includes synthesis: carbohydrate,
proteins, blood clotting factors amino acids and cholesterol; storage: fats and
carbohydrates; secretion: bile acids and fat soluble vitamins; elimination: bilirubin,
ammonia and urea and detoxification; drugs, alcohol and environmental toxins
(Ferrannini et al., 1990).
4.2.4.1. Liver Physiology Associated with Glucose Regulation
Liver plays a central role in the control of glucose and lipid metabolism. When
a high-carbohydrate meal is ingested, several metabolic events aimed at decreasing
endogenous glucose production by the liver (glycogenolysis and gluconeogenesis) and
increasing glucose uptake (glycolysis) and storage in the form of glycogen in the liver
are turned on (Katz et al., 1983). In addition, when glucose is delivered into the portal
vein in large quantities and once hepatic glycogen concentrations are restored, glucose
can be converted in the liver into triglycerides through de novo lipogenesis. The
pancreatic hormones such as insulin and glucagon were the main regulator of glycolytic
and lipogenic gene transcription, it is now well established that glucose also regulates
Figure – 4.7 Anatomy of liver.

Identification and Characterzation of Novel Proteins in Diabetic and Diabetic Treated [Cynodon dactylon (L.) Pers] Albino Rats
83
Ch
ap
ter–
4
gene transcription (Girard et al., 1997). In fact, transcriptional activation of glycolytic
and lipogenic genes requires the presence of both insulin and glucose, neither of which
is active alone (Decaux et al., 1991; Prip-Buus et al., 1995). The carbohydrate
responsive element binding protein (ChREBP) emerged as a pivotal transcription factor
implicated in the reciprocal regulation of glycolytic and lipogenic genes in the liver
(Ishii et al., 2004). Liver have specific cell membrane insulin receptors and insulin
facilitates (insulin signalling pathway) the uptake (GLUT2) and utilization of glucose
by these cells. Insulin promotes protein, cholesterol and triglyceride synthesis and
stimulates formation of very-low-density lipoprotein cholesterol. It also inhibits hepatic
gluconeogenesis, stimulates glycolysis and inhibits ketogenesis. The liver is the
primary target organ for glucagon action, where it promotes glycogenolysis,
gluconeogenesis and ketogenesis (Karem and Forsham, 1994). Insulin is metabolized
by insulinase in the liver. About 50% of insulin secreted by the pancreas is removed by
first-pass extraction in the liver (McGilvery and Goldstein, 1979).
4.2.4.2. Liver Disease Occurring as a Consequence of Diabetes Mellitus
In diabetes condition, excessive hepatic glucose output contributes to the fasting
hyperglycemia. Increased gluconeogenesis is the predominant mechanism responsible
for this increased glucose output, while glycogenolysis has not been shown to be
increased in patients with diabetes. Hyperglucagonemia has been shown to augment
increased rates of hepatic glucose output, probably through enhanced gluconeogenesis
(Consoli et al., 1989).
4.2.4.2.1. Glycogen Deposition
Excess glycogen accumulation in the liver is seen in 80% of diabetic patients.
The enhanced gluconeogenesis may account for the net accumulation of glycogen in
diabetes (Ferrannini et al., 1990). The mechanism for nuclear glycogen deposition is
also unclear, with the stored glycogen resembling muscle glycogen more than
hepatocyte cytoplasmic glycogen. Nuclear glycogen deposition was first described by
Ehrlich (Ehrlich, 1983).

Identification and Characterzation of Novel Proteins in Diabetic and Diabetic Treated [Cynodon dactylon (L.) Pers] Albino Rats
84
Ch
ap
ter–
4
4.2.4.2.2. Fatty Liver, Steatohepatitis
Hepatic fat accumulation is a well-recognized complication of diabetes with a
reported frequency of 40–70%. Fat is stored in the form of triglyceride and may be a
manifestation of increased fat transport to the liver, enhanced hepatic fat synthesis, and
decreased oxidation or removal of fat from the liver (Angulo, 2002).
4.2.4.2.3. Cirrhosis
Cirrhosis is a condition in which the liver slowly deteriorates and malfunctions
due to chronic injury. Scar tissue replaces healthy liver tissue, partially blocking the
flow of blood through the liver. There is an increased incidence of cirrhosis in diabetic
patients and conversely, at least 80% of patients with cirrhosis have glucose
intolerance. Diabetes increases the risk of steatohepatitis, which can progress to
cirrhosis (Zimmerman et al., 1950; Hano, 1968).
4.2.4.2.4. Biliary Disease, Cholelithiasis, Cholecystitis
There is a reported increased incidence of cholelithiasis in diabetes mellitus, but
obesity and hyperlipidemia may again be confounding variables. Several articles have
reported a two- to threefold increased incidence of gallstones in diabetic patients,
whereas others have failed to demonstrate a significant association. There is no
indication in the literature that the natural history of gallstones is different in diabetic
and nondiabetic individuals (Feldman and Feldman, 1954).
4.2.4.3. Liver Pathology Associated with Proteomics
The Human Liver Proteome Project (HLPP) is one of the initiatives launched by
the Human Proteome Organization (HUPO) (Cyranoski, 2003). As the first initiative on
human tissues/organs, HLPP aims to i) generate an integrative approach leading to a
comprehensive protein atlas of the liver, ii) expand the liver proteome to its physiome
and pathome to dramatically accelerate the development of diagnostics and therapeutics

Identification and Characterzation of Novel Proteins in Diabetic and Diabetic Treated [Cynodon dactylon (L.) Pers] Albino Rats
85
Ch
ap
ter–
4
toward liver diseases and iii) develop standard operating procedures (SOPs) for other
HUPO initiatives (Fuchu, 2005). Recently, there has been significant progress in the
development of proteomic approaches. Proteomics is defined as qualitative and
quantitative comparison of proteomes under different conditions to further investigate
biological processes. Standard proteomic approaches usually relay on the 2-DE
separation of complex protein mixtures by gel electrophoresis (Gorg et al., 2004). The
comprehensive analysis of the hepatic proteins of HcB19 mice with fatty liver resulted
in identification of several novel differential proteins, including PCCA and 3HAOO,
compared with the parental strain. These individual proteins PCCA and 3HAAO, can
be important in development of fatty liver or in the expression of hyperlipidemia
(Marleen et al., 2004). Iron-mediated organ damage is common in patients with iron
overload diseases, namely, hereditary hemochromatosis. Massive iron deposition in
parenchymal organs, particularly in the liver, causes organ dysfunction, fibrosis,
cirrhosis and hepatocellular carcinoma. The differentially expressed proteins (2D gel)
are involved in iron storage, stress response and protection against oxidative stress,
protein folding, energy metabolism, gene expression, cell cycle regulation and other
processes (Jiri et al., 2006). The replacement of disease hepatocytes and the stimulation
of endogenous or exogenous regeneration by human mesenchymal stem cells (MSCs)
are promising candidates for liver-directed cell therapy. MSCs treated with the liver
differentiation protocol expressed significantly more albumin, CK19 and CK20 protein
were analyzed with two-dimensional (2D) gel and MALDI (Kawin et al., 2010).
Hepatitis delta virus (HDV) infects human hepatocytes already infected with the
hepatitis B virus increasing about tenfold the risk of cirrhosis and fulminant hepatitis.
In this study, 23 differentially expressed proteins of which 15 were down-regulated and
8 up-regulated proteins were identified in Huh7-D12 cells. These proteins were found
to be involved in different cellular pathways (Sergio et al., 2009). A comparative study
of proteome maps from control and diabetic rat liver provide a better understanding of
diabetes and its complications, which in turn can benefit the diagnosis and therapy of
this disease.
Identification and Characterzation of Novel Proteins in Diabetic and Diabetic Treated [Cynodon dactylon (L.) Pers] Albino Rats
86
Ch
ap
ter–
4
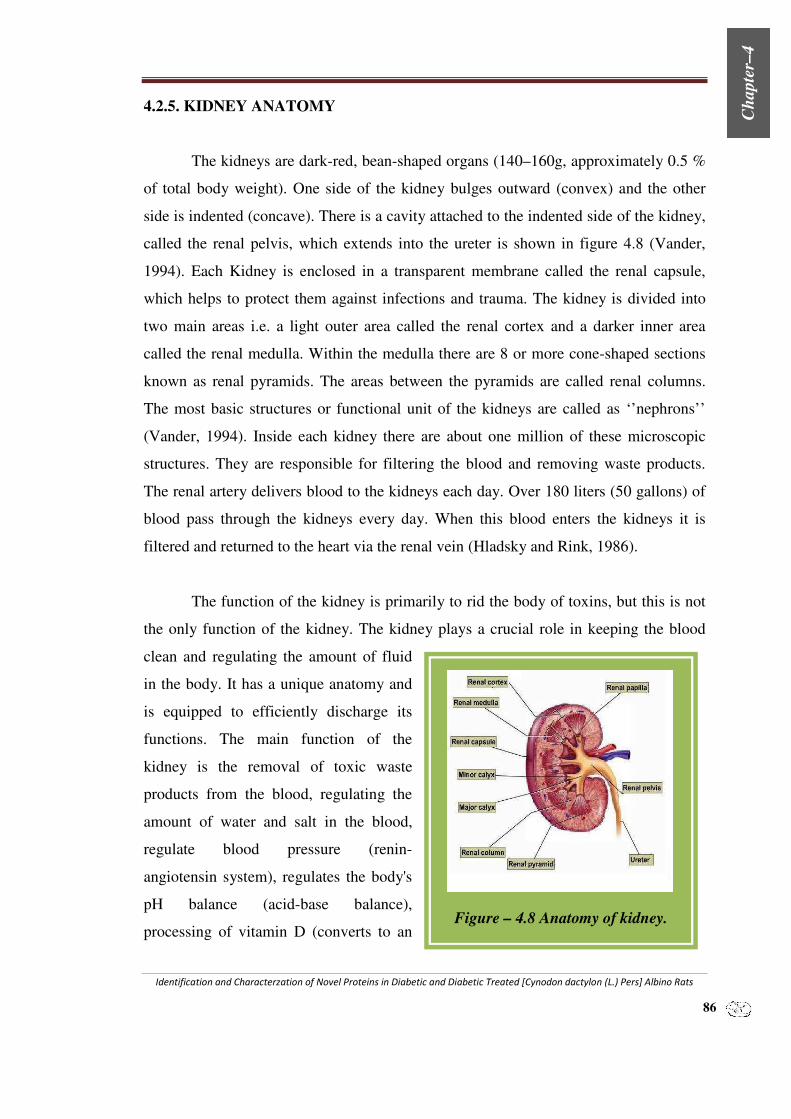
4.2.5. KIDNEY ANATOMY
The kidneys are dark-red, bean-shaped organs (140–160g, approximately 0.5 %
of total body weight). One side of the kidney bulges outward (convex) and the other
side is indented (concave). There is a cavity attached to the indented side of the kidney,
called the renal pelvis, which extends into the ureter is shown in figure 4.8 (Vander,
1994). Each Kidney is enclosed in a transparent membrane called the renal capsule,
which helps to protect them against infections and trauma. The kidney is divided into
two main areas i.e. a light outer area called the renal cortex and a darker inner area
called the renal medulla. Within the medulla there are 8 or more cone-shaped sections
known as renal pyramids. The areas between the pyramids are called renal columns.
The most basic structures or functional unit of the kidneys are called as ‘’nephrons’’
(Vander, 1994). Inside each kidney there are about one million of these microscopic
structures. They are responsible for filtering the blood and removing waste products.
The renal artery delivers blood to the kidneys each day. Over 180 liters (50 gallons) of
blood pass through the kidneys every day. When this blood enters the kidneys it is
filtered and returned to the heart via the renal vein (Hladsky and Rink, 1986).
The function of the kidney is primarily to rid the body of toxins, but this is not
the only function of the kidney. The kidney plays a crucial role in keeping the blood
clean and regulating the amount of fluid
in the body. It has a unique anatomy and
is equipped to efficiently discharge its
functions. The main function of the
kidney is the removal of toxic waste
products from the blood, regulating the
amount of water and salt in the blood,
regulate blood pressure (renin-
angiotensin system), regulates the body's
pH balance (acid-base balance),
processing of vitamin D (converts to an
Figure – 4.8 Anatomy of kidney.

Identification and Characterzation of Novel Proteins in Diabetic and Diabetic Treated [Cynodon dactylon (L.) Pers] Albino Rats
87
Ch
ap
ter–
4
active form) and several hormones are also produced in the kidney (erythropoietin)
(Guyton and Hall, 1996).
4.2.5.1. Renal Physiology Associated with Glucose Regulation
The kidneys are responsible for keeping the homeostatically constant, which is
achieved by regulating the volume and concentration of body fluids by selectively
filtering and reabsorbing materials from the blood. Renal system is one of the major
organs responsible for glucose homeostasis in two ways: 1) gluconeogenesis and 2)
glomerular filtration and reabsorption of glucose in the proximal convoluted tubules
(Wright, 2001).
The glomeruli of a normal healthy adult filter ~ 180 g of glucose daily.
Adequate renal tubular function with the ability of potent urinary concentration and
~99.9% glucose reabsorption depends on the functional expression of several tubular
transporters such as SGLT1, SGLT2, SGLT3, GLUT1, GLUT2 and Na+-K+-ATPase
(Lang et al., 2005). Glucose is freely filtered by the glomerulus, and reabsorption
occurs predominantly on the brushborder membrane of the convoluted segment of the
proximal tubule by specific transporter proteins. More distal segments reabsorb almost
all of the remainder, resulting in a fractional glucose excretion of < 0.1% (Tabatabai et
al., 2003). The sodium-dependent co-transporters (SGLTs), consisting of three
subtypes, couple the uphill reabsorption of glucose from the renal tubule lumen with
the downhill transport of sodium (Hediger et al., 1995). In the early part of the
proximal tubule (S1 segment), a high-capacity/low-affinity transporter called SGLT2
mediates apical glucose uptake with a Na+ -glucose stoichiometry of 1:1. In the later
part of the proximal tubule (S3 segment), a high-affinity/low-capacity cotransporter
called SGLT1 is responsible for apical glucose uptake. Because this transporter has a
Na+-glucose stoichiometry of 2:1, it can generate a far larger glucose gradient across
the apical membrane (Tabatabai et al., 2003). In addition to SGLT1 and SGLT2,
another closely related low-affinity sodium-glucose transporter, SGLT3, originally
named SAAT1, has been identified in the proximal tubule, coupling two Na+ to one
glucose molecule (Tabatabai et al., 2001). Once inside the cell, glucose exits across the

Identification and Characterzation of Novel Proteins in Diabetic and Diabetic Treated [Cynodon dactylon (L.) Pers] Albino Rats
88
Ch
ap
ter–
4
basolateral membrane via the insulin dependent GLUT (GLUT2 in the early and
GLUT1 in the late proximal tubule) transporters, which are Na+ independent and move
glucose by facilitated diffusion. The electrochemical potential gradient for powering
Na+-glucose symporter is restored when transported sodium is returned to the blood
stream via the basolateral Na+-K+-ATPase along the whole nephron
(Tabatabai et al., 2001). Under optimal conditions, when the tubular glucose load is
~120 mg/min or less, no glucose is lost in the urine. However, when the glucose load
exceeds ~220 mg/min (the so-called “glucose threshold”), glucose begins to appear in
the urine. Insulin, aldosterone, anti-diuretic hormone, renin-angiotensin, parathyroid
hormone, Akt2/PKBβ plays a role in the regulation of renal reabsorption and renal
glucose transport (Daniela et al., 2010; Eugenio et al., 1999).
The production and release of glucose into the systemic circulation can occur by
gluconeogenesis or glycogenolysis. Currently, it is believed that gluconeogenesis is
responsible for ~55% of glucose released during the non-fed period. The liver and the
kidney are the only two organs in the body that possess the glucoenogenic enzyme and
glucose-6-phosphatase enzyme activity sufficient to drive gluconeogenesis. The kidney
is important in this regard because renal glucose production accounts for ~20% of all
overall endogenous glucose release and is responsible for ~40% of glucose released
secondary to gluconeogenesis (Gerich et al., 2001).
Table 4.1 – Stage of kidney diseases

Identification and Characterzation of Novel Proteins in Diabetic and Diabetic Treated [Cynodon dactylon (L.) Pers] Albino Rats
89
Ch
ap
ter–
4
4.2.5.2. Renal-Diabetes is related to Several Pathologies
Diabetes mellitus is a chronic metabolic disorder relative to insulin deficit that
induces metabolic and degenerative complications in various organs, including nerves,
heart and kidneys (King and Brownlee, 1996). Kidney disease is characterized by
damage to the cells of the kidneys. With diabetes, the small blood vessels in the body
are injured. When the blood vessels in the kidneys are injured and kidneys cannot clean
blood properly. Usually, the blood retains protein and excretes out only waste
molecules. The earliest sign of diabetic kidney disease is an increased excretion of
albumin in the urine (King and Brownlee, 1996).
There are five stages of diabetic kidney disease with the last stage being kidney
failure are tabulated in table 4.1. On average it takes a person with diabetes over 20
years to progress to the end stage. Both types of diabetes, type 1 and type 2, can lead to
kidney disease. Type 1 is more likely to lead to end-stage kidney failure. About 40
percent of people with type 1 diabetes develop severe kidney disease and end-stage
kidney failure by the age of 50. The key to preventing kidney disease in people with
both types of diabetes is not smoking, getting regular blood pressure, urine protein tests
and preventing high blood sugar.
Diabetic nephropathy or kidney damage due to diabetes, results from changes in
blood flow in the small vessels of the glomerular capsule, the functional unit of the
kidney (Eknoyan et al., 2003). Diabetic nephropathy is characterized by the abnormal
deposition of matrix material in the glomerular mesangium, leading to a thickened,
sclerotic glomerular lining. Studies have shown that glucose reacts with proteins in the
blood, chemically forming permanent cross-linked protein complexes. The excessive
accumulation of these complexes or advanced glycosylated end products (AGEs) is
believed to directly accelerate the vascular complications of diabetes. Years of
continued hyperglycemia and dyslipidemia, often in the presence of hypertension,
promote the deposition of an accumulating layer of AGEs (Makita et al., 1991).

Identification and Characterzation of Novel Proteins in Diabetic and Diabetic Treated [Cynodon dactylon (L.) Pers] Albino Rats
90
Ch
ap
ter–
4
The link between diabetes and cancer is not well understood but there are
indications that diabetes patients may be susceptible to having solid tumors. Laboratory
studies failed to reveal any endocrinopathy responsible for the diabetic state. Thus it
appears that hyperglycemia and diabetes mellitus can now be included with the other
paraneoplastic endocrinopathies associated with renal cell carcinoma
(Lindblad et al., 1999).
4.2.5.3. Renal Pathology Associated with Proteomics
In the establishment of the Human Urine and Kidney Proteome Project
(HKUPP: http://hkupp.kir.jp/) within HUPO, an effort to further enhance networking
activities in this field has been initiated in Europe. Recently funded by COST
(European COoperation in the field of Scientific and Technical Research:
www.cost.esf.org), EuroKUP (European Kidney and Urine Proteomics) fosters the
generation of a strong and growing multidisciplinary network of scientists from 19
European and 4 non-European countries, focusing on kidney and urine proteomics
(Teresa, 2008). Understanding, how diabetes globally affects the renal proteome can
provide crucial insights into the renal pathophysiology of diabetes available with
proteomic approaches. This is highly relevant since the involvement of proteins and the
molecular functions they control is the common denominator in every biochemical
pathway that has been invoked as a pathophysiological mechanism for diabetes-induced
tissue injury as well as for the several unifying hypotheses that have tried to explain
how these diverse biochemical pathways may be linked (Nishikawa et al., 2000).
Proteomic methodologies have increasingly been applied to the kidney although the
majority of these investigations has focused on the identification and quantification of
proteins found in urine (Pieper et al., 2004), primarily to identify potential biomarkers
of renal disease (Hewitt et al., 2004). Few of these urinary proteome studies have
addressed diabetic nephropathy (Sharma et al., 2005). Progress has been made in
establishing a renal proteome using 1-DE and 2-DE and PMF with MALDI-TOF or
with LC-MS/MS, including proteomes of renal cortex, glomerular cells and tubular
epithelial cells (Ronald et al., 2007). However, quantification of diabetes-induced
Identification and Characterzation of Novel Proteins in Diabetic and Diabetic Treated [Cynodon dactylon (L.) Pers] Albino Rats
91
Ch
ap
ter–
4
changes in renal protein expression patterns has rarely been attempted (Thongboonkerd
et al., 2004).
Proteomic analysis is now available for large-scale studies of proteins in tissues
and body fluids and analysis of the urinary proteome may represent an important step
forward in the non-invasive diagnosis of kidney diseases. Diabetic renal damage is
mainly reflected by a change in urinary polypeptide excretion at a very early stage
(albumin excretion) (Harald et al., 2004). Proteomic analysis of renal calculi indicates
an important role for inflammatory processes in calcium stone formation. The
proteomic results support the hypothesis that stone formation induces a cellular
inflammatory response and the protein components of this response contribute to the
abundant stone matrix proteome (Michael et al., 2008). While renal proteomics for
biomarkers identification seems promising, drug discovery not only in kidney diseases
but also in other organ disorders and systemic diseases. In the present study, we used 2-
DE and MALDI-TOF-MS to quantitatively profile the expression of proteins in the
kidneys of type I diabetic rats.
4.2.6. SPLEEN ANATOMY
The spleen is located in the upper left abdominal cavity, just beneath the
diaphragm, and posterior to the stomach is shown in figure 4.9 (Measuring about 12 cm
in length). It is similar to a lymph node in shape and structure but it is much larger. The
spleen is the largest lymphatic organ in the body (Franciscis, 1962). Surrounded by a
connective tissue capsule, which extends inward to divide the organ into lobules, the
spleen consists of two types of tissue called white pulp and red pulp. The white pulp is
lymphatic tissue consisting mainly of lymphocytes around arteries. The red pulp
consists of venous sinuses filled with blood and cords of lymphatic cells, such as
lymphocytes and macrophages. Blood enters the spleen through the splenic artery,
moves through the sinuses where it is filtered, then leaves through the splenic vein
(Barnhart and Lusher, 1979).
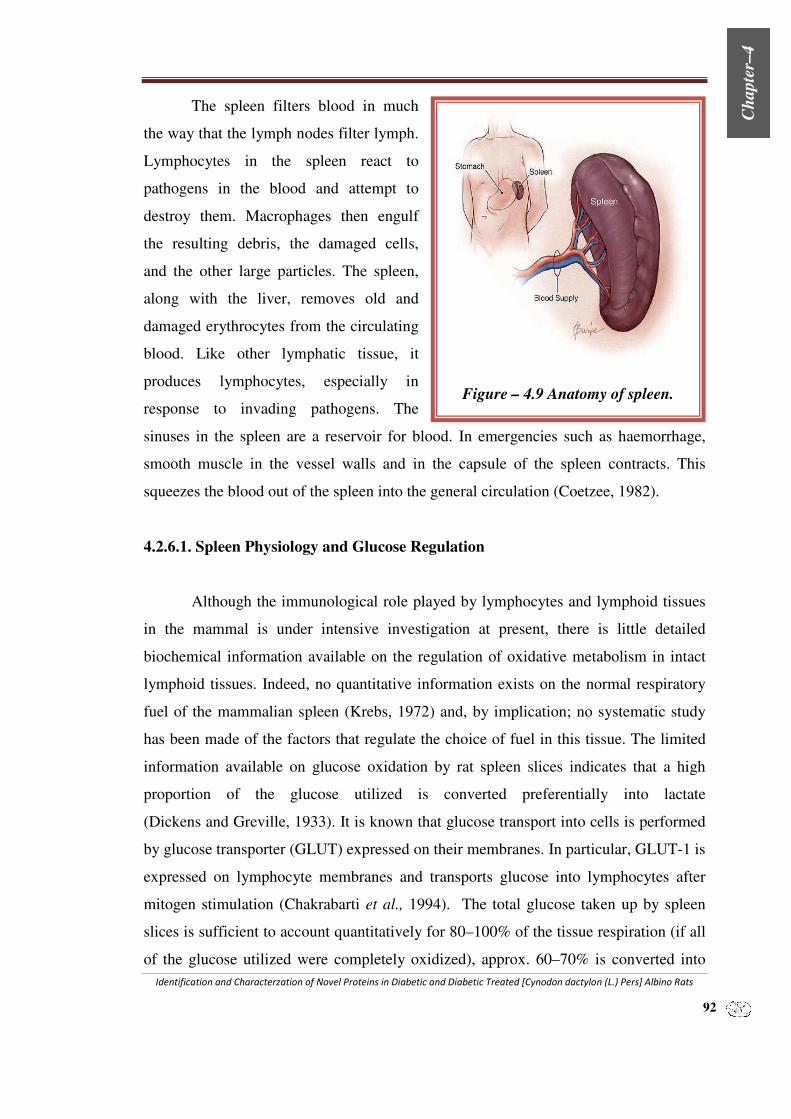
Identification and Characterzation of Novel Proteins in Diabetic and Diabetic Treated [Cynodon dactylon (L.) Pers] Albino Rats
92
Ch
ap
ter–
4
The spleen filters blood in much
the way that the lymph nodes filter lymph.
Lymphocytes in the spleen react to
pathogens in the blood and attempt to
destroy them. Macrophages then engulf
the resulting debris, the damaged cells,
and the other large particles. The spleen,
along with the liver, removes old and
damaged erythrocytes from the circulating
blood. Like other lymphatic tissue, it
produces lymphocytes, especially in
response to invading pathogens. The
sinuses in the spleen are a reservoir for blood. In emergencies such as haemorrhage,
smooth muscle in the vessel walls and in the capsule of the spleen contracts. This
squeezes the blood out of the spleen into the general circulation (Coetzee, 1982).
4.2.6.1. Spleen Physiology and Glucose Regulation
Although the immunological role played by lymphocytes and lymphoid tissues
in the mammal is under intensive investigation at present, there is little detailed
biochemical information available on the regulation of oxidative metabolism in intact
lymphoid tissues. Indeed, no quantitative information exists on the normal respiratory
fuel of the mammalian spleen (Krebs, 1972) and, by implication; no systematic study
has been made of the factors that regulate the choice of fuel in this tissue. The limited
information available on glucose oxidation by rat spleen slices indicates that a high
proportion of the glucose utilized is converted preferentially into lactate
(Dickens and Greville, 1933). It is known that glucose transport into cells is performed
by glucose transporter (GLUT) expressed on their membranes. In particular, GLUT-1 is
expressed on lymphocyte membranes and transports glucose into lymphocytes after
mitogen stimulation (Chakrabarti et al., 1994). The total glucose taken up by spleen
slices is sufficient to account quantitatively for 80–100% of the tissue respiration (if all
of the glucose utilized were completely oxidized), approx. 60–70% is converted into
Figure – 4.9 Anatomy of spleen.

Identification and Characterzation of Novel Proteins in Diabetic and Diabetic Treated [Cynodon dactylon (L.) Pers] Albino Rats
93
Ch
ap
ter–
4
lactate and glucose oxidation accounts finally for only 25–30% of the O2 consumption
(Suter and Weidemann, 1975).
4.2.6.2. Spleen Physiology Associated with Diabetes Mellitus
Metabolic Syndrome (MS) should be considered as a cluster of mostly
modifiable risk factors triggering a pro-inflammatory state that provide a higher risk of
the development of diabetes. The characteristic of the MS is that its clinical conditions
share a metabolic imbalance, induce an excessive release of inflammatory mediators
and have a marked stimulation of stress hormones and this, in turn, has profound
effects on energy and substrate metabolism (Tappy and Chioléro, 2007). Meydani et al.
reported that decreased cellular immunity in elderly people was associated with
increased production of prostaglandin E2 (PGE2), the decrease of cellular immunity in
obese elderly subjects may be induced by increased production of PGE2. Glucose is the
main energy source for lymphocytes at the stage of proliferation. Decreased
proliferation of peripheral blood lymphocytes in obese subjects may be related to
impairment of glucose uptake by lymphocytes (Meydani et al., 1990). Splenic
infarction is a clinical entity seldom encountered. The most frequent causes of splenic
infarction include thromboembolic phenomena, hematologic malignant neoplasms and
vasculitides. The patient who sustained splenic infarction secondary to diabetes-
induced and small-vessel atherosclerotic disease (Toth et al., 2000).
4.2.6.3. Spleen Physiology and Para-physiology Associated with Proteomics
The use of proteomic technologies for global characterization of proteins
expressed in cells, tissues and biological fluids is a key component in furthering our
ability to understand biological processes in normal and diseased states. In many
proteomic studies, cells or tissues are characterized by profiling and comparing proteins
expressed in treated and untreated cells, diseased versus normal tissues or various cell
populations. To find the alternative for antibiotic this study was carried out to
investigate the differentially expressed proteome between Salmonella gallinarum
infected and uninfected control in the spleen lymphocytes research reveals significant

Identification and Characterzation of Novel Proteins in Diabetic and Diabetic Treated [Cynodon dactylon (L.) Pers] Albino Rats
94
Ch
ap
ter–
4
differential expression of four proteins were found which appears to be a candidate
molecule for fowl typhoid (Hyun-Kyung et al., 2009). Resistance to Marek’s disease
(MD) in chickens is genetically regulated and there are lines of chickens with
differential susceptibility or resistance to this disease. The differentially expressed
proteins identified in the present study included antioxidants, molecular chaperones,
proteins involved in the formation of cytoskeleton, protein degradation and antigen
presentation, signal transduction, protein translation and elongation, RNA processing
and cell proliferation. These findings shed light on some of the underlying processes of
genetic resistance or susceptibility to MD (Thanthrige-Don et al., 2010). Iridovirus
infections remain a severe problem in aquaculture industries worldwide. Infectious
spleen and kidney necrosis virus (ISKNV), the type species of the genus
Megalocytivirus in the family Iridoviridae, has caused significant economic losses
among freshwater fish in different Asian countries. These findings provide insight into
the interactions between iridoviruses (especially ISKNV) and host, as well as the
mechanism and pathogenesis of ISKNV infections (Xiong et al., 2011). The adult
spleen harbors a population of naturally occurring multipotent stem cells of non-
lymphoid lineage (CD45). In animal models, these splenic stem cells can directly or
indirectly contribute to regeneration of bone, inner ear, cranial nerves, islets, hearts and
salivary glands. The proteomic and functional analyses reveals that naturally occurring
CD45 stem cells of the spleen are the first-ever candidates for naturally occurring
population of embryonic and iPS cells with low oncogenic risk. Given their presence in
normal humans and mice, splenic stem cells are poised for translational research
(Dieguez-Acuna et al., 2010). The ultimate goal in the study of any disease is to
identify and define possible causative agents involved in the disease outcome.
4.2.7. MUSCLE ANATOMY
Muscle is a contractile tissue of animals and is derived from the mesodermal
layer of embryonic germ cells. Muscle cells contain contractile filaments that move
past each other and change the size of the cell. They are classified as skeletal, cardiac or
smooth muscles (Feng, 1932). Skeletal muscle facilitates movement by applying forces
to bones and joints through its contraction. They are generally under voluntary control.

Identification and Characterzation of Novel Proteins in Diabetic and Diabetic Treated [Cynodon dactylon (L.) Pers] Albino Rats
95
Ch
ap
ter–
4
Cardiac muscle is an involuntary striated
muscle found exclusively in the heart. Cardiac
muscle has unique properties; it stimulates its
own contraction without the required electrical
impulse from the central nervous system
(CNS) via special pacemaker cells in the
sinoatrial node. Smooth muscle is an
involuntary non-striated muscle found in the
walls of hollow organs such as the bladder and
in blood vessels. Smooth muscle can be
directly stimulated by the CNS or can react to
hormones secreted locally such as vasodilators
and vasoconstrictors (Ford et al., 1977).
Skeletal muscle fibers are made up of many myofibrils surrounded by
sarcoplasmic reticulum is shown in figure 4.10. The sarcolemma is on the outside of
the muscle fiber and contains many nuclei. The dark striations of skeletal muscle are
made up of a lattice of thick and thin filaments, which are formed into a functional unit
of contraction known as the sarcomere. Sarcomeres are the basic unit of muscle, made
up of actin and myosin (Gillis et al., 1988). After the signal to contract comes from the
CNS, an action potential spreads over the muscle fiber. Excitation-Contraction
coupling is the process by which an action potential causes calcium (Ca2+) release and
cross bridge cycling. An incoming action potential, transmitted through the
neuromuscular junction, causes the depolarization of the skeletal muscle cell. When a
muscle is stimulated to contract, the initial ATP (stored as phosphocreatine) is the
initial energy source for contraction and when the phosphocreatine source is depleted,
muscle converts glucose into pyruvic acid and ATP (Ford et al., 1977).
4.2.7.1. Muscle Physiology Associated with Glucose Regulation
Skeletal muscle is the primary tissue responsible for insulin-dependent glucose
uptake in vivo; therefore, glucose uptake by this tissue plays an important role in
Figure – 4.10 Muscle Anatomy.

Identification and Characterzation of Novel Proteins in Diabetic and Diabetic Treated [Cynodon dactylon (L.) Pers] Albino Rats
96
Ch
ap
ter–
4
determining glycemia. Glucose uptake in muscle occurs by a system of facilitated
diffusion involving at least two distinct glucose transporters such as GLUT1 and
GLUT4 (Klip and Paquet, 1990). Among the insulin-dependent tissues, skeletal muscle
is rightly considered to be most important site of insulin action. It is in muscle where
the bulk of glucose and amino acids is disposed and where the majority of free fatty
acids (FFA) are oxidized. All this occur under the influence of complex regulatory
mechanisms for the most part orchestrated by insulin (Capaldo and Sacca, 1995). Upon
stimulation of insulin in skeletal muscle, GLUT4 translocates to the sarcolemma and
transfer the glucose. The glucose transporters GLUT1 or GLUT4 in skeletal muscle
support the notion that increasing glucose transport is sufficient to increase glycogen
synthesis in spite of the normal activation of glycogen synthase (Hansen et al., 1995).
Glycogen content is regulated by the balance between the activities of glycogen
synthase and glycogen phosphorylase (Stalmans et al., 1987). Glycogen synthase
catalyzes the rate-limiting step for glycogen synthesis, while glycogen phosphorylase
regulates glycogen breakdown in skeletal muscle. Insulin causes the dephosphorylation
of both glycogen synthase and phosphorylase in skeletal muscle, resulting in the
activation of glycogen synthase and the inactivation of glycogen phosphorylase,
thereby increasing glycogen accumulation (Nielsen and Richter, 2003).
4.2.7.2. Muscle Physiology Associated with Diabetes Mellitus
Diabetes mellitus has been clearly shown to be associated with several
functional alterations in skeletal muscle function (Disanto et al., 2000). Recently, a
subtype has been reported, with the phenotype of diabetes mellitus associated with a
mitochondrial encephalomyopathies (Suzuki et al., 1997). Accelerated muscle
proteolysis is the primary cause of muscle wasting in many catabolic diseases such as
diabetes mellitus, and also some other condition like renal and liver failure, HIV
infection and cancer. In individuals with catabolic diseases, as is the case with fasting
states (anorexia and starvation), protein breakdown increases while protein synthesis
declines, resulting in negative muscle protein balance. The pathway responsible for
accelerated proteolysis in catabolic conditions is the ubiquitin-proteosome-dependent
system (Castaneda, 2002). Type 1 diabetes mellitus is mainly linked to skeletal muscle

Identification and Characterzation of Novel Proteins in Diabetic and Diabetic Treated [Cynodon dactylon (L.) Pers] Albino Rats
97
Ch
ap
ter–
4
atrophy is associated with an increased incidence in morbidity and mortality. Although
the precise mechanism of diabetes-induced skeletal muscle atrophy remains to be
established, several NF-kB-dependent pro-inflammatory genes have been identified as
potential therapeutic targets (Andrew et al., 2010). Insulin resistance constitutes a
common and broadly prevalent metabolic disorder, which seems to govern the
pathophysiology of diabetes mellitus, metabolic syndrome and obesity. Skeletal muscle
plays a crucial role in maintaining systemic glucose metabolism, accounting for 85% of
whole body insulin stimulated glucose uptake. Most of the available data have derived
from studies in type 2 diabetes mellitus, where skeletal muscle has emerged as an
important insulin-resistant peripheral tissue, via molecular mechanisms that are
currently being extensively investigated (Peppa et al., 2010).
4.2.7.3. Muscle Patho-Physiology Associated with Proteomics
Disorders affecting muscle function mainly comprise a group of rare diseases
with heterogeneous phenotypes, the so called neuromuscular hereditary disorders
(NMDs), studied intensively, both in terms of genetic definition and pathophysiology.
Other diseases affecting muscle function are the consequence of disorders in which
muscle is not the primary target, such as inflammation and diabetes
(Doran et al., 2006). Physiological and biochemical responses of skeletal muscle fibres
to enhanced neuromuscular activity under conditions of maximum activation can be
studied experimentally by chronic low-frequency stimulation of fast muscles.
Stimulation-induced changes in the expression pattern of the rabbit fast skeletal muscle
proteome ravel sixteen muscle proteins exhibited a marked change in their expression
(Donoghue et al., 2005). Contractile weakness and loss of muscle mass are critical
features of the aging process in mammalians. Age-related fibre wasting has a profound
effect on muscle metabolism, fibre type distribution and the overall physiological
integrity of the neuromuscular system. This study shows, majority of altered proteins
were found to be involved in mitochondrial metabolism, glycolysis, metabolic
transportation, regulatory processes, the cellular stress response, detoxification
mechanisms and muscle contraction (Donoghue et al., 2010). Obesity-related diseases
such as the metabolic syndrome and type II diabetes originate, in part, from the

Identification and Characterzation of Novel Proteins in Diabetic and Diabetic Treated [Cynodon dactylon (L.) Pers] Albino Rats
98
Ch
ap
ter–
4
progressive metabolic deterioration of skeletal muscle. A preliminary proteomic survey
of rectus abdominus muscle detected a statistically significant increase in adenylate
kinase, glyceraldehyde-3-phosphate dehydrogenase and aldolase-A in
obese/overweight and morbidly obese women relative to lean control subjects. In
summary, proteome analysis of muscle has helped us better describe the molecular
etiology of obesity-related disease (Hittel et al., 2005). Insulin resistance in skeletal
muscle is a hallmark feature of type II diabetes. An increasing number of enzymes and
metabolic pathways have been implicated in the development of insulin resistance.
However, the primary cellular cause of insulin resistance remains uncertain. Proteome
analysis data suggest a role for phosphorylation of ATP synthase β-subunit in the
regulation of ATP synthesis and that alteration in the regulation of ATP synthesis and
cellular stress proteins may contribute to the pathogenesis of type II diabetes
(Hojlund et al., 2003). Mitochondrial dysfunction in muscle has been implicated to play
a causative role or being an indirect consequence of insulin resistance in type-2
diabetes. The altered protein expression levels of these key metabolic enzymes (NADH
dehydrogenase, cytochrome b-c1 complex and isocitrate dehydrogenase) might trigger
a diabetes-dependent mitochondrial oxidative phosphorylation levels. The proteomic
werefindings presented here support the idea that mitochondrial abnormalities were
involved in the molecular pathogenesis of type-2 diabetes and may be crucial for the
development of insulin resistance (Mullen et al., 2011). Skeletal muscle is one of the
largest tissues in the body. Changes in protein abundance in this tissue are central to a
large number of metabolic and other disorders such as diabetes mellitus. Proteome
analyses are important approaches for gaining insight into the molecular and
biochemical basis for normal and patho-physiological conditions.
4.2.8. ADIPOSE TISSUE
Adipose tissue is a specialized type of connective tissue (adipocytes), the tissue
that binds various structures together and also provides cushioning and support.
Adipose tissues consist almost entirely of fat; even the cell nucleus is pushed over to
the edge of the cell. This appearance is consistent with the function of adipose tissue as
the major storage site for fat. The fat is usually in the form of triglycerides. There are

Identification and Characterzation of Novel Proteins in Diabetic and Diabetic Treated [Cynodon dactylon (L.) Pers] Albino Rats
99
Ch
ap
ter–
4
two different types of adipose tissue, white and brown. White adipose tissue (WAT) is
the fat storage tissue and brown adipose tissue (BAT) produces heat. BAT is commonly
called ‘baby fat’ as it is present in babies but converts to WAT in adulthood (Markman,
1989). Normal body content of adipose tissue is 15–20% of body weight in males and
20–25% in females. Adipose tissue stores lipid in the form of triglycerides and
cholesterol esters within the lipid droplets that represent specialized organelles inside
the adipocyte. Since the lipid droplet is such a large component of the adipocyte (>95%
of the mass of the adipocyte), changes in the amount of lipid stored within the
adipocyte affect fat cell size (ranging from 25 to 250 µm) (Frayn et al., 2003).
Adipocytes are having additional function also i.e. adipocytes are highly active
endocrine cells that play a central role in overall energy homeostasis and are important
contributors to some aspects of the immune system. They do so not only by influencing
systemic lipid homeostasis but also through the production and release of a host of
adipocyte-specific and adipocyte-enriched hormonal factors, cytokines and
extracellular matrix components (commonly referred to as “adipokines”)
(Mahalia et al., 2007).
4.2.8.1. Adipose Tissue Physiology Associated with Glucose Regulation
Carbohydrate and protein consumed in the diet can be converted to fat. Energy
ingested as carbohydrate can be stored as glycogen in the liver and muscle.
Carbohydrate can also be converted to triglycerides primarily in the liver and
transferred to adipose tissue for storage. Fatty acids, in the form of triglycerides or free
fatty acids bound to albumin, are ingested in the diet or synthesized by the liver
(described above). Very little synthesis of free fatty acids occurs in the adipocytes
(Polson and Thompson, 2003). Insulin is stimulatory to synthesis of glycogen in the
liver. However, as glycogen accumulates to high levels (roughly 5% of liver mass),
further synthesis is strongly suppressed. When the liver is saturated with glycogen, any
additional glucose taken up by hepatocytes is shunted into pathways leading to
synthesis of fatty acids, which are exported from the liver as lipoproteins. The
lipoproteins are ripped apart in the circulation, providing free fatty acids for use in

Identification and Characterzation of Novel Proteins in Diabetic and Diabetic Treated [Cynodon dactylon (L.) Pers] Albino Rats
100
Ch
ap
ter–
4
other tissues, including adipocytes, which use them to synthesize triglyceride (White,
1997).
Whole-body fat mass is determined by the relative rates of lipolysis and
lipogenesis. In terms of energy metabolism at the whole-body level, control of
adipocyte lipolysis is particularly important, since adipose tissue is a major source of
energy to other peripheral tissues (Philip et al., 2002). Insulin increases glucose uptake
by increasing the number of plasma membrane glucose transporters (GLUT). They are
two GLUT species are present in adipocytes: the erythroid type (GLUT-1) an
ubiquitous protein which is predominantly expressed in erythrocytes and brain and the
adipose cell/muscle type (GLUT-4), which is expressed exclusively in tissues that
exhibit insulin-dependent glucose transport: fat tissues and muscles
(Charron et al., 1989). Insulin facilitates entry of glucose into adipocytes and within
those cells, glucose can be used to synthesize glycerol. This glycerol, along with the
fatty acids delivered from the liver, is used to synthesize triglyceride within the
adipocyte. By these mechanisms, insulin is involved in further accumulation of
triglyceride in fat cells. Adipose tissue secretes several molecules that may participate
in metabolic cross-talk to other insulin-sensitive tissues. Therefore, adipose tissue is a
key endocrine organ that regulates insulin sensitivity in other peripheral insulin target
tissues (Tohru et al., 2009). In addition to its role in energy homeostasis, leptin can
regulate peripheral glucose and insulin homeostasis via the central nervous system
(Pelleymounter et al., 1995). The enzyme 11b-hydroxysteroid dehydrogenase type-1
(11b-HSD-1) catalyzes the interconversion of cortisone to active cortisol.
Overexpression of 11b-HSD-1, specifically in adipose tissue, leads to visceral obesity
and insulin resistance. Sterol regulatory element binding protein 1-c (SREBP-1C) is a
transcription factor that regulates the expression of numerous genes involved in glucose
and lipid metabolism (Hainault et al., 1991).
4.2.8.2. Pathology of Adipose Tissue
From the physiological/pathological point of view, adipose tissue growth per
second is not harmful to whole body homeostasis. Efficient storage of triacylglycerols

Identification and Characterzation of Novel Proteins in Diabetic and Diabetic Treated [Cynodon dactylon (L.) Pers] Albino Rats
101
Ch
ap
ter–
4
in times of nutritional surplus has been selected for in evolution and is still an
advantage for physically active individuals. Grossly elevated fat stores of the
hypertrophic type have, however, been associated with the development of
dyslipidemia, insulin resistance and hypertension (Imbeault et al., 1999).
4.2.8.2.1. Dyslipidemia
Dyslipidemia showed that subcutaneous abdominal fat cell weight was the best
independent variable predicting plasma triacylglycerols and low-density lipoprotein-
apolipoprotein B levels in humans. They concluded that, for a given visceral white
adipose tissue deposition, the presence of hypertrophic subcutaneous abdominal
adipocytes appears to be associated with further deterioration of the metabolic risk
profile (Imbeault et al., 1999).
4.2.8.2.2. Insulin Resistance
Insulin resistance to the antilipolytic actions of insulin, a characteristic of
hypertrophic adipocytes, distinguishes abdominally obese hypertensives from
normotensive obese and normal weight subjects, a relationship that is independent of
visceral adipose tissue mass. As chronic hyperinsulinemia inhibits both insulin
secretion and action, and hyperglycemia can impair both the insulin secretoryresponse
to glucose as well as cellular insulin sensitivity (Hennes et al., 1996).
4.2.8.2.3. Hypertension
The relationship between adipose tissue expansion and blood pressure is most
complex. Weight gain per second always leads to increased cardiac output and blood
volume. This increase is compensated for by a reduction in peripheral resistance
through neovascularization of the new tissue mass. Thus weight gain only leads to a
rise in blood pressure if the simultaneous increase in cardiac output is not fully
compensated (Barton et al., 2000).

Identification and Characterzation of Novel Proteins in Diabetic and Diabetic Treated [Cynodon dactylon (L.) Pers] Albino Rats
102
Ch
ap
ter–
4
4.2.8.3. Adipose Tissue Function Associated with Proteomics
Advanced mass spectrometry-based proteomics technologies have
revolutionized the way research have conducted biological studies during the last
decade. Although it is still a major challenge to determine global changes in protein
expression, focussed approaches on organelles and selected tissues are now feasible.
Proteomics technologies have also enabled scientists in the research fields of
endocrinology, obesity and diabetes to study complex changes in cells through 2-DE
and MS. This concept is particularly interesting because adipose tissue plays a pivotal
role in the regulation of energy metabolism and glucose homeostasis and because
dysfunction of adipose tissue secretion is associated with obesity and its linked
metabolic syndrome (Corton et al., 2008). Proteomic analysis of epicardial and
subcutaneous adipose tissue (EAT and SAT) reveals differences in proteins involved in
oxidative stress. EAT suffers greater oxidative stress than SAT in patients with
cardiovascular diseases and exhibits associated proteomic differences that suggest the
possibility of its association with myocardial stress in these patients (Antonio et al.,
2010). Proteome differences associated with fat accumulation in bovine subcutaneous
adipose tissues by using 2D electrophoresis reveals increased expression of annexin-1
protein has been found to be associated with higher bovine back fat (BF). This result
lays the foundation for future studies to develop the protein marker for assessing
animals with different BF (Yong et al., 2010). The characterization of the molecular
changes related to obesity in this tissue is a main concern. In this study, chitosan
oligosaccharides (CO) as a potent adipogenic inhibitor in 3T3-L1 cells and also suggest
that the anti-obesity effect of CO might be mediated by the modulation of adipokines
and adipose tissue specific genes (Atiar et al., 2010). In systemic amyloidoses,
widespread deposition of protein as amyloid causes severe organ dysfunction. Striking
differences in the two-dimensional gel proteomes of adipose tissue were observed
between controls and patients. Proteomics approach provides new insights into the
mechanism of the diseases by identifying novel proteins or protein post-translational
modifications associated with amyloid infiltration (Francesca et al., 2008). Diabetes
mellitus is an abundant metabolic disorder characterised by deranged glucose
homeostasis due to an absolute or relative lack of insulin. Adipose tissue plays a central

Identification and Characterzation of Novel Proteins in Diabetic and Diabetic Treated [Cynodon dactylon (L.) Pers] Albino Rats
103
Ch
ap
ter–
4
role in the glucose homeostasis and lipid metabolism. The trend of increased obesity
and diabetes observed over the past few years has made it essential to get new insights
into the pathogenesis of diabetes and associated complication in order to discover novel
possibilities of preventive and effective treatment. Proteomics approach provides new
insights into the mechanism of the diseases by identifying novel proteins or protein
post-translational modifications associated diabetes connected to adipose tissues
function.
4.2.9. BLOOD
Blood is one of the most important constituent of human body, forming the
circulatory system. It occupies 8 % of the human body weight and has an average
density of about 1060 kg/m3. The intricate network of veins and arteries, distributing
blood throughout the body play a significant role. The blood is distributing throughout
the body by the pumping action of heart (circulatory system). Blood has two parts, fluid
and cellular. The fluid part is known as blood plasma that makes 55% of total blood
volume and the rest are the cellular components (RBCs, WBCs and platelets). Blood
plasma is the liquid part of blood that is straw coloured (92% is composed of water and
rest 8% is made up of plasma proteins) (Maton et al., 1993). It is mostly composed of
dissolved proteins, mineral ions, glucose, clotting factors and carbon dioxide. It
circulates dissolved nutrients (amino acids, fatty acids and glucose) and removes waste
products (carbon dioxide, lactic acid and urea) from body. Other components of blood
plasma are serum albumin, lipoprotein particles, immunoglobulins, electrolytes, etc
(Johann et al., 2008).
The blood sugar concentration or blood glucose level is the amount of glucose
(sugar) present in the blood. Normally in mammals, the body maintains the blood
glucose level at a reference range between about 3.6 and 5.8 mM (64.8 and
104.4 mg/dL). The mammalian body naturally tightly regulates blood glucose levels as
a part of metabolic homeostasis (Daly and Mark, 1998). Glucose is the primary source
of energy for the body's cells and blood lipids (in the form of fats and oils) are
primarily a compact energy store. Glucose is transported from the intestines or liver to

Identification and Characterzation of Novel Proteins in Diabetic and Diabetic Treated [Cynodon dactylon (L.) Pers] Albino Rats
104
Ch
ap
ter–
4
body cells via the bloodstream and is made available for cell absorption via the
hormone insulin, produced by the body primarily in the pancreas. The mean normal
blood glucose level in humans is about 4 mM (72 mg/dL). However, this level
fluctuates throughout the day. Glucose levels are usually lowest in the morning, before
the first meal of the day (termed "the fasting level"), and rise after meals for an hour or
two by a few millimolar (Bonadonna et al., 1992).
4.2.9.1. Diseases Associated with Diabetes Mellitus
Blood glucose homeostasis describes the balance of glucose ingestion and
hepatic glucose production on one side and peripheral glucose uptake and utilisation on
the other side. This equilibrium is maintained by complex interplay of several organs,
many glucose-elevating hormones like glucagon, cortisol, growth hormone and
catecholamines and one glucose-lowering hormone, insulin. Diabetes mellitus is an
abundant metabolic disorder characterised by deranged glucose homeostasis due to an
absolute or relative lack of insulin (Donath and Halban, 2004). Change in plasma
component metabolism during diabetes mellitus is well established and its plasma
concentrations are either increased or decreased during diabetes such as triglycerides,
cholesterol, apolipoproteins, hormones, protein concentration and antioxidant
(Koukkou et al., 1996). The chronic hyperglycemia of diabetes is associated with long-
term damage, dysfunction and failure of various organs, especially the eyes, kidneys,
nerves, heart and blood vessels. The changes in glucose oxidation in diabetes
secondarily influence the oxidation and the synthesis of triglycerides, cholesterol, fatty
acids, apolipoproteins, hormones, amino acids, protein and antioxidant as well as the
mobilization of from the different tissues to plasma (Roberto et al., 2006). The changes
in tissue metabolism leads to hyperglycemia, atherosclerosis, hyperlipidemia and
cellular damage. Diabetes has increased risk of cardiovascular disease associated with
atherogenic dyslipidaemia. Coronary artery disease, especially myocardial infarction is
the leading cause of morbidity and mortality worldwide (Roberto et al., 2006).

Identification and Characterzation of Novel Proteins in Diabetic and Diabetic Treated [Cynodon dactylon (L.) Pers] Albino Rats
105
Ch
ap
ter–
4
4.2.9.2. Plasma Protein Profiling
Diabetes is a disease where many organs are affected and since all tissues are in
contact with blood, proteins secreted or leaking from the different tissues are reflected
in the circulation. Plasma is an exceptional proteome, in which also other tissue
proteomes finally merge as a subset (Anderson and Seilhamer, 1997). Intact, as well as
partially degraded proteins or protein fragments add variability to the complexity of the
plasma proteome (Thadikkaran et al., 2005). Indeed, the plasma proteome should be
better referred to as plasma proteomes, since it is a dynamic entity which is influenced
by stress, sleep, sport training or meals and in women, by pregnancy
(Thadikkaran et al., 2005). Proteomics investigations on plasma are more than a
challenging task for several reasons, viz the large proportion of albumin (55%, in the
order of 30 g/L), the wide dynamic range in abundance of other proteins and the
tremendous heterogeneity of its predominant glycoproteins (Anderson and Seilhamer,
1997). Along with albumin, a handful of proteins make up the greatest portion of the
plasma proteome, among which immunoglobulins (Igs), fibrinogen, transferrin,
haptoglobin and lipoproteins are the main constituents. Therefore, the removal of high-
abundant proteins is essential to enable detection of low-abundant species which
represent, especially in the plasma, a whole hidden proteome (Fountoulakis et al.,
2004). Furthermore, plasma and serum proteomes do not perfectly match, thus some
proteins could be only detected after clotting induction and vice versa: for example
clotting induction causes the disappearance of several proteins involved in the
coagulation process such as prothrombin–Factor-II (Fountoulakis et al., 2004). All
these factors have contributed to hinder completion of the plasma proteome puzzle,
though many important strides have been made towards this direction. Notably, the
history of plasma proteomics is deeply rooted in (and has so far paralleled) the history
of proteomic itself (Thiele et al., 2007). In 1937 Tiselius published his famous paper in
which he described a pioneeristic method for serum fractionation into multiple
components on the basis of electrophoretic mobility (Tiselius, 1937). From thereon,
panoply of papers has been published dealing with plasma proteins and technical
approaches to investigate them. The first modern screening of the plasma proteome
dates back to 1977 (Anderson and Anderson, 1977) and exploited the 2-DE (IEF-SDS)
Identification and Characterzation of Novel Proteins in Diabetic and Diabetic Treated [Cynodon dactylon (L.) Pers] Albino Rats
106
Ch
ap
ter–
4
technique proposed by O'Farrell 2 years before (O'Farrell, 1975). Anderson and his
group totally identified only 30 proteins, out of 300 individuated spots. An updated
paper from the same group yielded the identification of 35 yet uncharacterized proteins
and 49 poly-peptide species, many consisting of multiple spots differing in
glycosylation or sequence (Anderson and Anderson, 1991). The same approach could
be helpful to reveal polymorphisms in the proteome pattern of serum specimens from a
normal (Tracy et al., 1982) or different populations (Harrison et al., 1991) or to
evidence the glycosylation pattern by means of lectin blotting followed by
chemiluminescence detection (Gravel et al., 1994). In the latter case, 2-DE with lectin
blotting in patients with chronic alcohol abuse revealed abormal transferrin,
haptoglobin β and alpha(1)- antitrypsin isoforms, devoid of a variable number of entire
Nglycan moieties (Henry et al., 1999). 2-DE and microsequencing allowed the
individuation of more than 40 polypeptides (Hughes et al., 1992), but the greatest
strides in the plasma proteome research were only made upon the introduction of MS
(Richter et al., 1999). A thorough MALDI analysis of the peptide fraction of human
plasma recorded approximately 5,000 peptides, 95% of which had a MW under 15 kDa,
suggestive of the fact that they must exist as peptides in order to outweigh the 45 kDa
cutoff for kidney filtration (Anderson and Seilhamer, 1997). In 2002, Adkins et al.
adopted a MUDPIT approach which enabled identification of 490 serum proteins
(Adkins et al., 2002).
4.3. MATERIALS AND METHODS
4.3.1. Chemicals and Materials
The following chemicals and materials required for 2-D electrophoresis were
obtained from Sigma–Aldrich; glycine, ammonium persulphate (APS),
acrylamide/bisacrylamide (solution), glycerol and tetramethylethylenediamine
(TEMED). Tris was purchased from roche. DTT was purchased from Crystal Chem.
Ampholyte (3–10) was purchased from Fluka. Protein marker was obtained Fermentas
(St. Leon-Rot, Germany). For mass spectrometry, the following substances were used:
trifluoroacetic acid for spectroscopy (Merck, Darmstadt, Germany), water and

Identification and Characterzation of Novel Proteins in Diabetic and Diabetic Treated [Cynodon dactylon (L.) Pers] Albino Rats
107
Ch
ap
ter–
4
acetonitrile for MS (Fisher Scientific, Schwerte, Germany), ammonium bicarbonate for
MS (Sigma–Aldrich, Taufkirchen, Germany) and α-cyano-4-hydroxycinnamic acid
(Bruker Daltonik, Bremen, Germany). Unless otherwise stated, all other chemicals used
were from Sigma–Aldrich.
4.3.2. Plant Material and Extract Preparation
Fresh leaves of C. dactylon were collected from PRIST University area. The
plants were taxonomically identified and authenticated by Rev Dr S John Britto SJ,
Director, The Rapinat Herbarium and Centre for Molecular Systematics, St Joseph’s
College (Autonomous), Tiruchirappalli-620 002, Tamil Nadu, India. The voucher
specimen’s number is RHCD02. Fresh leaves of C. dactylon were air dried in shade
and powdered. Aqueous extract: the powdered plant up to 450 g was extracted with
boiling water for 10 h. Ethanolic extract: the extraction was carried out by mixing the
powdered (550 g) leaves with 1:2 (w/v) in 70% ethanol (v/v) for 2 days. The resulted
extracts were filtered and concentrated by rotary evaporator under reduced pressure and
low temperature separately.
4.3.3. Experimental Animals
Eight week old male adult albino rats (Rat: Rattus norvegicus) were housed
with full access to standard laboratory feed and water at a room temperature of (23–26
°C in a 12-h light/12-h dark cycle. All procedures were performed with the guidelines
of Institutional Animal Ethics Committee (IAEC) (IAEC No.: 743/03/abc/CPCSEA dt
3.3.03 - approval no.: PhD2/2009-2010). Diabetes was induced by a single
intraperitoneal injection of an alloxan with 0.9 % saline solution at a dosage of 150
mg/kg, b.w (130–150 g body weight). The animals were considered diabetic if their
blood glucose values were > 200 mg/dl on the 3rd day after alloxan injection. After the
induction of diabetes, they were randomly divided into four groups; group I was normal
rats, received distilled water (n=6); group II, the diabetic induced rats, received
distilled water (n=6); group III diabetic rats were treated with aqueous extract of
C. dactylon leaves dissolved in distilled water (450 mg/kg/bw/day/oral administration)

Identification and Characterzation of Novel Proteins in Diabetic and Diabetic Treated [Cynodon dactylon (L.) Pers] Albino Rats
108
Ch
ap
ter–
4
(n=6) and group IV diabetic rats were treated with ethanollic extract of C. dactylon
leaves dissolved in distilled water for 15 days (450 mg/kg/bw/day/oral administration)
(n=6). After 15 days of treatment, the animals were euthanized and collected organs for
this study.
4.3.4. Sample Preparation and Two-Dimensional Gel Electrophoresis
A trichloroacetic acid/acetone precipitation protocol were adopted to prepare
protein extracts from all rat’s tissues. The protocol was based on the research work of
Damerval (Damerval et al., 1986) with some modifications. Briefly, fresh tissue were
scissored into small pieces on ice and homogenized mechanically in the presence of
PBS and centrifuged at 10000 rpm at 4° C for 10 min. Protein content was determined
by the method of Bradford (Bradford, 1976). Then ice-cold acetone-10 % TCA (Sigma)
added and sonicated for 1 min. The homogenate were kept for precipitation overnight at
−20 °C. After centrifugation at 10000 rpm for 15 min at 4 °C, the supernatant were
removed by decanting immediately and the pellet was rinsed twice in ice-cold acetone
for four times. The pellet was then air-dried, re-suspended in a lysis buffer containing
(85 mM Tris pH 6.8, 2% SDS).
The 2D method used is based on the O’Farrell (O’Farrell, 1975), but with some
modifications. Iso-electric focusing (IEF) were used to separate the proteins according
to isoelectric point (pI) in the first dimension. IEF gels were made in glass tubing (160
× 3 mm inside diameter) and contained 10.3 g urea, 7.125 ml distilled water, 2.44 ml
acrylamide (28.38% acrylamide, 1.62% bis-acrylamide), 0.750 ml carrier ampholytes
3/10, 0.375 ml NP-40, 34.625 µl ammonium persulphate (10%) and 12.5 µl TEMED.
After half an hour’s polymerisation, a pre-run for focusing the ampholytes were
performed by loading 30 µl lysis solution (9.8 M urea, 2% NP-40 (10% in distilled
water), 2% carrier ampholytes 8/10, 25mMDTT] and 30 µl over overlay solution
(8Murea, 1% carrier ampholytes 8/10, 5% NP-40, 25 mM DTT). Upper running buffer
(20 mM NaOH) were degassed for 10 min, but the lower one (10 mM H3PO4) was not.
The electrophoretic conditions of the rod gels during the IEF were 200 V for 15
minutes, 300 V for 30 minutes and 400 V for 1 h. The solution was removed from the

Identification and Characterzation of Novel Proteins in Diabetic and Diabetic Treated [Cynodon dactylon (L.) Pers] Albino Rats
109
Ch
ap
ter–
4
upper tank. Meanwhile, the sample (350 µg) was prepared by adding lysis solution in a
1:2 proportion and heating for 2 min at 100º C. After loading, 30 µl of overlay solution
was added above every sample, which was then run at 400 V for 16 h. After focusing,
IEF gels were maintained in equilibrating buffer (6 M urea, 75 mM Tris-HCl pH 8.8,
29.3 % glycerol, 2 % SDS, 0.002 % bromophenol blue) for 30 minutes. Then, the IEF
rod gels were immediately applied to an SDS-polyacrylamide gel that contained 12%
acrylamide, but the stacking gel was replaced by IEC rod gels fixed to the SDS-PAGE
gel with an agarose solution (1 % agarose, 0.002 % bromophenol blue in the first
equilibrating buffer). The analytical gels were stained with colloidal blue.
4.3.5. MALDI–TOF–MS
Gel pieces of 1.5 mm in diameter were excised manually from the 1-mm thick
gels and washed for 30 min at room temperature under vigorous shaking with 400 µl of
10 mM ammonium bicarbonate solution containing 50 % (v/v) acetonitrile. After
removing the supernatant, gel pieces were dried for 15 min in a vacuum concentrator.
For digestion, 5 µl trypsin solutions (Sequenzing grade modified trypsin, Promega,
Madison and 10 ng/µl in 5 mM ammonium bicarbonate/5% acetonitrile) were added to
each sample. After incubation for 5 h at 37º C, the reaction was stopped by adding 1 µl
of 1 % TFA. For better extraction of peptides, the samples were stored overnight at
5ºC. Without further purification, 1 µl supernatant was mixed with 2 µl of matrix
solution (5 mg α-cyano-4-hydroxycinnamic acid in 40 % [v/v] acetone, 50 % [v/v]
acetonitrile, 9.9% [v/v] water and 0.1 % [w/v] TFA in water). From this mix, 1 µl was
deposited onto the MALDI target.
Tryptic peptides were analysed with a MALDI–TOF mass spectrometer
(Bruker-Daltonics, Germany) in positive mode. Background ions from trypsin autolysis
and contamination by keratins were removed from mass lists. Protein identification was
performed by searching for Rattus proteins in the latest version of the NCBI nr database
using the Mascot search engine (Perkins et al., 1999). The following parameters were
applied: monoisotopic mass accuracy, 100 ppm; missed cleavages, 1; allowed variable
modifications, oxidation (Met) and fixed modification, Carbamidomethyl (C).

Identification and Characterzation of Novel Proteins in Diabetic and Diabetic Treated [Cynodon dactylon (L.) Pers] Albino Rats
110
Ch
ap
ter–
4
Fragmentation of selected peptides was measured using the PSD mode. The mass lists
were used for MS/MS search applying the database and search engine as mentioned
above.
4.3.6. Statistical Analysis
The average numbers of 2D protein spots between the gel are expressed as
mean ± standard error of the mean (SEM). The results were considered statistically
significant if the P values were 0.05 or less.
4.4. RESULTS
4.4.1. Identification and Characterization of Pancreas Proteomes
2-DE was used to separate the proteins extracted from rat pancreas. To take into
account the variation between individuals, normal, alloxan-induced diabetic group and
diabetic treated group were obtained from three animals from each group shown in
figure 4.11a. Of note, salt, carbohydrate, lipid and other secondary metabolic
components were found to interfere with the iso-electric focusing in the first dimension.
Thus, a two-step method (Ice-cold acetone-TCA precipitation and cold-acetone wash)
was used to remove these interfere components before samples were subjected to 2-DE.
350 µg proteins from each preparation were loaded for 2-DE analysis. The proteins
resolved by 2-DE were visualized by colloidal coomassie blue. Classical 2-DE is
performed under denaturing and reducing conditions (urea, DTT) which break protein
complexes and split multi-chain proteins into their subunits. Therefore, proteins may
appear in the 2-DE pattern as single spots, spot chains (with spots of different pI but
almost same molar mass) or several spot chains (subunits). Scanned gels were analyzed
using 2D software Melanie Viewer 7. The spots in the gel were numbered and matched
automatically and the intensity of each spot in each gel was determined. A total of 45 ±
5 (P < 0.05) spots in normal and only one protein spot were found in both diabetic
treated groups, whereas there is was protein spot on the alloxan-induced diabetic group
were detected in 2-DE gels. The majority of these spots matched in three individually

Identification and Characterzation of Novel Proteins in Diabetic and Diabetic Treated [Cynodon dactylon (L.) Pers] Albino Rats
111
Ch
ap
ter–
4
processed gels and they were very similar in intensity, indicating this method is highly
reproducible. However, as shown in figure 4.11a, the protein spots were found in
control group, where as protein spots were significantly not found in alloxan-induced
due to cell death in pancreas and only one protein spot were found in both diabetic
treated groups (group III and IV), it might be up-regulated due to treatment with
C. dactylon leaves extract.
To identify pancreas proteins, the spots were subsequently excised and
subjected trypsin digestion. After in gel tryptic digest the proteins were analyzed by
MALDI-TOF-MS (Ultraflex, Bruker Daltonic). 2-DE gel spot and trypsin digestion
protocol were could provide sufficient sample for MALDI detection. In MALDI
method, the MS and MS/MS spectra quality, in terms of signal intensity and m/z value,
could be improved by increased laser intensity, more laser shots per sub-spectrum and
more accumulative sub-spectra contributing to a single spectrum. Such increase
required sufficient sample on MALDI target plates. Identification of proteins was
carried out by database searches with mascot. Figure 4.11b, shows the MS spectra
obtained from the protein in spot 1, 2 3 and 4. Table 4.2 shows lists all the proteins
identified through peptide mass mapping. The spot 1 was identified as junction
plakoglobin, having molecular mass (Mr) 82490 Da and pI value is 5.7; spot 2 was
identified as a adrenodoxin, mitochondrial, having molecular mass (Mr) 20578 Da and
pI value 5.5 and spot 3 was identified as mediator of RNA polymerase II transcription
subunit 4, having molecular mass (Mr) 29864 and pI value: 4.9 and spot 4 was
identified as GTPase IMAP family member 4, having molecular mass (Mr) 36085 and
pI value: 6.0.

Ide
ntifica
tion
an
d C
ha
racte
rzatio
n o
f No
ve
l Pro
tein
s in D
iab
etic a
nd
Dia
be
tic Tre
ate
d [C
yn
od
on
da
ctylo
n (L.) P
ers] A
lbin
o R
ats
11
2
Chapter–4
Figure 4.11a – 2-D map of rat pancreas. Pancreas proteins were separated by using pH gradient 3–10, followed by 12% SDS-PAGE. The
gels were stained with colloidal blue. They were 4 spots selected for MS analysis. Group I (Control); Group II (Alloxan diabetic,
untreated); Group III (Alloxan diabetic treated with aqueous extract) and Group IV (Alloxan diabetic treated with ethanolic
extract). Figure 4.11b – MALDI–TOF–MS analysis of tryptic digest of junction plakoglobin (a), adrenodoxin (b), mediator of RNA
polymerase II transcription subunit 4 (c) and GTPase IMAP family member 4 (d).
a b

Identification and Characterzation of Novel Proteins in Diabetic and Diabetic Treated [Cynodon dactylon (L.) Pers] Albino Rats
113
Ch
ap
ter–
4
4.4.2. Identification and Characterization of Brain Proteomes
2DE patterns of rat brain proteome were attained by using four rod gels (160 ×
3mm inside diameter, pH 3–10): group I: control; group II: alloxan diabetic; group III:
diabetes treated with aqueous extract and group IV: diabetes treated with ethanolic
extract is indicated in figure 4.12a. Approximately 650 protein spots were detected on
colloidal Coomassie blue stained gels and about 648 protein spots were matched
between three control gels and three treated gels. Spot intensity variations between
untreated and treated samples were quantified by software image analysis and the
protein spots showing significant differences < 0.05% (P < 0.05). The isoelectric points
were found to lie between 4 and 7; using pH 3–10; some of them could not be separated
quite well in higher molecular weight range. Image analysis revealed that two spots
were specifically up-regulated in the group II (alloxan diabetic) as compared with
control and treated diabetic groups. Spot numbers with arrow mark on 2-DE image
indicate the differential expression protein or up-regulated protein in rat brain proteome
map. Two reliable different spots were excised and identified by MALDI-TOF MS.
Spots 1 and 2 were detected in the 2DE pattern of the diabetic group, but not in the
control group as indicated in figure 4.12a. In situ digested with trypsin and analysed by
MALDI-TOF-MS. High-quality PMF and PST were obtained and all the two
differentially expressed protein were identified through swiss database using the mascot
search engine. A total of 53 (spot 1) and 56 (spot 2) monoisotopic peaks were input into
mascot search engine and the query results showed that protein spot 1 is PPP1R14D
and spot 2 is RAB18 and also lists all the proteins identified through peptide mass
mapping are indicated in tables 4.3. Figure 4.12b shows an example of a MALDI-TOF-
MS and MS/MS peptide mass fingerprint of the tryptic digests corresponding to spots 1
and 2. A review of the literature shows that most of these proteins are closely related to
brain metabolism and function. The cellular locations of these proteins were determined
using UniProt and proteins were associated with many sub-cellular locations with the
largest number associated with the cytoplasm and nucleolus in brain. The identified
proteins falls into two functional categories: (i) metabolic signalling protein
(PPP1R14D) and (ii) vesicle transport signalling protein (RAB18).

Identification and Characterzation of Novel Proteins in Diabetic and Diabetic Treated [Cynodon dactylon (L.) Pers] Albino Rats
114
Ch
ap
ter–
4
Table 4.2 – Proteins identified and peptide masses as determined by MALDI-TOF-
MS of peptides formed by tryptic digestion of 2-DE protein spots. MW-Molecular
Weight, II-Instability Index, AI-Aliphatic Index and GRAVY-Grand Average of
Hydropathicity.
Table 4.3 – Identified brain diabetes-associated proteins in diabetic rat brain
proteome by peptide mass fingerprinting. MW-Molecular Weight, II-Instability
Index, AI-Aliphatic Index and GRAVY-Grand Average of Hydropathicity.
A. no. Protein Score Esti. Esti. II AI GRAVY
name MW (da) pI
Q6P0K8 Junction 23 82490 5.75 37.92 100.9 -0.126 plakoglobin P24483 Adrenodoxin 29 20578 5.57 46.6 84.1 -0.142 Mitocondrial Q561Q8 Mediator of RNA 20 29864 4.96 49.73 83.48 -0.615 polymerase II transcription subunit 4 Q8K3K9 GTPase 35 36085 6.02 42.03 81.16 -0.678 IMAP family member 4
A. no. Protein Score Esti. Esti. II AI GRAVY
name MW (da) pI
Q8K3F4 PPP1R14D 21 16866.8 6.75 84.69 68.84 -1.041
Q5EB77 RAB18 23 22976.0 5.11 28.70 88.45 -0.308
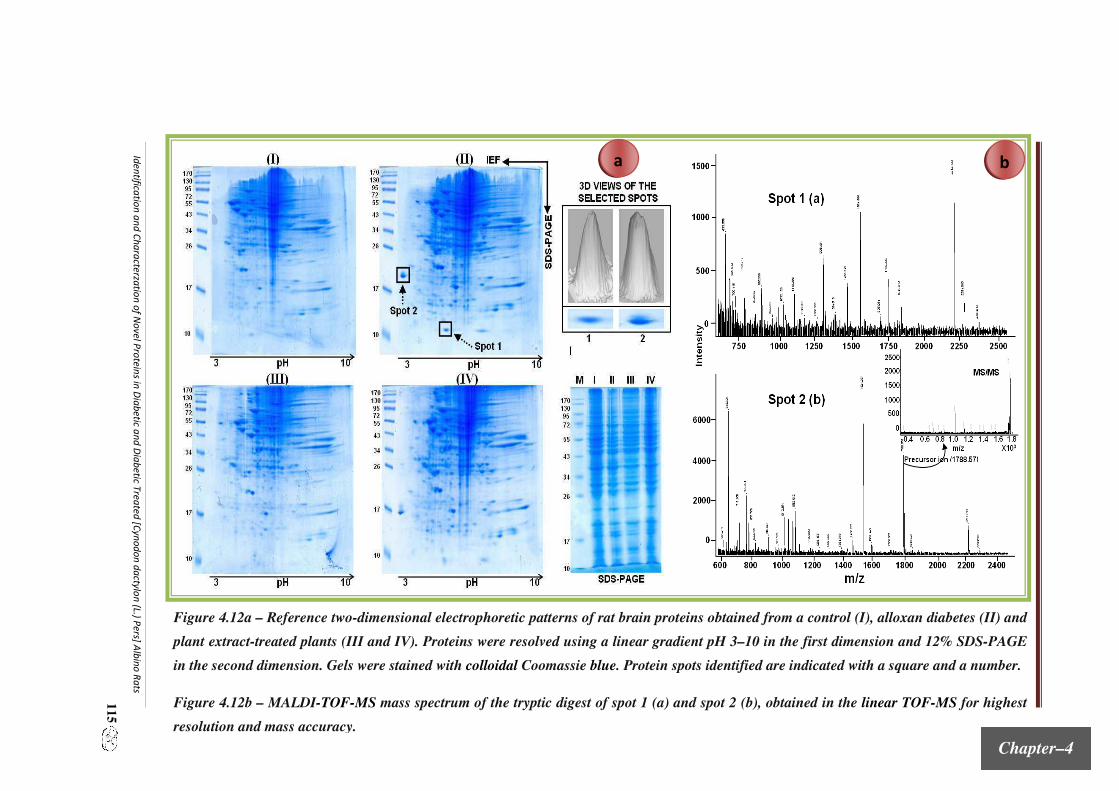
Ide
ntifica
tion
an
d C
ha
racte
rzatio
n o
f No
ve
l Pro
tein
s in D
iab
etic a
nd
Dia
be
tic Tre
ate
d [C
yn
od
on
da
ctylo
n (L.) P
ers] A
lbin
o R
ats
11
5
Chapter–4
Figure 4.12a – Reference two-dimensional electrophoretic patterns of rat brain proteins obtained from a control (I), alloxan diabetes (II) and
plant extract-treated plants (III and IV). Proteins were resolved using a linear gradient pH 3–10 in the first dimension and 12% SDS-PAGE
in the second dimension. Gels were stained with colloidal Coomassie blue. Protein spots identified are indicated with a square and a number.
Figure 4.12b – MALDI-TOF-MS mass spectrum of the tryptic digest of spot 1 (a) and spot 2 (b), obtained in the linear TOF-MS for highest
resolution and mass accuracy.
b a

Identification and Characterzation of Novel Proteins in Diabetic and Diabetic Treated [Cynodon dactylon (L.) Pers] Albino Rats
116
Ch
ap
ter–
4
4.4.3. Identification and Characterization of Heart Proteomes
In an effort to gain insight into the molecular mechanisms underlying the
pathogenesis of diabetic cardiomyopathy, we performed a comparative analysis of the
cardiac protein expression profiles of control and diabetic rats following alloxan-
induced diabetes using two-dimensional gel electrophoresis and mass spectrometry (2-
DE/MS). A protein load of 350 µg per gel and colloidal blue staining for spot
visualization resulted in an approximately 725 protein spots were visualized on each gel
and protein spot patterns were essentially identical among the animals, as determined
by spot matching and analysis by using Melanie Viewer 7 2D software. We were able
to find two protein spots with a significant change in-group II and IV. Figure 4.13a
shows one set of 2-DE gels (we have run three sample for each groups), where
differentially expressed proteins are marked with circles. The heart protein patterns
observed for each sample were similar and reproducible from animal to animal and gel
to gel.
In order to identify the altered proteins, the protein spots were excised from the
2-DE gels and analyzed by two methods; MALDI-TOF-MS and MS/MS analysis. By
using in-gel digest and MS with consecutive database search, we identified two
differentially expressed proteins. Figure 4.13b shows an example of a MALDI-TOF-
MS and MS/MS peptide mass fingerprint of the tryptic digests corresponding to spots 1
and 2. Table 4.4 gives a detailed overview of these two proteins with respect to
observed and expected molecular weight and pI value, and the mode of identification
with matched peptides. MS analysis identified two proteins i.e. spot 1 is neurotrophins
(NTF4), having molecular weight 22.7 kDa and iso-electric point 9.1; and spot 2 is
electron transfer flavoprotein beta subunit (ETFB), having molecular weight 27.8 kDa
and iso-electric point 7.6. A review of the literature shows that most of these proteins
are closely related to cardiac metabolism and function. The cellular locations of these
proteins were determined using UniProt and proteins were associated with many sub-
cellular locations with the largest number associated with the cytoplasm and
mitochondria in heart. These results indicate that cardiac function may be modified
during type I diabetes.

Ide
ntifica
tion
an
d C
ha
racte
rzatio
n o
f No
ve
l Pro
tein
s in D
iab
etic a
nd
Dia
be
tic Tre
ate
d [C
yn
od
on
da
ctylo
n (L.) P
ers] A
lbin
o R
ats
11
7
Chapter–4
Figure 4.13a – 2-DE map of rat heart. Heart proteins were separated by using pH gradient 3–10, followed by 12 % SDS-PAGE. The gels
were stained with colloidal blue. Group I (Control); Group II (Alloxan diabetic, untreated); Group III (Alloxan diabetic treated
with aqueous extract) and Group IV (Alloxan diabetic treated with ethanolic extract).
Figure 4.13b – MALDI-TOF-MS analysis of tryptic digest of neurotrophins (a) and electron transfer flavoprotein beta subunit (b).
a b

Identification and Characterzation of Novel Proteins in Diabetic and Diabetic Treated [Cynodon dactylon (L.) Pers] Albino Rats
118
Ch
ap
ter–
4
Table 4.4 – Protein identified and peptide masses as determined by MALDI-TOF-MS
of peptides formed by tryptic digestion of 2-DE protein spots. MW-Molecular Weight,
II-Instability Index, AI-Aliphatic Index and GRAVY-Grand Average of
Hydropathicity.
4.4.4. Identification and Characterization of Liver Proteomes
In the current study, we have used 2-DE analysis to examine protein alterations
in the alloxan-induced diabetic rat’s liver and in the presence and absence of plant
extract. The protein extractions were done by TCA/acetone procedure and after
estimating the concentration by Bradford’s assay. Average amounts of 350 µg of total
proteins from each sample were loaded for 2-DE investigations. For a reliable analysis
of protein expression, 2-DE was performed in triplicate from each group. The resulting
3 gel images were analyzed and evaluated as one match set with the 2D software
(Melanie Viewer 7). On the average, 635 matched spots were detected on each gel and
three proteins were differently expressed in alloxan-induced diabetic rats (group II) as
compare to control and diabetic treated groups. Figure 4.14a shows images from IEF
and SDS–PAGE focusing on areas containing differentially expressed proteins in liver
tissues. Protein alterations showing reproducible changes between control, diabetic and
diabetic treated liver tissues are highlighted with arrows. Altered proteins were
subsequently excised and subjected to in-gel tryptic digestion, MALDI–TOF–MS
analysis and the proteins were identified by using mascot search engine. This procedure
allowed the unambiguous identification of the protein components investigated. Figure
4.14b and 4.14c shows an example of a MALDI–TOF–MS and MS/MS peptide mass
fingerprint of the tryptic digests corresponding to spot 1, 2 and 3 from group II. Table
4.5 shows all the identified proteins through peptide mass mapping. A review of the
A. no. Protein Score Esti. Esti. II AI GRAVY
name MW (da) pI
P34131 NTF4 20 22718 9.17 68.94 81.72 -1.173
Q68FU3 ETFB 32 27898 7.60 24.02 107.76 -0.076

Identification and Characterzation of Novel Proteins in Diabetic and Diabetic Treated [Cynodon dactylon (L.) Pers] Albino Rats
119
Ch
ap
ter–
4
literature shows that most of these proteins are closely related to liver metabolism and
function.
These experimental approaches were identified three up-regulated proteins in
alloxan-induced diabetes rats. The cellular locations of these proteins were determined
using UniProt and proteins were many associated with sub-cellular locations like
cytoplasm and nucleolus in liver. The up-regulated protein such as nucleophosmin, L-
xylulose reductase and Carbonic anhydrase III were found only in alloxan-induced
diabetes rats (group II) are indicated in table 4.5. The identified proteins were fallen
into three functional categories: i) Cell Proliferation Related Protein i.e.
Nucleophosmin (NPM), ii) Metabolism-related proteins i.e. l-Xylulose reductase (XR),
and iii) Electrolyte Metabolism Related Protein i.e. carbonic anhydrases III (CA III).
Figure 4.14a – 2-DE map of rat liver. Liver proteins were separated by using pH gradient 3–10,
followed by 12% SDS-PAGE. The gels were stained with colloidal blue. They were 3 spot
selected for MS analysis corresponding to spot 1, 2 and 3 from Group II. Group I (Control);
Group II (Alloxan diabetic, untreated); Group III (Alloxan diabetic treated with aqueous
extract) and Group IV (Alloxan diabetic treated with ethanolic extract).
a

Ide
ntifica
tion
an
d C
ha
racte
rzatio
n o
f No
ve
l Pro
tein
s in D
iab
etic a
nd
Dia
be
tic Tre
ate
d [C
yn
od
on
da
ctylo
n (L.) P
ers] A
lbin
o R
ats
12
0
Chapter–4
Figure 4.14b – MALDI–TOF–MS analysis of tryptic digest of nucleophosmin (a), l-xylulose reductase (b) and carbonic anhydrase
III (c).
Figure 4.14c – MALDI–TOF–MS/MS analysis of Carbonic anhydrase III. (a) the MS/MS analysis of 1113.918 Dalton fragment,
(b) protein sequence and (c) b and y ion analysis.
b c

Identification and Characterzation of Novel Proteins in Diabetic and Diabetic Treated [Cynodon dactylon (L.) Pers] Albino Rats
121
Ch
ap
ter–
4
Table 4.5 – Up-regulated proteins of rat liver in alloxan-induced diabetes. MW-
Molecular Weight, pI-iso-electric point, II-Instability Index, AI-Aliphatic Index and
GRAVY-Grand Average of Hydropathicity.
4.4.5. Identification and Characterization of Kidney Proteomes
The well-resolved and reproducible 2-DE patterns of normal, alloxan-induced
diabetic rats and diabetic treated rats’ kidney were obtained. Using 160 × 3 mm inside
diameter rod gel with pH range 3–10, the most protein spots were distributed in the
region from molecular mass of 26 to 72 kDa and pI of pH 4 to 8. In order to measure
the reproducibility, 2-DE was repeated for three times under the condition of 300 µg
protein load, for normal, alloxan-induced diabetic rats and diabetic treated rats (three
samples from each group) is shown in figure 4.15a. Three colloidal coomassie blue
stained 2-DE profiles of each sample were very similar. The image analysis showed
that these 2-DE maps were reproducible. The average protein spot detected on each
gels were 730 ± 20 (P < 0.05). Comparison of the differential protein expression
between groups (normal, alloxan-induced diabetic rats and diabetic treated rats) shown
in 2-DE images was carried out using 2D software Melanie Viewer 7. When the 2-DE
patterns of proteins from control and diabetic treated rats were compared, the
expression of the vast majority of proteins remained unaltered. However, we had
identified three proteins, the abundance of which was significantly altered in alloxan-
induced diabetic group as compared with normal and diabetic treated rats. The average
protein spot detected on each gels were 730 ± 20 and three proteins were differentially
expressed in diabetic group (group II) as compare to control and both diabetic treated
groups (P < 0.05).
A. no. Protein Score Esti. Esti. II AI GRAVY
name MW (da) pI
PQ63698 Nucleophosmin 56 32711 4.62 52.41 62.40 -1.000
Q920P0 L-xylulose reductase 75 25931 6.82 26.07 102.2 0.231
O54961 Carbonic anhydrase III 65 29698 6.89 39.28 70.88 -0.541

Identification and Characterzation of Novel Proteins in Diabetic and Diabetic Treated [Cynodon dactylon (L.) Pers] Albino Rats
122
Ch
ap
ter–
4
To identify these differentially expressed proteins, the spots were subsequently
excised and subjected to in-gel tryptic digestion and MALDI-TOF mass spectrometry
analyses. Protein identification was repeated at least thrice using spots from different
gels. The acquired peptide mass fingerprint (PMF) was used to search through the
Swiss-Prot and National Centre for Biotechnology Information non-redundant
(NCBInr) databases by the mascot search engine. Figure 4.15b shows the MS spectra
obtained from the protein in spot 1, 2 and 3. Table 4.6 lists all the proteins identified
through peptide mass mapping. The spot 1 was identified as transforming protein-
RhoA, having molecular mass (Mr) 22110 Da and pI value is 5.8; spot 2 was identified
as a Ras-related protein Rab-4A, having molecular mass (Mr) 24176 Da and pI value
5.8 and spot 3 was identified as Ras-related protein Rab-43, having molecular mass
(Mr) 23443 and pI value: 5.5. Based on their functions, the identified proteins can be
categorized into different categories, including i) Rho-GTPase signalling protein
(RhoA) and ii) vesicular transport proteins (Rab-4A and Rab-43).
Table 4.6 – Up-regulated proteins of rat kidney in alloxan-induced diabetes. MW-
Molecular Weight, pI-iso-electric point, II-Instability Index, AI-Aliphatic Index and
GRAVY-Grand Average of Hydropathicity.
A. no. Protein Score Esti. Esti. II AI GRAVY
name MW (da) pI
P61589 Transforming 21 22110 5.83 52.74 83.83 -0.366
protein RhoA
P05714 Rab-4A 21 24176 5.82 41.9 81.13 -0.326
Q53B90 Rab-43 65 23443 5.56 46.89 82.24 -0.272

Ide
ntifica
tion
an
d C
ha
racte
rzatio
n o
f No
ve
l Pro
tein
s in D
iab
etic a
nd
Dia
be
tic Tre
ate
d [C
yn
od
on
da
ctylo
n (L.) P
ers] A
lbin
o R
ats
12
3
Chapter–4
Figure 4.15a – A representative 2D gel electrophoresis (PAGE) image of rat kidney proteins. Proteins (350 µg) were loaded onto an IEF pH
gradient gel (pH 3–10) and subsequently separated by mass on (12%) SDS–PAGE. The gel was stained with colloidal Coomassie blue. Group I
(Control); Group II (Alloxan diabetic, untreated); Group III (Alloxan diabetic treated with aqueous extract) and Group IV (Alloxan diabetic
treated with ethanolic extract).
Figure 4.15b – MALDI-TOF-MS spectral fingerprints obtained from alloxan-diabetic rats kidney. Transforming protein-RhoA (a), Ras-related
protein Rab-4A (b) and Ras-related protein Rab-43 (c).
b a

Identification and Characterzation of Novel Proteins in Diabetic and Diabetic Treated [Cynodon dactylon (L.) Pers] Albino Rats
124
Ch
ap
ter–
4
4.4.6. Identification and Characterization of Spleen Proteomes
All the extracted proteins from the rat spleen were loaded (300 µg) onto first
dimension gel for iso-electric focusing using rod gel pH 3–10 (160 L × 3mm Dia).
Furthermore, all the steps from sample preparation to the 2-DE were done more than
three times for testing the reproducibility. Results showed that the image pattern had
high reproducibility that was sufficient for 2-DE analysis. Four representative gels are
shown in figure 4.16a. The general protein spots distribution patterns in the four images
were almost same. All the steps from protein sample preparation to 2-D PAGE
electrophoresis were carried out simultaneously and the operating conditions were
almost the same. Analysed by the software, one of the gels was designated as the
reference gel (control) and were matched with the other gel. The image analysis
software (Melanie Viewer 7 2D software) typically detected approximately 210 ± 8
protein spots on normal and diabetic treated rats as compared with alloxan-induced
diabetic rats (P < 0.05), whereas approximately 95 ± 5 protein spots on alloxan-induced
diabetic rats as compared with normal and diabetic treated rats (P < 0.05) following
colloidal coomassie blue staining and most of the proteins were ranging from 26 kDa to
72 kDa in molecular mass and pH 4 to pH 8 in iso-electric point. The result showed
that the spot matching rate of the all gels were very high reproducible and that most of
the main proteins expression pattern were same. However, almost 50% of the protein
expressions were down-regulated in alloxan-induced diabetic rats.
The differentially expressed protein spots were excised from 2-DE gel,
trypsinized and subjected to MALDI-TOF-MS/MS analysis. The identities of these
proteins were obtained by searching MALDI-TOF data against the National Centre for
Biotechnology Information non-redundant (NCBInr) databases by the mascot search
engine. Table 4.7 shows that proteins were identified by MALDI-TOF data and its
MALDI-TOF-MS spectra are shown in figure 4.16b. The spot 1 was identified as Ca2+-
binding protein p22 or calcineurin homologous protein-1 (CHP-1), having molecular
mass (Mr) 22418 Da and pI value 4.9; spot 2 was identified as aldose reductase (AR),
having molecular mass (Mr) 36230 Da and pI value 6.2; spot 3 was identified as 78 kDa
Glucose-Regulated Protein (GRP78), having molecular mass (Mr) 72473 Da and pI
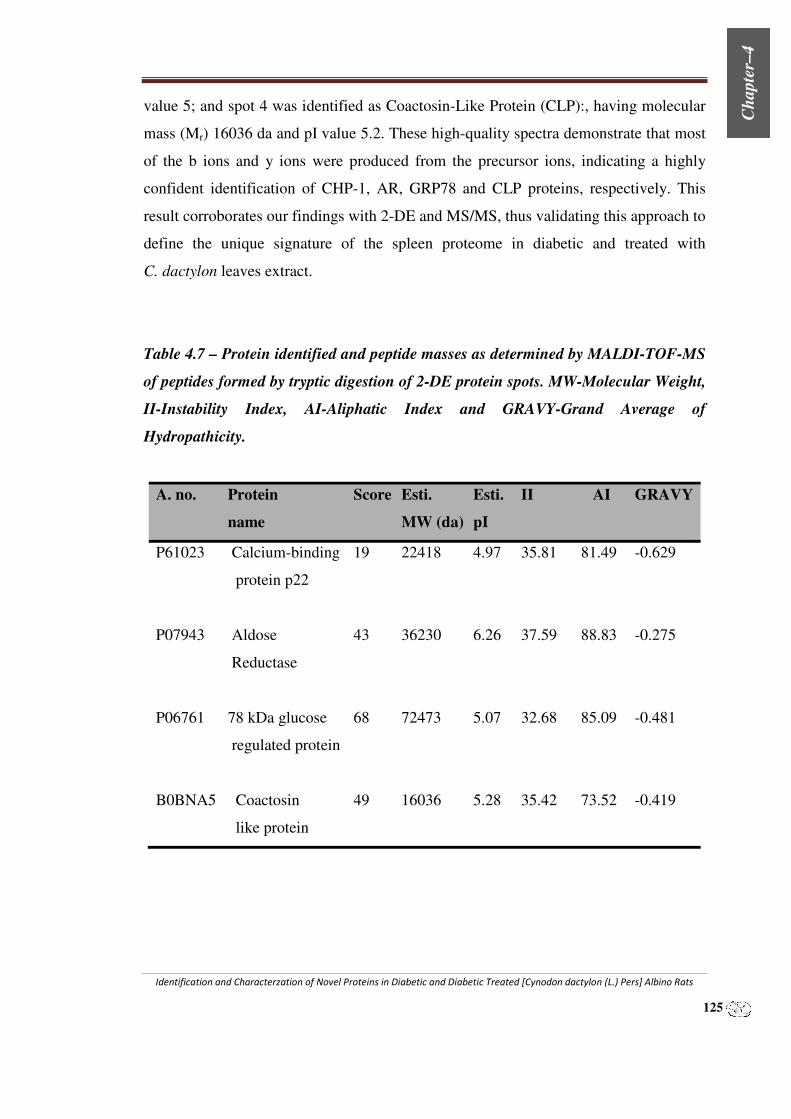
Identification and Characterzation of Novel Proteins in Diabetic and Diabetic Treated [Cynodon dactylon (L.) Pers] Albino Rats
125
Ch
ap
ter–
4
value 5; and spot 4 was identified as Coactosin-Like Protein (CLP):, having molecular
mass (Mr) 16036 da and pI value 5.2. These high-quality spectra demonstrate that most
of the b ions and y ions were produced from the precursor ions, indicating a highly
confident identification of CHP-1, AR, GRP78 and CLP proteins, respectively. This
result corroborates our findings with 2-DE and MS/MS, thus validating this approach to
define the unique signature of the spleen proteome in diabetic and treated with
C. dactylon leaves extract.
Table 4.7 – Protein identified and peptide masses as determined by MALDI-TOF-MS
of peptides formed by tryptic digestion of 2-DE protein spots. MW-Molecular Weight,
II-Instability Index, AI-Aliphatic Index and GRAVY-Grand Average of
Hydropathicity.
A. no. Protein Score Esti. Esti. II AI GRAVY
name MW (da) pI
P61023 Calcium-binding 19 22418 4.97 35.81 81.49 -0.629
protein p22
P07943 Aldose 43 36230 6.26 37.59 88.83 -0.275
Reductase
P06761 78 kDa glucose 68 72473 5.07 32.68 85.09 -0.481
regulated protein
B0BNA5 Coactosin 49 16036 5.28 35.42 73.52 -0.419
like protein

Ide
ntifica
tion
an
d C
ha
racte
rzatio
n o
f No
ve
l Pro
tein
s in D
iab
etic a
nd
Dia
be
tic Tre
ate
d [C
yn
od
on
da
ctylo
n (L.) P
ers] A
lbin
o R
ats
12
6
Chapter–4
Figure 4.16a – 2-DE map of rat spleen. Spleen proteins were separated by using pH gradient 3–10, followed by 12% SDS-PAGE. The gels were
stained with colloidal blue. They were 4 spots selected for MS analysis. Group I (Control); Group II (Alloxan diabetic, untreated); Group
III (Alloxan diabetic treated with aqueous extract) and Group IV (Alloxan diabetic treated with ethanolic extract).
Figure 4.16b – MALDI–TOF–MS analysis of tryptic digest of Ca2+
-binding protein p22 (a), aldose reductase (b), Glucose-Regulated Protein (c)
and Coactosin-Like Protein (d).
a b

Identification and Characterzation of Novel Proteins in Diabetic and Diabetic Treated [Cynodon dactylon (L.) Pers] Albino Rats
127
Ch
ap
ter–
4
4.4.7. Identification and Characterization of Muscle Proteomes
To identify the muscle proteins function associated with diabetes, we initiated a
comparative proteomic study in alloxan-induced diabetic rats. In the preliminary
experiment, 2-DE maps of rat muscle were performed using pH 3–10 range for the first
dimension followed by SDS-PAGE (200 mm × 250 mm × 1 mm) and stained with
Coomassie Brilliant blue R250. For a reliable analysis of protein expression, 2-DE was
performed in triplicate. The attained 2-DE patterns of each muscle tissues were highly
reproducible and well-resolved. The 2-DE maps of muscle tissues displayed about 430
protein spots in each gels are indicated in figure 4.17a. Close-up of the region of the
gels showing differential expression proteins between diabetic and treated group is
shown in figure 4.17a. Image analysis revealed that two spots were specifically up-
regulated in the group IV (diabetes were treated with ethanolic extract) as compared
control and diabetic group. Spot numbers with arrow mark on 2DE image indicate the
differential expression protein or up-regulated protein in rat muscle.
Two differentially expressed protein spots, marked with the numbers (1 and 2)
and arrows in figure 4.17a were excised from Coomassie Brilliant Blue-stained gels
and in situ digested with trypsin and analyzed by MALDI-TOF-MS. High-quality PMF
and PST were obtained and all the two differentially expressed protein were identified.
The MALDI-TOF mass spectrometry map and database query result of a representative
spots are shown in figure 4.17b. A total of 69 (spot 1) and 82 (spot 2) monoisotopic
peaks were input into mascot search engine to search the Swiss-Prot database and the
query result showed that protein spot 1 was fructose-bis-phosphate aldolase (FBA) and
spot was glyceraldehyde-3-phosphate dehydrogenase (GAPDH). The MS/MS results of
spot 1 and 2 are shown in figure 4.17c and 4.17d. The amino acid sequence of a doubly
charged peptide from spot 1 with m/z 1342.816 was identified as
‘’ADDGRPFPQVIK’’ and spot 2 with m/z 1780.145 was identified as
‘’LISWYDNEYGYSNR’’, which were a part of FBA and GAPDH sequence and the
query result indicated that protein spot 1 was FBA and spot 2 was GAPDH
respectively. The annotation of all the identified proteins is summarized in table 4.8.
Based on protein functions using information from the database of Swiss-Prot websites,

Identification and Characterzation of Novel Proteins in Diabetic and Diabetic Treated [Cynodon dactylon (L.) Pers] Albino Rats
128
Ch
ap
ter–
4
two identified proteins associated diabetes were categorized into protein groups majorly
involved in glucose metabolism.
Table 4.8 – Protein identified and peptide masses as determined by MALDI-TOF-MS
of peptides formed by tryptic digestion of 2-DE protein spot up-regulated by
treatment of plant extract. MW-Molecular Weight, II-Instability Index, AI-Aliphatic
Index and GRAVY-Grand Average of Hydropathicity.
A. no. Protein Score Esti. Esti. II AI GRAVY
name MW (da) pI
P05065 Fructose-1, 6- 68 39783 8.31 37.02 86.65 -0.273
bis-phosphate
aldolase
P04797 Glyceraldehyde- 16 35827.9 8.14 19.12 84.32 -0.089
3-phosphate
Dehydrogenase

Ide
ntifica
tion
an
d C
ha
racte
rzatio
n o
f No
ve
l Pro
tein
s in D
iab
etic a
nd
Dia
be
tic Tre
ate
d [C
yn
od
on
da
ctylo
n (L.) P
ers] A
lbin
o R
ats
12
9
Chapter–4
Figure 4.17a – Two-dimensional electrophoresis of rat muscle protein from alloxan-induced diabetic rat. Proteins from muscle tissue were
separated on 18 cm pH 3–10 IEF and mass separation by SDS-PAGE (200 mm × 250 mm × 1 mm) and stained with Coomassie Brilliant
blue. Group I (Control); Group II (Alloxan diabetic, untreated); Group III (Alloxan diabetic treated with aqueous extract) and Group IV
(Alloxan diabetic treated with ethanolic extract).
Figure 4.17b – MALDI-TOF-MS peptide mass fingerprint of the tryptic digest of fructose-bis-phosphate aldolase (a) and glyceraldehyde-3-
phosphate Dehydrogenase (b).
b a

Ide
ntifica
tion
an
d C
ha
racte
rzatio
n o
f No
ve
l Pro
tein
s in D
iab
etic a
nd
Dia
be
tic Tre
ate
d [C
yn
od
on
da
ctylo
n (L.) P
ers] A
lbin
o R
ats
13
0
Chapter–4
Figure 4.17c – MALDI-TOF-MS/MS analysis of differently expressed proteins spot 1. (a) The MS/MS peak of 1342.816 Dalton fragment, (b)
protein sequence of FBP was shown and matched MS/MS fragmentation was underlined and (c) b & y ion.
Figure 4.17d – MALDI-TOF-MS/MS analysis of differently expressed proteins spot 2. (a) The MS/MS peak of 1780.145 Dalton fragment, (b)
protein sequence of GAPDH was shown and matched MS/MS fragmentation was underlined and (c) b & y ion.
d c

Identification and Characterzation of Novel Proteins in Diabetic and Diabetic Treated [Cynodon dactylon (L.) Pers] Albino Rats
131
Ch
ap
ter–
4
4.4.8. Identification and Characterization of Adipose Tissues Proteomes
The adipose tissues 2-DE protein map is shown in figure 4.18a. Each set of
animal tissues were processed in parallel through protein extraction, 2-DE and staining
to avoid differences from sample handling. The resulting three gel images (each group)
were analysed and evaluated as one match set with the 2D software (Melanie Viewer
7). Figure 4.18a shows one set of 2-DE gels (we have run three for each group), where
differentially expressed proteins are marked with circles. Additional differences were
noticed in individual gels, but varied within the set and were not included. The protein
patterns observed for each sample were similar and reproducible from animal to animal
and gel to gel. Two reliable different spots were excised to be identified by MALDI-
TOF-MS after trypsin digestion. Spots 1 and 2 were detected in the 2-DE pattern of the
diabetic group, but not in control and treated group (figure 4.18a). MALDI spectra were
characterized by the presence of several mass signals originated by the result of
contaminant keratins and fragment of auto-catalysed trypsin peaks (mass) were
removed before mascot analysis. The identification results were shown in figure 4.18b
and tables 4.9. The peptide pattern obtained from each spot was subjected to a database
analysis using mascot with NCBI (http://www.matrixscience.com/), allowing one
missed cleavage of trypsin per peptide and a mass tolerance of 1 Da. Spot 1 was
identified as SRFBP1, which is 49 kDa and has a pI of 9.6 and spot 2 was identified as
mitogen-activated protein kinase kinase 7 (MAPKK7), which is 47 kDa and has a pI of
9.2.
Table 4.9 – The identified differential protein expression in alloxan-induced diabetic rat
adipocytes were detected by MALDI-TOF-MS/MS. MW-Molecular Weight, pI-iso-electric
point, II-Instability Index, AI-Aliphatic Index and GRAVY-Grand Average of
Hydropathicity.
A. no. Protein Score Esti. Esti. II AI GRAVY
name MW (da) pI
Q66H19 SRFBP1 34 49394 9.63 55.31 56.81 -1.123
Q4KSH7 MAPKK7 18 47962 9.20 53.86 79.12 -0.528

Ide
ntifica
tion
an
d C
ha
racte
rzatio
n o
f No
ve
l Pro
tein
s in D
iab
etic a
nd
Dia
be
tic Tre
ate
d [C
yn
od
on
da
ctylo
n (L.) P
ers] A
lbin
o R
ats
13
2
Chapter–4
Figure 4.18a – A representative 2-DE gel electrophoresis (PAGE) image of rat adipose tissue proteins. Proteins (350 µg) were loaded onto an
IEF pH gradient gel (pH 3–10) and subsequently separated by mass on (12%) SDS–PAGE. The gel was stained with colloidal Coomassie
blue. Group I (Control); Group II (Alloxan diabetic, untreated); Group III (Alloxan diabetic treated with aqueous extract) and Group IV
(Alloxan diabetic treated with ethanolic extract).
Figure 4.18b – MALDI-TOF-MS spectral fingerprints obtained from alloxan-diabetic rats adipose tissues. SRFBP1 (a) and MAPKK7 (b).
a b

Identification and Characterzation of Novel Proteins in Diabetic and Diabetic Treated [Cynodon dactylon (L.) Pers] Albino Rats
133
Ch
ap
ter–
4
4.4.9. Identification and Characterization of Plasma Proteomes
In our study, total proteins of plasma samples taken from control, diabetes and
diabetes treated group were separated by 2-DE to identify and analyze the differentially
expressed proteins. Differential analysis of 2-DE protein spots provides a
comprehensive insight into the changes in protein expression due to diabetes mellitus.
Representative colloidal coomassie blue stained 2-DE gels of plasma samples from
controls and diabetes and diabetes treated group are shown in figure 4.19a. Each set of
animal plasma (triplicate of sample from each groups) were processed in parallel
through protein extraction (TCA/acetone method), 2DE and staining to avoid
differences from sample handling. The resulting 3 gel images (each group) were
analyzed and evaluated as one match set with the 2D software i.e. Melanie Viewer 7. A
total of 540 protein spots were identified in all the groups, out of that, 3 protein spots
were up-regulated in diabetes group (group II) as compared with control (group I) and
diabetes treated both groups (group III and group IV); 1 protein spots were down-
regulated in diabetes group (group II) as compared with control (group I) and diabetes
treated both groups (group III and group IV). Differentially expressed protein spots in
2-DE gels are indicated by arrows on figure 4.19a.
Four reliable differently expressed proteins spots were excised from a wide
range of pI and M.WT values and subjected to in-gel tryptic digestion. The protein
identities were determined by ultraflex MALDI-TOF-MS. MALDI spectra were
characterized by the presence of several mass signals originated by contaminant
keratins and fragment of auto-catalysed trypsin. This several mass signals originated by
keratins and trypsins contaminant are removed manually. To identify the exact proteins,
each spot were subjected to a database analysis using the NCBInr database and mascot
search engine program (http://www.matrixscience.com/), allowing one missed
cleavage of trypsin per peptide and a mass tolerance of one Dalton. The obtained mass
signal results and protein access codes, peptide sequence coverage, pI, M.WT, II, AI
and GRAVY are shown in figure 4.19b and table 4.10. Spot 1 was identified as heat
shock proteins B8 (HSPB8), which is 21.7 kDa and has a pI of 4.92, spot 2 was
identified as tropomyosin alpha 3 chain (TPM3), which is 29.2 kDa and has a pI of

Identification and Characterzation of Novel Proteins in Diabetic and Diabetic Treated [Cynodon dactylon (L.) Pers] Albino Rats
134
Ch
ap
ter–
4
4.75, spot 3 was identified as preprohaptoglobin (prepro-HP), which is 30.4 kDa and
has a pI of 7.16 and spot 4 was identified as apolipoprotein A-IV (Apo A-IV), which is
44.4 kDa and has a pI of 5.12. The proteins were identified by MALDI-MS had further
validated by MS/MS for strengthen the results.
Table – 4.10 Up- and down-regulated proteins of rat plasma in alloxan-induced
diabetes. Abbreviation: Molecular weight (M.WT), Dalton (da), Isoelectric point (pI),
Instability index (II), Aliphatic index (AI) and Grand average of hydropathicity
(GRAVY).
Accession Protein Score Esti. Esti. II AI GRAVY
No. name M.WT (da) pI
Q9EPX0 HspB8 22 21750 4.92 60.07 63.62 -0.524
Q63610 TPM3 21 29217 4.75 54.47 83.15 -1.027
AAA41349 Prepro-HP 32 30428 7.16 31.67 83.49 -0.254
P02651 Apo A-IV 46 44429 5.12 48.55 84.76 -0.667

Ide
ntifica
tion
an
d C
ha
racte
rzatio
n o
f No
ve
l Pro
tein
s in D
iab
etic a
nd
Dia
be
tic Tre
ate
d [C
yn
od
on
da
ctylo
n (L.) P
ers] A
lbin
o R
ats
13
5
Chapter–4
Figure 4.19a – 2-DE map of rat plasma. Plasma proteins were separated by using pH gradient 3–10, followed by 12% SDS-PAGE. The gels
were stained with colloidal blue. Group I (Control); Group II (Alloxan diabetic, untreated); Group III (Alloxan diabetic treated with
aqueous extract) and Group IV (Alloxan diabetic treated with ethanolic extract).
Figure 4.19b – MALDI-TOF-MS analysis of tryptic digest of HspB8 (a), TPM3 (b), Prepro-HP (c) and Apo A-IV (d).
b a

Identification and Characterzation of Novel Proteins in Diabetic and Diabetic Treated [Cynodon dactylon (L.) Pers] Albino Rats
136
Ch
ap
ter–
4
4.5. DISCUSSION
4.5.1. Identification and Characterization of Pancreas Proteomes
4.5.1.1. Junction Plakoglobin
Calcium-dependent cell-cell adhesion proteins are morphoregulatory molecules
that play important roles in the structural and functional organization of cells in tissues
and organs of multi-cellular organisms such as α, β and γ-catenin (plakoglobin) and
cadherin. Plakoglobin is a major cytoplasmic protein that occurs in a soluble and a
membrane-associated form and is the only known constituent common to the
submembranous plaques of kinds of adhering junctions, the desmosomes and the
intermediate junctions (Takeichi, 1991). Arrhythmogenic right ventricular
dysplasia/cardiomyopathy (ARVC) is a genetic disease caused by mutations in
desmosomal proteins. Several loci have been mapped and 4 causal genes encoding
desmosomal proteins desmoplakin (DP), plakoglobin (PG), plakophilin 2 (PKP2) and
desmoglein 2 have been identified. Thus, ARVC in a subset of families is considered a
disease of desmosomal proteins (Garcia-Gras et al., 2006). β-catenin plays a central
role in the canonical Wnt signaling pathway. β-catenin-deficient mice die around 6–7
days. This early embryonic lethality has precluded analyses of β-catenin functions
during later development and organogenesis. Mutations and deregulation of
adenomatous polyposis coli (APC) and β-catenin are implicated in specific cancers of
the pancreas (Dessimoz et al., 2005). Plakoglobin is thought to play a key role in
cadherin-mediated epithelial cell adhesion, because loss of homotypic cell adhesion is
an important early step in invasion and metastasis of solid tumors. Deficient expression
of plakoglobin appears to be an important event in the progression of non-small-cell
lung cancer (Pantel et al., 1998) and plakoglobin might represent a putative tumor
suppressor gene for breast and ovarian cancers (Aberle et al., 1995). Plakoglobin are a
major group of calcium-dependent cell-cell adhesion molecules that bind through a
homophilic mechanism and that are localized to specialized intercellular junctions
called adherens junctions. Thus, these membrane associated plaques are architectural
elements in an important strategic position to influence the arrangement and function of
both the cytoskeleton and the cells within the tissue. Deficient expression of
plakoglobin appears to be an important event in the progression of β-cell death in

Identification and Characterzation of Novel Proteins in Diabetic and Diabetic Treated [Cynodon dactylon (L.) Pers] Albino Rats
137
Ch
ap
ter–
4
pancreas. In this study, plakoglobin was down-regulated in diabetic group as compared
with control due cytotoxic action of diabetogenic agents is mediated by reactive oxygen
species. The action of reactive oxygen species with a simultaneous massive increase in
cytosolic calcium concentration causes rapid destruction of beta cells
(Szkudelski, 2001). Cell-cell adhesion proteins are morpho-regulatory molecules that
play important roles in the structural and functional organization of cells where as the
down-regulation of morpho-regulatory molecules leads to cell death. Plakoglobin was
up-regulated in diabetic treated rats with the effect of C. dactylon. Plakoglobin are a
major group of calcium-dependent cell-cell adhesion molecules that bind through a
homophilic mechanism and that are localized to specialized intercellular junctions
called adherens junctions. The up-regulation of plakoglobin in diabetic treated rats
leads to formation of new cell in pancreas.
4.5.1.2. Adrenodoxin
Ferredoxins encompass a broad class of electron transport proteins containing a
non-heme iron-sulfur prosthetic group. In plants and bacteria, a number of different
ferredoxin proteins have been identified with varying molecular weights and numbers
of iron-sulfur centers. In mammals, however, only a single type of ferredoxin has been
observed, and it occurs as an integral component of enzymes vital to steroid
metabolism, the mitochondrial mixed function oxidases (Lovenberg, 1973).
Adrenodoxin, mitochondrial or Ferredoxin-1 is a [2Fe-2Sl-type ferredoxin], that is
found in the mitochondrial matrix of steroidogenic tissues, and functions as the
common electron transporter from NADPH-adrenodoxin reductase to mitochondrial
cytochromes P-450 which catalyze steroid hormone biosynthesis (Nabi and Omura,
1980). Adrenodoxin is synthesized as a large precursor by cytoplasmic polysomes and
is transferred into the mitochondria by an energy-dependent mechanism, after which it
is processed to a mature form by a metallooprotease (Matocha and Waterman, 1985).
Gonadotropin stimuli increase adrenodoxin in the mitochondria of rat ovarian cells.
This investigation make known that, distribution of adrenodoxin in the mitochondria of
ovarian cells are associated with the steroidogenic activities. Gonadotropin function
was interlinked to steroidogenic activities of adrenodoxin (Shin-Ichi and Fumiko,
2005). Due to its essential role in mammalian steroid biosynthesis Adx has attracted

Identification and Characterzation of Novel Proteins in Diabetic and Diabetic Treated [Cynodon dactylon (L.) Pers] Albino Rats
138
Ch
ap
ter–
4
much attention over the last decades. Indeed, the designation “adrenodoxin” is derived
from the tissue from which Adx was first isolated: the adrenal glands, where the steroid
hormones of the glucocorticoid-, mineralocorticoid- and androgen-type are produced
(Ewen et al., 2011). They were many genes expressed in pancreatic acinar cells during
the initiation of acute pancreatitis. Novel genes identified in the current study included,
ephrinA1, ferredoxin, latexin, lipocalin, RhoA and syndecan by using microarrays
technique. This study identified several novel genes likely to be important in the
development and severity of acute pancreatitis (Ji et al., 2003). Specific and effective
therapies are lacking and advances in treatment have been difficult due to a lack of
understanding of the early cellular events important in the pathophysiology of this
disease. Diabetes involves a complex cascade of local and systemic events. The
ultimate outcome of diabetes depends upon the balance of competing cellular
mechanisms that either expand or restrict the local and systemic responses. The
cytotoxic action of diabetogenic agents is mediated by reactive oxygen species. These
radicals undergo dismutation to hydrogen peroxide. Thereafter, highly reactive
hydroxyl radicals are formed by the Fenton reaction. The action of reactive oxygen
species with a simultaneous massive increase in cytosolic calcium concentration causes
rapid destruction of beta cells (Szkudelski, 2001). Adrenodoxin was down-regulated in
diabetic group as compared with control and diabetic treated rats. Adrenodoxin may be
involved in nullifying reactive oxygen species thorough electron transport. The
pathway responsible for the initiation, propagation and limitation of the adrenodoxin
reasonable for preventing the beta cells destruction are not well understood.
Adrenodoxin was not up-regulated in diabetic treated rats with the effect of
C. dactylon. This indicated, completes revival of new pancreatic beta cell are very
difficult due to treatment with C. dactylon, but our previous findings suggested that
C. dactylon aqueous and ethanolic extract is effective for alleviating hyperglycemia and
improving lipid profile in diabetic rats and these could be used in diabetic and coronary
heart disease (CHD) management (Karthik and Ravikumar, 2011).
4.5.1.3. Mediator of RNA Polymerase II Transcription Subunit 4
Transcription initiation is a central and highly regulated step in eukaryotic and
prokaryotic gene expression that unites core RNA polymerase II (Pol II) with numerous

Identification and Characterzation of Novel Proteins in Diabetic and Diabetic Treated [Cynodon dactylon (L.) Pers] Albino Rats
139
Ch
ap
ter–
4
transcriptional factor and mediator factors. The Mediator is a multiprotein coactivator
that promotes RNA polymerase II transcriptional activation through direct interactions
with transcription factors bound at enhancers and upstream promoter elements and with
polymerase and the general initiation factors at the core promoter. The Mediator was
first identified in Saccharomyces cerevisiae and found to be comprised of more than
twenty proteins including Med1–Med20 (Myers and Kornberg, 2000). Mediator of
RNA polymerase II transcription subunit 4 or mediator complex subunit 4 (MED4) or
vitamin D receptor interacting protein (DRIP) is a mediator protein for RNA Pol II and
mainly involved in assembly of mediator. It is possible to recruit RNA polymerase II to
a target promoter and thus, activate transcription by fusing mediator subunits to a DNA
binding domain. The assembly of Mediator (around 20 mediator proteins) is a multistep
process that involves conversion of Med4 and Med8, a core complex containing Srb7,
Med8, and Med4 (as well as other subunits from the head and middle domains)
(Balciunas et al., 2003). Nuclear receptors modulate the transcription of genes in direct
response to small lipophilic ligands. DRIP bind to several nuclear receptors and
mediate ligand-dependent enhancement of transcription. The role of nuclear-receptor
ligands may, in part, be to recruit such a cofactor complex to the receptor and in doing
so, to enhance transcription of target genes (Rachez et al., 1999). In this study, MED4
was down-regulated in diabetic group as compared with control due cytotoxic action of
diabetogenic agents is mediated through reactive oxygen species. Down-regulation of
MED4 appears to be an important event in the progression of β-cell death in pancreas,
because initiation of messenger RNA synthesis is a major site for the regulation of gene
expression and cell survival. MED4 was not up-regulated in diabetic treated rats with
the effect of C. dactylon. This indicated, completes revival of new pancreatic beta cell
are very difficult due to treatment with C. dactylon, but our previous findings suggested
that C. dactylon aqueous and ethanolic extract is effective for alleviating hyperglycemia
and improving lipid profile in diabetic rats and these could be used in diabetic and
coronary heart disease (CHD) management (Karthik and Ravikumar, 2011).
4.5.1.4. GTPase IMAP Family Member 4 (GIMAP4)
Cell-survival-regulator proteins expressed in lymphocytes, termed the immune-
associated nucleotide-binding protein (IAN) (also known as GTPase of immunity-

Identification and Characterzation of Novel Proteins in Diabetic and Diabetic Treated [Cynodon dactylon (L.) Pers] Albino Rats
140
Ch
ap
ter–
4
associated protein (GIMAP) family. The IAN/GIMAP family consists of GTP-binding
proteins that share a unique primary structure and whose expression is finely regulated
by T-cell receptor signals. Crucial roles of IAN/GIMAP family proteins in regulating
T-cell development, selection and homeostasis. Interestingly, TCR signals regulate the
expression of IAN/GIMAP family proteins and at least some IAN/GIMAP family
members seem to bind to Bcl-2 family members (Nitta and Takahama, 2007). GIMAP4
accelerates the execution of programmed cell death induced by intrinsic stimuli
downstream of caspase-3 activation and phosphatidylserine exposure. Apoptosis of T-
cell directly correlates with the phosphorylation status of GIMAP4
(Schnell et al., 2006). T helper (Th) cells differentiate into functionally distinct effector
cell subsets i.e. Th1 and Th2 cells. GIMAP4 is mainly involved in regulation of Th cell
differentiation (Filén et al., 2009). Positive selection of thymocytes is a complex and
crucial event in T cell development that is characterized by cell death rescue,
commitment toward the helper or cytotoxic lineage and functional maturation of
thymocytes bearing an appropriate TCR. IAN-1 represents a key player of thymocyte
development and that it participates to peripheral specific immune responses. The
evolutionary conservation of the IAN family provides a unique example of a plant
pathogen response gene conserved in animals (Poirier et al., 1999). Diabetes-prone
(DP) BB rats spontaneously develop insulin-dependent diabetes resembling human type
1 diabetes. Mutational screening of their coding sequences revealed a frame shift
mutation in Ian4 among lymphopenic rats. IAN4 is identical to Iddm1. IDDM1 and
IAN4 plays a role in type 1 diabetes, but mechanism is unknown (Hornum et al., 2002).
In this study, GIMAP4 was down-regulated in diabetic group as compared with control
due cytotoxic action of diabetogenic agents is mediated through reactive oxygen
species. Down-regulation of GIMAP4 appears to be an important event in the
progression of β-cell death in pancreas may GIMAP4 accelerates the execution of
programmed cell death induced by intrinsic stimuli downstream of caspase-3 activation
and phosphatidylserine exposure as per the above studies. GIMAP4 was not up-
regulated in diabetic treated rats with the effect of C. dactylon. This indicated,
completes revival of new pancreatic beta cell are very difficult due to treatment with
C. dactylon.

Identification and Characterzation of Novel Proteins in Diabetic and Diabetic Treated [Cynodon dactylon (L.) Pers] Albino Rats
141
Ch
ap
ter–
4
4.5.2. Identification and Characterization of Brain Proteomes
4.5.2.1. Metabolic Signalling Protein
PPP1R14D (Protein Phosphatase 1 Regulatory Subunit 14D) or GBPI 1 (Gut
and Brain Phosphatase Inhibitor) was discovered as a homologue of KEPI (Kinase
C-enhanced PP1 Inhibitor). The gene transcribes two splicing variants; PPP1R14D and
GBPI-2. PPP1R14D is expressed in the brain, stomach, small intestine, colon and
kidney, whereas a longer GBPI-2 splice variant is found in the testis. PPP1R14D
contains 145 amino acids, a calculated molecular weight of 16.8 kDa and basic
isoelectric point of 6.75. PPP1R14D gene includes four exons that span a 13 kb region
of chromosome 15q13 (Virshup and Shenolikar, 2009). PPP1R14D is mainly involved
in the gut and brain phosphatase inhibitor. Protein phosphatase 1 (PP1) is the prominent
mammalian serine/threonine protein phosphatases. These phosphatases are major
signal-transducing enzymes whose activities can be regulated by exogenous and
endogenous agents (Sontag, 2001). Phosphatase regulations contribute significantly to
the modulation of key cellular processes including transcription, protein synthesis,
metabolism, muscle contraction and cell division, and mainly are associated with
glycogen metabolism and regulation (Cohen, 1989). Phosphorylation and
dephosphorylation events can dramatically change the ability of PP1 inhibitors to alter
PP1 activities.
Normally, covalent modification (i.e., phosphorylation) of the enzymes
involved in glycogen metabolism can drastically affect their activity. Such covalent
modification is under hormonal control through cell signalling cascade such as insulin,
adrenaline and catecholamine. In many tissues, insulin activates PP1 via a cascade
(insulin, IR, IRS1, SOS, Ras, c-Raf, MEK1/2, Erk and PP1 cascade) of events whose
elements are similar to the c-AMP cascade (receptors, tyrosine kinase, etc.)
(Yoichi et al., 2001). The effect of insulin, PP1 bind to the glycogen particle via the G
subunit. Since both glycogen phosphorylase and synthase bind to glycogen particles,
PP1 dephosphorylates them, thereby inactivating phosphorylase and activating
synthase. Thus, insulin switches off glycogen breakdown and switches on glycogen
synthesis (Noel et al., 2000). In many other tissues, PP1 binds to phosphorylase-a and

Identification and Characterzation of Novel Proteins in Diabetic and Diabetic Treated [Cynodon dactylon (L.) Pers] Albino Rats
142
Ch
ap
ter–
4
becomes
inactive PP1,
which is present
due to the
cAMPmediated
cascade
(hormones,
GPCR, AC,
cAMP, PKA and
PP1 cascade) of
events initiated
by many
hormones and
neurotransmitter
. Since both
phosphorylase
and synthase are
phosphorylated
switches, the breakdown is activated and synthesis is inactivated. When glucose levels
have risen sufficiently, its binds to an allosteric site on phosphorylase-a and shifts it to
an inactive form phosphorylase-b (Martin et al., 2002).
PPP1R14D is a potent and powerful inhibitor of PP1 enzymatic activity when
phosphorylated at threonine 58 (T58) by Protein Kinase-C (PKC). Interestingly,
subsequent phosphorylation at threonine 32 (T32) by Protein Kinase-A (PKA)
abolishes the PKC-activated PP1 activities of PPP1R14D (Masumi, 2009). This
phosphorylation could well interfere with PP1 binding as it is close to the 22-KVHW-
25 sequence that represent the PP1-bindingmotif of PPP1R14D. PPP1R14D is a new
member of the interesting class of PP1-regulatory phosphoproteins and probably plays
an important role at the junctions between PKC and PKA phosphoregulatory pathways
in tissues such as brain, gut and testis. Cellular PP1 is associated with PP1 regulatory
proteins/subunits at their PP1-binding site, known as the RVXF motif. The binding of
Figure 4.20 – The schematic representations of functional
pathways of identified proteins in brain (PPP1R14D and
RAB18).

Identification and Characterzation of Novel Proteins in Diabetic and Diabetic Treated [Cynodon dactylon (L.) Pers] Albino Rats
143
Ch
ap
ter–
4
PP1 regulatory proteins thus confers substrate specificity and localization on cellular
PP1 (Cohen, 2002). In addition, eukaryotic cells express several PP1 inhibitor proteins
that play important roles in regulating cellular PP1 such as inhibitor-1, inhibitor-2,
DARPP32 and NIPP-1 (Ceulemans and Bollen, 2004). By up-regulation of these
proteins drastically modulated the function of PP1, which resulted in change of
glycogen breakdown and glycogen synthesis in the cell. The schematic representation
of functional pathways of PPP1R14D is shown in figure 4.20.
4.5.2.2. Vesicle Transport Signaling Protein
RAB18 belongs to the family of Ras-related, small GTPase proteins, which are
considered intracellular membrane organizers as they orchestrate vesicle traffic within
cells (Zerial and McBride, 2001). RAB18 contains 206 amino acids, a calculated
molecular weight of 22.9 kDa and basic isoelectric point of 5.1. RAB18 is located in
chromosome 10p12.1. RAB GTPases are key regulators of intracellular vesicular
transport that control vesicle budding, cargo sorting, transport, tethering and fusion.
Vesicle-mediated transport between intracellular membrane-bound compartments of
eukaryotic cells is essential for biosynthesis, secretion, endocytosis, cell differentiation
and growth. Transport involves sequestering of the cargo molecules into vesicles,
vesicular budding, transport processes, and finally docking and fusion of vesicles at the
target membrane (Harrison et al., 2003). GTPases of the RAB family play a central role
in the regulation of these processes by recruiting specific partner proteins. The small
GTPase RAB18 is mainly involved in the regulation of membrane traffic from the
endoplasmic reticulum (ER) towards the Golgi apparatus. RAB18 are known to
regulate distinct aspects of trafficking pathways, often by regulating tethers, SNARE
(soluble NSF attachment receptor) proteins and motors (Christoforidis et al., 1999). In
fact, loss-of-function mutations in RAB proteins or RAB regulatory proteins are known
to be implicated in causing secretary diseases (Nachury et al., 2007) and certain cancers
(Cheng et al., 2005). In this scenario, the RAB18 may be of special interest as: i) it is
expressed in neuroendocrine cells which results in inhibition of secretory activity like
hormone release by interacting with secretary granules (Vazquez-Martinez et al., 2007)
and ii) its expression is down-regulated in cells displaying high-secreting phenotype
(Peinado et al., 2002). In summary, overexpression of RAB18 protein resulted in the

Identification and Characterzation of Novel Proteins in Diabetic and Diabetic Treated [Cynodon dactylon (L.) Pers] Albino Rats
144
Ch
ap
ter–
4
dramatic redistribution vesicular transport in cell. The schematic representation of
functional pathways of RAB18 is shown in figure 4.20.
4.5.3. Identification and Characterization of Heart Proteomes
4.5.3.1. Neurotrophins
Neurotrophins (NTF4) are a family [brain derived neurotrophic factor (BDNF);
neurotrophin-4/5 (NT-4/5), neurotrophin-3 (NT-3) and nerve growth factor (NGF)] of
soluble polypeptide, implicated in several functions of the nervous system, including
axonal growth, synaptic plasticity, survival, differentiation and myelination. Although
originally discovered in the nervous system, many members of the neurotrophin family
are expressed in a variety of non-neuronal systems including the cardiovascular,
immune, endocrine and reproductive systems (Tessarollo, 1998). The NTF4 gene is
located on the
long (q) arm of
chromosome 19
at position 13.3.
More precisely,
the NTF4 gene
is located from
base pair
49,564,396 to
base pair
49,568,234 on
chromosome 19.
This
neurotrophins
are all initially
synthesized as
larger precursors
that are
proteolytically
cleaved to release the mature neurotrophins. The neurotrophins can be distinguished
Figure 4.21 – The schematic representations of functional pathways
of identified proteins in heart (NTF4).
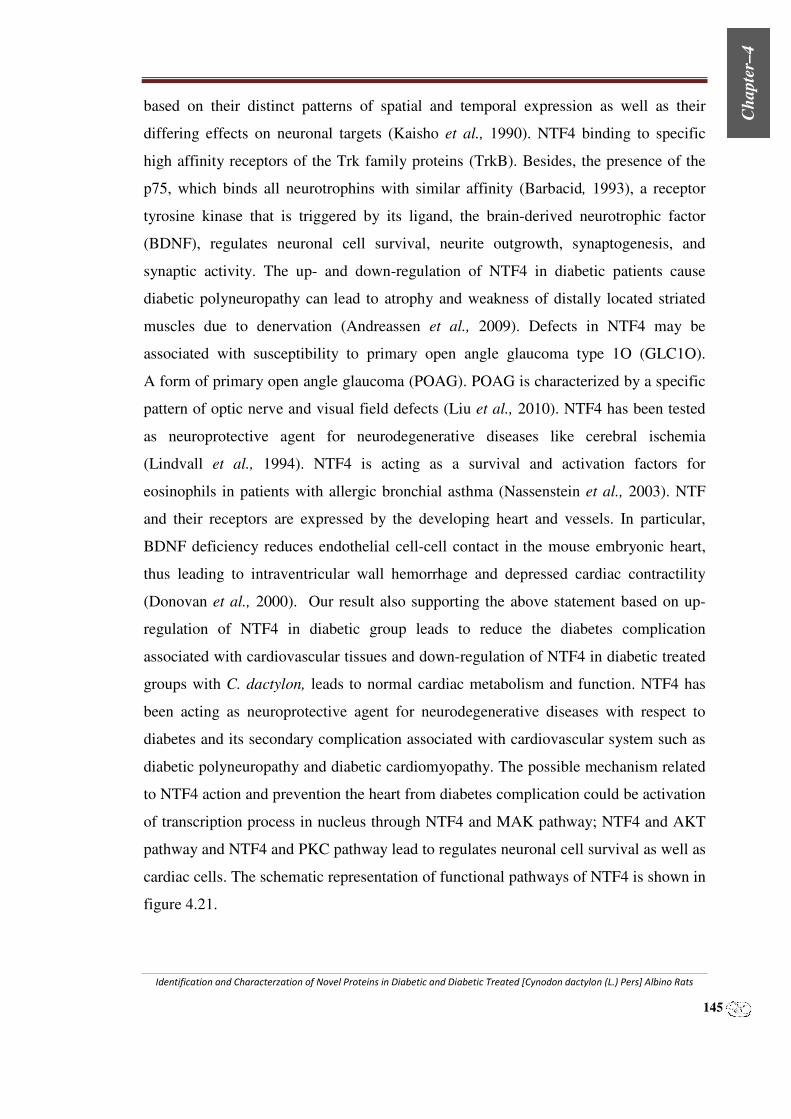
Identification and Characterzation of Novel Proteins in Diabetic and Diabetic Treated [Cynodon dactylon (L.) Pers] Albino Rats
145
Ch
ap
ter–
4
based on their distinct patterns of spatial and temporal expression as well as their
differing effects on neuronal targets (Kaisho et al., 1990). NTF4 binding to specific
high affinity receptors of the Trk family proteins (TrkB). Besides, the presence of the
p75, which binds all neurotrophins with similar affinity (Barbacid, 1993), a receptor
tyrosine kinase that is triggered by its ligand, the brain-derived neurotrophic factor
(BDNF), regulates neuronal cell survival, neurite outgrowth, synaptogenesis, and
synaptic activity. The up- and down-regulation of NTF4 in diabetic patients cause
diabetic polyneuropathy can lead to atrophy and weakness of distally located striated
muscles due to denervation (Andreassen et al., 2009). Defects in NTF4 may be
associated with susceptibility to primary open angle glaucoma type 1O (GLC1O).
A form of primary open angle glaucoma (POAG). POAG is characterized by a specific
pattern of optic nerve and visual field defects (Liu et al., 2010). NTF4 has been tested
as neuroprotective agent for neurodegenerative diseases like cerebral ischemia
(Lindvall et al., 1994). NTF4 is acting as a survival and activation factors for
eosinophils in patients with allergic bronchial asthma (Nassenstein et al., 2003). NTF
and their receptors are expressed by the developing heart and vessels. In particular,
BDNF deficiency reduces endothelial cell-cell contact in the mouse embryonic heart,
thus leading to intraventricular wall hemorrhage and depressed cardiac contractility
(Donovan et al., 2000). Our result also supporting the above statement based on up-
regulation of NTF4 in diabetic group leads to reduce the diabetes complication
associated with cardiovascular tissues and down-regulation of NTF4 in diabetic treated
groups with C. dactylon, leads to normal cardiac metabolism and function. NTF4 has
been acting as neuroprotective agent for neurodegenerative diseases with respect to
diabetes and its secondary complication associated with cardiovascular system such as
diabetic polyneuropathy and diabetic cardiomyopathy. The possible mechanism related
to NTF4 action and prevention the heart from diabetes complication could be activation
of transcription process in nucleus through NTF4 and MAK pathway; NTF4 and AKT
pathway and NTF4 and PKC pathway lead to regulates neuronal cell survival as well as
cardiac cells. The schematic representation of functional pathways of NTF4 is shown in
figure 4.21.
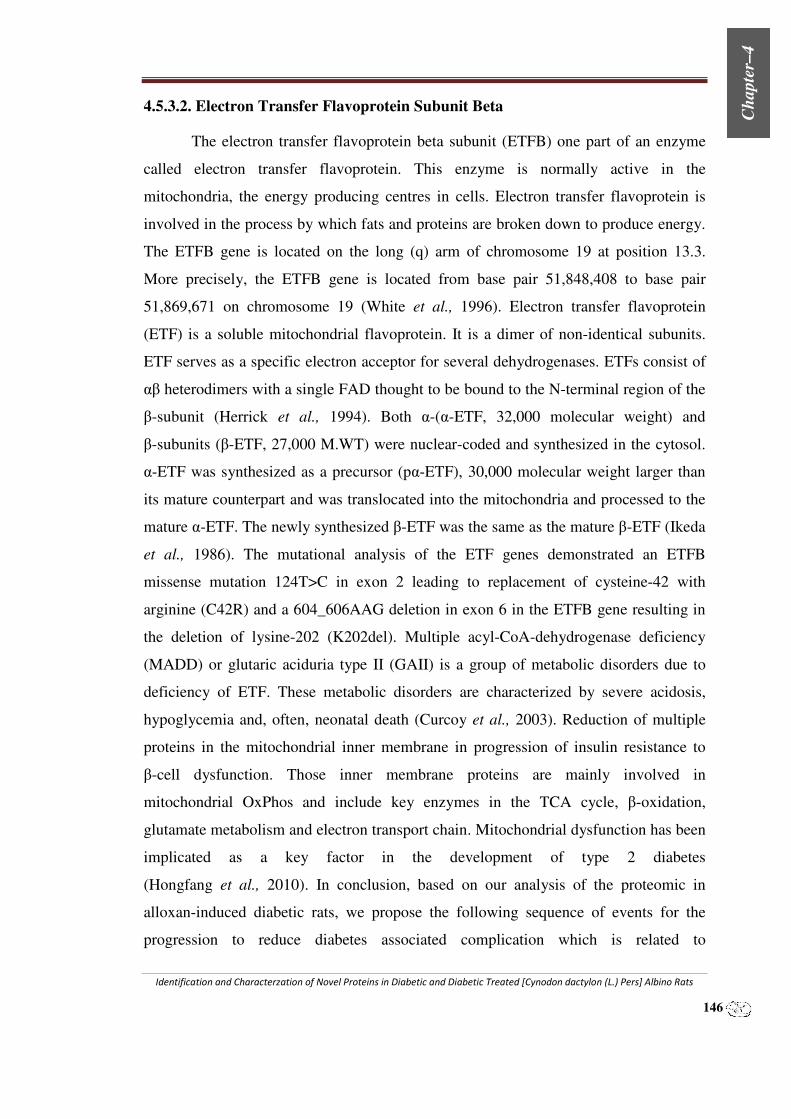
Identification and Characterzation of Novel Proteins in Diabetic and Diabetic Treated [Cynodon dactylon (L.) Pers] Albino Rats
146
Ch
ap
ter–
4
4.5.3.2. Electron Transfer Flavoprotein Subunit Beta
The electron transfer flavoprotein beta subunit (ETFB) one part of an enzyme
called electron transfer flavoprotein. This enzyme is normally active in the
mitochondria, the energy producing centres in cells. Electron transfer flavoprotein is
involved in the process by which fats and proteins are broken down to produce energy.
The ETFB gene is located on the long (q) arm of chromosome 19 at position 13.3.
More precisely, the ETFB gene is located from base pair 51,848,408 to base pair
51,869,671 on chromosome 19 (White et al., 1996). Electron transfer flavoprotein
(ETF) is a soluble mitochondrial flavoprotein. It is a dimer of non-identical subunits.
ETF serves as a specific electron acceptor for several dehydrogenases. ETFs consist of
αβ heterodimers with a single FAD thought to be bound to the N-terminal region of the
β-subunit (Herrick et al., 1994). Both α-(α-ETF, 32,000 molecular weight) and
β-subunits (β-ETF, 27,000 M.WT) were nuclear-coded and synthesized in the cytosol.
α-ETF was synthesized as a precursor (pα-ETF), 30,000 molecular weight larger than
its mature counterpart and was translocated into the mitochondria and processed to the
mature α-ETF. The newly synthesized β-ETF was the same as the mature β-ETF (Ikeda
et al., 1986). The mutational analysis of the ETF genes demonstrated an ETFB
missense mutation 124T>C in exon 2 leading to replacement of cysteine-42 with
arginine (C42R) and a 604_606AAG deletion in exon 6 in the ETFB gene resulting in
the deletion of lysine-202 (K202del). Multiple acyl-CoA-dehydrogenase deficiency
(MADD) or glutaric aciduria type II (GAII) is a group of metabolic disorders due to
deficiency of ETF. These metabolic disorders are characterized by severe acidosis,
hypoglycemia and, often, neonatal death (Curcoy et al., 2003). Reduction of multiple
proteins in the mitochondrial inner membrane in progression of insulin resistance to
β-cell dysfunction. Those inner membrane proteins are mainly involved in
mitochondrial OxPhos and include key enzymes in the TCA cycle, β-oxidation,
glutamate metabolism and electron transport chain. Mitochondrial dysfunction has been
implicated as a key factor in the development of type 2 diabetes
(Hongfang et al., 2010). In conclusion, based on our analysis of the proteomic in
alloxan-induced diabetic rats, we propose the following sequence of events for the
progression to reduce diabetes associated complication which is related to

Identification and Characterzation of Novel Proteins in Diabetic and Diabetic Treated [Cynodon dactylon (L.) Pers] Albino Rats
147
Ch
ap
ter–
4
cardiovascular diseases (CVD) and coronary heart disease (CHD). Interestingly, many
of the observed up- and down-regulated proteins were reduced CVD and CHD occurred
just before overt hyperglycemia due to administration of C. dactylon leaves extract and
therefore suggest that improving heart function may improve diabetes management.
4.5.4. Identification and Characterization of Liver Proteomes
4.5.4.1. Cell Proliferation-Related Protein
Nucleophosmin (NPM) has been found in the nucleoli of somatic cells
(Burns et al., 2003) and nucleophosmin is an abundantly expressed multifunctional
nucleolar phosphoprotein. A unified mechanism for NPM’s role in cell growth has
recently been proposed; namely, that NPM directs the nuclear export of both 40S and
60S ribosomal subunits (Maggi et al., 2008). Transduction of NPM shuttling-defective
mutants or loss of NPM1, inhibits nuclear export of both the 40S and 60S ribosomal
subunits, reduces the available pool of cytoplasmic polysomes and diminishes overall
protein synthesis without affecting rRNA processing or ribosome assembly. NPM may
normally act to shuttle RNAs and ribosomal subunits to the cytosol, possibly by
interacting with cis acting sequences on the 3′-UTRs of RNA. These results suggest
that, NPM presumably has functions such as ribosome biogenesis, centrosome
duplication, cell proliferation and tumor suppression (Grisendi et al., 2005; Lim and
Wang, 2006) and plays a role as a cytoplasmic/nuclear shuttle protein
(Yun et al., 2003). In conclusion, the results of our study indicate that, liver cells were
considerable loss of skeletal structure and proteins (necrosis) in type 1 diabetic
condition. NPM may involve in the ribosome biogenesis, centrosome duplication and
cell proliferation to balance the loss of skeletal cell in liver in diabetic condition. Upon
the treatment with C. dactylon leads to down-regulation of NPM in both diabetic
treated groups that direct the cell proliferation, centrosome duplication and tumor
suppression to retain liver morphology through normal metabolic pathway.
4.5.4.2. Metabolism-Related Proteins
We also found up-regulation of L-Xylulose reductase (XR; EC 1.1.1.10)
belongs to a group of enzymes comprising the glucuronic acid/ uronate cycle of glucose
metabolism, which accounts for approximately 5 % of the total glucose catabolism per

Identification and Characterzation of Novel Proteins in Diabetic and Diabetic Treated [Cynodon dactylon (L.) Pers] Albino Rats
148
Ch
ap
ter–
4
day (Hollmann and Touster, 1964). The enzyme catalyses the NADPH-linked reduction
of l-xylulose to xylitol as well as that of several types of pentoses, tetroses and trioses
(Ishikura et al., 2001). Since XR also efficiently reduces various alpha-dicarbonyl
compounds including endogenous diacetyl, it is called dicarbonyl/L-xylulose reductase
and is identical to diacetyl reductase (EC 1.1.1.5). The enzyme is highly expressed in
rat liver and has been shown to be localized in the brush-border membranes of proximal
tubular cells of the mouse kidney, suggesting a role for the enzyme in water
re-absorption and cellular osmo-regulation by producing xylitol (Nakagawa et al.,
2002). Moreover, enzymes of the glucuronic acid pathway are present in mammalian
lens and the flux of sugars and xylitol through this pathway has been suggested to be
involved in the osmo-regulation process of the lens and the etiology of sugar cataracts
(Goode et al., 1996). XR is up-regulated and deteriorates the apoptotic signaling
through the generation of reactive oxygen species (Matsunaga et al., 2008). Recently,
XR was identified as a biomarker for prostate cancer and may contribute to melanoma
progression (Cho-Vega et al., 2007). In diabetic condition, glucose level is more in
blood due to lack insulin. The carbohydrate metabolism such as glycolysis, krebs cycle
and HMP shunt were up less active in liver cell due to lack insulin. The lack insulin
leads to reduced glucose transport into cell and in turn direct increases of blood glucose
level. The up-regulation of XR in diabetic condition leads to decrease the blood glucose
level slowly through glucuronic acid/uronate pathway hence plays an important role in
reducing of severity of diabetes mellitus.
4.5.4.3. Acid–Base Balance Related Protein
In this study, we also identified carbonic anhydrases (CA III; EC 4.2.1.1) are
evolutionarily ancient enzymes, which are expressed in most normal mammalian
tissues. CA is zinc-containing enzymes that catalyze the reversible hydration of carbon
dioxide and perform essential functions in regulation mechanisms to maintain osmo-
regulation in liver tissues (Fisher et al., 1996; Premkumar et al., 2003). CA is found in
many organs, being important in a variety of biological activities including acid-base
balance, CO2 transfer and ion exchange. However, the functional roles of CA III are
unknown. It is abundant in skeletal muscle, where it comprises about 8% of the
cytosolic protein in rat (Carter et al., 1991). It is a major soluble protein in rat liver

Identification and Characterzation of Novel Proteins in Diabetic and Diabetic Treated [Cynodon dactylon (L.) Pers] Albino Rats
149
Ch
ap
ter–
4
from sexually mature males but is almost absent in females. Administration of
androgens to females induces expression in their liver, while administration of growth
hormone to males represses synthesis to the female level (Jeffery et al., 1991). This
sexual dimorphism is mediated at the mRNA level (Kelly et al., 1988). It is specific to
liver, with both male and female muscle having comparable levels. The initially high
level of liver CA III decreases during aging of the male. A second distinguishing
characteristic of CA III is that it has inherent phosphatase activity. The domain
responsible for phosphatase activity has not been defined, but it has been distinguished
from the regions responsible for hydratase and esterase activity
(Koester et al., 1981; Eriksson and Liljas, 1993). In general, water–CO2 balance and
acid–base balance would be imbalanced in diabetic condition due to hyper-osmolarity
(glucose). Speculated in this study, the up-regulation of CA III might have an important
role in water–CO2 balance and acid–base balance, which is very critical in the diabetes
mellitus to normalize the glucose hyper-osmolarity and to maintain the normal
metabolic function of hepatic cell.
4.5.5. Identification and Characterization of Kidney Proteomes
4.5.5.1. Transforming Protein RhoA
RhoA is a member of the Rho GTPase family of proteins that consists of Rho
(A, B and C isoforms), Rac (1, 2 and 3 isoforms), Cdc42 (Cdc42Hs and
G25K isoforms), RhoD, RhoE, RhoG, RhoH, TC10, Rho6/Rnd1, Rho7/Rnd2 and
Rho8/Rnd3 (Aznar and Lacal, 2001). To date, 20 genes encoding different members of
the Rho family have been identified in the human genome, and each one acts as a
molecular switch to control distinct biochemical pathways. The RhoA gene is located
on the long (p) arm of chromosome 3 at position 21.3. More precisely, the RhoA gene
is located from base pair 49,396,578 to base pair 49,450,431 on chromosome 3
(Longenecker et al., 2003).
RhoA is activated by a variety of growth factors, cytokines, adhesion
molecules, hormones, integrins, G-proteins and other biologically active substances.
The major activator of RhoA is GPCR (G-Protein coupled Receptor). GPCRs that
activate RhoA and use G-α11, G-α12 or G-αI for signal transduction include receptors
for LPA (Lysophosphatidic Acid) and certain hormones (Ridley, 1997).

Identification and Characterzation of Novel Proteins in Diabetic and Diabetic Treated [Cynodon dactylon (L.) Pers] Albino Rats
150
Ch
ap
ter–
4
EphA (EphrinA) receptors can also directly activate RhoA through ephexin. IGF
(Insulin-Like Growth Factor) can also activate RhoA indirectly. Upon binding with
IGF1/2, IGF1R (Insulin-Like Growth Factor-I Receptor) forms a complex with LARG
(Leukemia-Associated RhoGEF-12), which in turn activates RhoA. RhoA is also
activated by Ktn1 (Kinectin-1). Upon activation, RhoA interacts with and regulate a
spectrum of functionally diverse downstream effectors, initiating a network of
cytoplasmic and nuclear signaling cascade (Wing et al., 2003). Rho cycles between the
GDP-bound inactive form located in the cytoplasm and the GTP-bound active form in
the cell membrane (Hall, 1994). RhoA interacts with a number of target proteins such
as PAK (p21-Activated Kinase) family, Rho-kinase/ROK/ROCK (Rho-Associated
Coiled-Coil-Containing Protein Kinase), MBS (Myosin-Binding Subunit) of myosin
phosphatase), PKN (Protein Kinase-N)/PRK-1, rhophilin, rhotekin, citron, and GDIA,
which then mediates a central role in diverse biological processes such as actin
cytoskeleton organization, microtubule dynamics, gene transcription, oncogenic
transformation, cell cycle progression, adhesion and epithelial wound repair
(Nishiyama et al., 1994; Jalink et al., 1994).
The kidney is a major site of diabetic microvascular complications, with
diabetes being the leading cause of renal failure in the Western world. Glomerular
matrix accumulation is the pathologic hallmark of diabetic nephropathy and
hyperglycemia is a primary pathogenetic factor in diabetic renal disease (Mason and
Wahab, 2003). Glucose-induced expression of transforming growth factor-β (mediated
by AP-1) and connective tissue growth factor (CTGF) mRNA were up-regulated and
Rho activity was enhanced in the renal cortex of diabetic rats. Rho/ROCK pathway is
involved in up-regulation of TGF-β and CTGF to cause excess matrix synthesis in
diabetic kidney (collagen synthesis) and plays an important role in the pathogenesis of
diabetic nephropathy (Hubchak et al., 2003). Finally, reactive oxygen species, thought
to play a central role in the pathogenesis of diabetic nephropathy (Whiteside, 2005).
Treatment with fasudil decreased the matrix accumulation and fibronectin upregulation
seen in diabetic glomeruli. ROCK inhibition (fasudil) protected the kidney from
diabetic nephropathy (Komers et al., 2010). In this study, over-expression of RhoA
(diabetic group) cause excess matrix synthesis in diabetic kidney (collagen synthesis)

Identification and Characterzation of Novel Proteins in Diabetic and Diabetic Treated [Cynodon dactylon (L.) Pers] Albino Rats
151
Ch
ap
ter–
4
and plays an important role in the pathogenesis of diabetic nephropathy.
C. dactylon treatment reduced renal ROCK activity and ameliorated diabetes-induced
structural changes in the kidney and expression of the molecular markers in association
with a modest proteinuria and glucosuria. Thus, RhoA activates were down regulated in
diabetic treated group leads to reduce the activity of ROCK and interns protect the
kidney from diabetic nephropathy and its complication.
4.5.5.2. Ras-Related Protein Rab-4A
Rab (Rab4A) proteins form the largest group within the Ras superfamily of
small GTPases, which function as molecular switches by cycling between their inactive
GDP–bound and active GTP–bound forms (Pfeffer and Aivazian, 2004). Human cells
express more than 60 different Rab GTPases that regulate intracellular trafficking and
maintain organelles identity by controlling budding, transport, tethering, docking and
fusion of vesicular intermediates. Thus, Rab GTPases oversee the vectorial transport of
proteins and membranes between organelles (Zerial and McBride, 2001). Rab4-interact
with many proteins including rabaptin 4, syntaxin 4, Rab4-interacting protein (Rab4ip)
and the dynein light intermediate chain 1 (dynein LIC-1), Rabphilin-11/Rab11BP,
Rip11/pp75, and myosin Vb.The interacting partner of Rab4 and Rab11, with many
analogies to its related proteins such as pp75/Rip11 and the Rab-FIPs. Rab5/rabaptin
5/Rab4 molecular network and the Rab4/RCP/Rab11 net work serve to link-up or
couple the endosomal-trafficking machinery (Andrew et al., 2002). Rab4 was found to
be associated with early endosomes and playing a role in their sorting and recycling
(Van der Sluijs al., 1992). Rab4 is also implicated in the regulation of the recycling of
internalized receptors back to the plasma membranes (Daro et al., 1996). Furthermore,
Rab4 seems to have a specialized role in receptor-mediated antigen processing in
B-lymphocytes (Lazzarino et al., 1998), in calcium-induced a-granule secretion in
platelets (Shirakawa et al., 2000) and in a-amylase exocytosis in exocrine pancreatic
cells (Ohnishi et al., 2000). Rabs plays a critival role in regulation of GPCR
[angiotensin II type 1 receptor (AT1R)] redistribution into different intracellular
compartments. Different Rab isoforms regulate different aspects of intracellular
trafficking such as internalization (Rab5), recycling (Rab4 and Rab11) and degradation
(Rab7), for GPCRs through certain Rab pathways (Esseltine et al., 2011).

Identification and Characterzation of Novel Proteins in Diabetic and Diabetic Treated [Cynodon dactylon (L.) Pers] Albino Rats
152
Ch
ap
ter–
4
The regulation of glucose uptake, utilization and storage by tissues is critical to
maintaining blood glucose homeostasis. Insulin increases glucose re-absorption, which
express the GLUT2 isoform of the glucose transporter (Bakhteeva et al., 1985). Rab4
and the SNARE proteins thus play essential roles in exocytosis of the GLUT4
containing vesicles in adipocytes and muscles (in insulin-induced GLUT4
translocation). t-SNARE (syntaxin 4) protein seems to play a pivotal role in the
formation of the SNARE complex. Syntaxin 4 is one of the targets for Rab4 and the
interaction of GTP-bound Rab4 with syntaxin 4 may be critical for docking and/or
fusion of the GLUT4-containing vesicles with the plasma membrane (Lu et al., 2001).
Rab4-KIF3 interaction, which facilitates the exocytotic movement of GLUT4 proteins,
provides a balanced picture of exocytosis and endocytosis in which Rab proteins
participate in the coupling of motor proteins to their cargo to facilitate GLUT4
translocation to and from the cell surface under the influence of insulin
(Takeshi et al., 2003). The up-regulation of RAB4A in diabetic group leads to increases
the cell-surface expression of GLUT2 leads to increases renal glucose re-absorption
because hyperglycemia causes glucosuria. It is unclear for us to elucidate the function
of RAB4A associated GLUT2 expression, because glucose re-absorption through
GLUT2 increases the blood glucose level. Hereby, we have concluded that, RAB4A
increases the cell-surface expression of GLUT2 due to hyperglycemia. The over-
expression of RAB4A leads to uneven distribution and function of
intracellular–vesicular transport causing accumulation of protein inside the renal cell,
this result in renal disease. C. dactylon treatment reduced or down-regulated renal
RAB4A activity directs to decrease the diabetes-induced renal complication and
normalize the expression of GLUT2.
4.5.5.3. Ras-Related Protein Rab-43
RAB43 belongs to the family of Ras-related, small GTPase proteins, which are
considered intracellular membrane organizers as they orchestrate vesicle traffic within
cells (Zerial & McBride, 2001). The protein transport between the ER and Golgi
complex requires the coordinated action of many different small GTP-binding proteins
of the Ras superfamily, each controlling distinct aspects of the cargo sorting, vesicle
formation and vesicle fusion processes (Bonifacino and Glick, 2004). The Rab43 gene

Identification and Characterzation of Novel Proteins in Diabetic and Diabetic Treated [Cynodon dactylon (L.) Pers] Albino Rats
153
Ch
ap
ter–
4
is located on the long (q) arm of chromosome 3 at position 21.3. More precisely, the
Rab43 gene is located from base pair 128,806,412 to base pair 128,841,644 on
chromosome 3. Vesicle formation is need recruitment of many protein such as COPII,
COPI and Rab. Rabs recruit protein complexes important for directed vesicle
movement and target recognition. To do this, these proteins cycle between a GDP-
bound inactive state to GTP-bound membrane-associated active state and vice versa
(Waters and Hughson, 2000). Rab43 plays an essential role in anterograde trafficking
of cargo from the ER to the Golgi. Rab43 regulates dynein/dynactin or similar proteins
required for interaction between pre-Golgi intermediates and microtubules (Burkhardt
et al., 1997). Rab43 also regulates retrograde trafficking from endosomes to Golgi
(Dejgaard et al., 2008). The over-expression of RAB43 leads to uneven distribution and
function of intracellular–vesicular transport causing accumulation of protein inside the
cell. C. dactylon treatment reduced or down-regulated renal RAB43 activity directs to
decrease the diabetes-induced renal complication.
4.5.6. Identification and Characterization of Spleen Proteomes
4.5.6.1. Ca2+
-Binding Protein p22
Ca2+-binding protein p22 or calcineurin homologous protein-1 (CHP-1),
a widely expressed and evolutionary conserved Ca2+-binding protein, is among the less
well-characterized members of the EF-hand superfamily. They are many EF-hand
protein widely expressed in cell like calmodulin, calcineurin B and p22, are mainly
involved in rapid cellular responses to Ca2+ fluctuations and regulate various general
cellular functions (Barroso et al., 1996). p22 shares extensive amino acid sequence
homology with calcineurin B, the regulatory subunit of protein phosphatase 2B and less
homology with other members of the EF-hand superfamily, such as recoverins,
centrins, calmodulins or cdc31 (Lin and Barber, 1996). The p22 gene is located on the
long (q) arm of chromosome 15 at position 15.1. More precisely, the p22 gene is
located from base pair 41,523,342 to base pair 41,574,088 on chromosome 15 (Aizawa
et al., 1990). p22 plays a role in membrane trafficking associates with microtubules.
The association of p22 with microtubules requires the N-myristoylation of p22 but does
not involve p22’s Ca2+-binding activity, suggesting that the p22–microtubule
association and the role of p22 in membrane traffic are functionally related, because N-

Identification and Characterzation of Novel Proteins in Diabetic and Diabetic Treated [Cynodon dactylon (L.) Pers] Albino Rats
154
Ch
ap
ter–
4
myristoylation is required for both events (Sandy et al., 1999). p22 might act directly in
membrane traffic or alternatively, it uses conformational changes to transduce cellular
Ca2+ signals to other proteins involved in membrane trafficking (formation of v-
SNARE–t-SNARE complexes) (Margarida et al., 1996). Ca2+-binding protein that
interacts specifically with the integrin αIIb subunit cytoplasmic domain. Integrin-
mediated adherence of cells to extracellular matrix is important for a variety of
physiological processes, such as haemostasis, angiogenesis and cell differentiation
(Ulhas et al., 1997). Calcineurin is a broadly distributed phosphatase that plays diverse
roles in addition to T-cell activation, including the regulation of axonal guidance, the
Ca2+-dependent migration of neutrophils and the possible involvement in cardiac
hypertrophy. p22 bind to the catalytic calcineurin subunit and inhibit phosphatase
activity (Xia et al., 1999). Ca2+-binding protein employs 3 γ-carboxyglutamic acid
(Gla) residues for tight adsorption to hydroxyapatite mineral surfaces in bone matrix
(Dowd et al., 2003). Ca2+-binding protein also involved in calcium-dependent signal
transduction processes, such as cyclic nucleotide metabolism, neurotransmitter release,
modulation of ion channel function and regulation of gene expression
(Christina et al., 2002).
Maintaining intracellular pH and osmolarity is necessary for diverse cellular
functions including differentiation, proliferation and regulation of cell volume or shape
(Bowers et al., 2000). NHE1/SLC9A1 (Na+/H+-Exchanger 1/solute carrier family 9A1)
is a ubiquitous isoform of vertebrate NHE1 functioning in maintaining intracellular
concentrations of Na+ and H+ ions. p22 binds to the hydrophilic region of NHE1 and
regulates NHE1 activity but reportedly does not play a role in translocating NHE1 from
the endoplasmic reticulum to the plasma membrane (Masafumi et al., 2007). The
Na+/H+ Exchanger 3 (NHE3) are essential for regulation of Na+ transport in the renal
and intestinal epithelium. p22 controls the transport activity and surface protein
abundance of NHE3 (Francesca et al., 2009). Therefore, CHP1 is thought to be a multi-
potent regulatory protein. In this study, down-regulation of p22 (diabetic group) cause
secondary diabetic complication in spleen, which is mainly related to immune system
because spleen is mostly involved in T-lymphocyte synthesis. Our data extrapolation is
however limited by the fact that the, these results suggest that p22 were up-regulated in

Identification and Characterzation of Novel Proteins in Diabetic and Diabetic Treated [Cynodon dactylon (L.) Pers] Albino Rats
155
Ch
ap
ter–
4
diabetic treated group by the administration of C. dactylon leaves extract, is involved in
the spleen cell homeostasis metabolic function and are in agreement with above studies.
4.5.6.2. Aldose Reductase
Aldose reductase (AR) or aldehyde reductase (EC 1.1.1.21) is the first and rate-
limiting enzyme of the polyol pathway, is an NADPH-dependent oxidoreductase that
catalyzes the reduction of a variety of aldehydes and carbonyls, including
monosaccharides. It is primarily known for catalyzing the reduction of glucose to
sorbitol (Petrash, 2004). AR consists of 316 residues, weights 36 kDa and the crystals
have a 43% solvent content. It folds as an eight-stranded β/α barrel with a small β-sheet
on the N-terminus (residues 2-14) and a C-terminal extension (residues 275-315). The
active site is located on the C-terminus of the barrel and the NADP-binding site is near
the hydrophobic active site pocket (El-Kabbani et al., 1998). The catalytic residues of
the active site are Lys77, His110 and Tyr48 (which most likely acts as proton donor,
(Bohren et al., 1994)) together with the nicotinamide moiety of the cofactor NADPH.
The AR gene is located on the long (q) arm of chromosome 7 at position 33. More
precisely, the p22 gene is located from base pair 134,127,107 to base pair 134,144,036
on chromosome7. AR may contribute to blood-retinal barrier breakdown. AR
deficiency also prevented diabetes-induced reduction of platelet/endothelial cell
adhesion molecule-1 expression and increased expression of vascular endothelial
growth factor, which may have contributed to blood-retinal barrier breakdown
(Alvin et al., 2005). Genetic factors are implicated in the development of diabetic
retinopathy, and the AR (Z-2 allele of the AR) gene is a candidate gene for the
development of diabetic retinopathy in patients with type 2 diabetes
(Mojca et al., 2005). The inhibition of AR dramatically attenuates LPS-induced
cytokine production in vitro and in vivo suggests that modulation of lipid aldehyde
reduction could provide a cellular approach for preventing the maladaptive host
response to bacterial infections and other NF-kB-dependent cellular events (Release of
Inflammatory Mediators in RAW264.7) (Kota et al., 2006). AR is thought to be
involved in the pathogenesis of various diseases associated with diabetes mellitus, such
as cataract, retinopathy, neuropathy and nephropathy (Horace et al., 2000). A variety of

Identification and Characterzation of Novel Proteins in Diabetic and Diabetic Treated [Cynodon dactylon (L.) Pers] Albino Rats
156
Ch
ap
ter–
4
compounds that inhibit Aldose Reductase have been investigated for many years such
as tolrestat, epalrestat, ranirestat and Fidarestat (Megha et al., 2008).
AR responsible for synthesizing fructose in the seminal vesicle to be used as the
main energy source for sperm motility, because fructose is converted from sorbitol by
the enzyme sorbitol dehydrogenase (SORD) (Hers, 1956). AR can efficiently reduce
methyglyoxal, 4-hydroxynonenal and 3-deoxyglucosone, suggesting that it may be
responsible for detoxification of these and other harmful metabolites
(Vander et al., 1995). Another postulated function of ALR2 is osmoprotection in the
kidney (Bagnasco et al., 1987). AR is mainly contribution as antioxidant defenses as
well as the development of secondary diabetic complications (Satish et al., 2005).
Inhibition of AR has been shown to prevent the development of diabetic complications
in animal models; however, a critical evaluation of the clinical efficacy of AR
inhibitors awaits a clearer understanding of the role of AR in regulating inflammation
and cell growth. More selective and effective inhibitors are needed to specifically
inhibit the cytotoxic role of AR in cell signaling without affecting its detoxification and
antioxidant role. Such inhibitors are likely to be more effective in treating secondary
diabetic complications by preventing inflammation due to chronic hyperglycemia. In
our study, AR was down-regulated in diabetic group as compared with control and AR
was normalized in diabetic treated group as compared with diabetic group by the
administration of C. dactylon leaves extract. This AR concentration was brought to
normal level by the effect C. dactylon leaves extract, may be effetely involved in
treating secondary diabetic complications by preventing inflammation due to chronic
hyperglycemia.
4.5.6.3. 78-kDa Glucose-Regulated Protein (GRP78)
78 kDa glucose-regulated protein (GRP-78) also known as Binding
immunoglobulin protein (BiP) or heat shock 70 kDa protein 5 (HSPA5) is a HSP70
molecular chaperone located in the lumen of the endoplasmic reticulum (ER), that
binds newly-synthesized proteins as they are translocated into the ER and maintains
them in a state competent for subsequent folding and oligomerization (Ting and Lee,
1988). Glucose-regulated protein name is derived, when Chinese hamster K12 cells are

Identification and Characterzation of Novel Proteins in Diabetic and Diabetic Treated [Cynodon dactylon (L.) Pers] Albino Rats
157
Ch
ap
ter–
4
starved of glucose, the synthesis of several proteins, called glucose-regulated proteins
(GRPs), is markedly increased. Hendershot et al. pointed out that one of these, GRP78
(Hendershot et al., 1994). GRP78 was originally termed immunoglobulin heavy chain
binding protein (BiP) and is now known to have a crucial role in the assembly of ER
proteins and protein complexes and the unfolded protein response (Dudek et al., 2009).
Extensive research indicates that a major function of some GRP78 is that of a
molecular chaperone. The nucleotide-binding domain of GRP78 interacts with ATP; its
substrate-binding domain can interact with unfolded/misfolded protein. Subsequent
ATP hydrolysis acts to strengthen the interaction between GRP78 and the
unfolded/misfolded protein (Juliann and George, 1998). Under these conditions protein
disulfide isomerase (PDI) can then work to promote disulfide reduction, rearrangement,
and reoxidation until the correct protein conformation is achieved. ADP/ATP exchange
ends the interaction of GRP78 with the protein and thus PDI's work is halted as well
(Mayer et al., 2000). GRP78 is linked to a number of diseases including infectious
diseases, inherited diseases and several types of cancer. GRP78 expression is
dramatically enhanced under a variety of stressful conditions including glucose
deprivation, treatment with Ca2+-ionophores, blockage of glycosylation, oxidative
stress and hypoxia (Min et al., 2001). Nerve injuries lead to metabolic and
morphological changes and accumulation of ER unglycosylated proteins in the cell
bodies of the neurons. GRP78 recognizes and binds malfolded or aberrantly
glycosylated polypeptides in neurons leads to motoneuron regeneration
(Teresa et al., 1997). GRP78 has been secreted by oviductal cells in response to
spermatozoa and it has been shown to associate to the sperm surface and has been
implicated in the fertilization process (Spinaci et al., 2005). GRP78 as a potential target
for enhancing chemosensitivity in melanoma. Unfolded protein response (UPR) plays
an important part in protection of melanoma cells against cytotoxic effects of cisplatin
and adriamycin. This is mediated, at least in part, by GRP78-mediated inhibition of
caspase-4 and -7. Inhibition of GRP78 by small-interference RNA (siRNA) sensitized
melanoma cells direct to enhancing chemosensitivity in melanoma (Chen et al., 2009).
GRP78 may provide novel means to suppress scavenger receptors-A (SR-A) function
in macrophages. As an “inhibitory” protein for SR-A, GRP78 may play a role in
attenuating atherosclerotic development, as it inhibits cellular uptake of lipid and also

Identification and Characterzation of Novel Proteins in Diabetic and Diabetic Treated [Cynodon dactylon (L.) Pers] Albino Rats
158
Ch
ap
ter–
4
prevent the atherosclerotic process (Jingjing et al., 2009). GRP78 is highly expressed in
various cancers. GRP78 actively regulates multiple malignant phenotypes, including
cell growth, migration and invasion. Knockdown of GRP78 by siRNA significantly
reduced cell growth and colony formation (Ching et al., 2008). GRP78 is not only
resident in the ER, but also exists on the cell surface i.e. GRP78 associates with MHC
class I on the cell surface. Its presence on the cell surface is not dependent on MHC
class I expression. In the absence of MHC class I its cell surface expression is
unregulated (Martha et al., 2001). GRP78 expression is induced by TCR activation via
a Ca2+-dependent pathway and may play a critical role in maintaining T cell viability in
the steady and TCR-activated (cell antigen receptor) states. These results suggest a
novel regulatory mechanism and an essential function of GRP78 in T cells
(Shinichi et al., 2008). The spectacular of our study is, GRP78 was down-regulated in
diabetic group as compared with control and GRP78 was normalized in diabetic treated
group as compared with diabetic group by the administration of C. dactylon leaves
extract. The major function of GRP78 is that of a molecular chaperone and also inhibits
cellular uptake of lipid, neuron regeneration and binding to immunoglobulin and
immune cell, target for cancer therapy and marker for many cancer. The major
complications related to diabetes like coronary artery disease, neuropathy, nephropathy,
retinopathy obesity and Atherosclerosis. GRP78 concentration were brought to normal
level by the effect C. dactylon leaves extract, may be effetely involved in prevention of
secondary diabetic complications.
4.5.6.4. Coactosin-Like Protein (CLP)
CLP (Coactosin-Like Protein) is similar to coactosin, a member of the ADF
(actin-depolymerizing factor)/cofilin group of actin-binding proteins. A 16 kDa actin-
binding protein originally isolated from Dictyostelium (de Hostos and Bradtke, 1993)
but since found in humans where it has been discovered to be a binding partner for 5-
Lipoxygenase (5-LO) an enzyme pivotally involved in the production of leukotrienes
from arachidonic acid. 5-LO is itself an actin-binding protein (Lepley and Fitzpatrick,
1994). The human version of coactosin is named CLP, an F-actin but not a G-actin
binding protein (Provost et al., 2001a) that apparently inhibits the capping activity of
CapZ, despite the fact that CLP itself does not alter the kinetics of actin polymerization

Identification and Characterzation of Novel Proteins in Diabetic and Diabetic Treated [Cynodon dactylon (L.) Pers] Albino Rats
159
Ch
ap
ter–
4
(Rohrig et al., 1995). Coactosin and CLP both show homology to the ADF/cofilin
family and yet it contains a LKKAET -like motif found in other actin-binding proteins
that in the case of CLP is responsible for binding 5-LO. Lysine 75 has been found to
be important for the binding of actin (Provost et al., 2001b). The CLP peptides might
be appropriate vaccine candidates for peptide-based specific immunotherapy of HLA-
A2+ cancer patients, because CLP peptides those were capable of propagating HLA-
A2-restricted and tumor reactive cytotoxic T lymphocytes (Tetsuya et al., 2002). CLP
found as a sequence flanking a deletion on the human chromosome 17 characterizing
the Smith-Magenis syndrome. CLP gene encodes a protein composed of 142 amino
acid residues with a molecular mass of 16 kDa (Chen et al., 1997).
CLP play central roles in regulate the actin cytoskeleton in tissues and also
functioning as a chaperone for 5-LO, stabilizing 5-LO in the resting cell and
functioning as a scaffold during Ca2+-induced 5-LO activity (Julia et al., 2010). In
general, diabetes leads to many secondary complication like coronary artery disease,
neuropathy, nephropathy, retinopathy, obesity and cytoskeleton changes (Shimoni and
Rattner, 2001). The down-regulation of CLP in diabetic condition as compared with
control may cause cytoskeleton changes due to apparently interfering with actin
polymerization. Leukotrienes play central roles in immune response and tissue
homeostasis. However, abnormal production of leukotrienes contributes to a variety of
diseases like iinflammation in asthma and allergic rhinitis. Leukotrienes syntheses were
increased in diabetic condition due to hyperglycemia (glucose increases synthesis of
leukotrienes) and its cause inflammation in many organs i.e. eyes-retina (retinopathy)
(Talahalli et al., 2010). CLP is binding partner for 5-LO an enzyme pivotally involved
in the production of leukotrienes from arachidonic acid. CLP was down-regulated in
diabetic condition as compared with control. Leukotrienes syntheses were increased in
diabetic condition due to hyperglycemia and associated with CLP function, but the
exact mechanism is unknown. CLP was normalized in diabetic treated group as
compared with diabetic group by the administration of C. dactylon leaves extract. This
may leads to normal function of CLP i.e. Leukotrienes synthesis linked with 5-LO and
actin polymerization linked with cytoskeleton is cell.

Identification and Characterzation of Novel Proteins in Diabetic and Diabetic Treated [Cynodon dactylon (L.) Pers] Albino Rats
160
Ch
ap
ter–
4
4.5.7. Identification and Characterization of Muscle Proteomes
4.5.7.1. Metabolism Related Protein
Glycolysis is the most important source of energy in all cells and working
muscles. The defect of glycolysis pathway (lack of glucose) can cause hemolytic
anemia, neurologic abnormalities and myopathy with exercise intolerance. The severity
of each of these cardinal manifestations may vary depending on the particular step in
the glycolytic pathway that is involved and on residual enzyme activity, the expression
of tissue-specific isozymes and physicochemical properties of the enzyme
(DiMauro and Tsujino, 1994; Tanaka and Paglia, 1995).
One of the major differently expressed protein was fructose 1,6-bisphosphate
aldolases (FBA, E.C. 4.1.2.13) catalyze the reversible aldol condensation of
dihydroxyacetonephosphate (DHAP) and glyceraldehyde 3-phosphate (G-3-P) in the
glycolysis, gluconeogenesis and in the Calvin cycle. The enzymes are divided into two
evolutionary convergent groups depending on the reaction mechanism (Rutter, 1964).
The Class I FBAs form a Schiff-base intermediate between the carbonyl substrate (FBP
or DHAP) and the active site lysine residue and are present in animals, plants, algae
and in certain prokaryotes (Siebers et al., 2001). The Class II FBAs are metal-
dependent, as they require a divalent metal ion to stabilize the carbanion intermediate
during catalysis. They are absent from animals and higher plants, but are found in lower
organisms such as bacteria, fungi and algae. The molecular weight of the aldolase was
39.4 kDa as single subunit and as a dimmer 79.3 kDa protein. Aldolase A deficiency
has been associated with myopathy and hemolytic anemia (Kreuder et al., 1996)
hypoglycaemic and severe abdominal symptoms after taking foods containing fructose
and cognate sugars (Manir et al., 1998). These results suggest that the up regulation of
aldolase function accelerates glycolytic pathway that in turn reduce the glucose level. It
is known that certain alkaloids and flavonoids exhibit hypoglycemic activity
(and is also known for their ability of beta cell regeneration in pancreas (Ahmad et al.,
2000). The possible mechanism of action of extract could be promote insulin secretion
by closure of K+-ATP channels, membrane depolarization and stimulation of
Ca+ influx, an initial key step in insulin secretion, this would regulate the glycolytic
pathway by up regulating activity of aldolases (Latha and Pari, 2003).

Identification and Characterzation of Novel Proteins in Diabetic and Diabetic Treated [Cynodon dactylon (L.) Pers] Albino Rats
161
Ch
ap
ter–
4
We also found up-regulation of glyceraldehyde-3-phosphate dehydrogenase
(GAPDH, EC 1.2.1.12) belongs to a group of enzymes comprising the glycolytic
pathway in glucose metabolism. GAPDH catalyzes the sixth step of glycolysis
i.e. conversion of glyceraldehyde 3-phosphate to D-glycerate 1,3-bisphosphate.
GAPDH is an abundant protein found not only in the cytosol, but also in the nucleus
(Cool and Sirover, 1989). It is a tetrameric (144 kDa) form of the enzyme, the
monomer (36 kDa) functions as a uracil DNA glycosylase (Siegler et al., 1991).
GAPDH is not only involved in energy production, but also involved in numerous
subcellular processes like transcriptional control of histone gene expression, its
essential function in
nuclear membrane
fusion, its necessity for
the recognition of
fraudulently
incorporated
nucleotides in DNA
and its mandatory
participation in the
maintenance of
telomere structure
(Sirover, 2005). The
recent implication of
GAPDH is
transcription activation,
initiation of apoptosis
and ER to Golgi vesicle
shuttling (Tarze et al.,
2007). Speculated in
this study, GAPDH is
majorly involved in
glucose metabolism. The up-regulation of this enzyme were reduced the blood glucose
by enhancing the glycolytic pathway and reduced the severity of diabetic condition.
Figure 4.22 – The schematic representations of
functional pathways of identified proteins in muscle
(FBA and GAPDH).

Identification and Characterzation of Novel Proteins in Diabetic and Diabetic Treated [Cynodon dactylon (L.) Pers] Albino Rats
162
Ch
ap
ter–
4
The schematic representations of functional pathways of identified proteins are shown
in figure 4.22.
4.5.8. Identification and Characterization of Adipose Tissues Proteomes
4.5.8.1. Transcriptional Activation and Processing Protein (P49/STRAP)
P49/STRAP is a cytoplasmic or/and perinuclear region protein expressed in
multiple tissues such as heart, brain, liver, skeletal muscle, kidney and adipose tissues.
P49/STRAP is named based on molecular weight and function, i.e. 49 kDa was named
as p49 and STRAP for SRF-dependent transcription regulation-associated protein. This
gene was later named by the Human Genome Organization (HUGO) as SRFBP1 based
on function, i.e. p49/STRAP binds to serum response factor (SRF) (Kasumi and
Richard, 2002). p49/STRAP contains 429 amino acids and has isoelectric point of 9.6
and is located in 5q23.1 of chromosome 5. P49/STRAP plays two significant roles:
(i) regulation of transcriptional activation with SRF and (ii) biosynthesis and processing
of GLUT4 or SLC2A4.
4.5.8.1.1. Regulation of Transcriptional Activation with SRF
SRF is a member of the MADS (MCM1, Agamous, Deficiens, SRF) family of
transcription factors that regulate a number of growth factor-responsive immediate-
early and cell-specific genes and also serves to regulate cell proliferation, cell size and
cell survival (Zhang et al., 2003). The activity of SRF is regulated by a novel signal
transduction pathway involving by Ras- or Rho-family GTPases. SRF forms dimers
and recruits SRF cofactors or SRF-binding proteins, when it binds to the serum
response element (SRE), which is located in the promoter region of each of its target
genes. SRF is ubiquitous transcription factor that binds to the DNA sequence
CC(A/T)6GG region (Belaguli et al., 2000). At many of its target genes, SRF forms a
ternary complex with members of a family of proteins known as ternary complex
factors (TCFs), whose activity is controlled by mitogen-activated protein kinase
(MAPK) signalling pathways (Treisman, 1994). Each of these TCF family proteins
such as Elk-1, SAP-1, Net and p49/STRAP contains a conserved 20-amino acid B box,
which mediates interaction with the SRF DNA-binding domain (Shore and Sharrocks,
1994). SRF and co-factor like p49/STRAP controls the expression of genes involved in

Identification and Characterzation of Novel Proteins in Diabetic and Diabetic Treated [Cynodon dactylon (L.) Pers] Albino Rats
163
Ch
ap
ter–
4
promoting the proliferation and differentiation of cell. Our result also supports the
above statements based on up-regulation of p49/STRAP in diabetic group that leads to
reduce the cell-surface expression of GLUT4 and other gene expression which is
related to glucose metabolism and down-regulation of p49/STRAP in diabetic-treated
group with treatment of C. dactylon that leads to increase the expression of this glucose
transporter, which may contribute to enhance the glucose metabolism.
4.5.8.1.2. Biosynthesis and Processing of GLUT4 or SLC2A4
Glucose transporter 4 (GLUT4) or solute carrier family 2A4 (SLC2A4) is
expressed specifically in insulin-sensitive tissue such as adipose tissues and muscle and
plays an important role in whole-body glucose homeostasis (Watson and Pessin, 2001).
Increase in glucose levels leads to promote the insulin to involve in translocation of
GLUT4 from its intracellular storage sites to the plasma membrane. In insulin-deprived
adipose cells,
most of the
GLUT4 is
sequestered in
a vesicular
storage
compartment
(GSV) that is
morphologicall
y related to the
trans-Golgi
network
(Bryant et al.,
2002).
Nutritional
conditions such
as fasting, high
fat and obesity
lead to a
Figure 4.23 – The schematic representations of functional
pathways of identified proteins in adipose tissues (p49/STRAP
and MAPKK7).

Identification and Characterzation of Novel Proteins in Diabetic and Diabetic Treated [Cynodon dactylon (L.) Pers] Albino Rats
164
Ch
ap
ter–
4
decrease in the level of GLUT4 in adipose tissue. The cellular content of GLUT4 in
adipose tissue was decreased to 40% in obesity and 85% in diabetes conditions (Tejero
et al., 2004).
Numerous proteins have been identified in previous studies that interact and
regulate the function of GLUT4, including L-3-hydroxyacyl-coenzyme-A
dehydrogenase, fructose-1,6-bisphosphate aldolase, ubiquitin-conjugating enzyme E2I,
Fas death domain-associated protein, insulin-regulated aminopeptidase (IRAP) and
p49/STRAP (Taguchi et al., 2008). P49/STRAP is a protein that binds specifically to
the cytoplasmic N-terminus of GLUT4, i.e. acidic sequence motif in the N-terminal tail
of GLUT4 (Q7IGSED12G). In adipose cells, GLUT4-binding or the subcellular
distribution of p49/STRAP was not changed in response to insulin, indicating that this
interaction is not required for the insulin-regulated trafficking of GLUT4
(Lisinski et al., 2006). However, over-expression of p49/STRAP reduces the cell-
surface expression of GLUT4. Conversely, the up-regulation of GLUT4 in adipose
tissue using treatment with an anti-diabetic agent, troglitazone, has been related to an
improvement of glucose uptake in diabetic rats (Furuta et al., 2002). Our result also
supports the above statements based on up-regulation of p49/STRAP in diabetic group
that leads to reduce the cell-surface expression of GLUT4 and down-regulation of
p49/STRAP in diabetic-treated group with treatment of C. dactylon that leads to
increase the expression of this glucose transporter, which may contribute to enhance the
glucose metabolism. The schematic representation of functional pathways of
p49/STRAP is shown in figure 4.23.
4.5.8.2. Signal Transduction Cascade Protein (MAPKK7)
Mitogen-activated protein kinase kinase 7 (MAPKs) are proline (Pro)-targeted
serine/threonine kinases that play an essential role in signal transduction by modulating
gene transcription in the nucleus in response to changes in the cellular actions. MAPKs
control key cellular functions, including proliferation, differentiation, migration and
apoptosis and participate in a number of disease states including chronic inflammation
and cancer (Zarubin and Han, 2005). The mRNA for MKK7 was widely expressed and
encodes a 419 amino acid located in 17p11.2 of chromosome 17; MKK7 was capable
of phosphorylating and activating JNK. The functional significance of the activation of
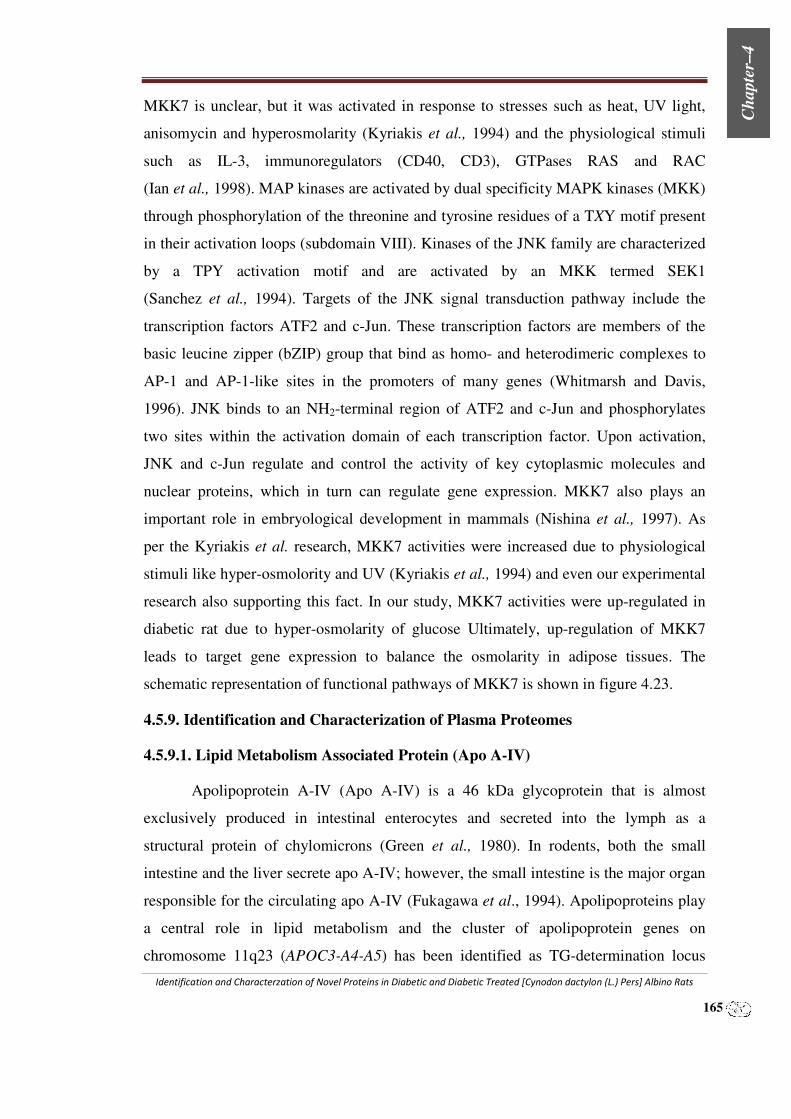
Identification and Characterzation of Novel Proteins in Diabetic and Diabetic Treated [Cynodon dactylon (L.) Pers] Albino Rats
165
Ch
ap
ter–
4
MKK7 is unclear, but it was activated in response to stresses such as heat, UV light,
anisomycin and hyperosmolarity (Kyriakis et al., 1994) and the physiological stimuli
such as IL-3, immunoregulators (CD40, CD3), GTPases RAS and RAC
(Ian et al., 1998). MAP kinases are activated by dual specificity MAPK kinases (MKK)
through phosphorylation of the threonine and tyrosine residues of a TXY motif present
in their activation loops (subdomain VIII). Kinases of the JNK family are characterized
by a TPY activation motif and are activated by an MKK termed SEK1
(Sanchez et al., 1994). Targets of the JNK signal transduction pathway include the
transcription factors ATF2 and c-Jun. These transcription factors are members of the
basic leucine zipper (bZIP) group that bind as homo- and heterodimeric complexes to
AP-1 and AP-1-like sites in the promoters of many genes (Whitmarsh and Davis,
1996). JNK binds to an NH2-terminal region of ATF2 and c-Jun and phosphorylates
two sites within the activation domain of each transcription factor. Upon activation,
JNK and c-Jun regulate and control the activity of key cytoplasmic molecules and
nuclear proteins, which in turn can regulate gene expression. MKK7 also plays an
important role in embryological development in mammals (Nishina et al., 1997). As
per the Kyriakis et al. research, MKK7 activities were increased due to physiological
stimuli like hyper-osmolority and UV (Kyriakis et al., 1994) and even our experimental
research also supporting this fact. In our study, MKK7 activities were up-regulated in
diabetic rat due to hyper-osmolarity of glucose Ultimately, up-regulation of MKK7
leads to target gene expression to balance the osmolarity in adipose tissues. The
schematic representation of functional pathways of MKK7 is shown in figure 4.23.
4.5.9. Identification and Characterization of Plasma Proteomes
4.5.9.1. Lipid Metabolism Associated Protein (Apo A-IV)
Apolipoprotein A-IV (Apo A-IV) is a 46 kDa glycoprotein that is almost
exclusively produced in intestinal enterocytes and secreted into the lymph as a
structural protein of chylomicrons (Green et al., 1980). In rodents, both the small
intestine and the liver secrete apo A-IV; however, the small intestine is the major organ
responsible for the circulating apo A-IV (Fukagawa et al., 1994). Apolipoproteins play
a central role in lipid metabolism and the cluster of apolipoprotein genes on
chromosome 11q23 (APOC3-A4-A5) has been identified as TG-determination locus

Identification and Characterzation of Novel Proteins in Diabetic and Diabetic Treated [Cynodon dactylon (L.) Pers] Albino Rats
166
Ch
ap
ter–
4
(Pennacchio et al., 2002). The physiological function of apo A-IV is not clear. It was
postulated to be involved in fat absorption and in facilitation of CETP (Cholesterolyl
Ester Transfer Protein) activity (Apfelbaum et al., 1987). Apo A-IV also participates in
several steps of the reverse cholesterol transport pathway, which removes cholesterol
from peripheral cells and directs it to liver and steroidogenic organs for metabolization.
Apo A-IV activates lecithin:cholesterol acyltransferase and modulates the activation of
lipoprotein lipase as well as the cholesterylester transfer protein–mediated transfer of
cholesteryl esters from HDL to LDL, which suggests that apo A-IV may represent an
anti-atherogenic factor, as a result apo A-IV levels were significantly lower in CHD
risk (Guyard-Dangremont et al., 1994). Apo A-IV to act as an antioxidant, because apo
A-IV have reduced oxidative markers (Ostos et al., 2001). Apo A-IV was identified as
a marker of kidney impairment that starts increasing in the earliest stages of kidney
disease (Kronenberg et al., 2002). Intestinal apo A-IV is a protein stimulated by dietary
or disease conditions like diabetes mellitus. Apolipoproteins play a central role in lipid
metabolism, which is main complication associated with diabetes mellitus
(Chakrabarti et al., 2002). In our study, ApoA-IV was normally present in control
group and brought to normal level in both C. dactylon treated diabetic rats as compared
with diabetic rats. ApoA-IV was down-regulated in diabetic rats as compared with
control group and both C. dactylon treated diabetic rats. Ultimately, this down-
regulated ApoA-IV in diabetic group plays important role in lipid metabolism such as
cholesterol, triglyceride, HDL, LDL and chylomicrons, this will leads to increases
CHD risk, which is main complication associated with diabetes mellitus. This study has
showed that administration of C. dactylon leaves extract improved or up-regulated
ApoA-IV this will leads to decreases CHD risk.
4.5.9.2. Antioxidant activity related proteins (Preprohaptoglobin and HspB8)
Preprohaptoglobin (Prepro-HP) is synthesized in the liver and is encoded by a
single mRNA and that the primary translation product is a single polypeptide
(Mr=40000 Kda) and that contains an NH2-terminal signal sequences well as α-subunit
region and β-subunit region. The preprohaptoglobin is contain 429 amino acids and
having iso-electric point 7.16 and molecular weight around 30428 Kda and located in
19q12 of chromosome 19 (Langlois and Delanghe, 1996). Preprohaptoglobin is

Identification and Characterzation of Novel Proteins in Diabetic and Diabetic Treated [Cynodon dactylon (L.) Pers] Albino Rats
167
Ch
ap
ter–
4
precursor for synthesis of haptoglobin, a plasma glycoprotein (glycan portion of rat Hp
accounts for 10–20% of the molecular weight), synthesized in the liver and whose
function is to sequester free haemoglobin (Putnam, 1975) that may be released into the
circulation from erythrocytes as a result of trauma or inflammation. The stable
haptoglobin-hemoglobin complex is thought to be taken up and delivered to bile by
parenchymal cells of the liver, thus avoiding damage to the kidney glomerulus by free
haemoglobin (Hinton et al., 1980). The complex is also taken up and degraded by the
reticuloendothelial cells in the liver and spleen. On the basis of others studies,
approximately 35% homology with several serine proteases was noted. The fact that no
proteolytic activity has been reported for haptoglobin (Kurosky and Kim, 1976).
Haptoglobin is used as early serum biomarker of virus-induced type 1 diabetes and may
represent a biomarker for the pathogenesis of autoimmune diabetes (Annie et al.,
2010). Haptoglobin gene are associated with increased risk of diabetic complications
such as retinopathy, nephropathy and cardiovascular disease and also linked to Crohn's
disease, inflammatory disease behavior, primary sclerosing cholangitis and
susceptibility to idiopathic Parkinson's disease (Sadrzadeh and Bozorgmehr, 2004).
The heat shock proteins (HSP), originally identified as heat-inducible gene
products, are a highly conserved family of proteins that respond to a wide variety of
stress. HSPs exhibit highly ubiquitous and conserved features from bacteria to humans
and they are proposed to be essential for cell survival (Lindquist and Craig, 1988). HSP
protect against tissues under adverse conditions such as infection, inflammation,
exposure to toxins, elevated temperature, injury and disease. The protein with apparent
molecular mass 22kDa, belonging to the family of Hsp, is denoted as HSP22, HspB8 or
H11 kinase. Initially HSP22 was identified as an oncogene serine/threonine protein
kinase, but later this suggestion was HPS family protein. Expression of HSP22 is
increased in response to unfavorable conditions and it possesses chaperone-like activity
(Chavez Zobel et al., 2003). The HSPB8 gene is located on the long (q) arm of
chromosome 12 at position 24.23. More precisely, the HSPB8 gene is located from
base pair 119,616,594 to base pair 119,632,550 on chromosome 12. Hsp22 possesses
protein kinase activity is very fascinating and important for understanding the
participation of Hsp22 in regulation of apoptosis, myocardial hypertrophy and cell

Identification and Characterzation of Novel Proteins in Diabetic and Diabetic Treated [Cynodon dactylon (L.) Pers] Albino Rats
168
Ch
ap
ter–
4
proliferation (Maria et al., 2004). Researchers have identified at least two HSPB8 gene
mutations that cause a condition called distal hereditary motor neuropathy, type II,
which is similar to Charcot- Marie-Tooth disease (Sun et al., 2010).
Diabetes is usually accompanied by increased production of free radicals or
impaired antioxidant defence. Many of the complications of diabetes including
retinopathy and atherosclerotic vascular disease, the leading cause of mortality in
diabetics, have been linked to oxidative stress (Baynes, 1991). In diabetes the oxidative
stress co-exists with a reduction in the antioxidant status and also increases glycolation
of proteins, inactivation of enzymes and lipid oxidation (Sabu and Kuttan, 2009).
Heme-catalyzed oxidation of low-density lipoprotein (LDL) is one of the relevant
mechanisms involved in LDL modification. Oxidation of LDL is toxic to vascular
endothelial cell (Nagy et al., 2005). The main function of haptoglobin as an antioxidant
by virtue of its ability to bind to haemoglobin and thereby to prevent the oxidative
tissue damage that may be mediated by free haemoglobin (Lim et al., 2000). In this,
the observation that the diabetic state may interfere with the synthesis of HSPs and its
function is numerous related to tissues physiology as mentioned above. The antioxidant
functions of HSP should therefore prove to be helpful in fighting diabetic
complications. Indeed, the crucial role of HSPs in diabetes is highlighted by their
ability to counteract denaturation of tissue proteins and facilitate cellular repair and
defense mechanisms. In turn, compromised HSP expression may contribute to diabetic
complications (Mustafa et al., 2009). Our result also supporting the above statement
based on up-regulation of preprohaptoglobin and HspB8 in diabetic group leads to
prevent the oxidative damage and oxidative stress some extent in blood and tissues
related proteins and lipids. HspB8 is having chaperone-like activity; it would repair the
damaged proteins due to oxidation.
4.5.9.3. Muscle Function Related Function (TPM3)
Tropomyosin (TM), a ubiquitous protein, is a component of the contractile
apparatus of all cells. Tropomyosins are actin-associated cytoskeletal proteins of
muscle and non-muscle cells. Multiple isoforms of tropomyosin are found in vertebrate
non-muscle cells (Lin et al., 1985). There are at least seven tropomyosin isoforms
expressed in non-muscle cells: three of high M.WT. TM1, TM2 and TM3 and four of

Identification and Characterzation of Novel Proteins in Diabetic and Diabetic Treated [Cynodon dactylon (L.) Pers] Albino Rats
169
Ch
ap
ter–
4
low M.WT. TM4, TM5a, TM5b and TM30nm (Lin et al., 1985). Tropomyosin plays an
important role in the regulation of contractility of muscle and nonmuscle cells. This
protein forms a coiled-coil dimer and exists in several different forms (a, 1 and non-
muscle-cytoplasmic) with apparent molecular weights ranging from 30,000 to 50,000
(Smillie, 1979). In skeletal muscle, tropomyosin serves to mediate the effect of Ca2+ on
the actin-myosin interaction. It does so, not by binding Ca directly but, through
interaction with the troponins, one of which (troponin T) binds to tropomyosin at a
specific site in the carboxyl-terminal region of the skeletal muscle tropomyosin
molecule. In smooth muscle and non-muscle tissues, which lack troponins,
tropomyosin has a characteristic and different carboxyl-terminal primary structure
(Pearlstone and Smillie, 1982).
Tropomyosin 3 or Tropomyosin alpha 3 chain (TPM3) is one of the muscle
contractile, protein plays an important role in the regulation of contractility of muscle.
The TPM3 gene is located on the long (q) arm of chromosome 1 at position 21.2
(1q21.2). More precisely, the TPM3 gene is located from base pair 154,127,779 to base
pair 154,164,608 on chromosome 1. The TPM 3 gene, ~42 kb in length, is composed of
13 exons with its primary transcripts differentially processed to produce >11 mRNA
isoforms. The muscle specific TPM3 protein, consisting of 285 amino acids, is encoded
by a 1.3 kb transcript produced by alternative splicing of ten of the exons
(Kathy et al., 2002). Mutations in the TPM3 gene are associated with a condition called
congenital fiber-type disproportion (inefficient muscle contraction leads to muscle
weakness) nemaline myopathy (individuals typically have muscle weakness at birth or
beginning in early childhood) (Nigel et al., 1995). Diabetes mellitus is characterized by
several metabolic changes in skeletal muscle, including altered enzyme levels and
response to insulin and altered substrate concentrations (Simoneau and Kelley, 1997).
In diabetic condition, tropomyosin alpha 3 chain was up-regulated due to diabetic
muscle infarction and diabetic necrosis (Chason et al., 1996). Skeletal muscle
proteomics promises to play a major role in the establishment of a disease-specific
biomarker signature for the major classes of diabetes mellitus associated with
neuromuscular disorders.