chapter fourteen data preparation 14-1 copyright © 2010 pearson education, inc
TRANSCRIPT

Chapter Fourteen
Data Preparation
14-1Copyright © 2010 Pearson Education, Inc.
Copyright © 2010 Pearson Education, Inc. 14-2
Chapter Outline
1) Overview
2) The Data Preparation Process
3) Questionnaire Checking
4) Editing
5) Coding
6) Transcribing
7) Data Cleaning
8) Statistically Adjusting the Data
9) Selecting a Data Analysis Strategy
10) A Classification of Statistical Techniques
Copyright © 2010 Pearson Education, Inc. 14-3
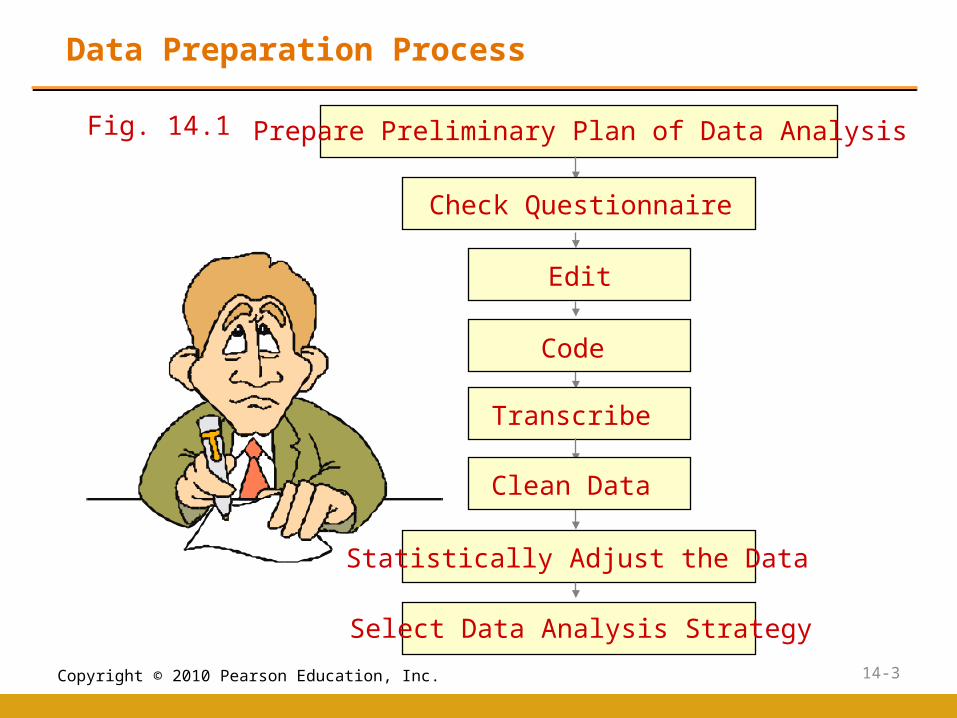
Data Preparation Process
Fig. 14.1
Select Data Analysis Strategy
Prepare Preliminary Plan of Data Analysis
Check Questionnaire
Edit
Code
Transcribe
Clean Data
Statistically Adjust the Data

Copyright © 2010 Pearson Education, Inc. 14-4
Preparing Preliminary Plan of Data Analysis
Start by answering the following:• What data collection methods am I using?
• Survey, experiment, etc.• What data analysis method am I using?
(this is based on your collection method)• T tests, Chi-square, ANOVA, etc.
• What are my IVs?• What are my DVs?
• Are my IVs and DVs reflected in my hypotheses?• How will I compare my variables?
• Cohort analysis, predictive models, etc.• How will I code my data?

Copyright © 2010 Pearson Education, Inc. 14-5
Questionnaire Checking
Once responses begin coming in, start by checking questionnaires – this step is crucial!
A questionnaire returned from the field may be unacceptable for several reasons.1. Parts of the questionnaire may be incomplete.2. The pattern of responses may indicate that the
respondent did not understand or follow the instructions.
3. The responses show little variance. 4. One or more pages are missing.5. The questionnaire is received after the
preestablished cutoff date.6. The questionnaire is answered by someone who
does not qualify for participation.

Copyright © 2010 Pearson Education, Inc. 14-6
Editing
If we notice any issues with the questionnaires, we need to begin editing (preliminary checks)…
Treatment of Unsatisfactory Results• Returning to the Field – The questionnaires
with unsatisfactory responses may be returned to the field, where the interviewers recontact the respondents.
• Assigning Missing Values – If returning the questionnaires to the field is not feasible, the editor may assign missing values to unsatisfactory responses.
• Discarding Unsatisfactory Respondents – In this approach, the respondents with unsatisfactory responses are simply discarded.

Copyright © 2010 Pearson Education, Inc. 14-7
Editing – Assigning Missing Values
Assigning Missing Values – The editor may assign missing values to unsatisfactory responses. •Imputation: the substitution of some value for missing data.
• “Best guess” value can be imputed.• Average value can be imputed.• Bootstrapping (creating a new sample, via
computer, with different values but similar means and standard deviations) can also be done.
•Imputation is a controversial technique for dealing with missing data.
Copyright © 2010 Pearson Education, Inc. 14-8
Coding
Coding means assigning a code, usually a number, to each possible response to each question. The code includes an indication of the column position (field) and data record it will occupy.
Coding Questions
• Fixed field codes, which mean that the number of records for each respondent is the same and the same data appear in the same column(s) for all respondents, are highly desirable.
• In questions that permit a large number of responses, each possible response option should be assigned a separate column. For example:• January = 1; not January = 0• February = 1; not February = 0• March =1; not March =0

Copyright © 2010 Pearson Education, Inc. 14-9
Coding in Excel - Variable respecification
Month of Ad Campaign January February March
January 1 0 0
February 0 1 0
January 1 0 0
March 0 0 1
March 0 0 1
February 0 1 0
January 1 0 0
March 0 0 1
February 0 1 0
February 0 1 0
• In Excel: =IF(A2="January",1,0) • Or, go to ‘Formulas’ > ‘Recently Used’ > IF
• Go into Excel and try recreating this chart

Copyright © 2010 Pearson Education, Inc. 14-10
Coding
Guidelines for Coding Unstructured Questions:
• Category codes should be mutually exclusive and collectively exhaustive.
• All possible responses should categorized and should not overlap.
• Only a few (10% or less) of the responses should fall into the “other” category.
• These may even be deleted.
• Category codes should be assigned for critical issues even if no one has mentioned them.
• Data should be coded to retain as much detail as possible.
Copyright © 2010 Pearson Education, Inc. 14-11
Codebook
• A codebook contains coding instructions and the necessary information about variables in the data set. A codebook generally contains the following information:
• column number
• record number
• variable number
• variable name
• question number
• instructions for coding
• Codebooks can be saved in a separate tab in Excel, or recorded under ‘Values’ in SPSS.

Copyright © 2010 Pearson Education, Inc. 14-12
ID PREFER. QUALITY QUANTITY VALUE SERVICE INCOME 1 2 2 3 1 3 6 2 6 5 6 5 7 2 3 4 4 3 4 5 3 4 1 2 1 1 2 5 5 7 6 6 5 4 1 6 5 4 4 5 4 3 7 2 2 3 2 3 5 8 3 3 4 2 3 4 9 7 6 7 6 5 2
10 2 3 2 2 2 5 11 2 3 2 1 3 6 12 6 6 6 6 7 2 13 4 4 3 3 4 3 14 1 1 3 1 2 4 15 7 7 5 5 4 2 16 5 5 4 5 5 3 17 2 3 1 2 3 4 18 4 4 3 3 3 3 19 7 5 5 7 5 5 20 3 2 2 3 3 3
Restaurant PreferenceSample Dataset:

Copyright © 2010 Pearson Education, Inc. 14-13
SPSS Variable View of the Data of Table 14.1Table 14.2

Copyright © 2010 Pearson Education, Inc. 14-14
Codebook Excerpt
Column Number
Variable Number
Variable Name
Question Number
Coding Instructions
1 1 ID 1 to 20 as coded
2 2 Preference 1 Input the number circled.1=Weak Preference7=Strong Preference
3 3 Quality 2 Input the number circled.1=Poor7=Excellent
4 4 Quantity 3 Input the number circled.1=Poor7=Excellent
7 7 Income 6 Input the number circled.1 = Less than $20,000 2 = $20,000 to 34,999 3 = $35,000 to 49,999 4 = $50,000 to 74,999 5 = $75,000 to 99,999 6 = $100,00 or more
Fig. 14.2
Question: What types of scales are each of these items on?•Nominal, ordinal, interval or ratio
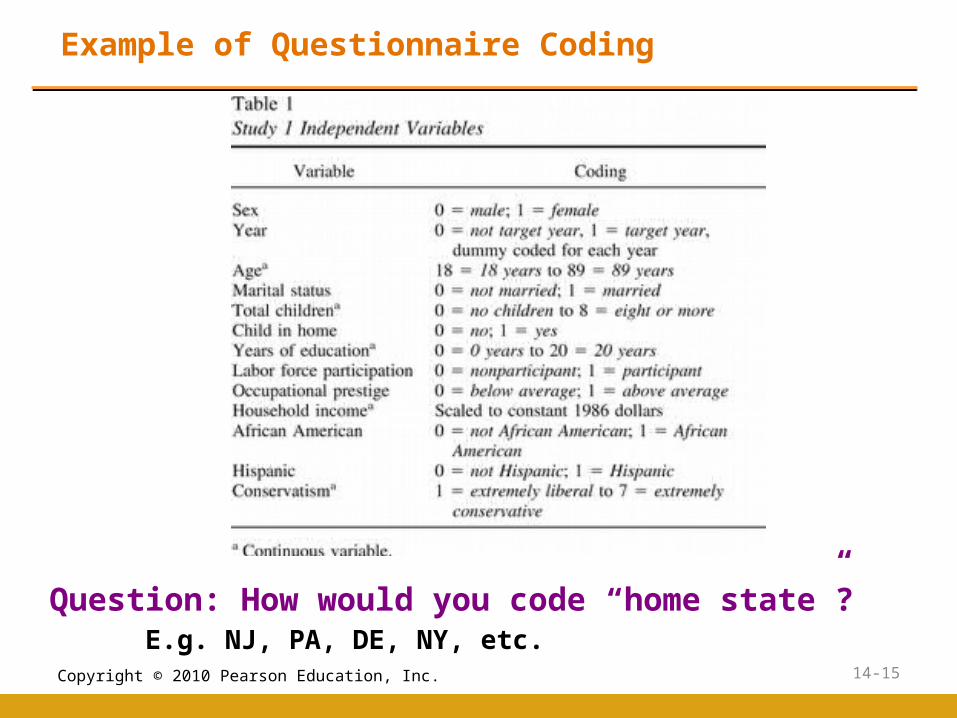
Copyright © 2010 Pearson Education, Inc. 14-15
Example of Questionnaire Coding
Question: How would you code “home state”?E.g. NJ, PA, DE, NY, etc.

Copyright © 2010 Pearson Education, Inc. 14-16
Data Transcription
• Transcribing responses into hard data.
• With online surveys, this is done for you….simply download the Excel sheet.
• Hard copy surveys must be manually transcribed.
• Qualitative data must be categorized and coded, then transcribed.

Copyright © 2010 Pearson Education, Inc. 14-17
Data Cleaning Consistency Checks
After transcribing data, data cleaning (a follow-up to editing) must be conducted…
Consistency checks identify data that are out of range, logically inconsistent, or have extreme values.
• Reverse coding (changing the directionality of a question) can help identify logically inconsistent answers.
• Often times, this means the respondent was not paying attention – throw out their responses.
• Computer packages like SPSS, SAS, EXCEL and MINITAB can be programmed to identify out-of-range.
• Extreme values (outliers) should be closely examined. • Sometimes, outliers are thrown out. Other times, they are
kept. This depends on the study.• Data cleaning can be time consuming!

Copyright © 2010 Pearson Education, Inc. 14-18
Data Cleaning Treatment of Missing Responses
Did we find more issues with missing data?
Imputation:•Impute a Neutral Value – A neutral value, typically the mean response to the variable, is substituted for the missing responses. •Impute a calculated Response – The respondents' pattern of responses to other questions are used to impute or calculate a suitable response to the missing questions.
Deletion:•In casewise deletion, cases, or respondents, with any missing responses are discarded from the analysis. •In pairwise deletion, instead of discarding all cases with any missing values, the researcher uses only the cases or respondents with complete responses for each calculation.
• Keep all respondents, but don’t use them for all variables.

Copyright © 2010 Pearson Education, Inc. 14-19
Statistically Adjusting the Data Weighting
Sometimes, it is appropriate to alter the data…
•In weighting, each case or respondent in the database is assigned a weight to reflect its importance relative to other cases or respondents.
•Weighting is most widely used to make the sample data more representative of a target population on specific characteristics.
•Yet another use of weighting is to adjust the sample so that greater importance is attached to respondents with certain characteristics.

Copyright © 2010 Pearson Education, Inc. 14-20
Statistically Adjusting the Data
Use of Weighting for Representativeness Weighting so that sample matches percentage of known population
Years of Sample PopulationEducation Percentage Percentage
(in LA) Weight Elementary School
0 to 7 years 2.49 4.23 1.708 years 1.26 2.19 1.74
High School1 to 3 years 6.39 8.65 1.354 years 25.39 29.24 1.15
College1 to 3 years 22.33 29.42 1.324 years 15.02 12.01 0.805 to 6 years 14.94 7.36 0.497 years or more 12.18 6.90 0.57
Totals 100.00 100.00

Copyright © 2010 Pearson Education, Inc. 14-21
Statistically Adjusting the Data – Variable Respecification
• Variable respecification involves the transformation of data to create new variables or modify existing variables.
• e.g., the researcher may create new variables that are composites of several other variables.
• Dummy variables are used for respecifying categorical variables. The general rule is that to respecify a categorical variable with K categories, K-1 dummy variables are needed.

Copyright © 2010 Pearson Education, Inc. 14-22
Statistically Adjusting the Data – Variable Respecification
Product Usage Original Dummy Variable CodeCategory Variable
Code X1 X2 X3
Nonusers 1 1 0 0
Light users 2 0 1 0Medium users 3 0 0 1Heavy users 4 0 0 0
Note that X1 = 1 for nonusers and 0 for all others. Likewise, X2 = 1 for light users and 0 for all others, and X3 = 1 for medium users and 0 for all others. In analyzing the data, X1, X2, and X3 are used to represent all user/nonuser groups.
Copyright © 2010 Pearson Education, Inc. 14-23
Statistically Adjusting the Data – Scale Transformation and Standardization
Scale transformation involves a manipulation of scale values to ensure comparability with other scales or otherwise make the data suitable for analysis.
• For example, if you IV is on a 5-point Likert, and your DV is on a 7-point Likert, you could scale all items to 35 (5*7) in order to make them comparable.
Copyright © 2010 Pearson Education, Inc. 14-24
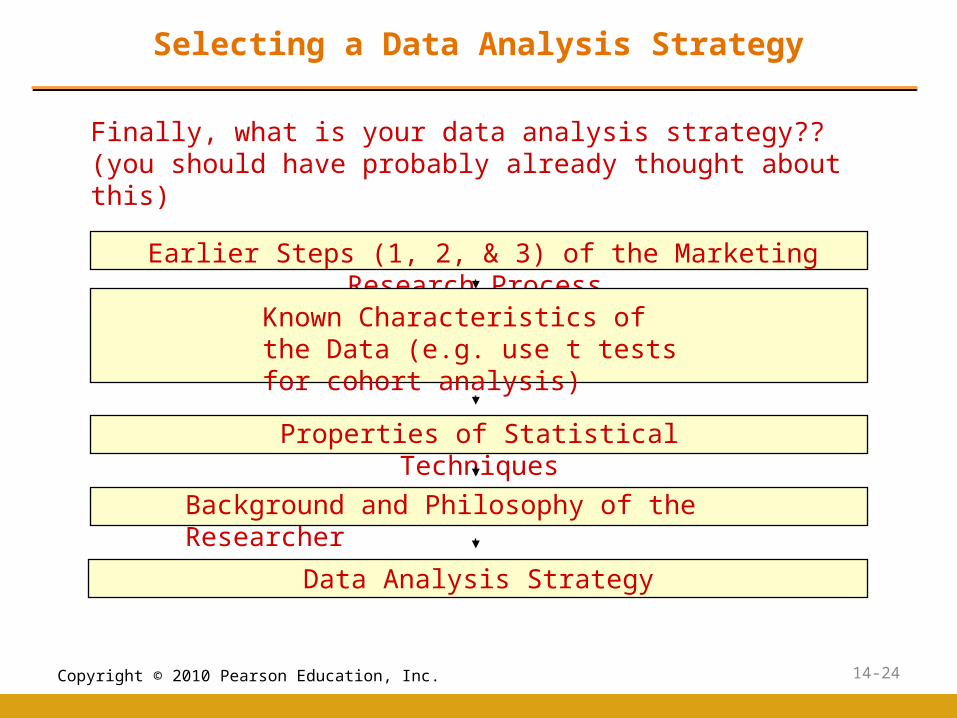
Selecting a Data Analysis Strategy
Earlier Steps (1, 2, & 3) of the Marketing Research Process
Known Characteristics of the Data (e.g. use t tests for cohort analysis)
Data Analysis Strategy
Properties of Statistical Techniques
Background and Philosophy of the Researcher
Finally, what is your data analysis strategy?? (you should have probably already thought about this)
Copyright © 2010 Pearson Education, Inc. 14-25
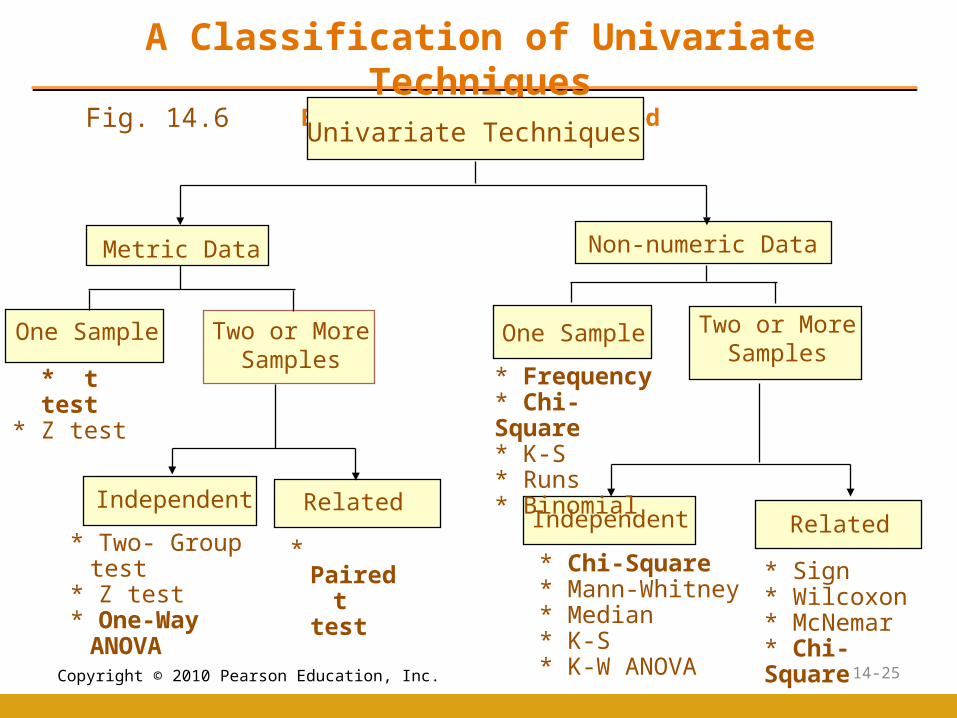
A Classification of Univariate TechniquesEach variable is isolated
Fig. 14.6
Independent RelatedIndependent Related
* Two- Group test
* Z test * One-Way
ANOVA
* Paired t test * Chi-Square
* Mann-Whitney* Median* K-S* K-W ANOVA
* Sign* Wilcoxon* McNemar* Chi-Square
Metric Data Non-numeric Data
Univariate Techniques
One Sample Two or More Samples
One Sample Two or More Samples
* t test* Z test
* Frequency* Chi-Square* K-S* Runs* Binomial

Copyright © 2010 Pearson Education, Inc. 14-26
A Classification of Multivariate TechniquesVariables are related and may effect each other
Fig. 14.7
More Than One Dependent
Variable* Multivariate
Analysisof Variance
* Canonical Correlation* Multiple Discriminant
Analysis* Structural Equation
Modelingand Path Analysis
* Cross-Tabulation
* Analysis of Variance and Covariance
* Multiple Regression
* 2-Group Discriminant/Logit
* Conjoint Analysis
* Factor Analysis
* ConfirmatoryFactor Analysis
One Dependent Variable
Variable Interdependenc
e
Interobject Similarity
* Cluster Analysis* Multidimensional
Scaling
Dependence Technique
Interdependence Technique
Multivariate Techniques

Copyright © 2010 Pearson Education, Inc. 14-27
Questions??
Thanks!

Copyright © 2010 Pearson Education, Inc. 14-28
Appendix: SPSS Windows
• Using the Base module, out-of-range values can be selected using the SELECT IF command. These cases, with the identifying information (subject ID, record number, variable name, and variable value) can then be printed using the LIST or PRINT commands. The Print command will save active cases to an external file. If a formatted list is required, the SUMMARIZE command can be used.
• SPSS Data Entry can facilitate data preparation. You can verify respondents have answered completely by setting rules. These rules can be used on existing datasets to validate and check the data, whether or not the questionnaire used to collect the data was constructed in Data Entry. Data Entry allows you to control and check the entry of data through three types of rules: validation, checking, and skip and fill rules.
• While the missing values can be treated within the context of the Base module, SPSS Missing Values Analysis can assist in diagnosing missing values and replacing missing values with estimates.
• TextSmart by SPSS can help in the coding and analysis of open-ended responses.