chapter f financial feasibility...
TRANSCRIPT

F.1
CHAPTER F
Financial Feasibility Analysis
1. Introduction
This chapter presents a funding plan for completion of recommended capital projects at Friedman Memorial Airport (the Airport) through FY 2034, the end of the Master Plan Update planning period, and assesses the ability of the Friedman Memorial Airport Authority (the Authority) to financially undertake this plan. Potential funding plans were developed for two capital development scenarios:
Existing Airport Scenario – Under this scenario, the Airport would continue to be operated, maintained, and improved, in its existing location, to meet applicable standards and demand requirements through the projection period.
Replacement Airport Scenario – Under this scenario, critical maintenance and improvement projects would be undertaken at the existing Airport, while construction of a replacement airport would begin in FY 2022 and end in FY 2034.
Estimated costs, potential funding sources, proposed timing (phasing), and a projection of operating revenues and expenses is provided to demonstrate the financial feasibility of each scenario. The financial analysis conducted for the two development scenarios is based upon a review of the current financial and governance structure of the Authority, historical Airport operating revenues and expenses, current Authority capital plans, relevant leases and concession agreements, and other operating issues that have the potential to affect future cash flows and financial results of the Authority. The outcome of this analysis provides the Authority with a financial plan for implementation of the recommended Capital Improvement Program (CIP) while achieving adequate cash flow to continue ongoing operations. The actual implementation schedule for various improvements identified in the Master Plan is defined, primarily, by demand, and may not correspond precisely to the schedule described in this chapter. For purposes of this financial analysis, a specific implementation schedule was assumed for each scenario. However, it should be noted that this schedule and the resulting financial analysis are intended only to evaluate financial feasibility. Actual funding strategies used for each project will be determined as actual implementation approaches.
Note: The approval of this planning document by the Friedman Memorial Airport Authority (FMAA) does not constitute final approval of any of the improvements shown. This is a planning document showing potential improvements that may be necessary in the future, depending on demand at the Airport and appropriate project justification. Implementation of specific projects shall not occur without specific approval of the FMAA, in accordance with the Friedman Memorial Airport Joint Powers Agreement as amended, or a successor document.
2. Inventory of Financial Information
2.1. Airport Financial Structure
The Airport is jointly owned by Blaine County, Idaho (County) and the City of Hailey, Idaho (City). The Airport is operated by the Authority, a public entity of the State of Idaho formed through a Joint Powers Agreement (Agreement) established by the County and City on October 1, 1994. Through enactment of the 1994 Agreement, the County and City transferred ownership of all buildings, improvements, facilities, equipment, and personal

F.2
property to the Authority and charged it with the responsibility and authority to operate and manage Airport activities in the County. Should the City and the County terminate its Joint Powers Agreement, title to all buildings, improvements, facilities, equipment, and personal property held by the Authority shall vest jointly in the County and the City.
In 2011, the County and City amended and restated pertinent provisions of the 1994 Agreement, which provided the framework for the elimination of Federal Aviation Administration (FAA) airfield design safety deviations without expanding the impact of the Airport on the adjacent community, and charged the Authority with responsibility for implementation of the Airport Master Plan. The Authority is governed by a seven‐member board with three members appointed by and representing the County, three members appointed by and representing the City, and one member who is selected by the six owner‐appointed members. The Authority manages numerous tenant agreements and facilities, provides a safe and efficient facility for the operation of aircraft, promotes development of Airport property for aviation and commercial related services, obtains and administers FAA grants, and ensures the compatibility of proposed developments within and around the Airport with federal, state, and local standards. It operates on a Fiscal Year (FY) basis, which ends September 30 and employs the accrual basis of accounting for its financial management and operations. Under this method, revenue and receivables are recognized when services are provided and expenses and liabilities are recorded at the time goods and services are received. The Authority appoints an Airport Manager and staff to implement its policy decisions and to manage the affairs of the Airport. The staff is responsible for the day‐to‐day financial, administrative, and operational matters pertaining to the Airport and for administering the contractual arrangements with various aeronautical and non‐aeronautical businesses. The Airport Manager acts as the fiscal agent for the Authority and is responsible for maintaining its budgetary as well as revenue and expenditure accounts. The Authority maintains separate financial records to account for the itemized revenues and expenses of the Airport and also prepares an Annual Report on the Airport’s financial condition. Daily operations of the Airport are funded through the collection of user fees such as parking receipts, rental car privilege fees, landing fees, space rental, and concessions fees.
2.2. Rates and Charges
The Authority is a self‐supporting entity and receives no funding support from the County or City. Each year, the Authority Board provides a schedule of rates and charges for airport users and the services it provides to the public through enactment of a rate‐setting Ordinance. These charges include automobile parking, the in‐terminal display advertising program, ground transportation service providers, terminal fees, and various aircraft landing and service fees. The Authority has also entered into a host of land and hangar leases, concession agreements, and leases with both the FAA and Transportation Security Administration (TSA). Table F1 provides a summary of key leases and rates for the Airport as of FY 2016.
2.3. Historical Financial Results
Table F2 presents historical revenues and expenses for the Airport Fund from Actual FY 2012 to Budget FY 2016.

F.3
Table F1 AIRPORT RATES AND CHARGES (10/1/15 – 9/30/16)
Fee Type Imposed Fee
Airline Fees
Terminal Fee (per square-foot) $26.56
Gate Fee (per gate) $50.00
Landing Fee (per 1,000 lbs. mtow) $1.60
Non-Signatory Landing Fee (per 1,000 lbs. mtow) $2.50 - $4.00 depending on aircraft size
Terminal Concessions
Vending Fee Commission (% of gross revenue) 35% - 90% depending on revenue thresholds
Advertising – Framed Poster $900 - $2,400 depending on location
Advertising – Wall Display $3,600 - $4,800 depending on size
Advertising – Floor Display Case $6,000
Advertising – Courtesy Phones $450 - $1,920 depending on size
Advertising – Brochure Rack $120 (self-stocked); $300 (full service)
Auto Parking (per hour)
0 to ½ hour $0.00
½ Hour – 24 Hours $2.00 - $9.00 depending on duration
Advertising (per year)
Ground Transportation (each vehicle/month)
Vehicle Permit $400 - $600 depending on vehicle capacity
Fuel Flowage (per gallon)
AvGas / Jet-A $0.10 / $0.12
Tiedown – Based (per year)
Single Engine $495 - $990 depending on amenities
Twin Engine $706 - $1,412 depending on amenities
Tiedown – Transient (nightly)
Single Engine $15 (piston); $75 (turbo)
Twin Engine $37.50 (piston); $87.50 (turbo)
Jets $90 - $400 depending on aircraft weight
Helicopters $70 - $200 depending on aircraft weight
Rental Car Concessions
Counter Space $3.63 per square-foot
Lower Parking $45.72 each - $101.60 each depending on location
Gross Commissions 10%
Hangar Land Leases (per square-foot)
Friedman Hangar Units $4.18
Condo Units $2.17
Other Hangars $0.68 - $7.59 depending on size
Fixed Base Operator (per square-foot)
Primary Parcels $0.59
Parking Area $0.63
Hangar Land Lease $4.18 - $9.82 depending on size
Fuel Farm $0.75
SOURCE: Friedman Memorial Airport.

F.4
Table F2 HISTORICAL AND BUDGET NET REVENUE
Actual 2012
Actual 2013
Actual 2014
Budget 2015
Budget 2016
Operating Revenue
Airlines $171,072 $176,753 $204,365 $213,501 $251,761
Automobile Rental 381,889 389,427 489,713 464,700 571,785
Auto Parking 70,711 85,788 144,931 100,100 200,000
Terminal Concession 37,233 39,915 48,722 52,920 48,000
FBO Revenue 675,039 691,305 811,179 971,500 978,190
Fuel Flowage Fees 177,287 190,493 198,046 200,000 210,000
Transient Landing Fees 209 279 512 500 500
Hangars 484,957 496,591 494,964 439,650 577,953
Tiedown Permit Fees 15,929 13,282 11,650 10,000 11,649
Postal Carrier 11,503 11,692 12,079 12,000 13,000
Ground Transportation Permits 15,210 16,500 16,580 15,200 16,580
TSA 9,054 8,635 6,544 6,545 40,000
Miscellaneous/Other Revenue 32,465 63,947 33,130 27,000 32,000
Total Operating Revenue $2,082,560 $2,184,608 $2,472,416 $2,513,616 $2,951,419
Add: Interest Income1 $11,358 $9,054 $6,158 $10,000 $3,080
Total Revenue $2,093,918 $2,193,662 $2,478,574 $2,523,616 $2,954,499
- Annual Change -0.8% 4.8% 13.0% 1.8% 17.1%
Operating Expenses2
Employee wages, benefits and taxes $1,169,218 $1,189,614 $1,225,298 $1,344,656 $1,390,174
Supplies 106,537 59,163 60,890 94,300 89,300
Utilities 78,432 82,512 111,912 130,610 130,131
Services and Contracts 502,942 354,546 318,449 386,150 508,226
Repairs and Maintenance 111,468 90,688 104,230 108,000 97,000
Insurance 61,073 67,930 51,589 56,349 59,167
Other Operating Expenses 59,133 58,344 407,839 312,600 67,600
Miscellaneous Capital Expenditures 102,494 55,690 145,448 850,000 362,200
Total Operating Expenses $2,191,298 $1,958,485 $2,425,655 $3,282,665 $2,703,798
- Annual Change 7.3% -10.3% 23.9% 35.3% -17.6%
Net Revenue ($97,380) $235,176 $52,919 ($759,049) $250,701
1. Excludes interest income on Passenger Facility Charge accounts.
2. Excludes depreciation.
SOURCE: Friedman Memorial Airport.

F.5
2.3.1. Revenues
For Budget FY 2016, it is projected that 72 percent of the Authority’s revenue is to be derived from three primary sources: Fixed Base Operator (FBO) lease and concession payments (approximately 33 percent); hangar land and building leases (approximately 20 percent); and automobile rental concession fees and charges (approximately 19 percent). Given that these funding sources account for the majority of revenue for the Authority’s operations and are tied directly to passenger and aircraft activity levels, significant variations in aviation activity at the Airport have the potential to influence ongoing Authority cash flow. Although operating revenue is heavily concentrated in these three sources, the Authority also maintains lease and use agreements with the air carriers serving the Airport and receives a percentage of all automobile parking receipts. Collectively, these sources are budgeted to account for approximately 15 percent of the Authority’s annual operating funds in FY 2016. Total operating revenues for the five-year period from FY 2012 – Budget FY 2016 are projected to increase from approximately $2.08 million to $2.91 million, resulting in a compound annual growth rate (CAGR) of approximately 9.1 percent. Increased automobile parking concession revenues, FBO revenues, and rental car revenues contribute significantly to this growth. FBO revenues are expected to grow at a CAGR of approximately 9.7 percent over this period, while rental car revenues are expected to grow at a CAGR of approximately 10.6 percent and automobile parking concession contributions are slated to grow at a CAGR of approximately 29.7 percent.
2.3.2. Expenses
Operating expenses include all expenses incurred by the Authority associated with operating the Airport as well as its share of capital expenditures. Total operating expenses for five-year period from FY2012 – Budget 2016 are projected to increase from approximately $2.19 to $2.70 million, resulting in a CAGR of approximately 5.4 percent. Discounting capital expenditure outlays by the Authority, operating expenses are expected to increase from approximately $2.09 million to $2.34 million during this period, or approximately 2.9 percent per year. For Budget FY2016, wages, benefits, and taxes are estimated to comprise approximately 51 percent of all operating expenses while contractual and utility expenses constitute approximately 19 percent and 5 percent, respectively, of the Authority’s operating expenses. Collectively, wages, benefits, and taxes; contracts; and utilities represent approximately 75 percent of all Authority expenditures. Accordingly, changes in the number of employees, salaries, Authority-provided employee benefits, the number and dollar volume of professional service contracts; and/or utility consumption and rates could result in material changes in the Authority’s overall costs. During the period FY 2012 – Budget FY 2016 the Authority anticipates an investment of $1.5 million of local funds toward Airport capital improvements. Approximately $0.9 million of this amount is scheduled to be expended on improvements to the Airline Ticketing and Office Areas ($0.2 million); Runway Improvements ($0.2 million) and the Public Automobile Parking Area ($0.5 million). Other major improvements to be completed during this period include the acquisition of computer equipment/software, replacement of terminal building carpet, and the acquisition of snow removal equipment (SRE). Net revenue is calculated by subtracting operating expenses from total revenues. The Authority achieved positive net revenue in FY 2013 and FY 2014 and anticipates realizing positive net revenue for Budget FY 2016. In FY 2012 an operating loss of approximately $97,000 was posted due to a decrease in operating revenue of approximately 0.8 percent from FY 2011 and an increase in operating expenses of approximately 7.3 percent. For FY 2015, the Authority budgeted over $850,000 in capital expenditures which contributes to a budgeted loss of approximately $760,000 in that year. Net revenue of approximately $250,000 is budgeted for FY 2016. At the close of FY 2016, the Authority expects to have accumulated cash reserves totaling $2.0 million to fund ongoing operating and capital expenses for FY 2017 and beyond.

F.6
3. Financial Analysis and Funding Plan This section provides a description of the CIP, potential funding sources, and cash flow analyses for both the Existing Airport Scenario and the Replacement Airport Scenario.
3.1. Capital Improvement Program Funding Sources
Airport development is often funded by a combination of public and private sources. Most nonhub airports, including the Airport, typically rely heavily on federal grants (with a local match) to provide most of the funding for an airport’s capital program. The funding plan presented herein does not represent a final plan of finance, but is intended to present an assessment of the preliminary financial feasibility of each development scenario. Additional actions need to be undertaken prior to the use of some of these funding sources for specific projects. It is assumed that the costs for the projects will ultimately be financed from a combination of funding sources, such as federal AIP grants, PFCs, third-party funds, and local/Authority funds.
3.1.1. Federal Grants
The Airport and Airway Improvement Act of 1982 authorizes funding for the AIP from the Airport and Airway Trust Fund (the Trust Fund) for airport development, airport planning, and noise compatibility planning and programs. The Trust Fund is funded through several user taxes on airfares, air freight, and aviation fuel. Grants under the AIP are distributed to airports in two ways: entitlement grants and discretionary grants. Entitlement grants are distributed to airports based on the number of enplaned passengers served on an annual basis. Discretionary grants are distributed by the FAA for individual projects based on capacity enhancement and their importance to the national air transportation system. AIP grants may be used to fund eligible land acquisition, noise mitigation, airfield improvements, airport roadways, terminal projects (for nonhub airports), and safety and security systems and equipment. On February 15, 2012, President Obama signed into law the FAA reauthorization legislation entitled the FAA Modernization and Reform Act of 2012. This legislation marks the first multi-year reauthorization of the FAA/AIP since the Vision 100 – Century of Flight Authorization Act of 2003 expired September 30, 2007. Under this current reauthorization, the AIP was extended for four Federal Fiscal Years to September 30, 2015. Through a series of Congressional actions, the AIP has subsequently been authorized through September 30, 2017. The authorized funding levels for AIP investment have been established at $3.35 billion for each year. Under the AIP, the minimum entitlement for primary airports (i.e., an airport with a minimum of 10,000 enplaned passengers) is $1.0 million per year. Based on the approved aviation activity forecast presented in Chapter B, the Airport is expected to remain classified as a nonhub primary airport under FAA criteria and, thus, is projected to receive annual AIP entitlement funds of $1.0 million throughout the planning period. Future reauthorizations of the AIP could adjust the minimum level of entitlement grants (either up or down), which could significantly affect the CIP funding plan. Discretionary grants (annual and multi-year commitments through a Letter of Intent) are distributed by each FAA region on the basis of availability and project priorities. Discretionary grants are generally made immediately available to fund project costs, while Letter of Intent grants are distributed to the Airport over a number of years at defined annual funding levels.
F.7
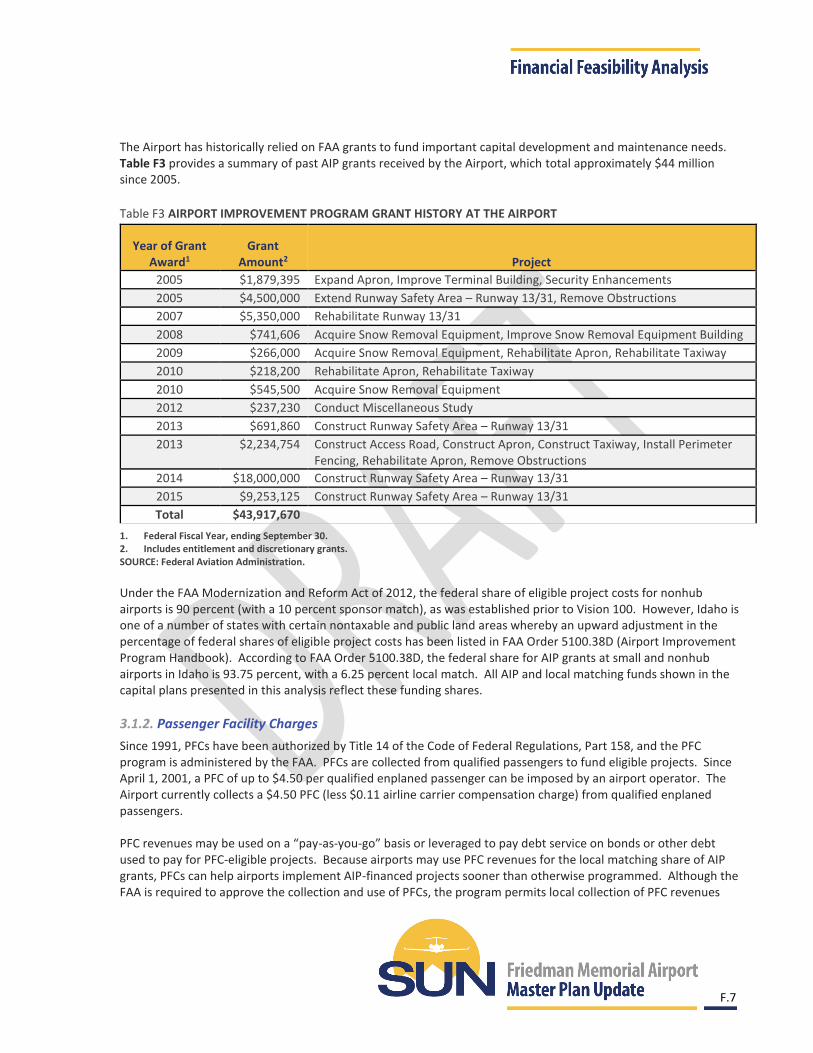
The Airport has historically relied on FAA grants to fund important capital development and maintenance needs. Table F3 provides a summary of past AIP grants received by the Airport, which total approximately $44 million since 2005.
Table F3 AIRPORT IMPROVEMENT PROGRAM GRANT HISTORY AT THE AIRPORT
Year of Grant Award1
Grant Amount2 Project
2005 $1,879,395 Expand Apron, Improve Terminal Building, Security Enhancements
2005 $4,500,000 Extend Runway Safety Area – Runway 13/31, Remove Obstructions
2007 $5,350,000 Rehabilitate Runway 13/31
2008 $741,606 Acquire Snow Removal Equipment, Improve Snow Removal Equipment Building
2009 $266,000 Acquire Snow Removal Equipment, Rehabilitate Apron, Rehabilitate Taxiway
2010 $218,200 Rehabilitate Apron, Rehabilitate Taxiway
2010 $545,500 Acquire Snow Removal Equipment
2012 $237,230 Conduct Miscellaneous Study
2013 $691,860 Construct Runway Safety Area – Runway 13/31
2013 $2,234,754 Construct Access Road, Construct Apron, Construct Taxiway, Install Perimeter Fencing, Rehabilitate Apron, Remove Obstructions
2014 $18,000,000 Construct Runway Safety Area – Runway 13/31
2015 $9,253,125 Construct Runway Safety Area – Runway 13/31
Total $43,917,670
1. Federal Fiscal Year, ending September 30. 2. Includes entitlement and discretionary grants. SOURCE: Federal Aviation Administration.
Under the FAA Modernization and Reform Act of 2012, the federal share of eligible project costs for nonhub airports is 90 percent (with a 10 percent sponsor match), as was established prior to Vision 100. However, Idaho is one of a number of states with certain nontaxable and public land areas whereby an upward adjustment in the percentage of federal shares of eligible project costs has been listed in FAA Order 5100.38D (Airport Improvement Program Handbook). According to FAA Order 5100.38D, the federal share for AIP grants at small and nonhub airports in Idaho is 93.75 percent, with a 6.25 percent local match. All AIP and local matching funds shown in the capital plans presented in this analysis reflect these funding shares.
3.1.2. Passenger Facility Charges
Since 1991, PFCs have been authorized by Title 14 of the Code of Federal Regulations, Part 158, and the PFC program is administered by the FAA. PFCs are collected from qualified passengers to fund eligible projects. Since April 1, 2001, a PFC of up to $4.50 per qualified enplaned passenger can be imposed by an airport operator. The Airport currently collects a $4.50 PFC (less $0.11 airline carrier compensation charge) from qualified enplaned passengers. PFC revenues may be used on a “pay-as-you-go” basis or leveraged to pay debt service on bonds or other debt used to pay for PFC-eligible projects. Because airports may use PFC revenues for the local matching share of AIP grants, PFCs can help airports implement AIP-financed projects sooner than otherwise programmed. Although the FAA is required to approve the collection and use of PFCs, the program permits local collection of PFC revenues

F.8
through the air carriers that sell tickets to the Airport’s passengers and provides more flexibility to airport sponsors than AIP funds. PFCs may be used for FAA-approved projects that enhance safety, security, or capacity; reduce noise; or increase air carrier competition. Two PFC applications are currently active for the Airport. Application 09 approves the Authority to collect approximately $2.8 million in PFC revenues and to use approximately $1.8 million of PFC revenues to fund the local (matching) share of various recently completed and future improvements at the Airport. Application 10 is a use-only application that approves the Authority to use the remaining $1.0 million in PFC revenues collected under the authority of Application 09. As of May 2016, the Airport has yet to collect and use approximately $2.4 million of its total authority of $2.8 million. Collection authority for Application 09 expires July 1, 2028. For purposes of this financial analysis, it is assumed that the Airport will continue to apply for, collect, and use PFCs at a level of $4.50 per eligible enplaned passenger throughout the planning period. Projected PFCs are based on the enplaned passenger forecast described in Chapter B and are presented in Table F4. Based on this analysis, a total of approximately $7.2 million of PFC revenues may be generated from FY 2017 through the end of the planning period. Table F4 PASSENGER FACILITY CHARGE REVENUE PROJECTION
FY 2017- FY 2019
FY 2020- FY 2022
FY 2023- FY 2025
FY 2026- FY 2028
FY 2029- FY 2031
FY 2032- FY 2034
Enplaned passengers 226,609 251,099 278,237 308,308 341,628 378,550
PFC level $4.50 $4.50 $4.50 $4.50 $4.50 $4.50
Less: airline collection fee (0.11) (0.11) (0.11) (0.11) (0.11) (0.11)
Net PFC level $4.39 $4.39 $4.39 $4.39 $4.39 $4.39
Passengers paying a PFC1 92% 92% 92% 92% 92% 92%
Enplaned passengers paying a PFC
208,480 231,012 255,978 283,643 314,298 348,266
PFC collections $915,227 $1,014,141 $1,123,744 $1,245,193 $1,379,768 $1,528,886
1. Only those passengers that pay for a ticket are charged a PFC for that ticket. Therefore, in any given year, the percentage of passengers paying a PFC may not equal 100 percent. The assumption that 92 percent of passengers enplaned at the Airport pay a PFC is assumed to be reasonable based on historical Airport collections data, as well as generally accepted industry PFC revenue projection practices.
SOURCE: Ricondo & Associates, Inc., based on information provided by the Friedman Memorial Airport Authority and Mead & Hunt, Inc.
3.1.3. Customer Facility Charges
Customer Facility Charges (CFCs) are user fees paid by rental car customers on a-per day or per transaction basis. CFCs are enacted by an airport sponsor, imposed on rental car customers, and are collected by rental car agencies, who remit the collected charge to the airport sponsor. CFC revenues are the principal method utilized by airports to pay for rental car facilities, facility operating and maintenance costs, and costs associated with the acquisition and maintenance of buses or other vehicles that serve the rental car facility. Similar to PFCs, CFCs can be used on a “pay-as-you-go” basis or leveraged to pay debt service on bonds or other debt used to pay for CFC-eligible projects/costs.

F.9
Currently, approximately 70 parking spaces are dedicated for rental car use at the Airport. With annual passenger volume expected to increase 79 percent during the planning period, it is reasonable to expect that the need for additional rental car storage and operating space will increase proportionately to serve passenger demand. In addition, current rental car concessionaires utilize off-airport facilities to park and service their vehicles. While the Authority does not currently collect a CFC, the use of this funding mechanism would serve as a viable means to finance expansion of rental car automobile parking areas, an on-site service facility, and future upgrades and renovations to rental car ticketing counters and offices. As the Authority pursues planned parking expansions, a rental car service facility, and/or terminal expansion and renovations it is recommended that it institute a CFC to finance these improvements.
3.1.4. Third-Party Funds
Development projects that are not eligible for federal grants require funding from local or private funding sources. General examples of projects that are often candidates for third-party funding include hangars, air cargo buildings, aircraft and automobile parking facilities, and other facilities to be constructed by tenants under a lease agreement. Facilities that are constructed with private financial contributions may also provide a financial benefit in the form of land lease revenues to the Airport. The Authority maintains 13 land leases with private aircraft owners and its FBO that have enabled third-party financing, development, and construction of hangar facilities at the Airport As the Authority, implements the recommendations of this Master Plan, it might evaluate additional opportunities to lease land to private parties for the purpose of constructing hangars. Other third-party financing opportunities could potentially evolve for the Authority including partnering with its public parking concessionaire to finance upgrades to parking facilities or the airport parking revenue control system, a food/beverage/gift operator for concession upgrades in the air carrier terminal, and/or a private developer for a rental car service facility.
3.1.5. State Funds
Many states have programs to assist in airport capital development. The Idaho Transportation Department Division of Aeronautics provides discretionary grant funding for public airports in Idaho through the Idaho Airport Aid Program (IAAP). The IAAP provides matching funds to municipal governments for public airport improvements. The grant funds are derived from Idaho’s aviation fuel tax. IAAP funds are primarily distributed for the benefit of the State’s general aviation airports, with only approximately 19 percent of the Division of Aeronautics’ annual budget allocated to Idaho’s seven commercial airports. Funding is calculated upon the relative level of activity at the airport. The Airport has historically received some funds from the IAAP, typically in the amount of $25,000. However, the availability of such funds in any given year is not guaranteed. While state funds may ultimately be used to fund a portion of certain CIP projects through the planning period, the availability/use of such funds is not assumed as part of the funding plan presented in this chapter.
3.1.6. Local Funds
Local funds are needed to finance the difference between the total development costs and the sum of all other applicable funding sources. Local funding sources may include Authority operating reserves, City/County resources, proceeds from the issuance of bonds, or short-term bank loans. As part of the potential funding plan for each development scenario, local funds are primarily used to provide matching contributions for AIP grants. Throughout implementation of either development scenario, it is assumed

F.10
that additional local funds may be required to fund any shortfalls in federal funding. In addition to providing matching funds for AIP grants, local funds are also assumed to cover the entire cost of various projects that are not likely to be eligible for AIP grants, such as the construction of new parking lots or structures.
3.2. Financial Implementation Analysis
This section describes the underlying assumptions as well as the phasing/timing of proposed projects and corresponding cash flow projections for the Existing Airport Scenario and the Replacement Airport Scenario. Table F5 presents key assumptions and metrics related to Airport activity levels, projections of revenues and expenses, and funding sources for the two scenarios. Unless otherwise mentioned, the listed assumption applies to both development scenarios. Table F5 FINANCIAL IMPLEMENTATION ANALYSIS ASSUMPTIONS
Assumption Factor Description / Basis of Assumption
General Assumptions
Projection period FY17-FY34
Existing Airport Scenario
The existing airport would continue to be operated, maintained, and improved to meet applicable standards and demand requirements through the projection period
Replacement Airport Scenario
Critical maintenance and improvement projects would be undertaken at the existing airport, while construction of the a replacement airport would begin in FY 2022 and end in FY 2034 (DBO FY 2035)
Airport Budget
Projections of revenues and expenses are generally based on the Authority's FY 2016 budget (using FY 2016 as the base year)
Inflation 3.0% Consumer Price Index (CPI) forecast assumption
Airline Cost Per Enplanement (CPE) Increase
3.0% To result in 3.0% real annual increase for rent and landing fee; consistent with previous analyses1
Activity Growth
Enplaned Passengers 3.48% Master Plan, Chapter B
Total Operations 1.40% Master Plan, Chapter B
Revenues
Airline Revenue
Airline rented space (existing) 3,170 s.f. Current airline rented area
Airline rented space (future) 4,227 s.f. Airline lease space increases by 1/3 in FY 2019 following completion of the Terminal ATO/Ticketing Renovation & Expansion project
Airline landed weight (annual growth) 1.40% Annual aircraft operations growth
Terminal rental rate (per square-foot) FY 2017: $27.96 FY 2018: $29.36
Assumed rate schedule from FY17-FY20 in accordance with new airline agreement. Starting in FY21, rental

F.11
Assumption Factor Description / Basis of Assumption
FY 2019/FY 2020: $30.76 rates increase by a combination of CPI + 3% CPE increase every two years
Landing fees FY 2017: $1.60/1,000 lbs. mtow
Landing fees increase by a combination of CPI + 3% CPE increase every two years starting in FY 2018
Gate fees FY 2017: $50.00 per gate
Gate fees increase by a combination of CPI + 3% CPE increase every two years starting in FY 2018
Gates leased 2 Assumed through projection period
Utility fees (annual growth) 4.00% Assumption, consistent with previous analyses1
Nonairline Revenue
Automobile Rental (annual growth)
Commission 4.98% Enplaned passenger growth + 1/2 inflation
Counter 3.0% Inflation
Parking 3.48% Enplaned passenger growth
Utilities 4.00% Utility expense growth rate
Auto Parking - Public 3.48% Enplaned passenger growth; assumes revenues increase as demand increases, but parking rates do not increase
Terminal Concession Revenue (annual growth)
Advertising Commission 4.98% Enplaned passenger growth + 1/2 inflation; under Existing Airport Scenario, revenue bumps of 5% occur in FY27 and FY34 following completion of concourse expansion projects that would result in added advertising space
Vending Machines Commission 4.98% Enplaned passenger growth + 1/2 inflation
FBO Revenue (annual growth)
Lease Space 3.0% Inflation, based on Authority's lease log for FBO facilities
Tiedown Fees 1.40% Annual aircraft operations growth
Landing Fees - Transient 1.40% Annual aircraft operations growth
Commission 3.0% Inflation
Fuel Flowage Fees (annual growth)
Fuel sold 1.40% Annual aircraft operations growth
Fuel flowage fee - Jet A $0.12 FY 2016 budget rate constant through projection period
Fuel flowage fee - AvGas $0.10 FY 2016 budget rate constant through projection period

F.12
Assumption Factor Description / Basis of Assumption
Hangars (annual growth) 3.0% Inflation; in the Existing Airport scenario, $75,000 is added to FY23 following completion of the New GA Hangar Site project -- total new area = 60,000 s.f., assumes half is developed as hangar space at $2.50/s.f.
Postal Carrier (annual growth) 3.0% Inflation
Ground Transportation Permits (annual growth)
4.98% Enplaned passenger growth + 1/2 inflation
TSA (annual growth) 3.0% Inflation
Other Revenue (annual growth)
Miscellaneous/Other Revenue 3.0% Inflation
Interest Income $3,080 FY 2016 budget value held constant through projection period
Operating Expenses (annual growth)
Employee wages, benefits and taxes 3.00% Assumption, consistent with previous analysis1
Supplies 3.00% Assumption, consistent with previous analysis1
Utilities 4.00% Assumption, consistent with previous analysis1
Services and Contracts 3.00% Assumption, consistent with previous analysis1
Repairs and Maintenance 2.00% Assumption, consistent with previous analysis1
Insurance 3.00% Assumption, consistent with previous analysis1
Other Operating Expenses 2.00% Assumption, consistent with previous analysis1
Miscellaneous Capital Expenditures 1.00% Assumption, consistent with previous analysis1
Replacement Airport 1.00% Assumption, consistent with previous analysis1
Funding Sources
Passenger Facility Charges (PFCs)
PFC level per eligible enplaned passenger
$4.50 Current maximum authorized level; assumed constant through projection period
Percent eligible enplaned passengers 92% Historical data; acceptable industry assumption
PFC reimbursement
Projects identified on the current PFC Applications 09 and 10 have been funded by the Authority and PFC revenues are being used to reimburse the Authority for these costs
FY 2017 beginning PFC fund balance $159,109 Estimated by taking the current PFC fund balance through May 2, 2016 and adding projected revenues to be collected through the remainder of FY 2016
Airport Improvement Program (AIP) Grants
Annual entitlement grants $1 million Minimum annual entitlement funds for nonhub airports

F.13
Assumption Factor Description / Basis of Assumption
Discretionary grants
Generally assumed to cover the difference between the federal AIP share and the amount able to be funded with entitlement funds
General AIP federal share 93.75% Maximum federal share for nonhub airports in Idaho
Other Funding Sources
Third-party/private investment
In the Replacement Airport scenario, it is assumed that third-party/ private investment will be used to fund general aviation and FBO facilities at the replacement airport
Funding for rental car-related projects
In the Replacement Airport scenario, it is assumed that customer facility charges and/or rent payments from rental car agencies will be used to fund all rental car facilities at the replacement airport
1. References to previous analyses refer to Authority-commissioned financial analyses conducted in 2010/2011, with the goal of developing a financial solution to provide a safe, reliable commercial service airport for Blaine County, Idaho, and the National Airspace System, which accommodates existing and future aviation demand.
SOURCE: Ricondo & Associates, Inc., based on information provided by the Friedman Memorial Airport Authority and Mead & Hunt, Inc.
3.2.1. Existing Airport Scenario – CIP Costs, Funding, and Cash Flow
Table F6 presents project costs and anticipated funding sources for the Existing Airport Scenario CIP for short-term, mid-term, and long-term planning horizons. Each project is analyzed based upon its total cost, estimated eligible funding sources, and use of FAA AIP Entitlement and/or Discretionary funds.

F.14
Table F6 EXISTING AIRPORT SCENARIO – CIP COSTS AND FUNDING
Completion Year (FY)
Estimated Cost1 Estimated Funding Sources AIP Funding Sources
AIP Grants PFC Revenues Local Funds Total AIP Grants Entitlement Discretionary
Short-Term CIP (FY 2017 – FY 2018)
Reconfigure Terminal Auto Parking and Roadways* 2017 $181,000 $169,688 $- $11,313 $169,688 $169,688 $-
Control Tower Siting Study with AFTIL* 2017 200,000 187,500 - 12,500 187,500 187,500 -
Expand Commercial Apron* 2017 1,639,000 1,536,563 - 102,438 1,536,563 1,492,813 43,750
Land Acquisition – Environmental Assessment* 2017 200,000 - - 200,000 - - -
Terminal ATO/Ticketing Renovation & Expansion* 2018 1,400,000 - - 1,400,000 - - -
Construct New Surface Parking Lot, Alt 2 (107 Spaces) 2018 670,000 - - 670,000 - - -
Acquire Land – Airport Development, RPZ, & Obstruction Mitigation – Fee Simple* 2018 1,200,000 1,125,000 - 75.000 1,125,000 1,000,000 125,000
Acquire ARFF Equipment* 2018 600,000 562,500 - 37,500 562,500 - 562,500
Subtotal Short-Term CIP
$6,090,000 $3,581,250 $- $2,508,750 $3,581,250 $2,850,000 $731,250
Mid-Term CIP (FY 2019 – FY 2024)
Control Tower Conceptual Design & Environmental Assessment* 2019 $225,000 $210,938 $- $14,063 $210,938 $210,938 $-
Acquire Land – Airport Development, RPZ, & Obstruction Mitigation – Fee Simple* 2019 1,200,000 1,125,000 - 75,000 1,125,000 789,063 335,938
Control Tower Design & Permitting* 2020 700,000 656,250 - 43,750 656,250 656,250 -
Rehabilitate Runway* 2021 2,311,000 2,166,563 - 144,438 2,166,563 1,343,750 822,813
Acquire SRE Equipment* 2021 500,000 468,750 - 31,250 468,750 - 468,750
Control Tower Construction* 2022 6,600,000 6,187,500 - 412,500 6,187,500 1,000,000 5,187,500
Construct New Surface Parking Lot, Alt 3 Phase 1 (286 Spaces)* 2022 761,000 - - 761,000 - - -
Acquire SRE Equipment 2022 500,000 468,750 - 31,250 468,750 - 468,750
Acquire Land for Auto Parking 2022 900,000 - - 900,000 - - -
Expand Commercial Apron (3 Positions)* 2023 1,788,000 1,676,250 - 111,750 1,676,250 1,000,000 676,250
Expand GA Aprons (Recapture Pre-RSA Improvements)* 2023 2,769,000 2,595,938 - 173,063 2,595,938 - 2,595,938
Control Tower Commissioning* 2023 100,000 93,750 - 6,250 93,750 - 93,750
Acquire SRE Equipment* 2023 500,000 468,750 - 31,250 468,750 - 468,750
New GA Hangar Area (Site Preparation, Access Road, & Parking)* 2024 1,144,000 1,072,500 - 71,500 1,072,500 - 1,072,500
Remove 2 GA Hangars 2024 168,000 157,500 10,500 - 157,500 157,500 -
Acquire SRE Equipment 2024 500,000 468,750 31,250 - 468,750 468,750 -
Subtotal Mid-Term CIP
$20,666,000 $17,817,188 $41,750 $2,807,063 $17,817,188 $5,626,250 $12,190,938
Long-Term CIP (FY 2025 – FY 2034)
Terminal Security Checkpoint Expansion 2025 $800,000 $750,000 $50,000 $- $750,000 $750,000 $-
Terminal Concourse Expansion - East 2026 1,000,000 937,500 62,500 - 937,500 937,500 -
Expand GA Apron (20-year Demand) 2027 3,200,000 3,000,000 200,000 - 3,000,000 1,686,250 1,313,750
Acquire SRE Equipment 2028 2,000,000 1,875,000 125,000 - 1,875,000 1,000,000 875,000
Construct New Surface Parking Lot, Alt 3 Phase 2 (125 Spaces) 2030 444,000 - - 444,000 - - -
Terminal Concourse Expansion - West 2033 6,000,000 5,625,000 375,000 - 5,625,000 5,625,000 -
Construct Parking Structure (net increase 150 spaces) 2034 10,000,000 - - 10,000,000 - - -
Subtotal Long-Term CIP
$23,444,000 $12,187,500 $812,500 $10,444,000 $12,187,500 $9,998,750 $2,188,750
Total CIP
$50,200,000 $33,585,938 $854,250 $15,759,813 $33,585,938 $18,475,000 $15,110,938
Asterisk (*) denotes that the project is potentially PFC eligible. Authority existing PFC collections are obligated thru 2023. It is recommended that the Authority seek authorization to impose/use a PFC for the project upon completion of existing PFC.
1. Estimated costs assumed to be in current (2016) dollars.
SOURCE: Ricondo & Associates, Inc., based on information provided by the Friedman Memorial Airport Authority and Mead & Hunt, Inc.

F.15
The following summarizes the costs, funding plan, and key funding assumptions for the Existing Airport Scenario:
Total CIP cost is approximately $50.2 million, comprised of approximately $33.6 million of AIP grants, including approximately $18.5 million of entitlement grants and approximately $15.1 million of discretionary grants; approximately $0.85 million PFC revenues; and approximately $15.8 million local funds.
The AIP funding share is 93.75 percent for AIP eligible projects.
$1.0 million in annual AIP entitlement grants are assumed throughout the plan.
$850,000 in AIP Entitlement carryover funding is available for use for FY 2017 projects.
Current PFC Applications 09 and 10 commit all collections through FY 2023 for reimbursement of local funds expended on completed projects. PFC revenue generated between FY 2024 and FY 2034 can be used for pay-as-you-go projects during this period and to reimburse the Authority for projects completed in FY 2017 – FY 2024 (see projects with “*” in Table F6).
The Terminal ATO/Ticketing Renovation and Expansion Project ($1.2 million) programmed for completion in FY 2018 assumes 100 percent local funding. It is estimated that approximately 30 percent of this cost is eligible to be reimbursed through PFC collections in future years. PFC funding is not available to support this project in FY 2018 because this revenue stream is committed to the Authority’s PFC Applications 09 and 10.
Land acquisition costs identified in FY2018 and FY2019 for airport development, RPZ, and obstruction mitigation assumes acquiring fee simple interest in adjoining property. As stated in Chapter D, the creation of perpetual easements and/or control by other lawful measures for the area south of the airport to protect the Airport from encroachment by incompatible land uses and approach/departure obstructions may be other options available to the Authority. The area of land estimated for acquisition is 58.9 acres (10.4 acres for development and 47.5 acres for RPZ control, obstruction removal and approach protection). Land acquisition costs were estimated based upon a review of agricultural properties sold and for sale in the vicinity of the Airport. Costs for this type of land currently vary from less than $10,000 per acre to over $80,000 per acre, depending on a wide variety of factors. These factors include current and potential zoning, location and the priority and quantity of appurtenant water rights, among others. Based on the range of values, an estimated cost of $40,000 per acre was used to develop land acquisition costs shown divided over a 2 year period. The Authority will follow the provisions of the Uniform Relocation Assistance and Real Property Acquisition Policies Act (Uniform Act) (42 USC 4601 et seq), as amended, for land to be acquired with AIP or PFC funds. For those areas of land acquired without use of AIP or PFC funds, the Authority anticipates to negotiate in good faith and use a minimum of one independent appraisal to determine fair market value.
The Authority collects sufficient PFC revenue to fund all eligible projects within the proposed CIP based upon the enplaned passenger forecast. While the Authority will need to initially allocate its funds as the local match for some FAA AIP projects, the anticipated PFC revenue to be generated during this period more than offsets local grant matching requirements and will allow the Authority to recoup these initial allocations and reimburse its Operating Reserve.

F.16
The following projects are to be funded 100 percent with local funds as they are ineligible for FAA AIP grants. These projects total approximately $12.8 million, representing approximately 83 percent of the Authority’s anticipated total capital outlay expected as the result of this scenario, with the Parking Structure comprising $10.0 million of this total.
o Construct New Surface Parking Lot, Alt 2 (107 spaces) – FY 2017
o Construct New Surface Parking Lot, Alt 3 Phase 1 (286 spaces) – FY 2022
o Acquire Land Auto Parking – FY 2022
o Construct New Surface Parking Lot, Alt 3 Phase 2 (125 spaces) – FY 2030
o Construct Parking Structure (net increase 150 spaces) – FY 2034
A cash flow analysis based on the funding plan developed for the Existing Airport Scenario is presented in Table F7. The analysis includes projections of airline revenue, nonairline revenue, other revenue, operating expenses, and net operating revenue anticipated for the Authority during the planning period. Assumptions presented in Table F5 and CIP expenditures presented in Table F6 are factored into the cash flow projection to yield a projected annual ending balance for the Authority’s Operating Reserve. Table F8 provides supplemental information for the cash flow analysis, including a summary of the projected receipt and use of AIP grants and the application of PFC revenues, including the transfer of PFC reimbursement revenues to the Authority’s Operating Reserve.

F.17
Table F7 EXISTING AIRPORT SCENARIO – ANNUAL FUNDING AND CASH FLOW
FY 2017 FY 2018 FY 2019 FY 2020 FY 2021 FY 2022 FY 2023 FY 2024 FY 2025 FY 2026 FY 2027 FY 2028 FY 2029 FY 2030 FY 2031 FY 2032 FY 2033 FY 2034
Operating Reserve
Beginning Balance $2,000,000 $2,266,385 $ 550,385 $ 985,142 $1,487,853 $1,879,939 $ 368,498 $ 738,391 $1,348,367 $2,050,695 $2,775,294 $3,397,539 $4,133,867 $5,031,543 $5,411,316 $5,917,524 $6,456,116 $ 7,022,751
Airline Revenue 258,616 275,176 315,100 328,305 339,350 353,734 365,533 381,200 393,806 410,872 424,342 442,932 457,327 477,576 492,963 515,020 531,468 555,496
Nonairline Revenue 2,609,458 2,693,566 2,780,585 2,861,628 2,945,544 3,032,447 3,197,459 3,292,953 3,391,879 3,494,375 3,603,268 3,713,477 3,827,715 3,946,147 4,068,944 4,196,286
4,328,361 4,469,311
Other Revenue 36,040 37,029 38,047 39,096 40,177 41,290 42,436 43,617 44,833 46,085 47,375 48,704 50,073 51,483 52,935 54,431 55,971 57,558
Less: Operating Expenses (2,765,289) (2,844,228) (2,925,481) (3,009,119) (3,095,213) (3,183,836) (3,275,065) (3,368,978) (3,465,656) (3,565,182) (3,667,643) (3,773,125) (3,881,721) (3,993,525) (4,108,633) (4,227,145)
(4,349,165) (4,474,799)
Net Revenue $ 138,824 $ 161,543 $ 208,251 $ 219,910 $ 229,858 $ 243,634 $ 330,362 $ 348,791 $ 364,862 $ 386,150 $ 407,343 $ 431,987 $ 453,394 $ 481,681 $ 506,209 $ 538,592 $ 566,635 $ 607,567
PFC Reimbursement $ 453,811 $ 304,957 $ 315,569 $ 326,551 $ 337,915 $ 349,674 $ 361,843 $ 332,685 $ 337,466 $ 338,449 $ 214,902 $ 304,341 $ 444,282 $ 342,092 $ - $ - $ - $ -
CIP Expenditures $(326,250) $(2,182,500) $ (89,063) $ (43,750) $(175,688) $(2,104,750) $(322,313) $ (71,500) $ - $ - $ - $ - $ - $(444,000) $ - $ - $ - $(7,630,318)
Ending Balance $2,266,385 $ 550,385 $ 985,142 $1,487,853 $1,879,939 $ 368,498 $ 738,391 $1,348,367 $2,050,695 $2,775,294 $3,397,539 $4,133,867 $5,031,543 $5,411,316 $5,917,524 $6,456,116 $7,022,751 $ -
Funding Summary
CIP Funding Requirement $2,220,000 $3,870,000 $1,425,000 $ 700,000 $2,811,000 $8,761,000 $5,157,000 $1,812,000 $ 800,000 $1,000,000 $3,200,000 $2,000,000 $ - $ 444,000 $ - $ - $6,000,000 $10,000,000
AIP Grants 1,893,750 1,687,500 1,335,938 656,250 2,635,313 6,656,250 4,834,688 1,698,750 750,000 937,500 3,000,000 1,875,000 - - - - 5,625,000 -
PFC Funds - - - - - - - 41,750 50,000 62,500 200,000 125,000 - - - - 375,000 -
Local Funds (Operating Reserve) 326,250 2,182,500 89,063 43,750 175,688 2,104,750 322,313 71,500 - - - - - 444,000 - - - 7,630,318
Total Funding Sources $2,220,000 $3,870,000 $1,425,000 $ 700,000 $2,811,000 $8,761,000 $5,157,000 $1,812,000 $ 800,000 $1,000,000 $3,200,000 $2,000,000 $ - $ 444,000 $ - $ - $6,000,000 $ 7,630,318
Projected Funding Deficiency - - - - - - - - - - - - - - - - - $(2,369,682)
SOURCE: Ricondo & Associates, Inc., based on information provided by the Friedman Memorial Airport Authority and Mead & Hunt, Inc.

F.18
Table F8 EXISTING AIRPORT SCENARIO – AIP GRANTS AND PFC REVENUE PROJECTIONS
FY 2017 FY 2018 FY 2019 FY 2020 FY 2021 FY 2022 FY 2023 FY 2024 FY 2025 FY 2026 FY 2027 FY 2028 FY 2029 FY 2030 FY 2031 FY 2032 FY 2033 FY 2034
AIP Grant Funds
Carryover from Prior Year
$850,000 $- $- $- $343,750 $- $- $- $373,750 $623,750 $686,250 $- $- $1,000,000 $2,000,000 $3,000,000 $4,000,000 $375,000
Annual Entitlement Grants
1,000,000 1,000,000 1,000,000 1,000,000 1,000,000 1,000,000 1,000,000 1,000,000 1,000,000 1,000,000 1,000,000 1,000,000 1,000,000 1,000,000 1,000,000 1,000,000 2,000,000 -
Less: CIP Expenditures
(1,850,000) (1,000,000) (1,000,000) (656,250) (1,343,750) (1,000,000) (1,000,000) (626,250) (750,000) (937,500) (1,686,250) (1,000,000) - - - - (5,625,000) -
Remaining $- $- $- $343,750 $- $- $- $373,750 $623,750 $686,250 $0 $0 $1,000,000 $2,000,000 $3,000,000 $4,000,000 $375,000 $375,000
Annual Entitlement Grants
$1,850,000 $1,000,000 $1,000,000 $656,250 $1,343,750 $1,000,000 $1,000,000 $626,250 $750,000 $937,500 $1,686,250 $1,000,000 $- $- $- $- $5,625,000 $-
Discretionary Grants
43,750 687,500 335,938 - 1,291,563 5,656,250 3,834,688 1,072,500 - - 1,313,750 875,000 - - - - - -
Total AIP Grants $1,893,750 $1,687,500 $1,335,938 $656,250 $2,635,313 $6,656,250 $4,834,688 $1,698,750 $750,000 $937,500 $3,000,000 $1,875,000 $- $- $- $- $5,625,000 $-
PFC Fund
Beginning Balance
$159,109 $- $- $- $- $- $- $- $- $- $- $- $- $- $117,651 $593,393 $1,085,691 $1,220,121
Annual PFC Collections
294,701 304,957 315,569 326,551 337,915 349,674 361,843 374,435 387,466 400,949 414,902 429,341 444,282 459,743 475,742 492,298 509,430 527,158
Less: CIP pay go Expenditures
- - - - - - - (41,750) (50,000) (62,500) (200,000) (125,000) - - - - (375,000) -
Net PFC revenues
$294,701 $304,957 $315,569 $326,551 $337,915 $349,674 $361,843 $332,685 $337,466 $338,449 $214,902 $304,341 $444,282 $459,743 $475,742 $492,298 $134,430 $527,158
Reimbursements
Applications 09/10
$453,811 $304,957 $315,569 $326,551 $337,915 $349,674 $292,624 $- $- $- $- $- $- $- $- $- $- $-
Future Applications
- - - - - - 69,219 332,685 337,466 338,449 214,902 304,341 444,282 342,092 - - - -
Transfer to Operating Reserve
($453,811) ($304,957) ($315,569) ($326,551) ($337,915) ($349,674) ($361,843) ($332,685) ($337,466) ($338,449) ($214,902) ($304,341) ($444,282) ($342,092) $- $- $- $-
PFC Fund ending balance
$- $- $- $- $- $- $- $- $- $- $- $- $- $117,651 $593,393 $1,085,691 $1,220,121 $1,747,280
SOURCE: Ricondo & Associates, Inc., based on information provided by the Friedman Memorial Airport Authority and Mead & Hunt, Inc.

F.19
As shown on Table F7, a beginning balance of $2 million in the Authority’s Operating Reserve is assumed for FY 2017. Based on the assumptions listed in Table F5, airline revenue is projected to grow at a CAGR of approximately 4.6 percent from FY 2017 to FY 2034, while nonairline revenue is projected to grow at a CAGR of approximately 3.2 percent over the period. Total revenue is projected to grow at a CAGR of approximately 3.3 percent, compared to operating expenses, with a projected CAGR of approximately 2.9 percent. Net revenue available for funding of capital development projects is projected to grow at a CAGR of approximately 9.1 percent through FY 2034. Based upon the assumptions used to generate the cash flow analysis as well as an understanding of the anticipated projects and corresponding eligibility for AIP and PFC funding, it is projected that the estimated funding sources will be adequate until FY2034 when construction of the automobile Parking Structure is proposed to be undertaken. Due to this project, a funding deficiency of approximately $2.4 million is projected. This funding deficiency may be alleviated through reduced scope/cost or elimination of the project, moving the implementation date of the project further into the future, and/or identifying alternative funding sources for the project. Overall, the financial analysis shows that the potential funding plan developed for the Existing Airport Scenario is generally feasible, given the assumptions described in this section.
3.2.2. Replacement Airport Scenario – CIP Costs, Funding, and Cash Flow
Table F9 presents project costs and potential funding sources for the Replacement Airport Scenario CIP. These estimates are not site-specific, but rather are generic estimates based on blending the planning-level cost estimates developed in 2011 for Site 10A and Site 12, and escalating the costs to account for inflation. The following summarizes the costs, funding plan, and key funding assumptions for this scenario:
Total CIP cost is approximately $338.1 million, comprised of $113.8 million of AIP grants, including approximately $18.9 million of entitlement grants and approximately $95.0 million of discretionary grants; approximately $5.0 million PFC revenues; approximately $136.3 million local funds; approximately $80.0 million Third Party funds; and approximately $3.0 million of CFC revenues and/or rental car company rent. The estimated Third Party and rental car/CFC funding is to be used in association with the Replacement Airport CIP.
The Replacement Airport CIP is assumed to cost approximately $322 million, consisting of $100 million of AIP grants, including $13.0 million of entitlement grants and $87.0 million of discretionary grants; approximately $4.8 million of PFC revenues; $134.2 million of local funds; $80.0 million or Third Party funds; and $3.0 million of CFCs/rental car company rent.
The AIP funding share is 93.75 percent for AIP eligible projects.
$1.0 million in annual AIP entitlement grants are assumed throughout the plan.
$850,000 in AIP Entitlement carryover funding is available for use for FY 2017 projects.
Current PFC Applications 09 and 10 commit all collections through FY 2023 for reimbursement of local funds expended on completed projects. PFC revenue generated between FY 2024 and FY 2031 are assumed to be used on a pay-go basis to partially fund the terminal, ARFF, and maintenance buildings associated with the replacement airport. PFC revenue collected subsequent to 2031 may be used to reimburse the Authority for projects completed in FY 2017 – FY 2021 (see projects with “*” in Table F9).

F.20
Table F9 REPLACEMENT AIRPORT SCENARIO – CIP COSTS AND FUNDING
Completion Year (FY) Estimated Cost1
Estimated Funding Sources AIP Funding Sources
AIP Grants PFC Revenues Local Funds Third Party CFC/ RACS 2/ Total AIP Entitlement Discretionary
Existing Airport CIP
Reconfigure Terminal Auto Parking and Roadways* 2017 $181,000 $169,688 $- $11,313 $- $- $169,688 $169,688 $-
Expand Commercial Apron* 2017 1,639,000 1,536,563 - 102,438 - - 1,536,563 1,492,813 43,750
Control Tower Siting Study with AFTIL 2017 200,000 187,500 - 12,500 - - 187,500 187,500 -
Terminal ATO/Ticketing Renovation & Expansion* 2018 1,400,000 - - 1,400,000 - - - - -
Acquire ARFF Equipment* 2018 600,000 562,500 - 37,500 - - 562,500 562,500 -
Control Tower Conceptual Design & Environmental Assessment 2019 225,000 210,938 - 14,063 - - 210,938 210,938 -
Control Tower Design & Permitting 2020 700,000 656,250 - 43,750 - - 656,250 656,250 -
Rehabilitate Runway* 2021 500,000 468,750 - 31,250 - - 468,750 70,313 398,438
Acquire SRE Equipment* 2021 500,000 468,750 - 31,250 - - 468,750 468,750 -
Control Tower Construction 2022 6,600,000 6,187,500 - 412,500 - - 6,187,500 1,000,000 5,187,500
Acquire SRE Equipment* 2022 500,000 468,750 - 31,250 - - 468,750 468,750 -
Control Tower Commissioning 2023 100,000 93,750 - 6,250 - - 93,750 93,750 -
Acquire SRE Equipment* 2023 500,000 468,750 - 31,250 - - 468,750 468,750 -
Acquire SRE Equipment 2024 500,000 468,750 31,250 - - - 468,750 - 468,750
Acquire SRE Equipment* 2028 2,000,000 1,875,000 125,000 - - - 1,875,000 - 1,875,000
Subtotal Existing Airport CIP
$16,145,000 $13,823,438 $156,250 $2,165,313 $- $- $ 13,823,438 $ 5,850,000 $ 7,973,438
Replacement Airport CIP
Land Acquisition 2022 $2,000,000 $- $- $2,000,000 $- $- $- $- $-
Off-Airport Power, Gas, & Communications 2023 25,000,000 - - 25,000,000 - - - - -
Grading & Site Preparation 2024 50,000,000 22,500,000 - 27,500,000 - - 22,500,000 3,000,000 19,500,000
Access Roads & Parking 2025 10,000,000 - - 10,000,000 - - - - -
Water & Sewer Infrastructure 2026 15,000,000 - - 15,000,000 - - - - -
On-Site Power, Gas, & Communications 2027 2,000,000 - - 2,000,000 - - - - -
Runway/Taxiway/Apron Construction w/Lighting 2028 80,000,000 64,000,000 - 16,000,000 - - 64,000,000 4,000,000 60,000,000
Perimeter Road & Fence 2029 5,000,000 - - 5,000,000 - - - - -
Control Tower & Navaids 2030 15,000,000 13,500,000 - 1,500,000 - - 13,500,000 6,000,000 7,500,000
Terminal, ARFF, & Maintenance Buildings 2031 35,000,000 - 4,828,717 30,171,283 - - - - -
Rental Car Facilities 2032 3,000,000 - - - - 3,000,000 - - -
GA & FBO Facilities 2033/2034 80,000,000 - - - 80,000,000 - - - -
Subtotal Replacement Airport CIP
$322,000,000 $100,000,000 $4,828,717 $134,171,283 $80,000,000 $3,000,000 $100,000,000 $13,000,000 $87,000,000
TOTAL CIP
$338,145,000 $113,823,438 $4,984,967 $136,336,596 $ 80,000,000 $3,000,000 $113,823,438 $18,850,000 $94,973,438
Asterisk (*) denotes that the project is potentially PFC eligible. Authority existing PFC collections are obligated thru 2023. It is recommended that the Authority seek authorization to impose/use a PFC for the project upon completion of existing PFC. 1. Estimated costs assumed to be in current (2016) dollars. SOURCE: Ricondo & Associates, Inc., based on information provided by the Friedman Memorial Airport Authority and Mead & Hunt, Inc.

F.21
It is assumed that the following projects identified in the Existing Airport CIP are considered priorities to be completed during the period FY 2017 – FY 2021:
o Reconfigure Terminal Auto Parking and Roadways
o Expand Commercial Apron
o Construct Air Traffic Control Tower
o Rehabilitate Runway
o Terminal ATO/Ticketing Renovation & Expansion
o Acquire ARFF Equipment
o Acquire SRE Equipment
Projects associated with the Replacement Airport Project commence in FY2022 with occupancy of the new Airport occurring in FY2035.
The Authority will carryover its AIP entitlements for the following periods: FY 2022-FY 2024 ($3.0 million); FY 2025-FY 2028 ($4.0 million) and FY 2029-FY 2034 ($6.0 million).
With respect to the Replacement Airport CIP, FAA funding is dedicated solely to site preparation, airfield work, and construction/installation of a control tower and navigational aids.
Project components not absolutely essential to the operation of the replacement airport are assumed to be funded by third parties. Development of such facilities could be undertaken by individual tenants or developers to reduce Sponsor share costs and/or the amounts required to be funded through sources such as general obligation bonds. These costs are estimated at $83 million and, for the sake of simplicity, are aggregated in FY2032 through FY2034. Project costs assumed by third parties would include but are not limited to:
o Land acquisition, grading, access, parking, and utilities for private development sites.
o General aviation hangars and aprons.
o Fixed base operator facilities.
o Rental car facilities.
o Cargo facilities.
o U.S. Forest Service facilities.
A cash flow analysis for the period FY2017-2034 for the Replacement Airport Scenario is presented in Table F10 and includes projections of airline revenue, nonairline revenue, other revenue, operating expenses, and net operating revenue, and considers the assumptions presented in Table F5, as well as the CIP expenditures presented in Table F9. Table F11 provides supplemental information for the cash flow analysis, including a summary of the projected receipt and use of AIP grants and the application of PFC revenues, including the transfer of PFC reimbursement revenues to the Authority’s Operating Reserve.

F.22
Table F10 REPLACEMENT AIRPORT SCENARIO – ANNUAL FUNDING AND CASH FLOW
FY 2017 FY 2018 FY 2019 FY 2020 FY 2021 FY 2022 FY 2023 FY 2024 FY 2025 FY 2026 FY 2027 FY 2028 FY 2029 FY 2030 FY 2031 FY 2032 FY 2033 FY 2034
Operating Reserve
Beginning Balance
$2,000,000 $2,466,385 $1,495,385 $1,942,642 $2,382,853 $2,375,626 $968,935 $- $- $- $- $- $- $- $- $- $437,313 $899,564
Airline Revenue
258,616 275,176 315,100 328,305 339,350 353,734 365,533 381,200 393,806 410,872 424,342 442,932 457,327 477,576 492,963 515,020 531,468 555,496
Nonairline Revenue
2,609,458 2,693,566 2,780,585 2,861,628 2,945,544 3,032,447 3,122,459 3,215,703 3,312,312 3,412,420 3,516,172 3,623,715 3,735,204 3,850,803 3,970,678 4,095,008 4,223,976 4,357,775
Other Revenue 36,040 37,029 38,047 39,096 40,177 41,290 42,436 43,617 44,833 46,085 47,375 48,704 50,073 51,483 52,935 54,431 55,971 57,558
Less: Operating Expenses
(2,765,289) (2,844,228) (2,925,481) (3,009,119) (3,095,213) (3,183,836) (3,275,065) (3,368,978) (3,465,656) (3,565,182) (3,667,643) (3,773,125) (3,881,721) (3,993,525) (4,108,633) (4,227,145) (4,349,165) (4,474,799)
Net Revenue $138,824 $161,543 $208,251 $219,910 $229,858 $243,634 $255,362 $271,541 $285,294 $304,195 $320,247 $342,226 $360,883 $386,337 $407,943 $437,313 $462,250 $496,030
PFC Reimbursement
$453,811 $304,957 $315,569 $295,301 $212,915 $349,674 $361,843 $87,031 $- $- $- $- $- $- $- $- $- $-
CIP Expenditures
(126,250) (1,437,500) (76,563) (75,000) (450,000) (2,000,000) (1,586,141) (358,572) (285,294) (304,195) (320,247) (342,226) (360,883) (386,337) (407,943) - - -
Ending Balance
$2,466,385 $1,495,385 $1,942,642 $2,382,853 $2,375,626 $968,935 $- $- $- $- $- $- $- $- $- $437,313 $899,564 $1,395,594
Funding Summary
CIP Funding Requirement
$2,020,000 $1,800,000 $1,225,000 $1,700,000 $9,200,000 $2,000,000 $25,000,000 $50,000,000 $10,000,000 $15,000,000 $2,000,000 $80,000,000 $5,000,000 $15,000,000 $35,000,000 $3,000,000 $40,000,000 $40,000,000
AIP Grants 1,893,750 562,500 1,148,438 1,593,750 8,625,000 - - 22,500,000 - - - 64,000,000 - 13,500,000 - - - -
PFC Funds - - - 31,250 125,000 - - - - - - - - - 4,828,717 - - -
Local Funds (Operating Reserve)
126,250 1,437,500 76,563 75,000 450,000 2,000,000 1,586,141 358,572 285,294 304,195 320,247 342,226 360,883 386,337 407,943 - - -
Third Party/Other Funds
- - - - - - - - - - - - - - - - 40,000,000 40,000,000
CFC Revenues/Rental Car Rents
- - - - - - - - - - - - - - - 3,000,000 - -
Total Funding Sources
$2,020,000 $2,000,000 $1,225,000 $1,700,000 $9,200,000 $2,000,000 $1,586,141 $22,858,572 $285,294 $304,195 $320,247 $64,342,226 $360,883 $13,886,337 $5,236,660 $3,000,000 $40,000,000 $40,000,000
Projected Funding Deficiency $- $- $- $- $- $- ($23,413,859) ($27,141,428) ($9,714,706) ($14,695,805) ($1,679,753) ($15,657,774) ($4,639,117) ($1,113,663) ($29,763,340) $- $- $-
SOURCE: Ricondo & Associates, Inc., based on information provided by the Friedman Memorial Airport Authority and Mead & Hunt, Inc.

F.23
Table F11 REPLACEMENT AIRPORT SCENARIO – AIP GRANTS AND PFC REVENUE PROJECTIONS
FY 2017 FY 2018 FY 2019 FY 2020 FY 2021 FY 2022 FY 2023 FY 2024 FY 2025 FY 2026 FY 2027 FY 2028 FY 2029 FY 2030 FY 2031 FY 2032 FY 2033 FY 2034
AIP Grant Funds
Carryover from Prior Year
$850,000 $- $437,500 $289,063 $164,063 $- $1,000,000 $2,000,000 $- $1,000,000 $2,000,000 $3,000,000 $- $1,000,000 $- $- $- $-
Annual Entitlement Grants
1,000,000 1,000,000 1,000,000 1,000,000 1,000,000 1,000,000 1,000,000 1,000,000 1,000,000 1,000,000 1,000,000 1,000,000 1,000,000 5,000,000 - - - -
Less: CIP Expenditures
(1,850,000) (562,500) (1,148,438) (1,125,000) (1,164,063) - - (3,000,000) - - - (4,000,000) - (6,000,000) - - - -
Remaining $- $437,500 $289,063 $164,063 $- $1,000,000 $2,000,000 $0 $1,000,000 $2,000,000 $3,000,000 $- $1,000,000 $- $- $- $- $-
Annual Entitlement Grants
$1,850,000 $562,500 $1,148,438 $1,125,000 $1,164,063 $- $- $3,000,000 $- $- $- $4,000,000 $- $6,000,000 $- $- $- $-
Discretionary Grants
43,750 - - 468,750 7,460,938 - - 19,500,000 - - - 60,000,000 - 7,500,000 - - - -
Total AIP Grants $1,893,750 $562,500 $1,148,438 $1,593,750 $8,625,000 $- $- $22,500,000 $- $- $- $64,000,000 $- $13,500,000 $- $- $- $-
PFC Fund
Beginning Balance
$159,109 $- $- $- $- $- $- $- $287,404 $674,870 $1,075,820 $1,490,722 $1,920,063 $2,364,345 $2,824,088 ($1,528,886) ($1,036,588) ($527,158)
Annual PFC Collections
294,701 304,957 315,569 326,551 337,915 349,674 361,843 374,435 387,466 400,949 414,902 429,341 444,282 459,743 475,742 492,298 509,430 527,158
Less: CIP Expenditures (pay go)
- - - (31,250) (125,000) - - - - - - - - - (4,828,717) - - -
Net PFC revenues
$294,701 $304,957 $315,569 $295,301 $212,915 $349,674 $361,843 $374,435 $387,466 $400,949 $414,902 $429,341 $444,282 $459,743 ($4,352,975) $492,298 $509,430 $527,158
Reimbursements
Application 09/10
$453,811 $304,957 $315,569 $295,301 $212,915 $349,674 $361,843 $87,031 $- $- $- $- $- $- $- $- $- $-
Future Applications
- - - - - - - - - - - - - - - - - -
Transfer to Operating Reserve
($453,811) ($304,957) ($315,569) ($295,301) ($212,915) ($349,674) ($361,843) ($87,031) $- $- $- $- $- $- $- $- $- $-
PFC Fund ending balance
$- $- $- $- $- $- $- $287,404 $674,870 $1,075,820 $1,490,722 $1,920,063 $2,364,345 $2,824,088 ($1,528,886) ($1,036,588) ($527,158) $-
SOURCE: Ricondo & Associates, Inc., based on information provided by the Friedman Memorial Airport Authority and Mead & Hunt, Inc.

F.24
There is no assumed difference in projections of airline revenue, other revenue, and operating expenses between the Replacement Airport Scenario and the Existing Airport Scenario. Nonairline revenue under the Existing Airport Scenario is approximately 2.4 percent higher than under the Replacement Airport Scenario due to assumed increases in hangar development area (and corresponding hangar revenues) and additional terminal area for advertising revenue. The corresponding development projects that result in the assumed increase in revenue are not undertaken in the Replacement Airport Scenario. Total revenue under the Replacement Airport Scenario is projected to grow at a CAGR of approximately 3.2 percent from FY 2017 – FY 2034, while net revenue is projected to grow at a CAGR of approximately 7.8 percent over the same period. Based upon the assumptions used to generate this cash flow analysis as well as anticipated projects and corresponding eligibility for AIP and PFC funding, it is projected that the a local funding shortfall of $127.8 million exists for this scenario. Achieving a financially viable Replacement Airport Scenario would require major decreases in capital cost requirements, significant additional federal participation, and/or significant local and possibly third-party financial resources. The achievable funding levels for the Airport are generally adequate for undertaking a capital development program of the size and scope of the program represented by the Existing Airport Scenario CIP. Funding challenges would arise for any significantly larger/more expensive capital development program. One potential source of funding for the replacement airport would be proceeds generated by sale of the existing Airport site for redevelopment. Because sale of the existing Airport site would occur after the replacement airport is open, this revenue source would not be available until after the 20-year planning period and is therefore outside the scope of this analysis. However, proceeds from sale of the existing Airport site could possibly be used to pay off a portion of required local government bonds.
4. Conclusion and Recommendations Based on the analysis documented in this chapter, implementation of the Existing Airport Scenario appears to be financially feasible given the funding sources anticipated to be available to the Authority through the planning period. However, implementation of the Replacement Airport Scenario is not financially feasible given the anticipated availability of funding sources. Given a choice between implementation of the two scenarios, from a financial feasibility standpoint, the Existing Airport Scenario is the most viable at this point in time. As implementation of the CIP progresses it is recommended that Airport Management, in conjunction with the Authority, assess the financial feasibility of each project included in the CIP. Future considerations regarding the funding of the CIP include the following:
Enplaned passenger/traffic growth – As applicable, the financial plan was developed and analyzed in consideration of the FAA approved aviation activity forecast developed for the Airport (see Chapter B). Actual year-to-year enplaned passengers and aircraft operations will likely deviate from the forecast. Significant changes in enplaned passenger and aircraft operations levels may impact revenues and expenses, as well as PFC revenues and the availability of AIP grants.
Availability of AIP funds – The current funding plan analyzed for each development scenario assumes that the FAA will continue to authorize and appropriate AIP funds for eligible projects. Because the level of authorized and appropriated AIP funds may vary from year to year, alternative funding sources may need to be identified if grants cannot be obtained for certain eligible projects.

F.25
Potential increase in maximum PFC level – Airport industry groups have requested that federal PFC regulations be changed to increase the PFC program’s maximum PFC level from its current level of $4.50 per eligible enplaned passenger. Although current FAA authorizing legislation does not address the issue, it is possible that future reauthorization legislation will address it, as industry pressure to raise the maximum PFC level increases. The financial projections and the funding plans reflected in this chapter assume the Airport’s current $4.50 PFC level is in place for the entire planning period. If federal PFC regulations are changed and the maximum PFC level is increased, the Authority may choose to apply to the FAA for authorization to collect the higher PFC level.
Although the Airport is well positioned to take advantage of federal funding opportunities for capital development, the cash flow analyses indicate that additional Authority/local funds may be required to fully fund the CIP. To maximize net revenue available for capital development funding, the Authority might consider the following recommendations:
Conduct periodic assessments of operating and maintenance activities to determine if specific activities are being conducted as efficiently as possible, and take advantage of opportunities to implement sustainable practices, development, and technologies (i.e., alternative fuel vehicles, solar/wind power, green roofs). Cost savings may also be realized through the use of recycling programs and purchasing certain equipment and materials second hand.
Actively seek opportunities to encourage nonaeronautical development at the Airport. As building-ready sites are developed at the Airport and demand warrants, the Authority could evaluate additional third-party financing for hangar facilities. Likewise, it could explore options with its automobile parking concessionaire for financing various elements of the proposed parking expansions during the planning period and also evaluate food/beverage/gift concession financing as well.
Take advantage of funding opportunities that may replace or supplement existing federal funding sources. Potential alternative funding sources include TSA grants, state grants, bond financing/short-term loans, third-party financing, and economic development grants.
As current leases expire, review terms/rates of current leases to determine the most appropriate lease terms and rates given market conditions, specific land/facility uses, and opportunity costs. In addition, periodic reviews of rates and charges imposed on Airport users should be undertaken.