chapter – vi political participation of dalits in...
TRANSCRIPT

CHAPTER – VI
POLITICAL PARTICIPATION OF DALITS IN NAWANSHEHAR AND PATIALA
In Indian society virtually the higher echelons of power are
dominated by the upper castes. Despite the prominence of a few
Dalits who have gained high political positions in our country, the
political status of Dalits has changed much less than what the
individual successes show.
Discrimination on the grounds of caste is morally, legally and
democratically wrong. But caste equality can come about only
when Dalits make use of the full array of political weapons
available to them to achieve it, that is political activitiy is essential
to the struggle for Dalits' liberation.
Political participation takes several forms and varies in spirit
in different countries and in different constituencies within a
country. As stated in the introductory chapter, political
participation refers to these acts intended to influence the
behaviour and actions of political decision makers and it embraces
various activities designed to achieve this end.30 It is intended to
influence the choice of political leaders and the choice of public
policies. The levels of participation are not uniformly distributed

throughout the population. Various studies have shown that
political participation is directly related to class or income level,
educational qualifications, occupational status, caste and
religion30. It has also been associated with a variety of other factors.
Lester, W. Milbrath30 (1965), on the basis of a study of
recruitment patterns among local party officials in the United
States, has suggested four levels of political participation. The first
level consists of "Apathetics" who are literally unaware of the
political situation around them. They do not even vote or show any
interest in voting. Some studies, however, show that non- voting or
non- participation arises from many causes and has many different
implications for the political system. Non- voting, in fact, may be a
participatory act-an act of protest or in effect a negative decision30.
An Indian study of 1972 Assembly elections in Bihar has also
indicated this aspect of non-voting30. The second level of
participation is formed by those who are involved in "spectator
activities". This corresponds to what Angus Campbell has called
"the peripheral voters'30 They may have some interest in politics
and some knowledge about it but their participation does not go
beyond the activities of voting. The third level is composed of those
involved in transitional activities which include attending a political
meeting, participating in campaign activities or making a

contribution to a political party. The final level consists of those
who enter the political arena and participate in "gladiatorial
activities" such as standing for and holding public and party
offices.
Levels of political participation of Indian electorate have been
analyzed by Bashiruddin Ahmad30 (1971). He has taken into
account the involvement of the electorate in thirteen political
activities which ranges from voting to raising money for a party
and/or a candidate. On this basis, he has suggested five levels of
participation or group voters, viz. Apathetic, Peripherals,
Spectators, Auxiliaries and Politists. The first, second and the fifth
levels correspond almost exactly to the same levels used by
American scholars (Palmer, 1975). The other two levels form the
third group "Transitional activities" of Milbrath. According to
Ahmad, 'Spectators' are those who only vote and have interest and
information as well as those who vote with moderate level of
motivation and engage in some other activity. Auxiliaries embrace
those who vote and engage in one or two other activities with
medium levels of interest and information. According to his
estimate, nearly 12% of Indian electorate are high Polilists.
Auxiliaries and high Politists, according to him, are the groups in

the electorate to which special attention will have to be given. "It is
these two groups constituting about 29% of the electorate, who
together shape and influence political outcomes."30
Political participation is a process of growth of citizenship.
The main thrust in Dalits' participation is how far they have
assumed the role of citizens beyond their traditional roles and to
what extent such a role has been legitimized to the political
structure. Participation of the Dalits in politics is so much
important that social movements, Dalit movements for Dalits'
rights started with a demand for equality in caste based structure.
The right is considered to be essential in the present-conditions for
entering the caste dominated society of political decision making.
The right to vote and reservation in political posts provides an
individual with an important indirect opportunity to be the ruler of
his own fate.
In India, the nationalist movement, social movements, Dalit
movements and the Indian Constitution all have a deep influence
on Dalits' political participation. The role of Dr. B.R. Ambedkar,
Mahatma Gandhi and Kanshi Ram is worth mentioning in this
context. They all put emphasis on bringing Dalits from the caste
bondage to active politics.

It is often held that political participation is the index of
democracy. The higher the terms of participation, the healthier is
the democratic system. Participation is a process which associates
individuals with the political system. In a society where certain
groups are traditionally lagging behind the others, where they can
be categorized as the weaker section or disadvantaged group wider
participation and mobilization at higher levels is necessary for their
upliftment and that in turn is healthier for the democratic
system.30
Most of the people participate in politics during the election
period. But participation through voting is only seasonal and
cannot bring out the total significance of political participation.
Participation in between the election period could be much more
significant. Although the volume of participation is great in
elections, electoral participation is not equal to voting which in
addition to voting includes other participation such as attending
election meetings, campaigning in the election or collecting funds
etc.
The extent of participation has been analyzed here in two
parts - in terms of voting participation and in terms of political
participation other than voting. Since all acts are but a sub set of
the same phenomenon, knowing about a person's participation in

one activity enables us to assess at least to some extent how far
he/she is likely to participate in another activity. Those persons
who participate in the most demanding form of participation will
probably also participate in the less demanding ways. For example,
it may be expected that a person who has taken an active part
particularly in campaigning would also caste his/her vote.30
As this chapter attempts to gauge the level of political
awareness and political participation of the Dalit respondents
numbering 300 from two districts of Punjab, a number of variables
were selected. On the basis of the responses the analysis is given
below :
Level of Political Awareness
(i) Respondents' Interest in Politics
To begin with it is important to know how far the respondents
have an interest in politics. Accordingly they were asked to indicate
their interest in the political affairs. An effort was made to assess
the intensity of political interest of the respondents on the basis of
their answers.
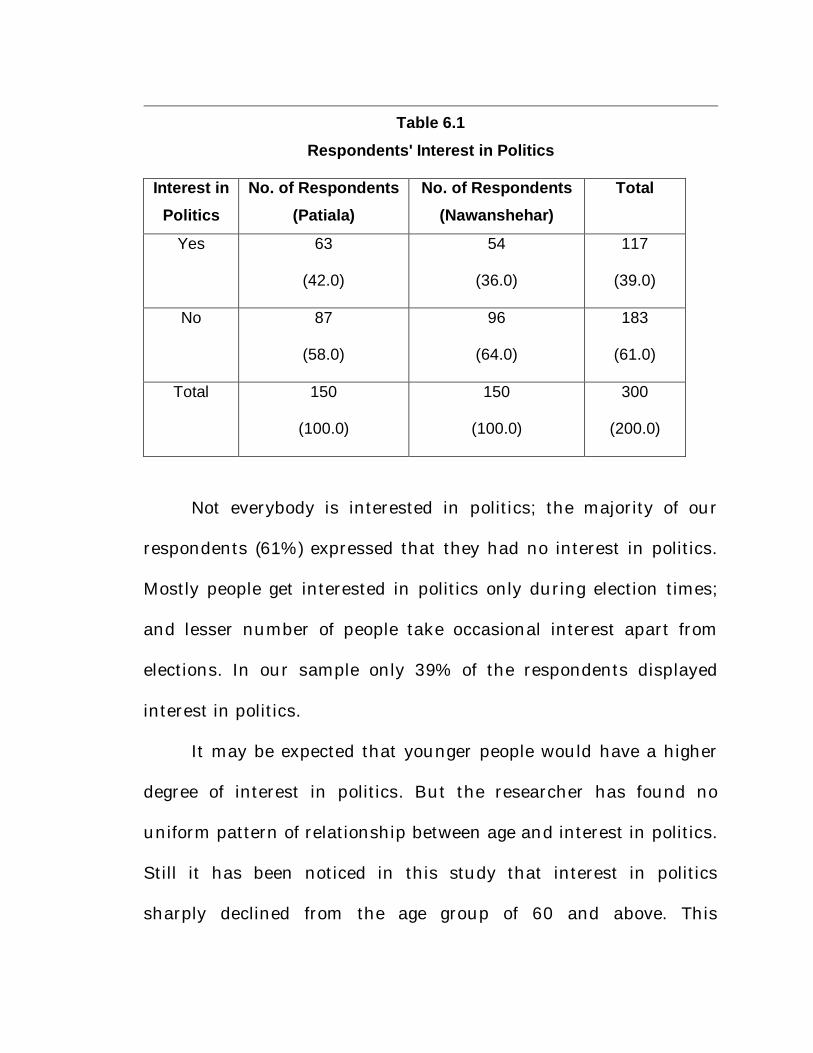
Table 6.1
Respondents' Interest in Politics
Interest in Politics
No. of Respondents (Patiala)
No. of Respondents (Nawanshehar)
Total
Yes 63
(42.0)
54
(36.0)
117
(39.0)
No 87
(58.0)
96
(64.0)
183
(61.0)
Total 150
(100.0)
150
(100.0)
300
(200.0)
Not everybody is interested in politics; the majority of our
respondents (61%) expressed that they had no interest in politics.
Mostly people get interested in politics only during election times;
and lesser number of people take occasional interest apart from
elections. In our sample only 39% of the respondents displayed
interest in politics.
It may be expected that younger people would have a higher
degree of interest in politics. But the researcher has found no
uniform pattern of relationship between age and interest in politics.
Still it has been noticed in this study that interest in politics
sharply declined from the age group of 60 and above. This

observation may be interpreted in the light of personal comments of
some of the respondents. Some elderly people appeared to have lost
their interest in politics possibly due to the fact that they found
hardly any resemblance between the professed ideologies and the
actual politics of the existing political parties. But the young people
appeared to be more guided by practice than by ideologies and,
therefore, they were found to be more interested in politics
compared to the aged people. In the context of female respondents
the degree of interest was found to be much lower than in the case
of the male respondents.
(ii) Knowledge About M.P. and M.L.A. of the Area
To test of the political awareness of respondents they were
asked very simple questions. For example, they were asked the
names of the candidates in previous Lok Sabha polls, the name of
the MP and MLA of their area and their respective party affiliation.
The responses are given in the following three tables viz. Table No.
6.2, 6.3 and 6.4.

Table 6.2
Knowing the Name or Party of M.P. of the Area
Know the Name or Party
of M.P.
No. of Respondents
(Patiala)
No. of Respondents
(Nawanshehar)
Total
Yes 34
(22.7)
49
(32.7)
83
(27.7)
No 116
(77.3)
101
(67.3)
217
(72.3)
Total 150
(100.0)
150
(100.0)
300
(100.0)
Table 6.3
Knowing the Name or Party of MLA of the Area
Know the Name or Party of MLA
No. of Respondents
(Patiala)
No. of Respondents
(Nawanshehar)
Total
Yes 93 (62.0)
120 (80.0)
213 (71.0)
No 57 (38.0)
30 (20.0)
87 (29.0)
Total 150 (100.0)
150 (100.0)
300 (100.0)
Table 6.4
Knowing the Name of BSP Candidate of the Area
Know the Name of BSP Candidate
No. of Respondents
(Patiala)
No. of Respondents
(Nawanshehar)
Total
Yes 15
(10.0)
83
(55.3)
98
(32.7)
No 135
(90.0)
67
(44.7)
202
(67.3)
Total 150
(100.0)
150
(100.0)
300
(100.0)

It has been observed that only 27.7% of the respondents were
well informed on the question of MP, while majority of the
respondents did not have any knowledge about this.
On the other hand, in case of information about MLA's,
majority of the total respondents (71%) were well informed. Only 29
per cent of the respondents did not know the name of their local
M.L.A. Similarly, about the BSP candidate of the area, only 32.7
per cent of the overall respondents knew. Thus, it is clear that more
respondents knew about the MLA of their area than the M.P. The
reasons for this are not far to see; first, the electorate are more
directly concerned with the MLA than with MP in terms of
development benefits and political patronage. Secondly, the area of
an MLA's constituency, is smaller than that of an MP's
constituency. The campaigning tends to be concentrated and
consequently more intensive in the former than in the latter which
in turn accounts for greater knowledge about MLAs than the MPs.
Finally, it is normally through the MLAs, that MPs do their
campaign, unless of course, a certain candidate for Parliament is so
important as his/her umbrella may help the MLA's in their political
campaign.30

(iii) Perception Towards Dalit Issues
The Dalit respondents were asked to give their opinion to a
basic issue i.e. whether the Dalits should participate actively in
politics or not.
Table 6.5 Participation of Dalits in Politics
Should Participate No. of
Respondents (Patiala)
No. of Respondents
(Nawanshehar)
Total
Yes 83
(55.3)
88
(58.7)
171
(57.0)
No 31
(20.7)
25
(16.7)
56
(18.7)
According to situation 23
(15.3)
28
(18.7)
51
(17.0)
No idea 13
(8.7)
9
(6.0)
22
(7.3)
Total 150
(100.0)
150
(100.0)
300
(100.0)
Interestingly a majority of them (57% overall) agreed to the
idea of participation. Around 20 per cent from both the districts did
not think it necessary where as some felt that it depended on the

situation. A small percentage did not have any idea. Not much
difference was found in the responses from the two districts.
In order to understand the awareness level of the respondents
more specifically, they were asked to record their opinion on the
question of the Dalits having a separate party.
Table 6.6 Should Dalits have a Party
Dalit should have a
Party
No. of Respondents
(Patiala)
No. of Respondents
(Nawanshehar)
Total
Yes 135
(90.0)
132
(88.0)
267
(89.0)
No 15
(10.0)
18
(12.0)
33
(11.0)
Total 150
(100.0)
150
(100.0)
300
(100.0)
When asked if the Dalits should have a separate party almost
all the respondents in both the districts nodded positively. Only a
miniscule number felt that there was no need to have any political
party separately for them.
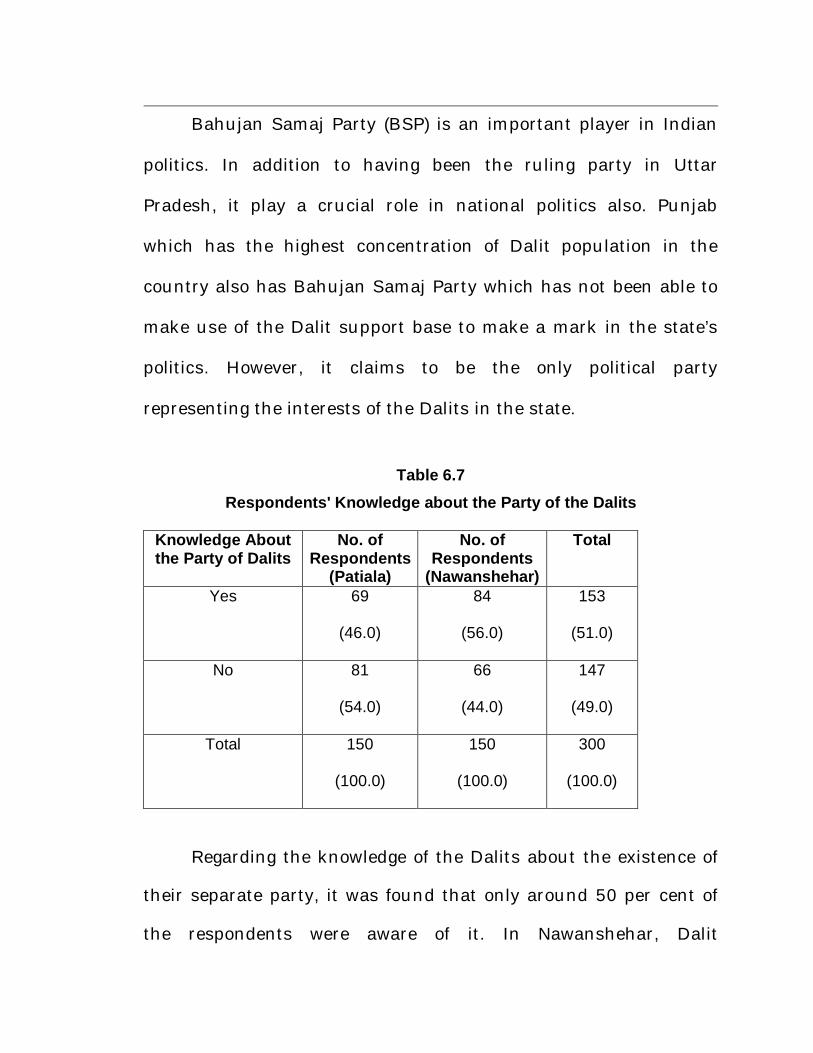
Bahujan Samaj Party (BSP) is an important player in Indian
politics. In addition to having been the ruling party in Uttar
Pradesh, it play a crucial role in national politics also. Punjab
which has the highest concentration of Dalit population in the
country also has Bahujan Samaj Party which has not been able to
make use of the Dalit support base to make a mark in the state’s
politics. However, it claims to be the only political party
representing the interests of the Dalits in the state.
Table 6.7 Respondents' Knowledge about the Party of the Dalits
Knowledge About the Party of Dalits
No. of Respondents
(Patiala)
No. of Respondents
(Nawanshehar)
Total
Yes 69
(46.0)
84
(56.0)
153
(51.0)
No 81
(54.0)
66
(44.0)
147
(49.0)
Total 150
(100.0)
150
(100.0)
300
(100.0)
Regarding the knowledge of the Dalits about the existence of
their separate party, it was found that only around 50 per cent of
the respondents were aware of it. In Nawanshehar, Dalit
respondents were better aware of the existence of their separate
party than the Dalit respondents from Patiala district. The rest of
the respondents did not know anything about the existence of any
special political party of the Dalits, which points to their low level of
political awareness.
Further it is important to state that all those who knew about
the Bahujan Samaj Party as a party of the Dalits, were not found to
be satisfied with its working. In fact almost more than two third
stated that they were dissatisfied with the working of the so called
Dalit party. Only a few respondents were satisfied with its working.
Political Participation of Dalit Respondents
As active political participation does not mean only voting but
includes a number of activities like taking part in election
campaign and contesting election, and having political discussions
etc. The respondents were asked a number of questions related to
all these aspects of political participation.
Type of Political Participation
First of all the respondents were asked to name themselves
the type of activity in which they participated. Table No. 6.8 shows
their responses.

Table 6.8
Type of Political Participation of Respondents
Type of Political Participation
No. of Respondents
(Patiala)
No. of Respondents
(Nawanshehar)
Total
Only Voting 135
(90.0)
129
(86.0)
264
(88.0)
Campaign 43
(28.7)
37
(24.7)
80
(26.7)
Contesting
elections
21
(14.0)
18
(12.0)
39
(13.0)
No participation 4
(2.7)
3
(2.0)
7
(2.3)
Total 150
(100.0)
150
(100.0)
300
(100.0)
Out of 300 respondents (both districts taken together), an
overwhelming majority of 88 per cent participated only by voting in
election, whereas 26.7 per cent were found to be participating in
election campaigns. Thirteen per cent of the respondents also
contested elections. The corresponding figures in case of Patiala-
Nawanshehar were 90 per cent and 86 per cent (only voting), 28.7
per cent and 24.7 per cent (campaigning) and 14 per cent and 12
per cent (contesting elections) respectively.

I. Voting
The first question that faces a citizen at the time of an
election is whether he should exercise his franchise or not. For
many individuals the act of casting his/her vote is the only
important occasion for political activity. The act of voting may bring
to some people satisfaction in the sense that through voting they
feel to be part of the political system, and think that their
contribution to the system is of vital importance. Many people
regard voting to be so important that they would not dream of
staying away from the polling stations. There are some people who
have no such strong feelings about voting. Their decision could be
tilted this way or that way by some minor factors. Many people vote
merely because their friends, relatives and family members also
exercise their franchise that is, primarily as an imitative activity.
Again there are some who think that the time spent at the polling
station is sheer wastage.30

Table 6.9
Respondents' Voting in Last Elections
Voted No. of Respondents
(Patiala)
No. of Respondents
(Nawanshehar)
Total
Yes 135
(90.0)
129
(86.0)
264
(88.0)
No 15
(10.0)
21
(14.0)
36
(12.0)
Total 150
(100.0)
150
(100.0)
300
(100.0)
As seen from the Table 6.9 the majority of the respondents
cast their vote in the last elections. This indicates the respondents'
enthusiasm for voting. Only 12 per cent respondents did not cast
their vote. Some of the reasons reported by the respondents behind
not casting their vote were apathy towards voting and being busy in
their other jobs.
In order to know what does the voter have in mind while
casting the vote the respondents were asked to recall what they had
uppermost in their mind while voting : Party, candidate, caste or
religion. The responses are tabulated below.

Table 6.10
Factors Influencing Voting
Voted on the Basis of
No. of Respondents
(Patiala)
No. of Respondents
(Nawanshehar)
Total
Party 86
(63.7)
79
(61.2)
165
(62.5)
Candidates 35
(25.9)
35
(27.1)
70
(26.5)
Caste 9
(6.7)
7
(5.4)
16
(6.1)
Religion 5
(3.7)
8
(6.2)
13
(4.9)
Total 135
(100.0)
129
(100.0)
264
(100.0)
On the basis of data it seems that 70 out of three hundred
(26.5%) respondents had the candidate in mind while voting. Only
a small percentage of them i.e. 6.1 percent and 4.9 percent kept the
caste and religion in mind respectively. But the large majority of
the respondents (62.5%) had the party in mind. This is inevitable
because the voters are trained that way. The propaganda is
conducted in terms of party more than in term of candidate and
religion or caste. It is also convenient for the voters. The voters take
less time to find out the symbol of a party at the time of polling. To

find out the name is also difficult for many because of illiteracy.
But the symbols of parties are prominently printed on the ballot
paper and during electioneering the campaigners make efforts to
bring home to the respondents' mind the symbol of the party rather
than any other thing.
In studies on political behaviour in India, it has been
observed that high status people play an important role in shaping
the political attitude of Dalits. Impact on a person during and on
the day of voting is necessary to identify.
Table 6.11 Pressure on Respondents' During Elections
Pressure on
Respondents
No. of
Respondents (Patiala)
No. of
Respondents (Nawanshehar)
Total
Of Upper Castes 42
(31.1)
28
(21.7)
70
(26.5)
Of Family Member 45
(33.3)
53
(41.1)
98
(37.1)
No Pressure 48
(35.6)
48
(37.2)
96
(36.4)
Total 135
(100.0)
129
(100.0)
264
(100.0)

Upper caste influence on Dalits' voting behaviour is evident
from the table given above. 26.5 per cent respondents admitted
that they voted as per the wishes of higher castes. 37.1 per cent
respondents reportedly cast their vote according to their family
wishes. The family head enjoys a high status and exerts a
dominant influence on the family. The family head guides the
political behaviour of the members. Mostly women are under this
category. It has been noted that for married women, the important
influential males are their husbands, while for single women,
fathers play important role in opinion change.30 It is interesting to
note that, in principle, most of the respondents agreed with the
proposition that the right to vote should be exercised by Dalits in
absolute freedom, but in practice most of respondents admitted
that Dalits are influenced mostly by the upper caste members or by
their own family members. This gap between professed ideal and
actual belief is a great obstacle to the participation of the Dalits in
politics.

Table 6.12
Respondents' Interest in Election Results
Interest in Election Results
No. of Respondents
(Patiala)
No. of Respondents
(Nawanshehar)
Total
Yes 42
(28.0)
53
(35.3)
95
(31.7)
No 108
(72.0)
97
(64.7)
205
(68.3)
Total 150
(100.0)
150
(100.0)
300
(100.0)
Table 6.12 distributes the voters as per their interest in
political results. Though election results are keenly watched and
discussed by the people in general but out of our sample only 31.7
per cent of the respondents reported to have shown interest in
election results and the rest of the respondents i.e. 68.3 per cent
stated that they had no interest in such results.
As stated earlier, though voting is the most viable form of
participation there are other important forms of participation as
well. It is essential to find out the participation of Dalits in other
political fields because voting turn out alone cannot explore the
effective and genuine participation of Dalits as a whole. So, an

attempt has been made to examine Dalits' political participation in
other fields of the political structure in addition to voting. In order
to examine the participation of the respondents in political fields
other than voting, they were asked whether they had participated
in the election campaign, contested any election, discussed politics,
attended political meetings etc. Here, only the actual voters have
been taken into consideration that is those who did not exercise
their vote have been excluded. It must be kept in mind that the
number of respondents who did not vote is extremely small.
Ii. Participation in Election Campaign
Campaign is an essential part of the election process. We
cannot dream of any election in any country being held today
without any campaign at all. Intensity and extent of campaign may
certainly differ from one country to another and one occasion to
another. But there is always some electioneering prior to the polling
and in Punjab like the rest of India campaign is done quite
rigorously.
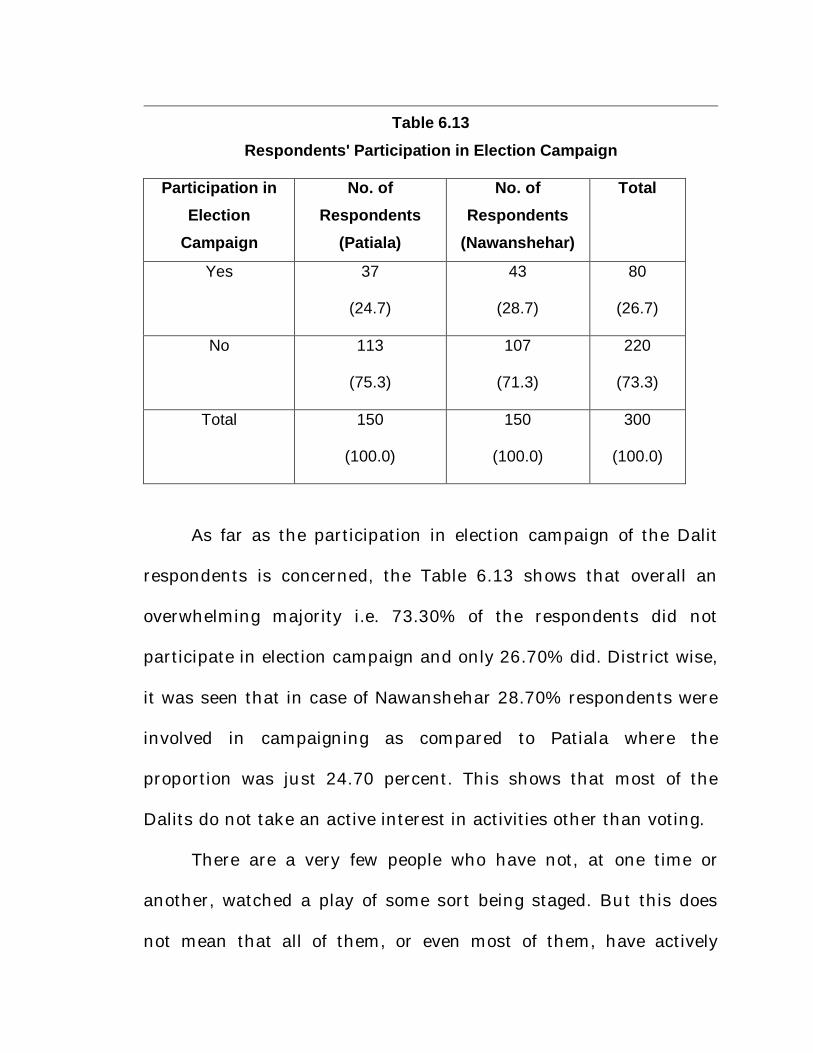
Table 6.13
Respondents' Participation in Election Campaign
Participation in Election
Campaign
No. of Respondents
(Patiala)
No. of Respondents
(Nawanshehar)
Total
Yes 37
(24.7)
43
(28.7)
80
(26.7)
No 113
(75.3)
107
(71.3)
220
(73.3)
Total 150
(100.0)
150
(100.0)
300
(100.0)
As far as the participation in election campaign of the Dalit
respondents is concerned, the Table 6.13 shows that overall an
overwhelming majority i.e. 73.30% of the respondents did not
participate in election campaign and only 26.70% did. District wise,
it was seen that in case of Nawanshehar 28.70% respondents were
involved in campaigning as compared to Patiala where the
proportion was just 24.70 percent. This shows that most of the
Dalits do not take an active interest in activities other than voting.
There are a very few people who have not, at one time or
another, watched a play of some sort being staged. But this does
not mean that all of them, or even most of them, have actively

participated in the staging of the play. The same thing may be said
about an election campaign.30 Many of them feel interested in the
campaign, but the interest may not be intense enough to lead to
participation in the campaign. While it may be true that all of those
who participate in the campaign are interested in it, the converse
would be fallacious. Interest in campaign and participation in
campaign are two distinct things.
We tried to assess the level of participation of our
respondents in election campaign. As only 80 respondents out of
the total 300 had reportedly participated in the election campaign,
they were further ranked according to their involvement in the
campaign activities. For further analysis these 80 respondents have
been taken who can be referred to as "active respondents". For this
purpose we asked the respondents five questions about their role in
campaign which were as follows:-
i) Inspiring the voters.
ii) Contribution/Collection of election funds.
iii) Participation/Preparation in election meetings.
iv) Preparation/Distribution of slips/posters/banners.
v) Door to door election campaign.

(i) Inspiring the Voters
Out of the total 80 respondents from the two districts who
participated in election campaign as many as 71(88.8%) claimed
that they inspired the voters to vote. The corresponding figures in
case of Patiala and Nawanshehar were 32(88.5%) and 39 (90.7%)
respectively. Similarly in response to another question regarding
inspiring the voters to vote for a specific candidate, almost all the
respondents (80) claimed that they were asking/inspiring the voters
to vote for their favourite candidate.
Table 6.14
Respondents' Inspiring the Voters
Inspired No. of Respondents
(Patiala)
No. of Respondents
(Nawanshehar)
Total
Yes 32
(86.5)
39
(90.7)
71
(88.8)
No 5
(13.5)
4
(9.3)
9
(11.3)
Total 37
(100.0)
43
(100.0)
80
(100.0)

Table 6.15 Respondents' Inspiring the Voters to Vote for a
Favourite Candidate
Inspired for a favourite candidate
No. of Respondents
(Patiala)
No. of Respondents
(Nawanshehar)
Total
Yes 37
(100.0)
43
(100.0)
80
(100.0)
No 0
(0.0)
0
(0.0)
0
(0.0)
Total 37
(100.0)
43
(100.0)
80
(100.0)
Thus the data shows that those who were involved in election
campaign were not only asking the voters to cast their votes but
were also inspiring them to vote for a particular candidate.
(ii) Contribution/Collection of election funds
The extension of a helping hand in collection of funds for
election campaign of a candidate or party is an important index of
the commitment of the electorate. Here it is pertinent to clarify that
there are two aspects of "Fund Collection" – firstly contributing or
giving funds from ones own pocket and secondly collecting funds

from the other donors. Thus the respondents were asked about
both these aspects.
Table 6.16 Respondents Giving Funds for Elections
Give Fund
for Election
No. of
Respondents (Patiala)
No. of
Respondents (Nawanshehar)
Total
Yes 11 (29.7)
12 (27.9)
23 (28.8)
No 26 (70.3)
31 (72.1)
57 (71.3)
Total 37 (100.0)
43 (100.0)
80 (100.0)
Table 6.17 Collection of Funds by Respondents
Collection of
Funds No. of
Respondents (Patiala)
No. of Respondents
(Nawanshehar)
Total
Yes 18
(48.6)
21
(48.8)
39
(48.8)
No 19
(51.4)
22
(51.2)
41
(51.3)
Total 37
(100.0)
43
(100.0)
80
(100.0)

One may point out in this context that giving election funds is
normally done by the influential party elite or the core supporters
of an independent candidate and normally the ordinary elector is
not involved in this work. This is reflected in Table no. 6.16 & 6.17
as only 28.8% of the active participants answered in affirmative as
far as contributing to election funds was concerned. Majority of
them did not contribute financially. The percentage of respondents
contributing funds for party/candidate is almost the same in both
the districts. In fact, many of them were involved in the collection of
fund. The Table shows that in both the districts nearly fifty percent
of these respondents (80) were involved in raising funds for the
party/candidate in both the districts.
(iii) Participation In Election Meetings
Election meetings are one of the important modes for
approaching the electorate collectively. This is used to inform the
electorate about the party, its programme and symbol, as also for
introducing the candidates to the electorate. This is also important
because it gives an opportunity to the candidate and the party to
demonstrate to the rival candidates their strength and the support
that they command. It is for this reason that efforts are made to
mobilize large number of people to attend a public meeting.

Here again two activities are involved as far as participation in
election meeting is concerned. One is that the persons are only
attending an election meeting and second is that he or she not only
attends the meeting but also plays a role in organizing the election
meeting.
Table 6.18
Participation in Election Meetings
Participation in Election Meetings
No. of Respondents
(Patiala)
No. of Respondents
(Nawanshehar)
Total
Yes 16
(43.2)
22
(51.2)
38
(47.5)
No 21
(56.8) 21
(48.8)
42
(52.5)
Total 37
(100.0)
43
(100.0)
80
(100.0)
Table 6.19
Preparation of Election Meetings
Preparation of Election Meetings
No. of Respondents
(Patiala)
No. of Respondents
(Nawanshehar)
Total
Yes 13
(35.1)
16
(37.2)
29
(36.3)
No 24
(64.9)
27
(62.8)
51
(63.8)
Total 37
(100.0)
43
(100.0)
80
(100.0)

When the 80 respondents were questioned regarding
participation in election meetings they were almost equally divided
with a slightly more percentage of those not participating. The
overall percentage being 47.3 of those who participated. The
percentage of those participating in election meetings was slightly
lower in Patiala but Nawanshehar compensated for the lower
percentage in Patiala. The corresponding percentage for
Nawanshehar and Patiala was 51.2 and 43.2 respectively.
Regarding the preparation of election meetings, the majority
of the respondents did not take active part. However, around 35 to
37% of the active respondents claimed to be involved in organizing
the election meetings.
(iv) Preparation/Distribution of Slips/Posters/Banners
Like public meetings, election posters also play a significant
role in popularizing parties, their symbols and their candidates.
They are also used by way of drawing caricatures of parties and
candidates in opposition. Posters can be appreciated by the literate
masses, though their impact is not entirely lost on the illiterate
masses also because they can be influenced by the visual impact if
not the written word.

Table 6.20
Involvement in Preparation of Posters/Banners Preparation of
Posters/Banners
No. of Respondents
(Patiala)
No. of Respondents
(Nawanshehar)
Total
Yes 8
(21.6)
17
(39.5)
25
(31.3)
No 29
(78.4)
26
(60.5)
55
(68.8)
Total 37 (100.0)
43 (100.0)
80 (100.0)
Table 6.21 Distribution of Slips/Poster/Banner for your Favourite Candidate
Distribution No. of
Respondents (Patiala)
No. of Respondents
(Nawanshehar)
Total
Yes 30
(81.1)
35
(81.4)
65
(81.3)
No 7
(18.9)
8
(18.6)
15
(18.8)
Total 37 (100.0)
43 (100.0)
80 (100.0)
As usually the posters/slips and banners are prepared on a
large scale by party organization, it is only in case of a few not so
rich independent candidates that preparation of this material is
done manually by his/her supporters. The Table reflects this as
only a small percentage of the 80 respondents were found to be
involved in this, in both the districts.
However most of the "active respondents" are seen taking
posters, slips and banners. The table shows that more than 80 per
cent of the respondents in both the districts were reportedly
involved in this election activity.
(v) Door To Door Election Campaign
Participation in door to door campaigning is a more specific
activity which perhaps indicates a higher degree of political
involvement.
The candidates are expected to do considerable door to door
campaigning in order to meet the voters individually. It is visualized
that the frequency of such events increases during the latter
periods of the election campaign. Further these are carried out
mostly during mornings and evenings when voters are expected to
be at home. Besides, the candidate, his election workers or
supporters also are expected to carry out such campaign. The
sample consisting of 80 respondents who reported to have
participated in election campaign were asked whether they
participated in door to door canvassing on behalf of any candidate
or party.

Table 6.22
Respondents' Involvement in Door to Door Election Campaign
Involvement in Door to Door
Election Campaign
No. of Respondents
(Patiala)
No. of Respondents
(Nawanshehar)
Total
Yes 32
(86.5)
40
(93.0)
72
(90.0)
No 5
(13.5)
3
(7.0)
8
(10.0)
Total 37
(100.0)
43
(100.0)
80
(100.0)
Table 6.22 clearly shows that almost 90 per cent of the active
respondents participated in door-to-door campaign. The
corresponding figures for Patiala and Nawanshehar were 85.6 and
93.0 per cent respectively. This shows that Nawanshehar
respondents had a slight edge here as around 7 per cent more
respondents in Nawanshehar participated in door-to-door
campaign as compared to the respondents in Patiala.
Thus the above few Tables showing the participation/
involvement of the "active respondents" (80 out of the total sample
of 300) help us in drawing the conclusion that the participation of
most of them is confined to attending the meetings, collecting the

funds for the elections, distribution of campaign material and more
to door to door campaign. Very few of them contributed to party
funds or participated in preparation of banners, organized the
election meetings and participated in preparation of campaign
material. The scenario did not differ much in the two districts.
III. Interaction with Mass Media
Apart from studying the problem of political participation an
effort was made to assess the influence of different communication
modes on the minds of the respondents. In fact, the
communication media (both print and electronic) in the past two
decades has gained tremendous significance in influencing the
attitudinal pattern of the individuals throughout the world.
Beginning with newspapers, films and radio, then with television
and presently with satellites and other sophisticated delivery
systems, modern communication system has been thrust in to
almost every corner of the world.30 Lerner regards the developments
of the mass media as the key in a society's march from a state of
traditionalism to that of modernity. 30 It may be expected that a rise
in media exposure would be accompanied by a corresponding
impact on the attitudinal pattern of the respondents.

(i) Interest in Political News:
Three questions regarding political news were - whether they
were interested in political news or not, second, what was the
source of collecting the news and third, did they discuss the
political issues with others.
Table 6.23
Respondents' Interest in Political News
Degree of Interest No. of Respondents
(Patiala)
No. of Respondents
(Nawanshehar)
Total
High 66 (44.0)
77 (51.3)
143 (47.7)
Moderate 43 (28.7)
36 (24.0)
79 (26.3)
No Interest 41 (27.3)
37 (24.7)
78 (26.0)
Total 150 (100.0)
150 (100.0)
300 (100.0)
As far as the responses to the query about interest in political
news is concerned the table 6.23 reveals that out of total
respondents 47 per cent were found to have a high degree of
interest in political news whereas 26 per cent were having a
moderate interest in this type of news. As many as 26 per cent were
found to be totally uninterested in political news. Out of the two
districts under study, the level of interest in political news was

found to be slightly higher in the Dalit respondents of
Nawanshehar.
In identifying the source of political news, the respondents
gave a variety of answers which is tabulated ahead.
Table 6.24 Respondents' Mode of Collecting Political News
Mode of Collecting
Political News No. of
Respondents (Patiala)
No. of Respondents
(Nawanshehar)
Total
Television 55 (36.7)
52 (34.7)
107 (39.6)
Party Magazine 3 (2.0)
5 (3.3)
8 (3.0)
Party Members 12 (8.0)
14 (9.3)
26 (9.6)
Newspaper 29 (19.3)
25 (16.7)
54 (20.0)
Radio 51 (34.0)
54 (36.0)
105 (38.9)
Total 150 (100.0)
150 (100.0)
300 (100.0)
The above Table clearly demonstrates that an overall majority
of the respondents were dependent on Television and Radio (39.6
and 38.9%) for getting political news. 20% of the respondents were
found to be more interested in reading newspapers. 9% of the
respondents gathered the news from party members whereas a few
(just 3%) stated to be knowing it from party magazine. The scenario
in two districts was almost the same with slight variations.

(ii) Discussion of Political Issues
Conversation is a good pastime of people in India, more so in
the rural area. In rural areas gossip and conversation, that is,
person to person or face to face dialogue is a very common pattern
of communication of ideas, news, information, knowledge, and
opinion.
Political discussions have a place of their own in a democracy.
Besides, the family, there are friends and community members
with whom a voter might discuss the elections. These groups might
determine the political attitudes and influence voting decisions,
because the individual look to them for guidance.
Table 6.25
Political Discussion with Friends or Family Members
Political Discussion with Others
No. of Respondents
(Patiala)
No. of Respondents
(Nawanshehar)
Total
Yes 35 (23.3)
45 (30.0)
80 (26.7)
On Special Occasions 52 (34.7)
48 (32.0)
100 (33.3)
No 63 (42.0)
57 (38.0)
120 (40.0)
Total 150 (100.0)
150 (100.0)
300 (100.0)
If the responses to the question about discussing political
matters with their friends and family members are analysed, the

data reveals that only 26.7% of the overall respondents answered in
positive. 33.3 per cent of the respondents indulged in political
discussions only on special occasions. 40 per cent of the total
respondents did not take part in political discussions with the
family members or with the other members of the community. Thus
it may be inferred that a substantial number of Dalits in the two
districts avoided indulging in political discussions. The
corresponding figure of those taking part in political discussions in
case of Patiala and Nawanshehar are 23.3 per cent and 30 per cent
respectively. 34.7 per cent in Patiala and 32 per cent in
Nawanshehar come in the category of those discussing political
issues only on special occasions. These special occasions usually
are the times of elections.
iv Party Membership/Preference of Party or Leaders
Political participation takes place at different forms and
levels. Voting, as stated earlier, is the most explicit mode of this
which is undertaken by all or most of the citizens. However, party
membership could be taken as indicative of active participation in
politics.30 The membership of all the parties, in India, is more or
less liberally granted. Such membership demands merely the
payment of a small annual subscription and a written acceptance
of the principles of the party concerned. Under the existing rules,
government servants and servants of semi governmental

organizations are prohibited from becoming members of political
parties.30
Table 6.26
Membership of any Political Party
Membership No. of Respondents
(Patiala)
No. of Respondents
(Nawanshehar)
Total
Yes 37
(24.7)
47
(31.3)
84
(28.0)
No 113
(75.3)
103
(68.7)
216
(72.0)
Total 150
(100.0)
150
(100.0)
300
(100.0)
Regarding the question of membership of any political party,
only 37 out of the total 150 respondents from Patiala responded in
positive which comes out to be only 24.70 per cent and the rest of
the respondents (113) were not having membership of any political
party. The corresponding figures for Nawanshehar were 47 (31.3%)
and 103 (68.7%) respectively. At aggregate level of the two districts,
only 28 per cent respondents were found to be having political
membership, whereas the majority (72%) of the respondents did
not have membership of any political party.

When the respondents having party membership were further
asked about holding any party office, it was found that in Patiala
district, only one person was secretary of Shiromani Akali Dal at
the block level. In Nawanshehar district out of the 47 party holders,
one was found to be holding the office of secretary of CPM at
district level and another was President of CPM at block level.
To further probe the interest and level of their involvement
the respondents were asked to pick their favourite politician out of
a list of some prominent political leaders of state. They were also
asked to name the party which addressed the Dalit issues.
Table 6.27 Respondents' Favourite Politician
Name of Politician No. of
Respondents (Patiala)
No. of Respondents
(Nawanshehar)
Total
Captain Amrinder
Singh (Congress I)
95
(63.3)
77
(51.3)
172
(57.3)
Parkash Singh Badal
(SAD) (B)
31
(20.7)
29
(19.3)
60
(20.0)
Simranjeet Singh Maan
(SAD) (M)
1
(0.7) 3
(2.0)
4
(1.3)
Balwant Singh
Ramuwalia (LBP)
1
(0.7)
1
(0.7)
2
(0.7)
Avtar Singh Karimpuri
(BSP)
13
(8.7)
19
(12.7)
32
(10.7)

Jagroop Singh (CPI) 2
(1.3)
0
(0.0)
2
(0.7)
Professor Balwant
Singh (CPIM)
5
(3.3)
14
(9.3)
16
(5.3)
Mohan Bhandari (BJP) 0
(0.0)
0
(0.0)
0
(0.0)
No body 2
(1.3)
14
(9.3)
16
(5.3)
Total 150
(100.0)
150
(100.0)
300
(100.0)
When the respondents, were asked about their favourite
politician, majority of the them (57.3%) named captain Amrinder
Singh at overall level, followed by Prakash Singh Badal (20.0%) and
Avtar Singh Karimpuri (10.7%). The rest of the political leaders viz.
S.S. Mann, B.S. Ramuwalia, Prof. Balwant Singh, Jagroop Singh
were favoured by a very negligible proportion of the respondents. In
Patiala 63.3% of the respondents favoured Captain Amrinder
Singh, followed by Parkash Singh Badal (20.7%), Avtar Singh
Karimpuri (8.7%). Similarly, in case of Nawanshehar, 51.3% per
cent of the respondents favoured Captain Amrinder Singh, followed
by Parkash Singh Badal (19.3%). Avtar Singh Karimpuri (19%). One
special feature in case of Nawanshehar was that in this district,
9.3% of the respondents out rightly reported having no favourite
politician.

The perceptions of the respondents regarding the party
raising and protecting Dalit issues are presented in Table 6.28.
Table 6.28 Party Favouring Dalit Issues
Name of the
Party No. of
Respondents (Patiala)
No. of Respondents
(Nawanshehar)
Total
Congress 76 (50.7)
65 (43.3)
141 (47.0)
BSP 53 (35.3)
47 (31.3)
100 (33.3)
BJP 0 (0.0)
0 (0.0)
0 (0.0)
SAD 16 (10.7)
22 (14.7)
38 (12.7)
CPM/CPI 3 (2.0)
11 (7.3)
14 (4.7)
LBP 2 (1.3)
2 (1.3)
4 (1.3)
Any other 0 (0.0)
3 (2.0)
3 (1.0)
Total 150 (100.0)
150 (100.0)
300 (100.0)
The overall picture of the two districts taken together shows
that 47% of the respondents considered Congress to be the party
safeguarding their interests more than any other party,followed by
BSP (33.3%) and SAD (12.7%). The rest of the political parties were
not considered to be caring for problems of Dalits as the number of
respondents taking their name was very less. In case of Patiala,

3/4th of the respondents had the perception that Congress was the
best bet for them, followed by BSP (35.5%), and SAD (10.7%). In
case of Nawanshehar, 43.3 percent of the dalits believed Congress
to be safe, followed by BSP (31.3%) and SAD (4.7%). One notable
thing emerged that BJP was not considered as a favourate by any
of the respondents in both the districts.
v Contesting Elections
Going beyond voting, attending political meetings,
participating in election campaigns or becoming members of some
political parties, the most active participation is contesting
elections at any level-local, state or national. Table No. 6.29 shows
the responses of the respondents.
Table 6.29 Respondents Contesting Elections
Contested Election
No. of Respondents
(Patiala)
No. of Respondents
(Nawanshehar)
Total
Yes 21
(14.0)
18
(12.0) 39
(13.0)
No 129
(86.0)
132
(88.0)
261
(87.0)
Total 150
(100.0)
150
(100.0)
300
(100.0)

Table 6.30 Elections Contested by the Respondents
Election
Contested
No. of Respondents
(Patiala)
No. of Respondents
(Nawanshehar)
Total
Panchayat 21
(100.0)
17
(94.4)
36
(92.3)
Vidhan Sabha 0
(0.0) 1
(5.6)
1
(7.7)
Lok Sabha 0
(0.0)
0
(0.0)
0
(0.0)
Total 21
(100.0)
18
(100.0)
39
(100.0)
When the respondents were asked this question it was found
that of the total 300 respondents in the two districts, only 39
(13.0%) had contested elections. Out of this 39, 21 were from
Patiala and 18 were from Nawanshehar. Only one respondent had
contested the Vidhan Sabha election. None of the respondents from
both the districts had ever contested a Parliamentary election. This
means that the elections contested were of Panchayat level. This
speaks of their low political participation at state or central level.
An attempt was also made to know the views of the former and
sitting members of the village Panchayats regarding their position
in Panchayats as members. They expressed their unhappiness over

the working of the Panchayats and their weak authority vis-à-vis
the political executives. Almost every one complained of the
interference and dominance of the high caste elites.
vi Perceptions towards Governance
An effort was made to find out the respondents' capability to
understand the politics and complications of governance. Table
6.31 presents the responses of our respondents.
Table 6.31
Understanding Government Work
Understanding Government Work
No. of Respondents
(Patiala)
No. of Respondents
(Nawanshehar)
Total
Understand 25
(16.7)
30
(20.0)
55
(18.3)
Do not Understand 125
(83.3)
120
(80.0)
245
(81.7)
Total 150
(100.0)
150
(100.0)
300
(100.0)
It is clear from the Table that more than 80 percent of
respondents, admitted that government and its working was so
complicated that they could not understand what was going on.
More respondents (83.3%) in Patiala stated this as compared to
respondents (80%) in Nawanshehar. The slight edge of those who
understood working of the government in the Nawanshehar is

indicative of the fact that the respondents in Nawanshehar were
slightly better aware. Because majority of the respondents did not
understand the intricacies of governance, they were not able to talk
about the policies or programmes launched by government.
However they still had some opinion about the overall
working of the government. As a common man is affected on the
day to day basis by the services provided by the government and
expects a lot from it, the collective opinion of the public is of great
importance in a democracy.
Table 6.32 Respondents' Opinion Towards Government
Opinion Towards
Government No. of
Respondents (Patiala)
No. of Respondents
(Nawanshehar)
Total
Good 41
(27.3)
37
(24.7)
78
(26.0)
Bad 54
(36.0)
55
(36.7)
109
(36.3)
No Idea 55
(36.7)
58
(38.7)
113
(37.7)
Total 150
(100.0)
150
(100.0)
300
(100.0)
The stability and continuation of any government depends on
the response and support it gets from the public, the opinion of the

respondents was collected regarding the functioning of the
government of the day.
When the respondents were asked about the working of
government 36.3% found it to be bad as there was a lot of
corruption in the administration and the pace of development of
the Punjab was low. 26 percent respondents reported the working
of government to be good. However, a substantial percentage
(37.7%) of respondents did not give their opinion because of lack of
awareness. Here also there was not much difference in the
perception of respondents from the two districts.
Table 6.33 Impact of Public Opinion on Government
Impact No. of
Respondents (Patiala)
No. of Respondents
(Nawanshehar)
Total
Yes 35
(23.3)
29
(19.3)
64
(21.3)
No 67
(47.7)
63
(42.0)
130
(43.3)
No Idea 48
(32.0)
58
(38.7)
106
(35.3)
Total 150
(100.0)
150
(100.0)
300
(100.0)

When the respondents were asked a straight question
regarding the impact of public opinion on government, 64 (21.3%)
of the 300 respondents agreed that it had an impact on the
government while 130 (43.3%) did not agree with the idea. The rest
of the respondents 106 (35.3%) remained neutral. Comparing the
respondents of the two districts, Patiala had a slight edge over
Nawanshehar in considering public opinion as a factor impacting
government.
Thus in the present chapter an effort has been made to
understand and probe the level of political participation of the
Dalits in two districts of Punjab, as it is very important that the
Dalits, who constitute a marginalized and oppressed section of
Indian society participate actively in the political arena.
Through the ages, oppressed people in different parts of the
world have fought for their right to participation in the political
process. Participation helps the individual to be effective and it
associates him with the political system.
By exercising this right an individual feels that he/she has
become the master not only of his/her own fate but also of the fate
of his/her fellow beings. The higher the rate and level of political
participation, the more varied are its forms and the healthier is the

democratic system, particularly in a society where certain groups
are traditionally behind the others.
Our data shows that the interest in politics varies with man's
earning capacity. The poor people do not (perhaps cannot afford to)
take continuous interest in politics. They are largely apolitical. The
well-to-do people are somewhat more interested in politics : indeed
a sizeable percentage of them take continuous interest in politics.
This is quite understandable. The poor people have to worry more
about their immediate needs. They are also uneducated and
therefore do not understand the processes of democratic politics.
However as far as voting is concerned those who are at the lower
level of the society-whether class-wise or caste wise - the majority
turns out to vote. In our sample also the majority of the
respondents cast their votes though they exercised their right on
the advice of family members and influential persons of higher
castes. Very few of them exercised their voting right according to
their own choice. Most of them were guided by the dictates of the
powerful sections of the society. Another similar question as to
what they had uppermost in their mind while voting. The large
majority of the respondents had the party in mind. This is
inevitable because the voters are trained that way. Here it is
important to point out that it is so not because they understand

the ideology or performance of the party but because they are
persuaded to do so. In fact they are made to remember the party
symbol. It is on the basis of such training that they exercise the
voting right.
Turning to the participation in political activities other than
voting, it has to be noted once again that though most of the
respondents voted but they did not take an active part in politics.
The low-level of political participation was indicated by the small
number of respondents' participation in election campaign and
other election activities.
The non-response of the Dalit respondents to many questions
was indicative of their low level of political knowledge. It has been
observed that only a small number of respondents had knowledge
about the political parties and knew the names of the MPs and
MLAs of their area. It is further observed that majority of the
respondents did not understand the government's working and the
policies and programmes of the government.
Today Dalits are present almost in all political parties but
only as members. The higher positions are captured by the
dominant classes in all parties (except the BSP). We found only 3

Dalit respondents out of our total sample of 300 from two districts
holding party offices that also at the block-level.
It has been observed that the Congress party and its leaders
occupied a pre-eminent position in the minds of the Dalit
respondents. The rest of the political parties or their leaders were
not considered to be protecting the interests of Dalits.
Thus on the whole it may be concluded that though the Dalits
have been provided with constitutional safeguards and
reservations, the common Dalit masses in Punjab are still not
making complete use of the opportunities. Only an elite section of
the Dalits is reaping the harvest. The poor, marginalized simple
Dalit population still has not become politically aware and active.
They do turn up of in large numbers for voting but lag behind in
other activities of political participation.

REFERENCES
1. Norman D. Palmer, Elections and Political Development- The
South Asian Experience, Vikas Publishing House, New Delhi,
1976, p. 57.
2. For further details see M. Weiner & Rajni Kothari (ed.), Indian
Behaviour Studies of the 1962 General Elections, Firma
Calcutta, 1965; V.M. Sirsikar, Sovereign without Crowns: A
Behavioural Analysis of the Indian Electoral Process, Popular
Prakashan, Bombay, 1973; Ramashray Roy, The Uncertain
Verdict - A Study of the 1969 Elections in four Indian States,
Orient Longman Ltd., New Delhi, 1973.
3. For further details see Lester W. Milbreath, Political
Participation, Rand McNally and Committee., Chicago, 1965.
4. For further details see Bruce A. Campbell, The American
Electorate - Attitudes and Action, Hall Rinehart and Winston,
New York, 1960.
5. Sachchidananda, The Tribal Voters of Bihar, National
Publishing House, New Delhi, 1976, p.
6. Bruce A. Campbell, op. cit..
7. Bashiruddin Ahmad, "Political Participation of the Indian
Electorate", Economic and Political Weekly, Vol. VI, Annual
Number, January, 1971, p.

8. Ibid.
9. Norman D. Palmer, op. cit., pp. 59-61.
10. M.L. Goel, Political Participation in Developing Nation, Asian
Publishing House, New Delhi, 1974, p. 21.
11. S.P. Verma, Voting Behaviour in a Changing Society, National
Publication House, Delhi, 1973, p. 138.
12. B. Ganguly and Mira Ganguly, Voting Behaviour in a
Developing Society : A Case Study of West Bengal, Sterling
Publishers, New Delhi, 1975, p. 38.
13. E. Katz and P.F. Lazersrfeld, "Personal Influence", in
Eldersveld Eulav and Janowitz (ed.), Political Behaviour,
Amerind Publishing, New Delhi, 1972, p. 151.
14. B. Ganguly and Mira Ganguly, op. cit., p. 65.
15. Jayasri Ghosh, Political Participation of Women in West
Bengal, Progressive Publishers, Calcutta, 2000, p. 266.
16. Ibid.
17. V.M. Sirsikar, op. cit., p. 210.
18. Ibid.