chapter 9leeds-courses.colorado.edu/fnce4030/misc/slides/... · •miller and scholes paper...
TRANSCRIPT

INVESTMENTS | BODIE, KANE, MARCUS
Copyright © 2011 by The McGraw-Hill Companies, Inc. All rights reserved. McGraw-Hill/Irwin
CHAPTER 9
The Capital Asset Pricing Model

INVESTMENTS | BODIE, KANE, MARCUS
Capital Asset Pricing Model (CAPM)
• It is the equilibrium model that underlies all modern financial theory
• Derived using principles of diversification with simplified assumptions
• Markowitz, Sharpe, Lintner and Mossin are researchers credited with its development
9-2
R E S E T S TYLE

INVESTMENTS | BODIE, KANE, MARCUS
CAPM - Assumptions
• Individual investors
are price takers
• Single-period
investment horizon
• Investments are
limited to traded
financial assets
• No taxes and no
transaction costs
• Borrow at 𝑟𝑓
• Information is
costless and
available to all
investors
• Investors are
rational mean-
variance optimizers
• Expectations are
homogeneous
9-3
R E S E T S TYLE

INVESTMENTS | BODIE, KANE, MARCUS
Resulting Equilibrium Conditions
• The market portfolio (M) is on the efficient frontier and is on the Capital Market Line
• All investors will hold the same portfolio for risky assets – market portfolio (M)
• Market portfolio contains all securities and the proportion of each security is its market value as a percentage of total market value (total market value = total wealth)
9-4
R E S E T S TYLE

INVESTMENTS | BODIE, KANE, MARCUS
Resulting Equilibrium Conditions
• Risk premium on the market depends on the average risk aversion of all market participants
• Risk premium on an individual security is a function of its covariance with the market
9-5
R E S E T S TYLE

INVESTMENTS | BODIE, KANE, MARCUS
Figure 9.1 The Efficient Frontier and the Capital Market Line
9-6
R E S E T S TYLE
INVESTMENTS | BODIE, KANE, MARCUS
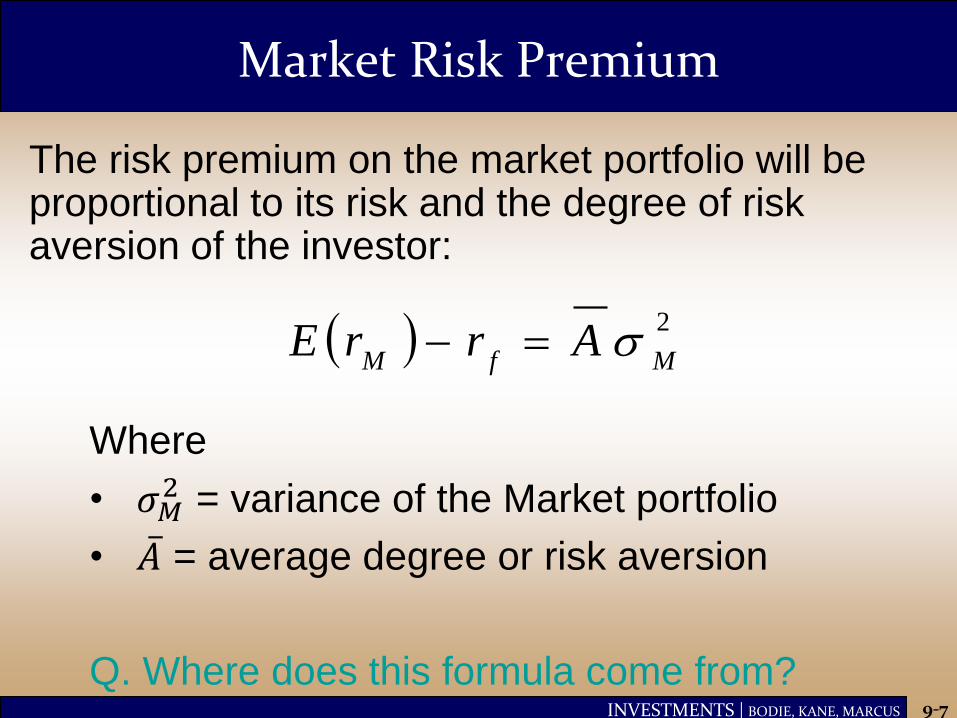
Market Risk Premium
The risk premium on the market portfolio will be proportional to its risk and the degree of risk aversion of the investor:
9-7
2
MfMArrE
Where
• 𝜎𝑀2 = variance of the Market portfolio
• 𝐴 = average degree or risk aversion
Q. Where does this formula come from?
R E S E T S TYLE

INVESTMENTS | BODIE, KANE, MARCUS
Return and Risk For Individual Securities
• The risk premium on individual securities is a function of the individual security’s contribution to the risk of the market portfolio.
• An individual security’s risk premium is a function of the covariance of returns with the assets that make up the market portfolio.
• Why bother doing security analysis?
9-8
R E S E T S TYLE

INVESTMENTS | BODIE, KANE, MARCUS
GE Example
• Covariance of GE return with the market portfolio:
𝑤𝑖𝐶𝑜𝑣 𝑅𝑖 , 𝑅𝐺𝐸
𝑛
𝑖=1
= 𝐶𝑜𝑣 𝑤𝑖𝑅𝑖 , 𝑅𝐺𝐸
𝑛
𝑖=1
= 𝐶𝑜𝑣 𝑤𝑖𝑅𝑖 , 𝑅𝐺𝐸
𝑛
𝑖=1
• Therefore, the reward-to-risk ratio for investments
in GE would be =𝐺𝐸′𝑠 𝑐𝑜𝑛𝑡𝑟𝑖𝑏.𝑡𝑜 𝑟𝑖𝑠𝑘 𝑝𝑟𝑒𝑚𝑖𝑢𝑚
𝐺𝐸′𝑠 𝑐𝑜𝑛𝑡𝑟𝑖𝑏.𝑡𝑜 𝑣𝑎𝑟𝑖𝑎𝑛𝑐𝑒=
=𝑤𝐺𝐸𝐸 𝑅𝐺𝐸
𝑤𝐺𝐸𝐶𝑜𝑣 𝑅𝐺𝐸 , 𝑅𝑀=𝐸 𝑟𝐺𝐸 − 𝑟𝑓
𝐶𝑜𝑣 𝑅𝐺𝐸 , 𝑅𝑀
9-9
R E S E T S TYLE

INVESTMENTS | BODIE, KANE, MARCUS
GE Example
• Reward-to-risk ratio for investment in market portfolio:
• At equilibrium all reward-to-risk ratios are equal, including that of GE:
9-10
2
( )Market risk premium
Market variance
M f
M
E r r
2
,M
fM
MGE
fGErrE
rrCov
rrE
R E S E T S TYLE

INVESTMENTS | BODIE, KANE, MARCUS
GE Example
• The risk premium for GE:
• Restating, we obtain:
9-11
fM
M
MGE
fGErrE
RRCOVrrE
2
,
fMGEfGE
rrErrE
R E S E T S TYLE

INVESTMENTS | BODIE, KANE, MARCUS
Expected Return-Beta Relationship
• CAPM holds for the overall portfolio because:
𝐸[𝑟𝑃] = 𝑤𝑘𝑘𝐸[𝑟𝑘]
and
𝛽𝑃 = 𝑤𝑘𝑘𝛽𝑘
• This also holds for the market portfolio:
𝐸[𝑟𝑀] = 𝑟𝑓 + 𝛽𝑀 𝐸[𝑟𝑀] − 𝑟𝑓
(remember 𝛽M = 1)
9-12
R E S E T S TYLE

INVESTMENTS | BODIE, KANE, MARCUS
Fig. 9.2 The Security Market Line (SML)
9-13
R E S E T S TYLE

INVESTMENTS | BODIE, KANE, MARCUS
Figure 9.3 The SML and a Positive-Alpha Stock
9-14
R E S E T S TYLE

INVESTMENTS | BODIE, KANE, MARCUS
The Index Model and Realized Returns
• CAPM is based on expected returns:
9-15
• Observe that index model beta is the same
as the beta of the CAPM (quick derivation)
• Compare the two: should 𝛼 be zero?
iMiiieRR
• To move from expected to realized returns,
use the index model in excess return form:
fMifi
rrErrE
R E S E T S TYLE

INVESTMENTS | BODIE, KANE, MARCUS
Figure 9.4 Estimates of Individual Mutual Fund Alphas, 1972-1991
9-16
• CAPM: E[𝛼𝑖] = 0 ∀𝑖
• index: realized 𝛼 should average to zero
Mean < 0 (slightly)
but statistically
indistinguishable
from zero
R E S E T S TYLE

INVESTMENTS | BODIE, KANE, MARCUS
Is the CAPM Practical?
• CAPM is a good model to explain expected returns on risky assets. This means:
–Without security analysis, 𝛼 is
assumed to be zero
–Positive and negative alphas are
revealed only by superior security
analysis
9-17
R E S E T S TYLE

INVESTMENTS | BODIE, KANE, MARCUS
Is the CAPM Practical?
• CAPM assumes the market portfolio M is mean-variance optimal.
• Must use a proxy for market portfolio (for example, but not limited to, S&P500)
• CAPM is still considered the best
available description of security pricing
and is widely accepted
(i.e. assume 𝛼=0 w/out analysis)
9-18
R E S E T S TYLE

INVESTMENTS | BODIE, KANE, MARCUS
Is the CAPM Testable?
• Empirical tests reject hypothesis 𝛼=0
• Low 𝛽 securities have 𝛼 > 0
• High 𝛽 securities have 𝛼 < 0
• Is CAPM then not valid?
• No better model out there, we measure 𝛼 and 𝛽 with unsatisfactory precision
• No mutual fund consistently outperforms the passive strategy
9-19
R E S E T S TYLE

INVESTMENTS | BODIE, KANE, MARCUS
Econometrics and the Expected Return-Beta Relationship
• Are empirical tests poorly designed?
• Statistical bias is easily introduced
• Miller and Scholes paper demonstrated how econometric problems could lead one to reject the CAPM even if it were perfectly valid
• For example residuals are correlated within the same industry
9-20
R E S E T S TYLE

INVESTMENTS | BODIE, KANE, MARCUS
Extensions of the CAPM
• Zero-Beta Model
– Combine frontier-portfolios to obtain
portfolios also on the efficient frontier
– Uncorrelated pairs of top and bottom
efficient frontier portfolio
– Helps explain 𝛼>0 for low 𝛽 stocks and
𝛼<0 on high 𝛽 stocks
• Consideration of labor income and non-traded assets (e.g. private equity)
9-21
R E S E T S TYLE

INVESTMENTS | BODIE, KANE, MARCUS
Extensions of the CAPM
• Consumption-based
CAPM (Rubinstein, Lucas,
Breeden)
• Investors allocate
wealth between
consumption today
and investment for the
future (future wealth
comes from
investment and labor)
• Merton’s Multiperiod
Model and hedge
portfolios (ICAPM)
• Incorporation of the
effects of changes in
the real rate of
interest and inflation
• K factors generalize
SML to Multi-index
model
9-22
R E S E T S TYLE

INVESTMENTS | BODIE, KANE, MARCUS
Liquidity and the CAPM
• Liquidity: The ease and speed with which an asset can be sold at fair market value
• Illiquidity Premium: Discount from fair market value the seller must accept to obtain a (quick) sale.
– Measured partly by bid-asked spread
– As trading costs are higher, the illiquidity
discount will be greater
9-23
R E S E T S TYLE

INVESTMENTS | BODIE, KANE, MARCUS
Figure 9.5 The Relationship Between Illiquidity and Average Returns
9-24
R E S E T S TYLE

INVESTMENTS | BODIE, KANE, MARCUS
Liquidity Risk
• In a financial crisis, liquidity can unexpectedly dry up.
• When liquidity in one stock decreases, it tends to decrease in other stocks at the same time.
• Investors demand compensation for liquidity risk – Liquidity betas
9-25
R E S E T S TYLE

INVESTMENTS | BODIE, KANE, MARCUS
CAPM and the Real World
• Academic world
– Cannot observe all tradable assets
– Impossible to pin down market portfolio
– Attempts to validate using regression
analysis
• Investment Industry
– Relies on the single-index CAPM model
– Most investors don’t beat the index
portfolio
R E S E T S TYLE