chapter 9 shallow failure analysis - ohio epa …€¦ · · 2009-05-15chapter 9 - shallow...
TRANSCRIPT

9-1
CHAPTER 9
SHALLOW FAILURE ANALYSIS
This chapter provides information to use when analyzing thepotential for shallow translational failures or shallow rotationalfailures of internal slopes and final slopes (see Figure f-1 onpage xii) of an Ohio waste containment facility. Most internalslopes will need to remain stable until buttressed with waste orfill. However, some internal slopes, such as those at wastewater lagoons, and all final slopes need to remain stableindefinitely.
Shallow translational failures occur along the weakestinterfaces, and shallow rotational failures occur through theweakest layers of a slope. Translational failures are moreprevalent in slopes containing geosynthetics, and rotationalfailures are more prevalent in slopes that do not containgeosynthetics. While these types of failures tend not to becatastrophic in nature, they can be detrimental to human healthand the environment and costly to repair.
Shallow rotational failures of roads, benches, and berms built on top of a cap system (with or withoutgeosynthetics in the cap) must be analyzed to ensure that the structures will remain stable. In mostcases, shallow rotational failure surfaces of these types of structures can be successfully analyzed usingthe same types of computer modeling software as those used for deep-seated failure analysis. However,when using the computer modeling software for shallow rotational failure analysis, the searchparameters need to be set to force the software to search for failure surfaces through the shallow surfacesof the cap, including roads, berms, and benches.
REPORTING
Ohio EPA recommends that the results of the shallowfailure surface analysis be included in their own sectionof the geotechnical and stability analyses report. At aminimum, the following information about the shallowfailure analysis should be reported to Ohio EPA:
Any drawings or cross sections referred to in thispolicy that are already present in another part ofthe geotechnical and stability analyses report canbe referenced rather than duplicated in eachsection. It is helpful if the responsible partyensures the referenced items are easy to locateand marked to show the appropriate information.
Ohio EPA considers any failure thatoccurs through a material or along aninterface on a slope that is greater thanfive percent and that is loaded with 1,440psf or less above a geosynthetic to be ashallow failure. This load was designatedbecause it is reasonable to expect thatmost cap systems will have less than1,440 psf permanent loading, and underthose conditions, it is generally acceptedpractice to use peak interface shearstrengths during stability analyses. Whereas, slopes loaded with more than1,440 psf above a geosynthetic willgenerally be more deeply buried andnecessitate the use of residual interfaceshear strengths during stability analyses.

Chapter 9 - Shallow Failure Analysis
9-2
Figure 9-1 An example of a shallow rotational failure of soil.
! A narrative summary describing theresults of the shallow failure analysis,
! One or more tables summarizing theresults of the shallow failure analysisfor each cross section analyzed,
! One or more tables summarizing theinternal and interface shear strengths ofthe various components of the internalslopes and final slopes,
! Graphical depictions of any non-linearfailure envelopes being proposed foreach interface, material, and composite system (e.g., see Figure 4-5 on page 4-23),
! A narrative justifying the assumptions used in the calculations,
! The scope, extent, and findings of the subsurface investigation as they pertain to the analyses ofpotential shallow failures at the waste containment facility,
! Plan views of the internal slope and final slope grading plans, clearly showing the location of theworst-case cross sections, northings and eastings, and the limits of the waste containment unit(s),
! Drawings of the worst-case cross sections, including the slope components (e.g., geosynthetics, soilcover material, drainage layers, RSL, waste, drainage pipes, temporal high phreatic andpiezometric surfaces),
! Stability calculations for unsaturated internal slopes and final slopes assuming static conditions,
! Stability calculations for saturated internal slopes and final slopes assuming static conditions,
! Stability calculations for unsaturated final slopes assuming seismic conditions,
! Any other necessary calculations, and
! Any figures, drawings, or references relied upon during the analysis. This includes copies of themost recent final version of the following figures showing the facility’s location on each.
! Figure 9-6 on page 9-18: The 50-year 1-hour storm map of Ohio,! Figure 9-7 on page 9-18: The 100-year 1-hour storm map of Ohio,! Figure 9-8 on page 9-19: A map of Ohio showing the peak acceleration (%g)
with 2% probability of exceedance in 50 years, and! Any other charts, graphs, data, and calculations used, marked to show how they apply to
the facility.

Chapter 9 - Shallow Failure Analysis
9-3
FACTORS OF SAFETY
The following factors of safety should be used, unless supersededby rule, when demonstrating that a facility will resist shallowfailures for:
Static analysis assuming unsaturated conditions: FS >1.50Static analysis assuming saturated conditions: FS >1.10 Seismic analysis assuming unsaturated conditions: FS >1.00
The use of higher factors of safety against shallow failures may be warranted whenever:
! A failure would have a catastrophic effect uponhuman health or the environment,
! Uncertainty exists regarding the accuracy,consistency, or validity of data, and no opportunityexists to conduct additional testing to improve thequality of the data,
! Large uncertainty exists about the effects that changes to the site conditions over time may haveon the stability of the facility, and no engineered controls can be implemented that willsignificantly reduce the uncertainty.
A facility must be designed to prevent shallow failures. Becauseof the uncertainties involved when calculating the factors ofsafety, and because shallow failures may cause damage to otherengineered components, if a facility has a static factor of safetyagainst shallow failure lower than those listed above forsaturated or unsaturated conditions, then different materials willneed to be specified or different geometries will need to be usedto design the slopes such that the required factors of safety areprovided.
If unusual circumstances exist at a facility, such as an internalslope with a leachate collection system that has a very highhydraulic conductivity drainage material, appropriate piping andpump settings that will quickly carry liquids away from the toeof the slope, a drainage layer that is protected from intrusion,freezing, and clogging, and appropriate calculations that demonstrate that little or no probability exists ofany head building up on the slope during the worst-case weather scenario, then the responsible partymay propose (this does not imply approval will be granted) to omit a shallow translational failureanalysis assuming saturated conditions. The proposal should include any pertinent informationnecessary for demonstrating the appropriateness of omitting the shallow failure analysis assumingsaturated conditions for the slope.
Designers may want to consider increasingthe required factor of safety if repairing afacility after a failure would create a hardshipfor the responsible parties or the wastedisposal customers.
The factors of safety specified in thispolicy are based on the assumptionscontained in this policy. Thoseassumptions include, but are notlimited to, the use of conservative, site-specific, higher quality data; properselection of worst-case geometry; andthe use of calculation methods that aredemonstrated to be valid andappropriate for the facility. If differentassumptions are used, these factors ofsafety may not be appropriatelyprotective of human health and theenvironment.
The number of digits after thedecimal point indicates that roundingcan only occur to establish the lastdigit. For example, 1.579 can berounded to 1.58, but not 1.6.

Chapter 9 - Shallow Failure Analysis
9-4
A design with a seismic factor of safety less than 1.00 against shallow failure indicates a failure mayoccur if a design earthquake occurs. Designing a waste containment facility in this manner is notconsidered a sound engineering practice. Furthermore, performing a deformation analysis to quantifythe risks and the damage expected to a waste containment facility that includes geosynthetics is notconsidered justification for using a seismic factor of safety less than 1.00 against shallow failure. This isbecause geosynthetics are susceptible to damage at small deformations. Failure to the waste containmentfacility due to a shallow failure may damage other engineered components and is likely to increase harmto human health and the environment. If a facility has a seismic factor of safety against shallow failureless than 1.00, then different materials will need to be specified or different geometries will need to beused to design the slopes such that the required factor of safety is provided.
The responsible party should ensure that the design and specifications in all authorizing documents andthe QA/QC plans clearly require that the assumptions and specifications used in the shallow failureanalysis for the facility will be followed during construction, operations, and closure. If the responsibleparty does not do this, it is likely that Ohio EPA will require the assumptions and specifications from theshallow failure analysis to be used during construction, operations, and closure of a facility through suchmeans as are appropriate (e.g., regulatory compliance requirements, approval conditions, orders,settlement agreements).
From time to time, changes to the facility design may be needed that will alter the assumptions andspecifications used in the shallow failure analysis. If this occurs, a request to change the facility designis required to be submitted for Ohio EPA approval in accordance with applicable rules. The request tochange the facility design must include a new shallow failure analysis that uses assumptions andspecifications appropriate for the change.
ASSIGNING SHEAR STRENGTHS
When assigning shear strength values to materials and interfaces for modeling shallow failures, thefollowing will usually apply:
! For foundation soils of internal slopes; use the lowest representative shear strength values for thesoil unit immediately under the RSL. If multiple soil units intersect the internal slope, use theshear strength from the weakest soil unit that intersects the RSL. These values will usually beavailable because the subsurface investigation must be completed before conducting stabilityanalyses. Linear shear strength envelopes for foundation materials should be developed fromnonlinear shear strength envelopes that start at the origin (see Conformance Testing in Chapter 4starting on page 4-15 for more information about nonlinear shear strength envelopes). Todevelop a linear shear strength envelope for the purposes of determining cohesion and φ, forfoundation materials, use the portion of the nonlinear envelope that extends entirely across thenormal stresses expected above the top of the foundation material surface on the internal slopeafter the composite liner system is in place, and before it is loaded with waste or waste water.
! When the foundation material of a final slope is waste; assume the waste and the interface of thewaste with the RSL will be at least as strong as the internal strength of the RSL, unless reasonexists to believe otherwise.

Chapter 9 - Shallow Failure Analysis
9-5
A
B
Figure 9-2 An example of a compound nonlinear peak shear strength envelope from test results oftextured FML/GT interfaces that will be used on a final slope with no tack-on benches or roads,having a 1-ft leachate drainage layer covered by a 2-ft thick protective layer. For this facility, thesand drainage layer and soil protective layer produce approximately 365 psf normal stress on theinterface [(1 x 125 pcf) + (2 x 120 pcf)]. For modeling purposes, either A or B could be used torepresent the shear strength of this interface in an infinite slope calculation, or the shear stresscorresponding to 365 psf normal stress (230 psf) could be used with a φ = 0. As an alternative, thenon-linear envelope could be used in modeling software such as XSTABL.
! For structural fill and recompacted soil components; soil materials may have been compacted inthe laboratory using the minimum density and highest moisture content specified for constructionand then tested for internal shear strength during the subsurface investigation (this isrecommended). If this occurred, strength values for each engineered component made ofstructural fill or recompacted layers should be modeled using the values obtained from testing ofthe materials that represent the weakest materials that will be used during construction. Linearshear strength envelopes for structural fill and RSL materials should be developed fromcompound nonlinear shear strength envelopes that start at the origin. To develop a linear shearstrength envelope for the purposes of determining cohesion and φ, for RSL or structural fill, usethe portion of the nonlinear envelope that extends entirely across the normal stresses expectedabove the RSL or structural fill component. For a composite liner system on an internal slope,this is the range of normal stresses caused by the composite liner system before any waste orwaste water is in place. For a composite cap system on a final slope, this is the range of the

Chapter 9 - Shallow Failure Analysis
9-6
normal stresses caused by the composite cap system drainage layer and the protective layer, tack-on benches and roads, and deployment equipment.
For example, if the RSL of a composite cap system with a 3-foot thick protective layer on top(including a drainage layer) with no benches or roads exhibits a compound nonlinear peak shearstress envelope such as shown in Figure 9-2 on page 9-5, then the expected range of normalstress in the field would be less than 500 psf [1.0 ft x 125 pcf) + (2 x 120) = 365.0 psf]. As aresult, from Figure 9-2, it can be seen that a c = 230 psf and a φ = 0o, a c and φ derived from lineA, or a φ derived from line B could be used in an infinite slope analysis of the RSL of thiscomposite cap system. As an alternative, the entire non-linear shear strength envelope could beused in a computer modeling software such as XSTABL. See Conformance Testing in Chapter 4starting on page 4-15 for more information about developing nonlinear shear strength envelopes. This example does not take into account the stress created by deployment equipment. A designershould consider evaluating the slope in light of the deployment equipment weight to avoidmobilizing post-peak shear strength in the materials or creating an unexpected failure duringconstruction as has happened at some facilities in Ohio.
! For interface shear strengths with geosynthetics, it isrecommended that the shallow failure analysis be used todetermine the minimum interface shear strengths that arenecessary to provide the required factors of safety. This willprovide the maximum flexibility for choosing materialsduring construction.
! For internal shear strengths of GCLs and RSLs, it isrecommended that the shallow failure analysis be used todetermine the minimum internal shear strengths of GCLsand RSLs that are necessary to provide the required factorsof safety. This will provide the maximum flexibility whenusing these materials during construction.
! The resultant values determined by the shallow failureanalysis calculations for interface and internal peak shearstrengths and residual shear strengths should assume cohesion (c) is zero. The actual internaland interface shear strengths of construction materials must be verified before construction (seeConformance Testing in Chapter 4 starting on page 4-15).
For shallow failure analysis of internal slopes and final slopes, the following types of shear strengthsshould be specified in the authorizing documents and the QA/QC plan for the listed components:
! Peak shear strengths may be used for geosynthetic interfaces,
! Internal peak shear strengths may be used for reinforced GCL,
! Internal and interface residual shear strengths must be used for unreinforced GCL,
! Internal peak shear strengths may be used for soil materials.
The design phase should include adetermination of the weakestinternal and interface shearstrengths that the materials in eachcomponent need to exhibit toprovide stability for the wastecontainment facility. Theseminimum shear strengths must thenbecome part of the project designspecifications. Conformancetesting of the internal and interfaceshear strengths of constructionmaterials must be conducted priorto use to verify that they willprovide the shear strengthnecessary to meet the stabilityrequirements of the design.
Chapter 9 - Shallow Failure Analysis
9-7
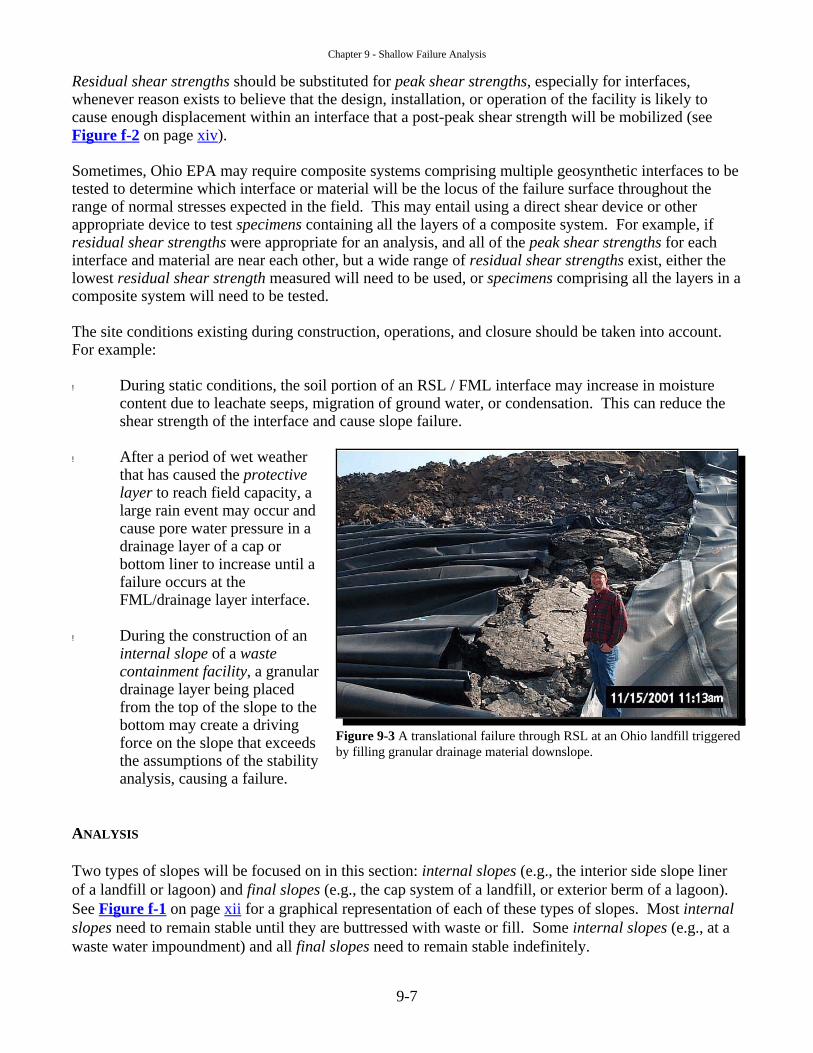
Figure 9-3 A translational failure through RSL at an Ohio landfill triggeredby filling granular drainage material downslope.
Residual shear strengths should be substituted for peak shear strengths, especially for interfaces,whenever reason exists to believe that the design, installation, or operation of the facility is likely tocause enough displacement within an interface that a post-peak shear strength will be mobilized (seeFigure f-2 on page xiv).
Sometimes, Ohio EPA may require composite systems comprising multiple geosynthetic interfaces to betested to determine which interface or material will be the locus of the failure surface throughout therange of normal stresses expected in the field. This may entail using a direct shear device or otherappropriate device to test specimens containing all the layers of a composite system. For example, ifresidual shear strengths were appropriate for an analysis, and all of the peak shear strengths for eachinterface and material are near each other, but a wide range of residual shear strengths exist, either thelowest residual shear strength measured will need to be used, or specimens comprising all the layers in acomposite system will need to be tested.
The site conditions existing during construction, operations, and closure should be taken into account. For example:
! During static conditions, the soil portion of an RSL / FML interface may increase in moisturecontent due to leachate seeps, migration of ground water, or condensation. This can reduce theshear strength of the interface and cause slope failure.
! After a period of wet weatherthat has caused the protectivelayer to reach field capacity, alarge rain event may occur andcause pore water pressure in adrainage layer of a cap orbottom liner to increase until afailure occurs at theFML/drainage layer interface.
! During the construction of aninternal slope of a wastecontainment facility, a granulardrainage layer being placedfrom the top of the slope to thebottom may create a drivingforce on the slope that exceedsthe assumptions of the stabilityanalysis, causing a failure.
ANALYSIS
Two types of slopes will be focused on in this section: internal slopes (e.g., the interior side slope linerof a landfill or lagoon) and final slopes (e.g., the cap system of a landfill, or exterior berm of a lagoon). See Figure f-1 on page xii for a graphical representation of each of these types of slopes. Most internalslopes need to remain stable until they are buttressed with waste or fill. Some internal slopes (e.g., at awaste water impoundment) and all final slopes need to remain stable indefinitely.
Chapter 9 - Shallow Failure Analysis
9-8
Static Analysis
When performing a shallow failure analysis of an internal slope or final slope, the worst-case crosssections should be determined, taking into account known shear strengths of the materials, the steepestslope angle, and longest slope length. In cases where the worst-case slopes do not meet the requiredfactors of safety, it must be ensured that no other slopes fail to meet the required factors of safety. Onceall the slopes that do not meet the required factors of safety are identified, adjustments to the materialspecifications and/or facility design can be made to ensure that the required factors of safety are achievedfor all slopes.
Shallow rotational failures of roads, benches, and berms built on top of a cap system (with or withoutgeosynthetics in the cap) must be analyzed to ensure that the structures will remain stable. In mostcases, shallow rotational failure surfaces of these types of structures can be successfully analyzed usingthe same types of computer modeling software as those used for deep-seated failure analysis. However,when using the computer modeling software for shallow rotational failure analysis, the searchparameters need to be set to force the software to search for failure surfaces through the shallow surfacesof the cap, including roads, berms, and benches.
Static Saturated Analysis
When calculating the static factor of safety against shallow failure for saturated conditions, the worst-case cross sections should be based on the following:
Internal slopes
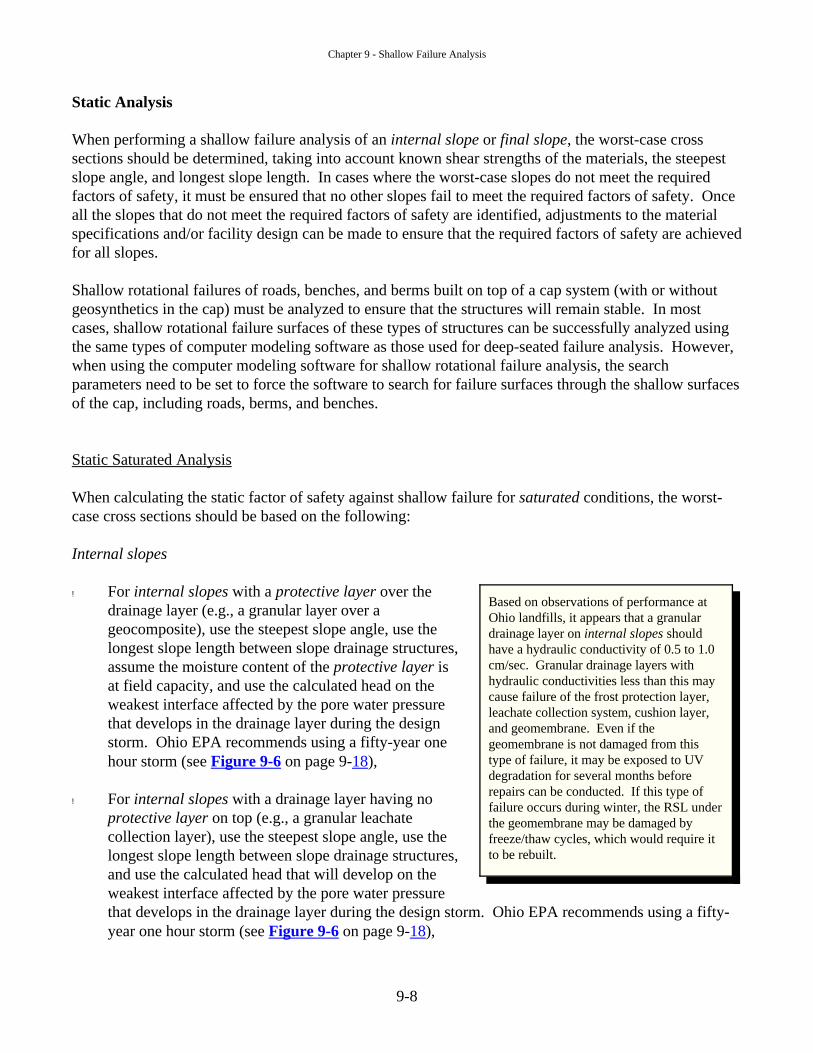
! For internal slopes with a protective layer over thedrainage layer (e.g., a granular layer over ageocomposite), use the steepest slope angle, use thelongest slope length between slope drainage structures,assume the moisture content of the protective layer isat field capacity, and use the calculated head on theweakest interface affected by the pore water pressurethat develops in the drainage layer during the designstorm. Ohio EPA recommends using a fifty-year onehour storm (see Figure 9-6 on page 9-18),
! For internal slopes with a drainage layer having noprotective layer on top (e.g., a granular leachatecollection layer), use the steepest slope angle, use thelongest slope length between slope drainage structures,and use the calculated head that will develop on theweakest interface affected by the pore water pressurethat develops in the drainage layer during the design storm. Ohio EPA recommends using a fifty-year one hour storm (see Figure 9-6 on page 9-18),
Based on observations of performance atOhio landfills, it appears that a granulardrainage layer on internal slopes shouldhave a hydraulic conductivity of 0.5 to 1.0cm/sec. Granular drainage layers withhydraulic conductivities less than this maycause failure of the frost protection layer,leachate collection system, cushion layer,and geomembrane. Even if thegeomembrane is not damaged from thistype of failure, it may be exposed to UVdegradation for several months beforerepairs can be conducted. If this type offailure occurs during winter, the RSL underthe geomembrane may be damaged byfreeze/thaw cycles, which would require itto be rebuilt.

Chapter 9 - Shallow Failure Analysis
9-9
Final slopes
! Use the steepest slope and the longest slope length between slope drainage structures, assume themoisture content of the protective layer is at field capacity, and use the calculated head on theweakest interface affected by the pore water pressure that develops in the drainage layer during theone hundred-year one hour storm (see Figure 9-7 on page 9-18).
Two of the scenarios above include protective layers. They represent field conditions where a stormoccurs after a period of wet weather that has caused the protective layer to reach field capacity. Therefore, “there is no additional storage capacity, and the infiltrating water all passes through thesystem as percolation in accordance with Darcy’s formula” (Soong and Koerner, 1997). This means thatcorrectly estimating the hydraulic conductivity of the protective layer (kc) is critical to properlyestimating the inflow of water to the cap drainage layer. The value used should be representative of thehydraulic conductivity of the protective layer after it has been in place long enough to have experiencedfreeze/thaw cycles, wet/dry cycles, root penetration, insect and animal burrowing, and other physicalweathering. A typical value of 1 x 10⁻⁴ cm/sec has been offered by Richardson. However, USDA soilsurveys, and on-site testing of the hydraulic conductivity of long-time undisturbed vegetated areas couldalso be used for determining kc. If another method of calculating the head on the weakest interface (havg)is used, the alternative method should also assume that the cover soil has reached field capacity.
Seismic Analysis
When calculating the seismic factor of safety for final slopes that include geosynthetic interfaces, theworst-case cross sections should be determined using the steepest slope angle and slope geometry, usingunsaturated conditions, and assuming typical head conditions in the drainage layer, if a drainage layer ispart of the design.
For shallow failure analysis, the methodology for seismic analysis applies the horizontal force at thefailure surface. As a result, the highest peak horizontal ground acceleration expected at any point alongthe failure surface should be used.
Determining a Horizontal Ground Acceleration to Use for Seismic Analysis
Selecting an appropriate horizontal acceleration to use during seismic analysis is highly facility-specific. The location of the facility, the types of soils under the facility, if any, and the type, density, and heightof the engineered components and the waste, all affect the horizontal acceleration experienced at afacility from any given seismic event. The base of facilities founded on bedrock or medium soft to stiffsoil units will likely experience the same horizontal acceleration as the bedrock. Facilities founded onsoft or deep cohesionless soil units will need a more detailed analysis and possibly field testing todetermine the effects the soils will have on the horizontal acceleration as it reaches the base of thefacility.
Waste and structural fill can cause the horizontal acceleration experienced at the base of the facility to betransmitted unchanged, dampened, or amplified by the time it reaches the surface of the facility. Theexpected effects of the waste and structural fill on the horizontal acceleration will need to be determined

Chapter 9 - Shallow Failure Analysis
9-10
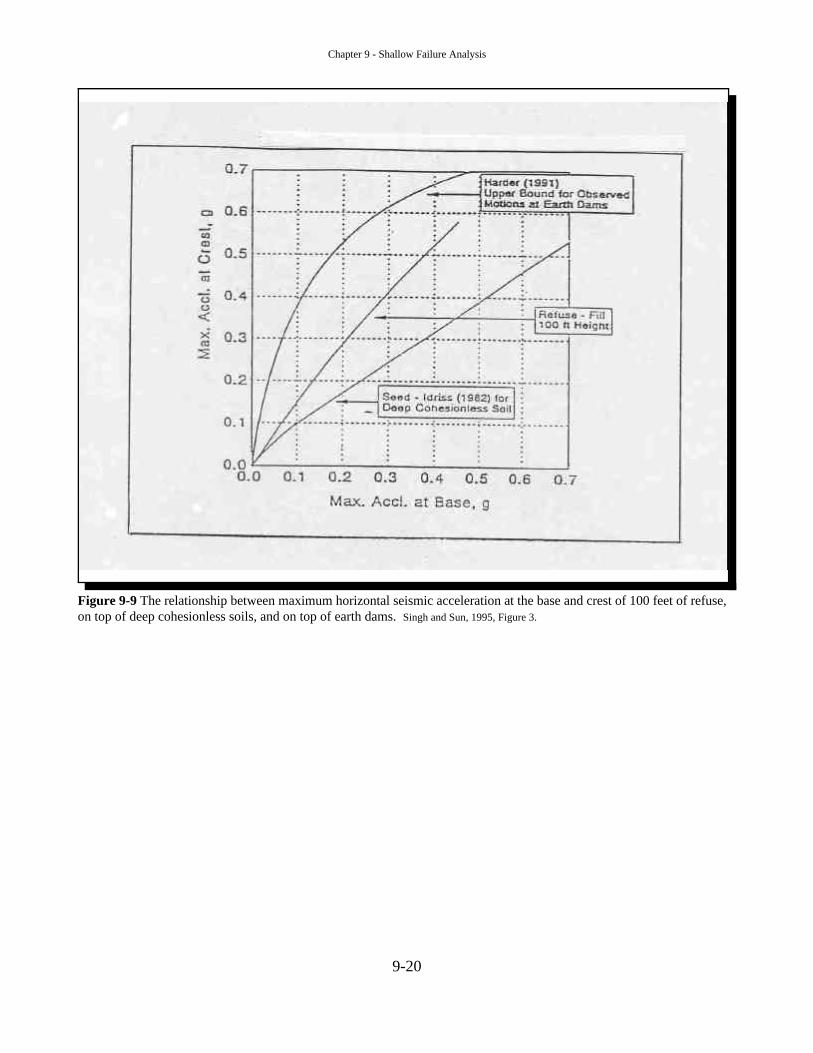
for each facility so that the appropriate horizontal acceleration at the expected shallow failure surface canbe estimated for stability modeling purposes. MSW is typically a relatively low density, somewhatelastic material. It is expected that the horizontal acceleration at the base of a MSW facility will beamplified as it progresses towards surfaces 100 feet or less above the ground surface (see Figure 9-9 onpage 9-20). The amplification caused by any depth of municipal waste is not expected to exceed theupper bound of amplification observed for motions in earth dams as attributed to Harder (1991) in Singhand Sun, 1995 (see Figure 9-9). To determine the effects of structural fill and industrial wastes, such asflue gas desulfurization dust, cement kiln dust, lime kiln dust, foundry sands, slags, and dewateredsludges on the horizontal acceleration, the characteristics of the materials will need to be determinedeither by measuring shear wave velocities or by demonstrating the similarity of the materials tocompacted earth dam material, bedrock, or deep cohesionless soils and applying the above noted figures.
Alternative methods for determining site-specific adjustments to expected horizontal accelerations maybe also used. These typically involve conducting seismic testing to determine site-specific shear wavevelocities, and amplification/dampening characteristics. A software package such as WESHAKEproduced by USACOE, Engineer Research and Development Center, Vicksburg, MS, is then used tocalculate the accelerations at different elevations in the facility. Because of the differences betweenearthquakes that occur in the western United States and earthquakes that occur in the eastern UnitedStates, using earthquake characteristics from Ohio and the eastern United States is necessary when usingsoftware, such as WESHAKE, to estimate induced shear stress and accelerations.
Ohio EPA requires that the seismic coefficient (ng) used in numerous stability modeling calculations bebased on the horizontal acceleration of peak ground acceleration from a final version of the most recentUSGS “National Seismic Hazard Map” (e.g., see Figure 9-8 on page 9-19) showing the peakacceleration (%g) with 2% probability of exceedance in 50 years. As of the writing of this policy, theseismic hazard maps are available at www.usgs.gov on the USGS Web site. Once the facility locationon the map has been determined, then the peak horizontal acceleration indicated on the map may beadjusted for dampening effects and must be adjusted for the amplification effects of the soils, engineeredcomponents, and waste at the facility as discussed above. If instrumented historical records show that afacility has experienced horizontal ground accelerations that are higher than those shown on the USGSmap, then the higher accelerations should be used as the basis for determining the seismic coefficient forthe facility.

Chapter 9 - Shallow Failure Analysis
9-11
In 1997, Ohio EPA issued a stop workorder at a stabilized hazardous wasteclosure unit. More than two dozen tearsand ripped seams occurred in the geotextilefilter layer between the granular protectivelayer and the geonet drainage layer thatwas part of the primary compositeliner/leachate collection system. Longtears developed at the crest of the internalslope at the beginning of the anchor runoutand other areas. Work was stopped untilthe granular drainage layer could beremoved and the geonet and geotextileinspected, repaired, or replaced as needed.
Figure 9-4 Example detail of (A) anchor runoutand (B) anchor trench. Anchor trenches can alsobe “V” shaped (dashed line).
Anchoring Geosynthetics on Internal Slopes
An anchor runout is a portion of geosynthetic that extends beyond the crest of a slope and is weighted with soilor other material to hold the geosynthetic in place (see Figure 9-4, A). An anchor trench usually occurs at theend of a runout. A trench is dug beyond the crest of a slope, andthe end of the runout material drops into the trench that is thenback filled with soil or other material to hold the geosynthetic inplace (see Figure 9-4, B).
Anchorages are used with geosynthetics for the followingreasons:
! To hold the geosynthetics in place during installation ofsubsequent layers,
! To prevent surface water from flowing beneath thegeosynthetics anytime during or after installation. This isnecessary because flowing water damages the underlying soillayers and decreases the interface shear strength of the linersystem, and
! To prevent surface water from entering any leak detectionlayers or drainage layers. This is necessary becausesuspended soils may enter those layers and lead to clogging. That in turn, can cause an increase in water pressure and adecrease in interface shear strength of the layers. Surfacewater infiltration into a leak detection layer of a wastecontainment facility can increase the cost of leachatetreatment and unwarranted concern that the primary liner isleaking.
Although the tensile strength of geosynthetics must not betaken into account when evaluating stability, it isappropriate when analyzing the performance of anchorages. This is because it is necessary to determine if geosyntheticswill pull out of their anchorages or rip.
It is generally accepted that most anchorages are over-designed andare likely to result in tearing of geosynthetics should unexpectedtensile stresses occur. Designers should consider using a lessrobust design for anchorages to reduce the likelihood thatgeosynthetics will tear if unexpected tensile stresses occur.
Some designers recommend attempting to direct a failure to aspecific interface, often called a “slip layer,” when concern existsabout the ability of an essential geosynthetic component (e.g., ageomembrane liner) to withstand unanticipated tensile strain.
The slip layer is placed above the essential geosynthetic it is protecting. The slip layer material is chosen so that itsinterface shear strength will be lower than the interface shear strength of the essential geosynthetic with its underlyingmaterial. The anchorage for the slip layer is designed to release before the essential geosynthetic will pull out of itsanchorage. This increases the probability that the slip layer interface will fail first and leave the essential geosyntheticin place and intact, hopefully preserving containment. Even if a facility incorporates a slip layer in the design, it mustbe stable without relying on the tensile strength of the geosynthetics including the slip layer if one is used.

Chapter 9 - Shallow Failure Analysis
9-12
( ) ( )( )FS
cz
z dz
n
nc c
w c w
c cg
g
=
+ −−
−
+
γ βφ
γγ
β φ
β
costan tan tan
tan
2 1
( )( )φ
βγ β
γγ
β
=+ −
−−
−
−tan
tancos
tan
12
1
FS nc
z
z d
zn
gc c
w c w
c cg
Factor of Safety Against Shallow Failure - Example Method
Many alternatives exist to analyze internal slopes and final slopes for susceptibility to shallow translational androtational failures, ranging from computer modeling to hand calculations. For shallow translational failures, atypical method used is a limit equilibrium method calculated using a spreadsheet. Some examples of theseequations can be found in the following references;
Giroud, J. P., Bachus, R. C. and Bonaparte, R., 1995, “Influence of Water Flow on the Stability ofGeosynthetic-Soil Layered Systems on Slopes,” Geosynthetics International, Vol. 2, No. 6, pp. 1149 - 1180.
Matasovic, N., 1991, “Selection of Method for Seismic Slope Stability Analysis,” Second InternationalConference on Recent Advances in Geotechnical Earthquake Engineering and Soil Dynamics, Paper 7.20,March 11 - 15, pp. 1057 - 1062. St. Louis, Missouri.
Soong, T. Y. and Koerner, R. M., 1997, “The Design of Drainage Systems Over Geosynthetically LinedSlopes,” GRI Report #19.
Of these, Matasovic, 1991, is the simplest to use, involves an infinite slope analysis, uses a seismic coefficient,and tends to be more conservative. It also provides results comparable to computer modeling software such asXSTABL.
(9.1)
(9.1.1)
where FS = factor of safety against shallow failure,ng = peak horizontal acceleration at the failure surface (%g),γc = field density of cover materials,γw = density of water,c = cohesion of failure surface,φ = internal angle of friction,β = angle of slope,zc = depth of cover soils, anddw = depth to water table that is assumed parallel to slope (dw = z - havg), (see Equation 9.2, 9.3, or
9.4 for havg).
Chapter 9 - Shallow Failure Analysis
9-13
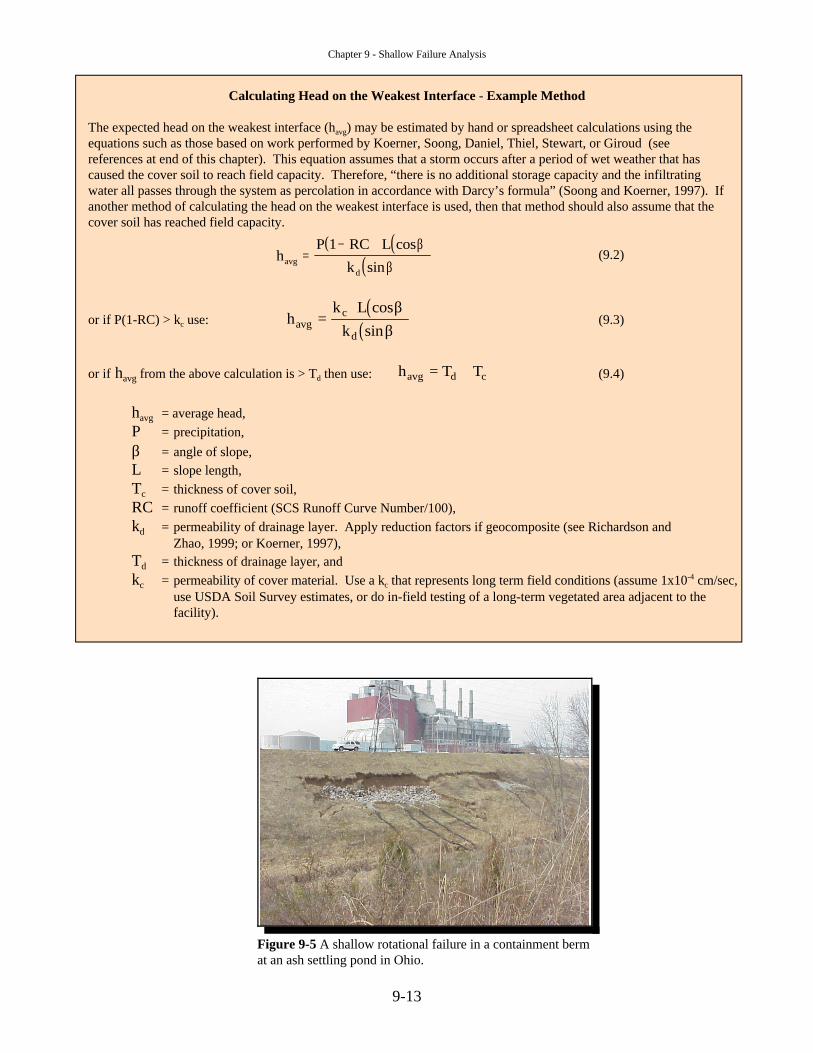
Figure 9-5 A shallow rotational failure in a containment bermat an ash settling pond in Ohio.
Calculating Head on the Weakest Interface - Example Method
The expected head on the weakest interface (havg) may be estimated by hand or spreadsheet calculations using theequations such as those based on work performed by Koerner, Soong, Daniel, Thiel, Stewart, or Giroud (seereferences at end of this chapter). This equation assumes that a storm occurs after a period of wet weather that hascaused the cover soil to reach field capacity. Therefore, “there is no additional storage capacity and the infiltratingwater all passes through the system as percolation in accordance with Darcy’s formula” (Soong and Koerner, 1997). Ifanother method of calculating the head on the weakest interface is used, then that method should also assume that thecover soil has reached field capacity.
(9.2)( ) ( )
( )hP RC L
kavgd
=− ⋅1 cos
sin
β
β
or if P(1-RC) > kc use: (9.3)( )
( )h
k Lkavgc
d=
⋅ cossin
ββ
or if havg from the above calculation is > Td then use: (9.4)h T Tavg d c= +
havg = average head,P = precipitation,β = angle of slope,L = slope length,Tc = thickness of cover soil,RC = runoff coefficient (SCS Runoff Curve Number/100),kd = permeability of drainage layer. Apply reduction factors if geocomposite (see Richardson and
Zhao, 1999; or Koerner, 1997), Td = thickness of drainage layer, andkc = permeability of cover material. Use a kc that represents long term field conditions (assume 1x10⁻⁴ cm/sec,
use USDA Soil Survey estimates, or do in-field testing of a long-term vegetated area adjacent to thefacility).

Chapter 9 - Shallow Failure Analysis
9-14
( ) ( )( )[ ] ( )
φ =+ −
− −
=− ⋅ ⋅
−⋅
tan. . tan .
. tan ..
. cos .
. . ..
1
0120 2 5 18 43
62 4 2 5 2 5120 2 5
10 014 18 43
1 014 18 4326 40
2g
g
psfpcf ft
psf ft ftpcf ft
o
Shallow Failure - Example Calculations
A 200-ft high landfill in Ohio has 3(h):1(v) (18.43o) internal slopes and final slopes. The final slopes comprise 1.5feet of RSL; a 40-mil textured FML; a 0.20-inch (0.508 cm) thick geocomposite drainage layer (GDL) with atransmissivity of 2.0x10⁻³ m2/sec (k = 39.4 cm/sec). The GDL was tested with RSL/FML below it and protective layerabove it, using a normal load of 500 psf between at a 0.32 gradient. Outlets are spaced at 130-foot (3,962.4 cm)intervals along the final slopes; and there is a 2.5-foot thick protective layer with a long-term permeability of 1.0 x10⁻⁴
cm/sec. A good stand of grass (SCS Runoff Curve Number = 90) exists on the slope.
The internal slopes comprise 5-foot RSL, a 60-mil textured FML, and a 1-foot granular drainage layer (DL) with apermeability of 1 cm/sec along the slopes that rise 50 feet. A leachate collection pipe at 0.5 percent grade transects theslope so that the maximum distance of flow is 75 feet. This example assumes that the liner components will be chosenafter the facility design has been approved. Therefore, the shear strengths determined by the following calculationswill be used as the minimum requirements in the permit.
Shallow Failure, Unsaturated Static Conditions - Example Calculation 1
Determine the friction angle required for a 1.50 static factor of safety for the internal slopes and final slopes using theworst-case cross sections for the facility and Equation 9.1.1
Internal slope( ) ( )[ ] ( )
φrequired
psfpcf ft
psf ft ftpcf ft
g
g=
+ −
− −
=− • •
−•
tan. tan .
tan ..
cos .
. ( )1
0120 1 18 43
62 4 1 1120 1
15 0 18 43
1 0 18 432656
2o
Final slope ( ) ( )
( )[ ] ( )φrequired
psfpcf ft
psf ft ftpcf ft
g
g=
+ −
− −
=− ⋅ ⋅
−⋅
tan. tan .
tan ..
. cos .
. . ..
1
0120 2 5 18 43
62 4 2 5 2 5120 2 5
15 0 18 43
1 0 18 432656
2o
The minimum interface and internal peak shear strength of all materials required for both internal slopes and finalslopes at this facility is 26.56o to obtain a 1.50 static factor of safety against shallow failure.
Shallow Failure, Unsaturated Seismic Conditions - Example Calculation 2
Determine the shear strength required for a 1.00 seismic factor of safety for the final slopes using the worst-case crosssections for the facility. Figure 9-8 on page 9-19 shows an expected peak ground acceleration for the facility of 0.10g. For shallow failure analysis of final cap, the highest horizontal acceleration expected on any surface should be used. Therefore, it is recommended that the peak horizontal acceleration for cap be estimated from Figure 9-9 on page 9-20. This is because it is expected that the surfaces of slopes less than 100 feet high in a facility will experience the highesthorizontal accelerations. Using an ng at the base of waste of 0.10g results in an estimated amplification toapproximately 0.14g for cap at or below 100 ft from the ground surface. Calculate the shear strength required usingEquation 9.1.1
Final slope
The minimum interface and internal peak shear strength for all materials in the composite cap system at this facility is26.40o to obtain a 1.00 seismic factor of safety.

Chapter 9 - Shallow Failure Analysis
9-15
Shallow Failure, Saturated Static Conditions - Example Calculation 3
Determine the required shear strength to have a 1.10 static factor of safety for internal slopes and final slopesassuming saturated conditions. The RSL/FML interfaces for the internal slopes and final slopes are not affected bythe pore water pressure developed in the drainage layer because the RSL/FML interface is separated from the drainagelayer by the FML. However, the interfaces above the FML are affected by pore water on both slopes.
For internal slopes: The interface of interest is the FML/DL. Therefore, calculate the head on the interface during the50-year, 1-hour storm using Figure 9-6 on page 9-18 (2.75 in/hr) and Equation 9.2 because theDL is the protective layer. Calculate the required minimum shear strength using Equation 9.1.1.
From Equation 9.2( ) ( )
( )hcm cm
cmcm ftavg =
× − ⋅= =
−194 10 1 0 0 2286 18 431 18 43
133 0 4363. / sec . cos .
/ sec sin .. .
From Equation 9.4 dw = 1 ft - 0.436 ft = 0.564 ft
From Equation 9.1.1
( )
( )( )
φ required
gpsf
pcf ft
psf ft ft
pcf ftg
=+ −
⋅ ⋅
−−⋅
−
=−tan. tan .
cos .
. .tan .
.1211 0 18 43
0120 1 18 43
162 4 1 0564
120 10 18 43
2537o
The minimum peak shear strength required to have a 1.10 static factor of safety for internal slopes before waste isplaced in this facility is 25.37o for the interfaces above the FML during the design storm.
For final slopes: The interface of interest is the FML/GDL. Therefore, calculate the head on the interface during the100-year, 1-hour storm using Figure 9-7 on page 9-18, which is 3.0 in/hr (2.12x10⁻³ cm/sec) andEquation 9.3 because P(1-RC) > kc (e.g., 2.12x10⁻³ cm/sec (1 - 0.9) > 1.0 x10⁻⁴ cm/sec). Calculatethe shear strength required using Equation 9.1.1.
Calculate the permeability of the geocomposite using the reduction factors recommended in Richardson and Zhao,1999; Giroud, Zhao, and Richardson 2000; or Koerner, 1997.
(9.5)TrTr
FS FS FS FS FSLT
I Cr CC B S=
⋅ ⋅ ⋅ ⋅
where TrL = long term transmissivity,TrT = tested transmissivity,FSI = factor of safety to account for intrusion,FSCr = factor of safety to account for creep,FSCC = factor of safety to account for chemical clogging,FSB = factor of safety to account for biological clogging, andFSS = factor of safety to account for clogging due to infiltration of fines.
From Equation 9.5: Trx m
x mL =⋅ ⋅ ⋅ ⋅
=−
−52 0 1015 4 10 15 4 0
556 103 2
2. / sec. . . .
. / sec

Chapter 9 - Shallow Failure Analysis
9-16
OBJECTIVETo evaluate the stability of the cap on a 200-fthigh landfill, which has a 3 (h):1(v) final slope,comprised of 1.5-foot RSL; a 40-mil texturedFML; a 1-foot thick DL with a permeability of 1x10⁻² cm/sec; and a 1.5-foot thick protectivelayer. Outlets for the drainage layer are spacedat 130-foot intervals along the final slope at 1.5-foot high tack-on benches.
METHODOLOGYBack calculate the necessary shear strengths ofthe RSL, FML, DL, and the protective layer andthe permeability of the protective layer in orderto maintain an acceptable FS.
Shallow Failure - Example Calculation 3 (contd.)
Convert the transmissivity to hydraulic conductivity:
KTrTd
x mx m
x m cmdL= = = =
−
−− 556 10
5 08 101.094 10 1.094
5 2
32. sec
.
. sec . / sec
From Equation 9.3 ( )
( )h
cm cmcm
cm ftavg =× ⋅
= =−1 0 10 3962 4 18 431094 18 43
1.0869 0. 035654. / sec . cos .. / sec sin .
. /
havg is thicker than the GDL, therefore: dw = 0 ft
From Equation 9.1.1
( )
( )( )
φ required
g
psfpcf ft
psf ft ft
pcf ft
g
=+ −
⋅ ⋅
−−
⋅
−
=−tan. tan .
. cos .
. . .
.
tan .
.121 1 0 18 43
0120 2 5 18 43
162 4 2 5 0
120 2 5
0 18 43
37.37
o
The minimum peak shear strength required for all interfaces and materials to have a static factor of safety equal to 1.10for final slopes under saturated conditions at this facility is 37.37o.
When multiple scenarios are analyzed to determine the minimum shear strength necessary to provide the requiredfactors of safety, the scenario that produces the highest minimum factor of safety will be used to establish theminimum internal and interface shear strengths that the materials must exhibit to provide stability. For these examples,the minimum internal and interface peak shear strength that will provide stability in all analyzed scenarios is 37.37E.
Shallow Failure Analysis of Final Cap with Tack-on Benches - Example Calculation

Chapter 9 - Shallow Failure Analysis
9-17
Shallow Failure with Tack-on Benches - Example Calculations (cont.)
1 This shear strength should be the required minimum specification for this component in the quality assurance quality control plan.
2 see attached example outputs
1 these cross section were evaluated using the input values determined by the typical worst-case conditions.
For more detailed information, see the XSTABL output at the end of this chapter.
Shallow Failure Analysis of Final Cap with Tack-on Benches Summary Table of Typical Worst-Case Conditions
Component Being Evaluated Method Used Back CalculatedResult
Protective layer permeability Formula 9.3 2.54x10⁻⁵cm/sec1
Protective layer shear strength Shallow rotational XSTABL modeling2 c = 0 φ = 31E1
RSL shear strength to provide anFS$1.50 under drained static
conditionsShallow rotational XSTABL modeling
Shear Strength1
Envelope
NormalStress
ShearStress
02885761440
0275300350
FML vs. DL or RSL shearstrength to provide an FS$1.50under drained static conditions
Shallow translational XSTABL2
modeling
Shear Strength1
Envelope
NormalStress
ShearStress
02885761440
0215275350
Shallow Failure Analysis of Final Cap with Tack-on Benches Summary Table of Typical Non-Worst-Case Conditions
Component Being Evaluated1 Method Used Calculated FS
RSL shear strength saturated static Shallow rotational XSTABLmodeling
1.459
RSL shear strength drained seismic Shallow rotational XSTABLmodeling
1.125
FML vs. DL or RSL shear strength saturated static Shallow translational XSTABLmodeling
1.398
FML vs. DL or RSL shear strength drainedseismic
Shallow translational XSTABLmodeling
1.250
Chapter 9 - Shallow Failure Analysis
9-18
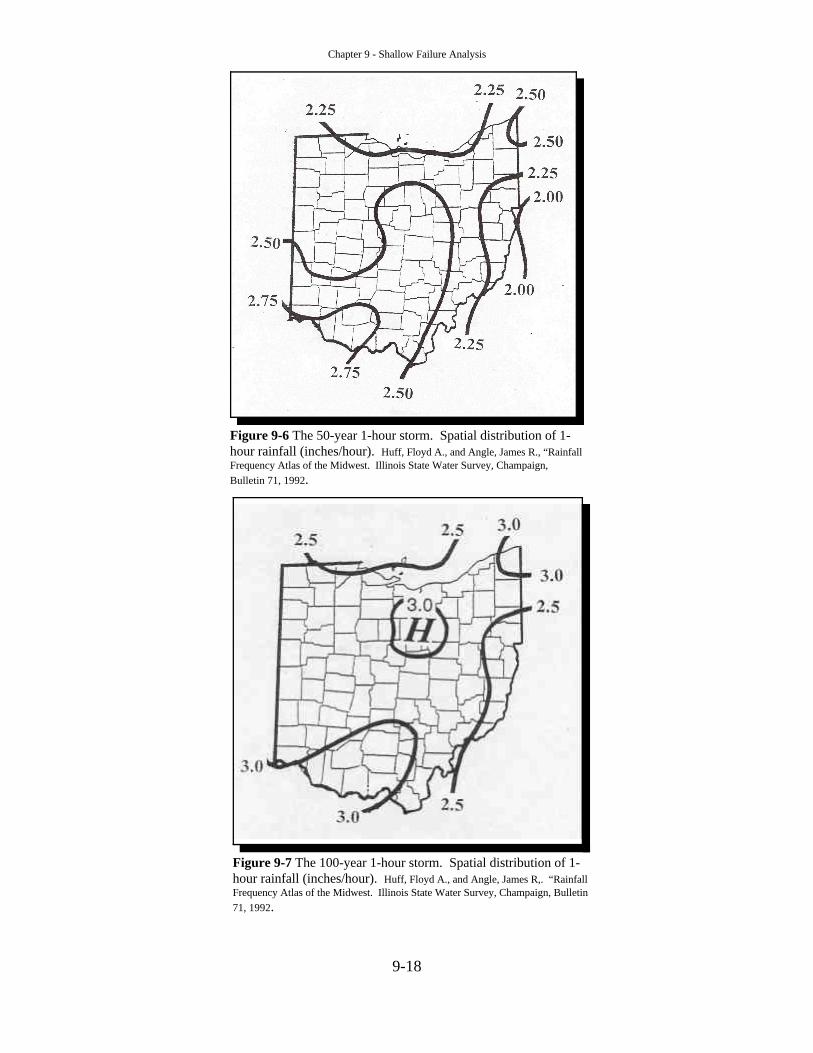
Figure 9-6 The 50-year 1-hour storm. Spatial distribution of 1-hour rainfall (inches/hour). Huff, Floyd A., and Angle, James R., “RainfallFrequency Atlas of the Midwest. Illinois State Water Survey, Champaign,Bulletin 71, 1992.
Figure 9-7 The 100-year 1-hour storm. Spatial distribution of 1-hour rainfall (inches/hour). Huff, Floyd A., and Angle, James R,. “RainfallFrequency Atlas of the Midwest. Illinois State Water Survey, Champaign, Bulletin71, 1992.

Chapter 9 - Shallow Failure Analysis
9-19
Figure 9-8 The peak acceleration (%g) with 2% probability of exceedance in 50 years. U.S. Geological Survey (October2002) National Seismic Hazard Mapping Project, “Peak Acceleration (%g) with 2% Probability of Exceedance in 50 Years (site: NEHRP B-Cboundary).”
Chapter 9 - Shallow Failure Analysis
9-20
Figure 9-9 The relationship between maximum horizontal seismic acceleration at the base and crest of 100 feet of refuse,on top of deep cohesionless soils, and on top of earth dams. Singh and Sun, 1995, Figure 3.

Chapter 9 - Shallow Failure Analysis
9-21
Shallow Rotational Failure within Tack-on Benches - Example Computer Output
XSTABL File: BEN3PTLD 6-01-** 12:34
X S T A B L
Slope Stability Analysisusing the
Method of Slices
Copyright (C) 1992 - 98 Interactive Software
Designs, Inc. Moscow, ID 83843, U.S.A.
All Rights Reserved
Ver. 5.20296 ) 1697
Problem Description : Bench on 3 to 1 slope Rotational

Chapter 9 - Shallow Failure Analysis
9-22
----------------------------- SEGMENT BOUNDARY COORDINATES -----------------------------
5 SURFACE boundary segments
Segment x-left y-left x-right y-right Soil Unit
No. (ft) (ft) (ft) (ft) Below Segment
1 .0 100.0 100.0 100.0 1
2 100.0 100.0 171.5 123.8 1
3 171.5 123.8 224.0 144.8 1
4 224.0 144.8 230.0 143.3 1
5 230.0 143.3 280.0 160.0 1
3 SUBSURFACE boundary segments
Segment x-left y-left x-right y-right Soil Unit
No. (ft) (ft) (ft) (ft) Below Segment
1 100.0 98.5 280.0 158.5 2
2 100.0 97.5 280.0 157.5 3
3 100.0 96.0 280.0 156.0 4
-------------------------- ISOTROPIC Soil Parameters --------------------------
4 Soil unit(s) specified
SoilUnitNo.
UnitMoist(pcf)
WeightSat.(pcf)
CohesionIntercept(psf)
FrictionAngle(deg)
PoreParameter
Ru
PressureConstant(psf)
WaterSurfaceNo.
1 120.0 125.0 .0 31.00 .000 .0 0
2 125.0 130.0 .0 31.00 .000 .0 0
3 100.0 100.0 .0 .00 .000 .0 0
4 70.0 70.0 480.0 33.00 .000 .0 0

Chapter 9 - Shallow Failure Analysis
9-23
This limits the circular surfacesfrom being generated below thevegetative layer.
NON-LINEAR MOHR-COULOMB envelope has been specified for 1 soil(s)
Soil Unit # 3
PointNo.
Normal Stress(psf)
ShearStress(psf)
1 .0 .0
2 288.0 275.0
3 576.0 300.0
4 1440.0 350.0
------------------------------------------------------------- BOUNDARIES THAT LIMIT SURFACE GENERATION HAVE BEEN SPECIFIED -------------------------------------------------------------
LOWER limiting boundary of 1 segments:
SegmentNo.
x-left(ft)
y-left(ft)
x-right(ft)
y-right(ft)
1 100.0 98.5 280.0 158.5
A critical failure surface searching method, using a random technique for generating CIRCULAR surfaces has been specified.
2500 trial surfaces will be generated and analyzed.
50 Surfaces initiate from each of 50 points equally spaced along the ground surface between x = 160.0 ft and x = 180.0 ft
Each surface terminates between x = 220.0 ft and x = 230.0 ft
Unless further limitations were imposed, the minimum elevation at which a surface extends is y = .0 ft
* * * * * DEFAULT SEGMENT LENGTH SELECTED BYXSTABL * * * * *
3.0 ft line segments define each trial failuresurface.

Chapter 9 - Shallow Failure Analysis
9-24
--------------------- ANGULAR RESTRICTIONS ---------------------
The first segment of each failure surface will be inclined within the angular rangedefined by :
Lower angular limit := -45.0 degrees Upper angular limit := (slope angle - 5.0) degrees
Factors of safety have been calculated by the :
* * * * * SIMPLIFIED BISHOP METHOD * * * * *
The most critical circular failure surface is specified by 19 coordinate points
Point x-surf y-surf
No. (ft) (ft)
1 174.69 125.08
2 177.57 125.93
3 180.44 126.81
4 183.29 127.73
5 186.14 128.68
6 188.98 129.65
7 191.80 130.66
8 194.62 131.70
9 197.42 132.77
10 200.21 133.87
11 202.99 135.00
12 205.76 136.16
13 208.51 137.35
14 211.25 138.57
15 213.98 139.81
16 216.69 141.09
17 219.39 142.40
18 222.08 143.74
19 224.10 144.77
**** Simplified BISHOP FOS = 1.509 ****
Chapter 9 - Shallow Failure Analysis
9-25
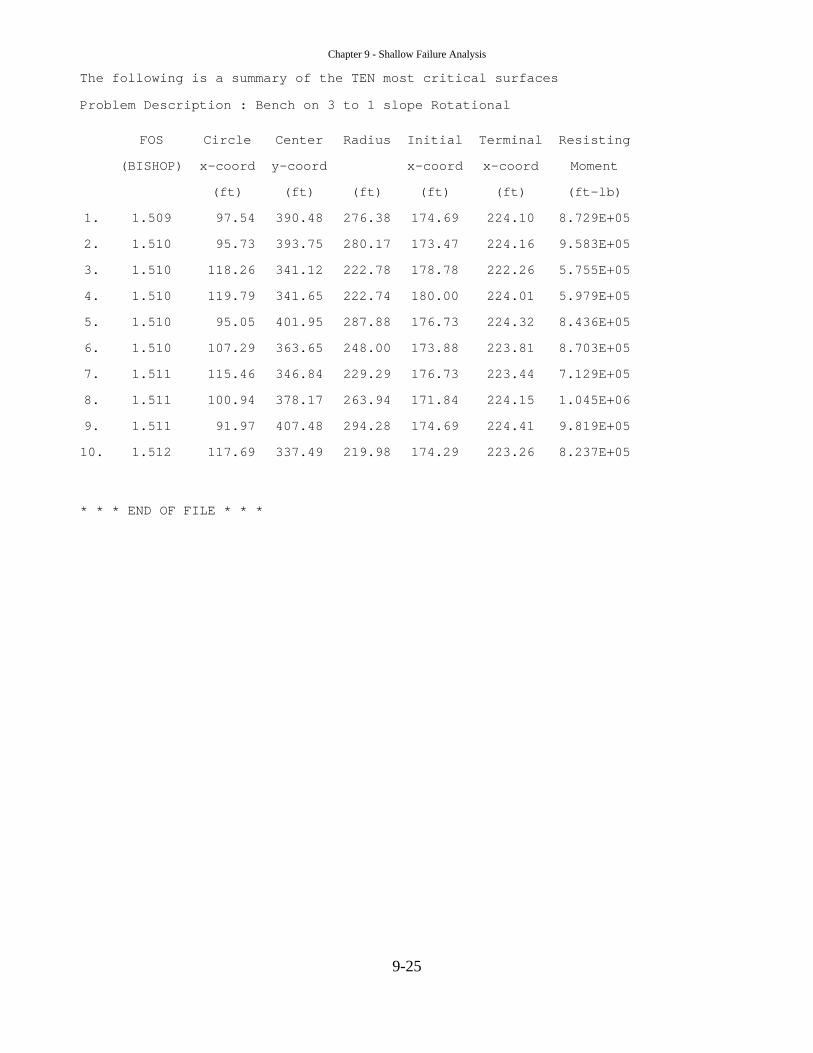
The following is a summary of the TEN most critical surfaces
Problem Description : Bench on 3 to 1 slope Rotational
FOS Circle Center Radius Initial Terminal Resisting
(BISHOP) x-coord y-coord x-coord x-coord Moment
(ft) (ft) (ft) (ft) (ft) (ft-lb)
1. 1.509 97.54 390.48 276.38 174.69 224.10 8.729E+05
2. 1.510 95.73 393.75 280.17 173.47 224.16 9.583E+05
3. 1.510 118.26 341.12 222.78 178.78 222.26 5.755E+05
4. 1.510 119.79 341.65 222.74 180.00 224.01 5.979E+05
5. 1.510 95.05 401.95 287.88 176.73 224.32 8.436E+05
6. 1.510 107.29 363.65 248.00 173.88 223.81 8.703E+05
7. 1.511 115.46 346.84 229.29 176.73 223.44 7.129E+05
8. 1.511 100.94 378.17 263.94 171.84 224.15 1.045E+06
9. 1.511 91.97 407.48 294.28 174.69 224.41 9.819E+05
10. 1.512 117.69 337.49 219.98 174.29 223.26 8.237E+05
* * * END OF FILE * * *
Chapter 9 - Shallow Failure Analysis
9-26
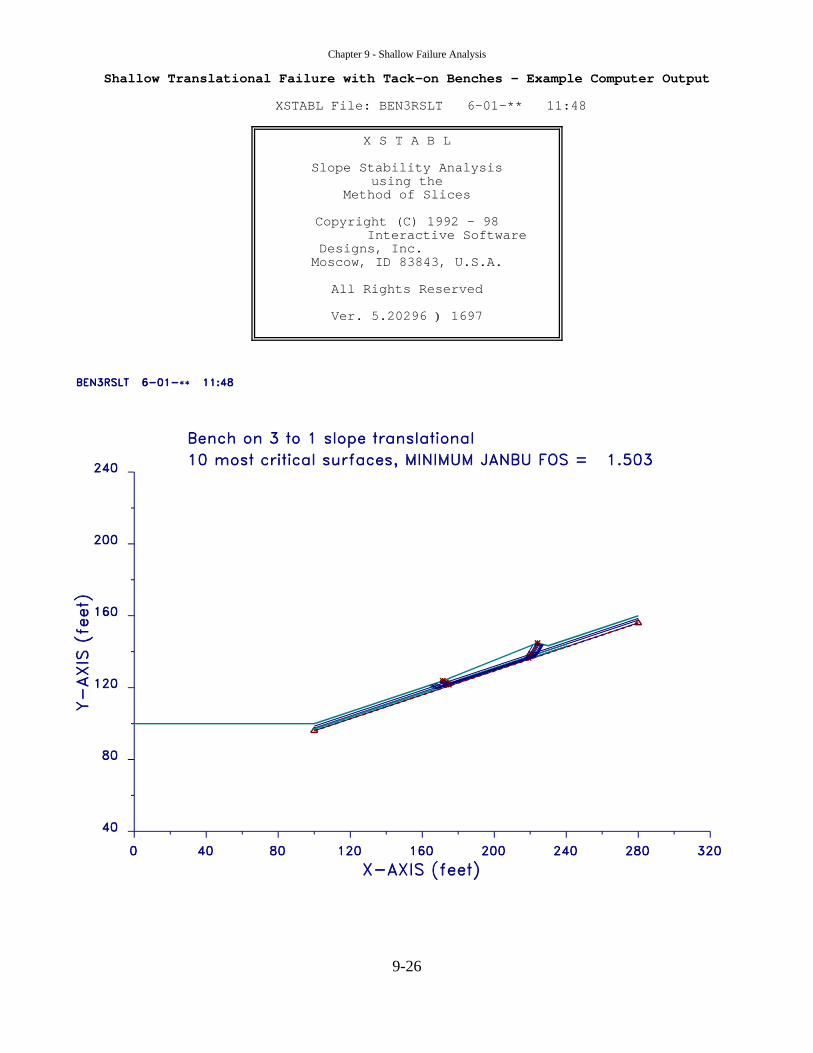
Shallow Translational Failure with Tack-on Benches - Example Computer Output
XSTABL File: BEN3RSLT 6-01-** 11:48
X S T A B L
Slope Stability Analysisusing the
Method of Slices
Copyright (C) 1992 - 98 Interactive Software
Designs, Inc. Moscow, ID 83843, U.S.A.
All Rights Reserved
Ver. 5.20296 ) 1697
Chapter 9 - Shallow Failure Analysis
9-27
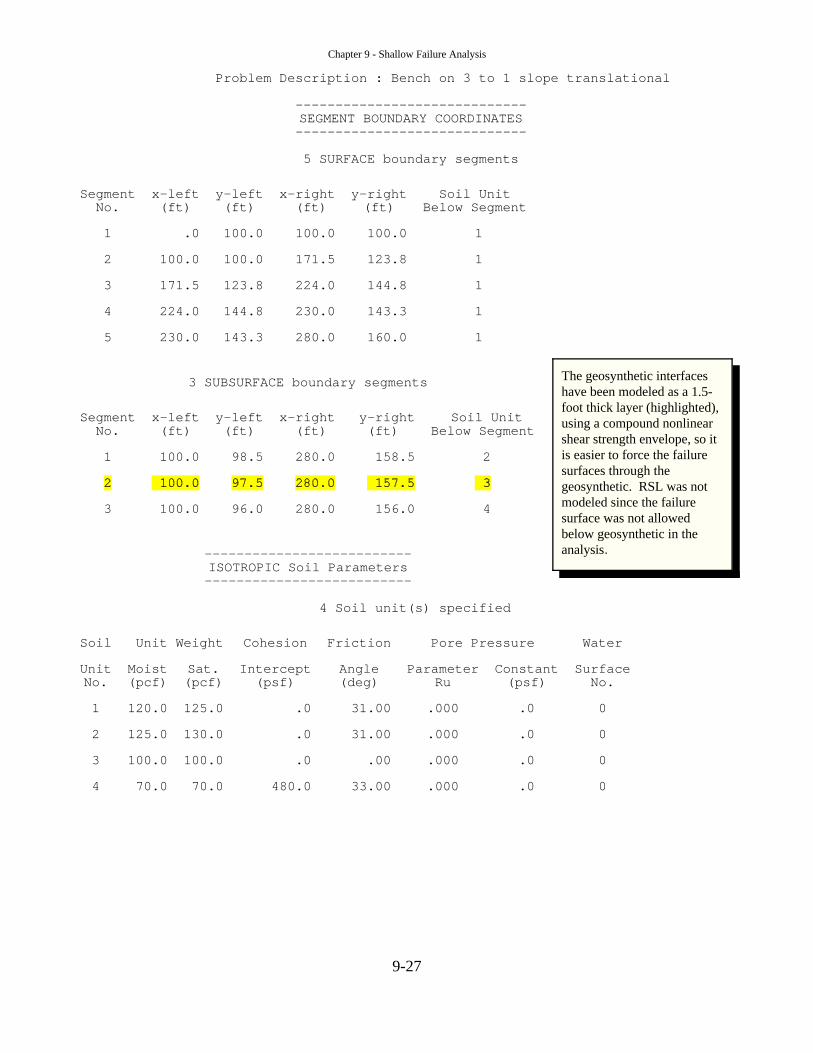
Problem Description : Bench on 3 to 1 slope translational
----------------------------- SEGMENT BOUNDARY COORDINATES -----------------------------
5 SURFACE boundary segments
SegmentNo.
x-left(ft)
y-left(ft)
x-right (ft)
y-right(ft)
Soil UnitBelow Segment
1 .0 100.0 100.0 100.0 1
2 100.0 100.0 171.5 123.8 1
3 171.5 123.8 224.0 144.8 1
4 224.0 144.8 230.0 143.3 1
5 230.0 143.3 280.0 160.0 1
3 SUBSURFACE boundary segments
SegmentNo.
x-left(ft)
y-left(ft)
x-right (ft)
y-right(ft)
Soil UnitBelow Segment
1 100.0 98.5 280.0 158.5 2
3 100.0 96.0 280.0 156.0 4
-------------------------- ISOTROPIC Soil Parameters --------------------------
4 Soil unit(s) specified
Soil Unit Weight Cohesion Friction Pore Pressure Water
UnitNo.
Moist(pcf)
Sat.(pcf)
Intercept(psf)
Angle(deg)
ParameterRu
Constant(psf)
SurfaceNo.
1 120.0 125.0 .0 31.00 .000 .0 0
2 125.0 130.0 .0 31.00 .000 .0 0
3 100.0 100.0 .0 .00 .000 .0 0
4 70.0 70.0 480.0 33.00 .000 .0 0
The geosynthetic interfaceshave been modeled as a 1.5-foot thick layer (highlighted),using a compound nonlinearshear strength envelope, so itis easier to force the failuresurfaces through thegeosynthetic. RSL was notmodeled since the failuresurface was not allowedbelow geosynthetic in theanalysis.

Chapter 9 - Shallow Failure Analysis
9-28
The normal stresses chosen for soil unit #3 bracketthe normal stresses expected after construction ofthe bench. The shear stresses are the minimumshear strengths the materials in the cap system willneed to exhibit during conformance testing prior toconstruction.
Search boxes have been chosen so therandomly generated failure surfacesremain mostly within the layerrepresenting the geosynthetic.
NON-LINEAR MOHR-COULOMB envelope has been specified for 1 soil(s)
Soil Unit # 3
Point Normal Stress Shear Stress
No. (psf) (psf)
1 .0 .0
2 288.0 215.0
3 576.0 275.0
4 1440.0 350.0
A critical failure surface searching method, using a random technique for generating sliding BLOCK surfaces, has been specified.
The active and passive portions of the sliding surfaces are generated according to the Rankine theory.
2500 trial surfaces will be generated and analyzed.
2 boxes specified for generation of central block base
* * * * * DEFAULT SEGMENT LENGTH SELECTED BY XSTABL * * * * *
Length of line segments for active and passive portions of sliding block is 13.0 ft
Box x-left y-left x-right y-right Width
no. (ft) (ft) (ft) (ft) (ft)
1 102.0 97.5 175.0 122.0 .5
2 181.3 124.3 240.0 143.6 1.0
Chapter 9 - Shallow Failure Analysis
9-29
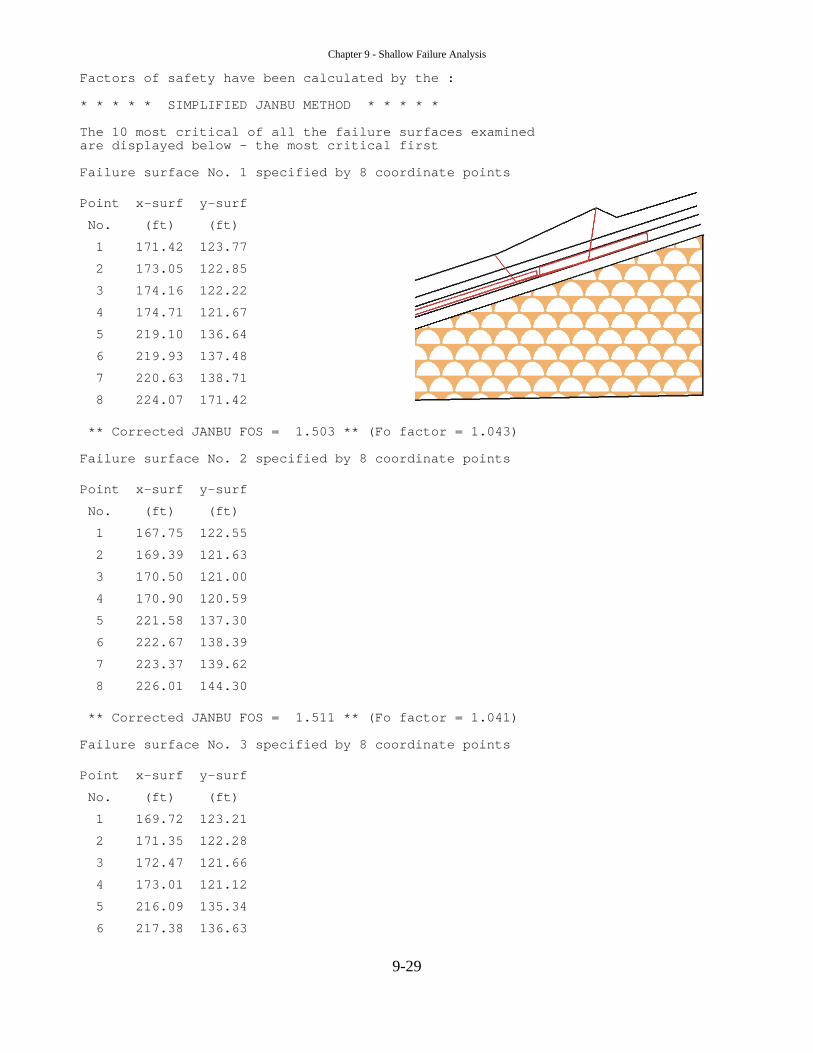
Factors of safety have been calculated by the :
* * * * * SIMPLIFIED JANBU METHOD * * * * *
The 10 most critical of all the failure surfaces examined are displayed below - the most critical first
Failure surface No. 1 specified by 8 coordinate points
Point x-surf y-surf
No. (ft) (ft)
1 171.42 123.77
2 173.05 122.85
3 174.16 122.22
4 174.71 121.67
5 219.10 136.64
6 219.93 137.48
7 220.63 138.71
8 224.07 171.42
** Corrected JANBU FOS = 1.503 ** (Fo factor = 1.043)
Failure surface No. 2 specified by 8 coordinate points
Point x-surf y-surf
No. (ft) (ft)
1 167.75 122.55
2 169.39 121.63
3 170.50 121.00
4 170.90 120.59
5 221.58 137.30
6 222.67 138.39
7 223.37 139.62
8 226.01 144.30
** Corrected JANBU FOS = 1.511 ** (Fo factor = 1.041)
Failure surface No. 3 specified by 8 coordinate points
Point x-surf y-surf
No. (ft) (ft)
1 169.72 123.21
2 171.35 122.28
3 172.47 121.66
4 173.01 121.12
5 216.09 135.34
6 217.38 136.63

Chapter 9 - Shallow Failure Analysis
9-30
7 218.08 137.86
8 221.42 143.77
** Corrected JANBU FOS = 1.511 ** (Fo factor = 1.045)
Failure surface No. 4 specified by 8 coordinate points
Point x-surf y-surf
No. (ft) (ft)
1 170.48 123.46
2 172.11 122.54
3 173.22 121.91
4 173.61 121.52
5 219.95 136.95
6 220.75 137.75
7 221.45 138.98
8 224.65 144.64
** Corrected JANBU FOS = 1.511 ** (Fo factor = 1.036)
Failure surface No. 5 specified by 8 coordinate points
Point x-surf y-surf
No. (ft) (ft)
1 166.80 122.24
2 168.44 121.31
3 169.55 120.68
4 169.84 120.39
5 221.92 137.18
6 223.37 138.62
7 224.07 139.86
8 226.51 144.17
** Corrected JANBU FOS = 1.515 ** (Fo factor = 1.035)
Failure surface No. 6 specified by 8 coordinate points
Point x-surf y-surf
No. (ft) (ft)
1 165.49 121.80
2 167.13 120.88
3 168.24 120.25
4 168.74 119.74
5 222.78 137.49
6 224.19 138.90

Chapter 9 - Shallow Failure Analysis
9-31
7 224.88 140.13
8 227.09 144.03
** Corrected JANBU FOS = 1.516 ** (Fo factor = 1.032)
Failure surface No. 7 specified by 8 coordinate points
Point x-surf y-surf
No. (ft) (ft)
1 170.32 123.41
2 171.95 122.48
3 173.06 121.85
4 173.26 121.66
5 217.82 135.95
6 219.06 137.19
7 219.75 138.42
8 223.18 144.47
** Corrected JANBU FOS = 1.520 ** (Fo factor = 1.044)
Failure surface No. 8 specified by 8 coordinate points
Point x-surf y-surf
No. (ft) (ft)
1 164.30 121.40
2 165.93 120.48
3 167.04 119.85
4 167.51 119.38
5 220.37 136.89
6 221.47 137.99
7 222.16 139.22
8 225.16 144.51
** Corrected JANBU FOS = 1.522 ** (Fo factor = 1.037)
Failure surface No. 9 specified by 8 coordinate points
Point x-surf y-surf
No. (ft) (ft)
1 165.26 121.72
2 166.89 120.80
3 168.01 120.17
4 168.47 119.71
5 222.99 137.56
6 224.39 138.96

Chapter 9 - Shallow Failure Analysis
9-32
7 225.09 140.20
8 227.23 143.99
** Corrected JANBU FOS = 1.523 ** (Fo factor = 1.034)
Failure surface No.10 specified by 8 coordinate points
Point x-surf y-surf
No. (ft) (ft)
1 171.68 123.87
2 173.32 122.94
3 174.44 122.31
4 174.81 121.94
5 222.87 137.98
6 223.59 138.70
7 224.29 139.93
8 226.67 144.13
** Corrected JANBU FOS = 1.524 ** (Fo factor = 1.032)
The following is a summary of the TEN most critical surfaces
Problem Description : Bench on 3 to 1 slope translational Modified Correction Initial Terminal Available
JANBU FOS Factor x-coord(ft)
x-coord(ft)
Strength(lb)
1. 1.503 1.043 171.42 224.07 1.414E+04
2. 1.511 1.036 167.75 226.01 1.571E+04
3. 1.511 1.045 169.72 221.42 1.381E+04
4. 1.511 1.041 170.48 224.65 1.445E+04
5. 1.515 1.035 166.80 226.51 1.613E+04
6. 1.516 1.032 165.49 227.09 1.677E+04
7. 1.520 1.045 170.32 223.18 1.394E+04
8. 1.522 1.037 164.30 225.16 1.628E+04
9. 1.523 1.032 165.26 227.23 1.682E+04
10. 1.524 1.034 171.68 226.67 1.485E+04
* * * END OF FILE * * *

Chapter 9 - Shallow Failure Analysis
9-33
REFERENCES
Eid, H. T., Stark, T. D., Evans, W. D., and Sherry, P., 2000, "Municipal Solid Waste Landfill SlopeFailure I: Foundation and Waste Properties," Journal of Geotechnical and GeoenvironmentalEngineering, ASCE, Vol. 126, No. 5, pp. 397 - 407.
Fox, P. J., Rowland, M. G., and Scheithe, J. R. (1998). “Internal shear strength of three geosynthetic clayliners,” Journal of Geotechnical and Geoenvironmental Engineering, Vol. 124, No. 10, pp. 933-944.
Fox, P. J., Stark, T. D., and Swan, Jr. R. H. (2004). “Laboratory measurement of GCL shear strength,”Advances in Geosynthetic Clay Liner Technology: 2nd Symposium, STP 1456, Mackey, R. E. and vonMaubeuge, K., eds., ASTM International, West Conshohocken, Pennsylvania, U.S.A, in press.
Gilbert, R. B., Scranton, H. B., and Daniel, D. E. (1997). “Shear strength testing for geosynthetic clayliners,” Testing and Acceptance Criteria for Geosynthetic Clay Liners, STP 1308, L. W. Well, ed.,ASTM International, West Conshohocken, Pennsylvania, U.S.A, pp. 121-135.
Gilbert, R. B., 2001 , “Peak versus Residual Strength for Waste Containment Systems,” Proceedings ofthe 15th GRI Conference on Hot Topics in Geosynthetics - II (Peak/Residual; RECMs; InstallationConcerns, December 13 - 14.
Giroud, J. P., Bachus, R. C. and Bonaparte, R., 1995, “Influence of Water Flow on the Stability ofGeosynthetic-Soil Layered Systems on Slopes,” Geosynthetics International, Vol. 2, No. 6, pp. 1149 -1180.
Giroud, J. P., Zhao, A., and Richardson, G. N., 2000, “Effect of Thickness Reduction on GeosyntheticHydraulic Transmissivity,” Geosynthetic International, Vol. 7, Nos. 4 - 5.
Giroud, J. P., Zornberg, J. G., and Zhao, A., 2000, “Hydraulic Design of Geosynthetic and GranularLiquid Collection Layers,” Geosynthetic International, Vol. 7, Nos. 4 - 5.
Huff, F. A., and Angle, J. R., 1992, “Rainfall Frequency Atlas of the Midwest. Illinois State WaterSurvey, Champaign, Bulletin 71.
Koerner, R. M., 1997, Designing with Geosynthetics, 4th Edition, Prentice Hall Publ. Co., NY.
Koerner, R. M., and Daniel, D. E., 1997, “Final Covers for Solid Waste Landfills and AbandonedDumps,” ASCE Press, New York.
Matasovic, N., 1991, “Selection of Method for Seismic Slope Stability Analysis,” Second InternationalConference on Recent Advances in Geotechnical Earthquake Engineering and Soil Dynamics, March 11-15, St. Louis, Missouri, Paper 7.20, pp. 1057 - 1062.
Richardson, G. N., and Zhao, A., 1999, Design of Lateral Drainage Systems for Landfills.

Chapter 9 - Shallow Failure Analysis
9-34
Singh, S. and Sun, J. I., 1995, "Seismic Evaluation of Municipal Solid Waste Landfills," Proc. Geoenvironment 2000, ASCE Speciality Conference, New Orleans, Louisiana, February 22 - 24. pp.1081 - 1096.
Soong, T. Y. and Koerner, R. M., 1997, “The Design of Drainage Systems over Geosynthetically LinedSlopes,” GRI Report #19.
Stark, T. D., Eid, H. T., Evans, W. D., and Sherry, P., 2000, "Municipal Solid Waste Landfill SlopeFailure II: Stability Analyses," Journal of Geotechnical and Geoenvironmental Engrg., ASCE, Vol. 126,No. 5, pp. 408 - 419.
Thiel, R., 2001, “Peak vs Residual Shear Strength for Landfill Bottom Liner Stability Analyses,”Proceedings of the 15th GRI Conference on Hot Topics in Geosynthetics - II (Peak/Residual; RECMs;Installation Concerns, December 13 - 14.
Thiel, R .S., and Stewart, M. G., 1993, “Geosynthetic Landfill Cover Design Methodology andConstruction Experience in the Pacific Northwest,” Geosynthetics ‘93 Conference Proceedings, IFAI, St. Paul, Minnesota, pp. 1131 - 1144.
Triplett, E. J. and Fox, P. J. (2001). “Shear strength of HDPE geomembrane/geosynthetic clay linerinterfaces,” Journal of Geotechnical and Geoenvironmental Engineering, Vol. 127, No. 6, pp. 543-552.
United States Environmental Protection Agency, Office of Research and Development, April 1995,EPA/600/R-95/051, RCRA Subtitle D (258) “Seismic Design Guidance for Municipal Solid WasteLandfill Facilities.” Available as of the writing of this policy at www.epa.gov/clhtml/pubtitle.html on theU.S. EPA Web site.
United States Environmental Protection Agency, Solid Waste and Emergency Response (5305),November 1993, revised April 1998, EPA530-R-93-017, Solid Waste Disposal Facility Criteria,Technical Manual.
United States Geological Survey, 1996, National Seismic Hazard Mapping Project, “Peak Acceleration(%g) with 2% Probability of Exceedance in 50 Years (site: NEHRP B-C boundary).”