chapter-9 details of select bank mergers and...
TRANSCRIPT

302
CHAPTER-9
DETAILS OF SELECT BANK MERGERS AND ACQUISITIONS DURING THE
PERIOD 2005-2006 TO 2013-2014.
This section analyzes the performance of select acquisitions that took place during the period
2005-2006 to 2013-2014 using the renowned CAMEL Model Framework. In this section an
analysis is taken up of the pre-merger versus post-merger performance of banks that have
undergone mergers or acquisitions during the period 2005-2006 to 2013-2014. The pre-merger
and post-merger period consists of a period of 5 years before and 5 after the merger respectively.
There are four deals analyzed during the above mentioned period. The deals that are analyzed in
this section are listed in TABLE NO: 9.1below.
TABLE NO: 9.1: SELECT ACQUISITIONS THAT TOOK PLACE DURING THE
PERIOD 2005-2006 TO 2013-2014.
Acquirer Bank Target Bank Year
1 ICICI Bank Ltd The Bank of Rajasthan August-2010
2 HDFC Bank Ltd. Centurion Bank of Punjab Limited May-2008
3 Indian Overseas Bank Bharat Overseas Bank Limited March-2007
4 IDBI Bank United Western Bank Limited October-2006

303
9.1 ICICI BANK ACQUIRES BANK OF RAJASTHAN:
Type of merger: Voluntary Merger.
Year of merger: 2010-2011.
Brief Details of the acquirer bank- ICICI Bank:
ICICI Bank is an Indian multinational banking and financial services company headquartered
in Mumbai, Maharashtra. As of 2014 it is the second largest bank in India in terms of assets
and market capitalization. ICICI is India’s fastest growing financial conglomerate. It was formed
in 1955 at the scheme of the Government of India, the World Bank, and representatives of Indian
industry with the basic objective of being a universal bank providing medium-term and long-
term project funding to Indian business houses. ICICI Group offers a wide range of banking
products and financial services to corporate and retail customers through a range of delivery
channels through its specialized group companies, subsidiaries and affiliates. With a strong
customer focus, the ICICI Group Companies have maintained and enhanced their leadership
position in their respective sectors. ICICI Bank was established by the Industrial Credit and
Investment Corporation of India (ICICI), an Indian financial institution, as a wholly owned
subsidiary in 1994. The bank was registered as a banking company in January 1994 and received
its banking license in May 1994. The bank was initially known as the Industrial Credit and
Investment Corporation of India Bank, before it changed its name to the abbreviated ICICI Bank.
The parent company was later merged with the bank.
ICICI Bank is the largest private sector bank and second largest bank in India. Its growth as a
banking company knew no boundaries and in a very short span of time it came to be recognized
as the largest private sector bank in the country. ICICI Bank’s equity shares are listed in India on
Bombay Stock Exchange and the National Stock Exchange of India Limited and its American
Depositary Receipts (ADRs) are listed on the New York Stock Exchange (NYSE).In fact it was
the first Indian bank to be listed on the New York Stock Exchange. The bank has a branch
network of more than 3800 branches and 12000 ATMs in India and presence in 18 countries.
ICICI Bank offers a wide variety of banking products and financial services with specific focus
304
on Retail Banking and Corporate Banking. It caters to the needs of millions of customers in the
areas of investment banking, internet banking, rural and agricultural banking, life and non-life
insurance, venture capital and asset management. ICICI Bank is also the largest issuer of credit
cards in India. The Bank is one of the Big Four banks of India and has subsidiaries and
representative offices in several countries out of India. The Bank follows a voluntary code,
which sets minimum standards of banking practices when they are dealing with individual
customers. The bank always strives to be the leading provider of financial services in India and a
major global bank. The bank leverages their people, technology, speed and financial capital to
be the banker of first choice for customers by delivering high quality, world-class products and
services, expand the frontiers of their business globally, play a proactive role in the full
realization of India’s potential and maintain high standards of governance and ethics whilst
creating value for their stakeholders.
Merger Highlights:
The deal was a stock for stock deal with swap ratio of 25 ICICI shares for 118 Bank of
Rajasthan shares (1: 4.72). This swap ratio seemed to be higher than the market price related
swap ratio of 1:9. This in effect translated into a 90 percent premium to market price at the
time of the deal.
For ICICI Bank it was a strategic move towards enhancing its presence in India and a
direction towards Universal Banking. The proposed deal with bank of Rajasthan would add
to ICICI’s existing network into the northern and western parts of India.
For The Bank of Rajasthan, on the basis of information gathered through the scrutiny and
other investigations, the regulators comprehended that there were many occasions when the
promoters of Bank of Rajasthan did not act in the interest of the organization or of the
shareholders, due to which the growth of the bank was negative and the bank was plunging
further. In an attempt to take control of the situation, SEBI, issued a restrain order against the
promoters on trading in the securities market. RBI took control of the situation and issued an
order to The Bank of Rajasthan to either stop its banking business or merge with a bank.

305
ICICI Bank came at the right time to bail out Bank of Rajasthan and for The bank of
Rajasthan the deal was a wealth maximization proposition for the shareholders and all the
other stakeholders.
The merger of ICICI Bank and Bank of Rajasthan enhanced the network of the combined
entity to approximately 2,463 (25% increase in ICICI Bank’s then branch network) further
strengthening its position as largest private sector bank by branches. This enhanced branch
network would facilitate ICICI Bank to enter a new growth phase in future. This was of key
importance, considering that ICICI had moved to a branch-led business model.
Bank of Rajasthan had a significantly strong presence in the northern states like Rajasthan,
Punjab, Haryana and Delhi (73% of total branches in these states). The merger definitely
built up ICICI Bank’s presence in those areas.
The merger benefits to ICICI were expected to be primarily related to funding, as it would be
able to leverage Bank of Rajasthan’s network of 463 branches and its low cost deposit base
of 27% of total deposits. Nearly 60% of Bank of Rajasthan’s branches were in metro and
urban areas, which would help ICICI, build its deposit franchise. The acquisition also
enabled ICICI increase CASA (current and savings account) flows as well as helped in cross-
selling products. With more than 2,500 branches, ICICI Bank would race over its nearest
private sector rival, HDFC Bank, which had 1,725 branches in 2010.

306
Pre-Merger and Post-Merger Performance Evaluation of ICICI Bank:
TABLE NO: 9.2: ICICI BANK – PRE-MERGER VERSUS POST-MERGER
PERFORMANCE EVALUATION ON THE BASIS OF CAMEL RATIO.
Ratios Pre-Merger
(2005-2006 to 2009-
2010)
Post-Merger
(2011-2012 to
2014-2015)
Capital Adequacy
Capital Adequacy Ratio 16.30 18.78
Debt-Equity Ratio 1.70 2.20
Total Advances to Total Assets Ratio 0.54 0.55
Government Securities to Total Investment Ratio 0.62 0.54
Asset Quality
Net NPA to Net Advances 1.92 0.82
Total Investment to Total Asset Ratio 0.29 0.31
Management Efficiency
Expenditure to Income Ratio 0.76 0.72
Total Advances to Total Deposits Ratio 0.94 0.99
Assets Turnover Ratio 0.10 0.09
Profit Per Employee ( In INR’000) 0.11 0.13
Business per Employee (In INR ‘000) 10.63 7.30
Earnings Efficiency
Net Profit Margin 0.10 0.17
Return on Equity 0.08 0.12
Net Interest Margin 2.23 2.70
Interest Spread 7.09 7.54
Interest Income to Total Income Ratio 0.78 0.82
Liquidity
Cash to Deposit 0.21 0.21
Government Securities to Total Assets Ratio 0.18 0.17
Investment to Deposit ratio 0.51 0.58
Interest Expended to Interest Earned 0.72 0.65
307
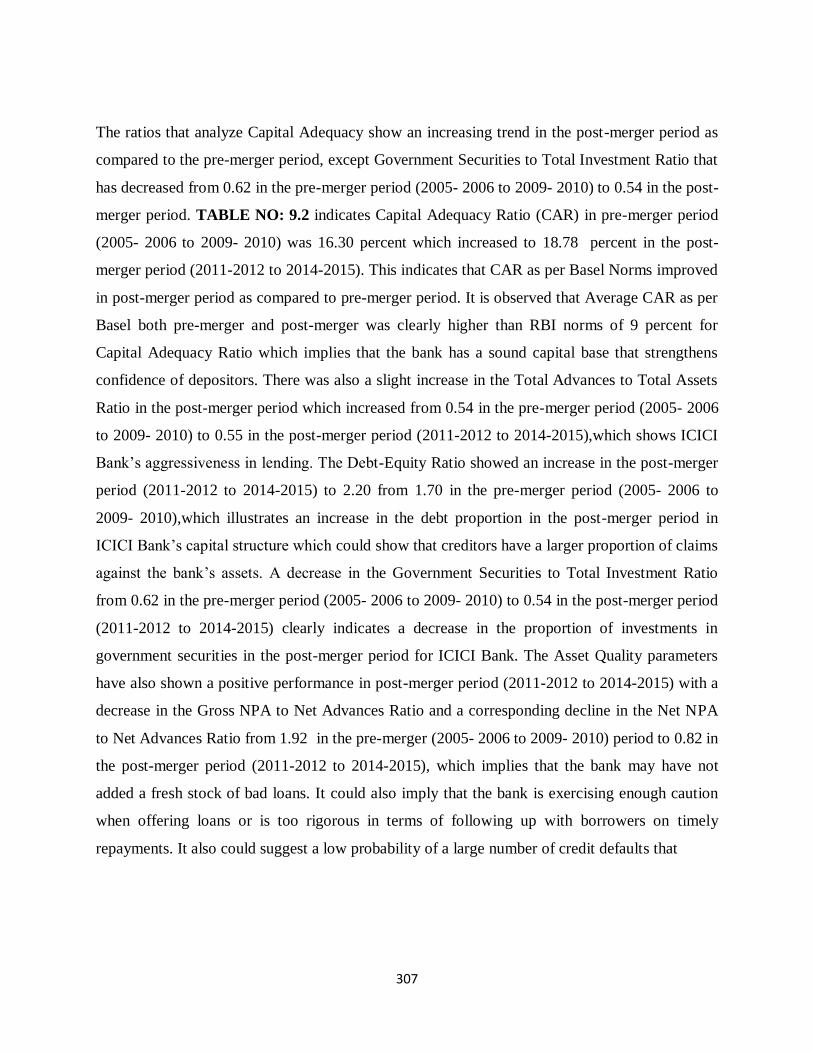
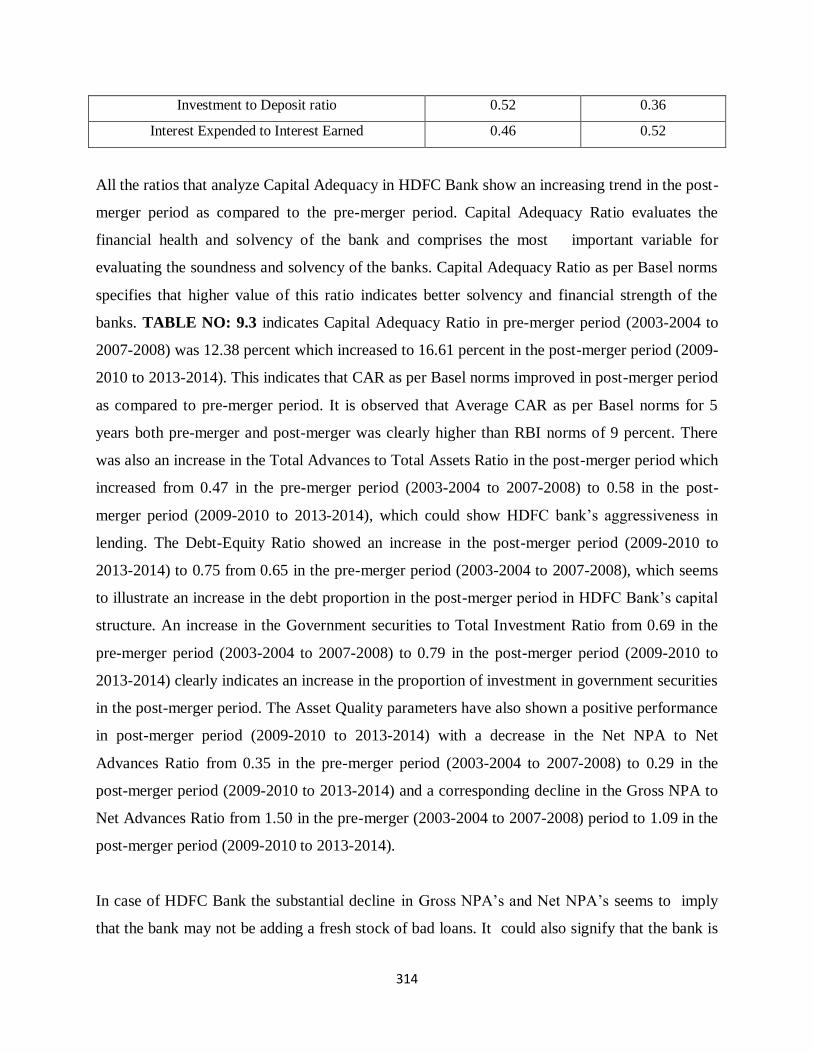
The ratios that analyze Capital Adequacy show an increasing trend in the post-merger period as
compared to the pre-merger period, except Government Securities to Total Investment Ratio that
has decreased from 0.62 in the pre-merger period (2005- 2006 to 2009- 2010) to 0.54 in the post-
merger period. TABLE NO: 9.2 indicates Capital Adequacy Ratio (CAR) in pre-merger period
(2005- 2006 to 2009- 2010) was 16.30 percent which increased to 18.78 percent in the post-
merger period (2011-2012 to 2014-2015). This indicates that CAR as per Basel Norms improved
in post-merger period as compared to pre-merger period. It is observed that Average CAR as per
Basel both pre-merger and post-merger was clearly higher than RBI norms of 9 percent for
Capital Adequacy Ratio which implies that the bank has a sound capital base that strengthens
confidence of depositors. There was also a slight increase in the Total Advances to Total Assets
Ratio in the post-merger period which increased from 0.54 in the pre-merger period (2005- 2006
to 2009- 2010) to 0.55 in the post-merger period (2011-2012 to 2014-2015),which shows ICICI
Bank’s aggressiveness in lending. The Debt-Equity Ratio showed an increase in the post-merger
period (2011-2012 to 2014-2015) to 2.20 from 1.70 in the pre-merger period (2005- 2006 to
2009- 2010),which illustrates an increase in the debt proportion in the post-merger period in
ICICI Bank’s capital structure which could show that creditors have a larger proportion of claims
against the bank’s assets. A decrease in the Government Securities to Total Investment Ratio
from 0.62 in the pre-merger period (2005- 2006 to 2009- 2010) to 0.54 in the post-merger period
(2011-2012 to 2014-2015) clearly indicates a decrease in the proportion of investments in
government securities in the post-merger period for ICICI Bank. The Asset Quality parameters
have also shown a positive performance in post-merger period (2011-2012 to 2014-2015) with a
decrease in the Gross NPA to Net Advances Ratio and a corresponding decline in the Net NPA
to Net Advances Ratio from 1.92 in the pre-merger (2005- 2006 to 2009- 2010) period to 0.82 in
the post-merger period (2011-2012 to 2014-2015), which implies that the bank may have not
added a fresh stock of bad loans. It could also imply that the bank is exercising enough caution
when offering loans or is too rigorous in terms of following up with borrowers on timely
repayments. It also could suggest a low probability of a large number of credit defaults that

308
affect the profitability and net-worth of banks and also wear down the value of the asset.
A look at all the Management Efficiency Parameters also show a positive increase in the post-
merger performance except with the Business per Employee which has decreased from 10.63 in
the pre-merger period (2005- 2006 to 2009- 2010) to 7.30 in the post-merger period (2011-2012
to 2014-2015). This decrease could be due to the increase in the staff and employees of Bank of
Rajasthan who are now a part of ICICI banks employee team, which could have led to an
increase in number of employees without a corresponding increase in revenues of ICICI Bank
with the addition of revenues of Bank of Rajasthan. In TABLE NO: 9.2, all the other parameters
also showed an increasing trend which demonstrated that ICICI Bank has shown significant
increase in their Management Efficiency in the post-merger period (2011-2012 to 2014-2015),
especially the Advances to Deposit Ratio that has shown a substantial increase from 0.94 in pre-
merger period (2005- 2006 to 2009- 2010) to 0.99 in the post-merger period (2011-2012 to
2014-2015). Higher ratio reflects ability of the bank to make optimal use of the available
resources. The ratio has increased for ICICI Bank post-merger which could imply ability of
ICICI banks management in converting the deposits available with the banks (excluding other
funds like equity capital, etc.) into high earning advances. The decline in the Total Expenditure
to Total Income Ratio from 0.76 in the pre-merger period to 0.72 in the post-merger period could
illustrate that the bank has been successful in managing its expenditure which has increased with
the addition of expenditure of Bank of Rajasthan’s, however despite this increase there has been
a decline in the Total Expenditure to Total Income Ratio, which could imply that the combined
bank has been able to maintain a high standard of Management Efficiency and capability.
The Earnings Quality has also shown a positive increase in all the parameters of Earnings
Quality. Net Profit Margin Ratio has shown a steep increase from 0.10 in the pre-merger period
to 0.17 in the post-merger period (2011-2012 to 2014-2015), which signals that the bank has
been very efficient in managing its revenues and expenses in the post-merger period, the increase
in Net Profit Margin is also reflected in its Return to Equity Ratio which has increased to 0.12 in
the post-merger period (2011-2012 to 2014-2015). Equity shareholders are the real owners of the
309
company. They assume the highest risk in the company. Thus they are more interested in the
profitability of the company. For ICICI Bank, since the ratio has increased post-merger may
imply a higher payment of dividend and a larger share in the residual profits thus increasing the
attractiveness of investments for the present and the prospective shareholders. A look at the Net
Interest Margin and Interest Spread also show an increase in the post-merger period. A high
ratio seems to indicate efficient management of assets employed for earning by ICICI Bank. It
can also be assumed due to increasing Net Interest Margin that the bank will not come under
pressure by offering preferential rates to its customers.
The Liquidity Parameters signal that there has not been any change in the Cash to Deposit Ratio
in the pre-merger (2005- 2006 to 2009- 2010) versus the post-merger period (2011-2012 to 2014-
2015)as well as in the Government Securities to Total Asset Ratio, which has in fact slightly
decreased from 0.18 in the pre-merger period (2005- 2006 to 2009- 2010) to 0.17 in the post-
merger period (2011-2012 to 2014-2015), which could indicate that the Bank is now seeking for
high return seeking channels of investment so as to increase its non-interest income. The positive
effect of this ratio is also seen in the Net Profit Margin ratio and Return on Equity that has
improved in the post-merger period (2011-2012 to 2014-2015). There has been a significant
increase in the Investment to Deposit Ratio from 0.51 in the pre-merger period (2005- 2006 to
2009- 2010) to 0.58 in the post-merger period (2011-2012 to 2014-2015)which could
demonstrate that ICICI Bank is very successful in meeting the short term obligations of its
depositors and is highly liquid with an increasing amount of Deposits being routed into sound
investments, this also safeguards the interest of the depositors.
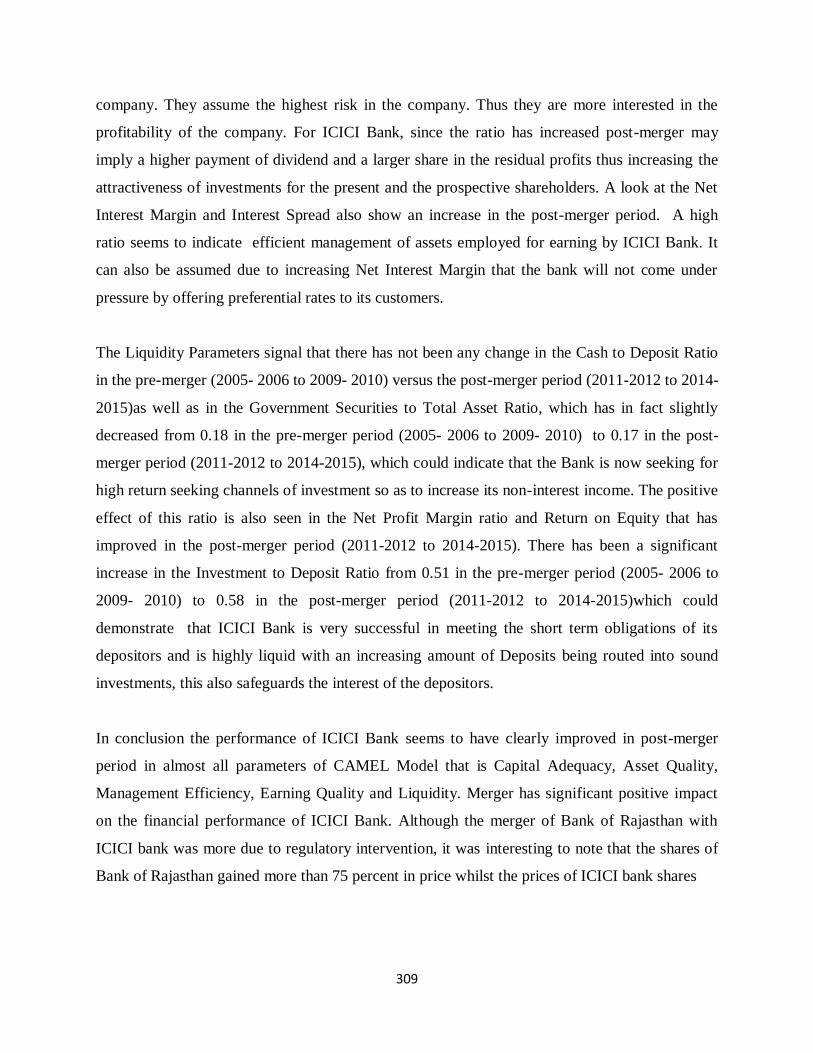
In conclusion the performance of ICICI Bank seems to have clearly improved in post-merger
period in almost all parameters of CAMEL Model that is Capital Adequacy, Asset Quality,
Management Efficiency, Earning Quality and Liquidity. Merger has significant positive impact
on the financial performance of ICICI Bank. Although the merger of Bank of Rajasthan with
ICICI bank was more due to regulatory intervention, it was interesting to note that the shares of
Bank of Rajasthan gained more than 75 percent in price whilst the prices of ICICI bank shares

310
soared. Although the merger was not among two equal banks, the deal brought good returns to
stakeholders of both the banks. In conclusion, ICICI bank has been positively affected by the
event of acquisitions of Bank of Rajasthan. The merger was a move towards consolidation in the
Indian Banking industry. The markets did react positively to the merger as it bought strategically
positive deliverables to both the merging entities especially ICICI Bank.
9.2 HDFC BANK ACQUIRES CENTURION BANK OF PUNJAB:
Type of merger: Voluntary Merger.
Year of merger: 2008-2009.
Brief Details of the acquirer bank- HDFC Bank Limited (HDFC)
The Housing Development Finance Corporation Limited (HDFC) was initially established and
incorporated in 1977 as India's premier housing finance company. It enjoys a flawless track
record in India as well as in international markets. In August 1994,it was amongst the first to
receive an ‘in principle’ consent from the Reserve Bank of India (RBI) to set up a bank in the
private sector, as part of RBI’s liberalization of the Indian Banking Industry. This move incepted
a private sector bank in 1994 in the name of ‘HDFC Bank Limited. It is headquartered in
Mumbai. It commenced its operations as a Scheduled Commercial Bank in January 1995.
The Bank at present has a desirable network of over 3000 branches spread over more than 2000
cities across India. All branches are linked on an online real-time basis. The bank was also a
pioneer in setting up Telephone Banking and has more than 11000 ATM’s spread across the
country.It was the first bank in India to launch an International Debit Card in association with
VISA (VISA Electron) and issues the MasterCard Maestro debit card.
HDFC has developed significant expertise in retail mortgage loans to different market segments
and also has a large corporate client base for its housing related credit facilities. HDFC Bank has
always operated on a highly automated environment, be it in terms of information technology or
Communication systems. All the branches of the bank have an online connectivity with the each
other ensuring speedy funds transfer for the clients. At the same time, the bank's branch network

311
and Automated Teller Machines (ATMs) allow multi-branch access to retail clients. The bank
makes use of its up-to-date technology, along with market position and expertise, to create a
competitive advantage and build market share. With its experience in the financial markets, a
strong market reputation, large shareholder base and unique consumer franchise, HDFC was
ideally positioned to promote a bank in the Indian environment.
The shares are listed on the Bombay Stock Exchange Limited and The National Stock Exchange
of India Limited. The Bank's American Depository Shares ( ADS ) are listed on the New York
Stock Exchange (NYSE) under the symbol 'HDB' and the Bank's Global Depository Receipts
(GDRs) are listed on Luxembourg Stock Exchange.
HDFC Bank offers a wide range of commercial and transactional banking services and treasury
products to wholesale and retail customers. The bank has three key business segments:
Wholesale Banking Services - The Bank's target market ranges from large, blue-chip
manufacturing companies in the Indian corporate to small & mid-sized corporates and agri-based
businesses. Retail Banking Services - The objective of the Retail Bank is to provide its target
market customers a full range of financial products and banking services, giving the customer a
one-stop window for all banking requirements. Treasury - Within this business, the bank has
three main product areas - Foreign Exchange and Derivatives, Local Currency Money Market &
Debt Securities, and Equities. The Treasury business is responsible for managing the returns and
market risk on this investment portfolio. HDFC Securities (HSL) and HDB Financial Services
(HDBFSL) are its subsidiaries. HDFC Bank’s mission is to be a World Class Indian Bank. The
objective is to build sound customer franchises across distinct businesses so as to be the
preferred provider of banking services for target retail and wholesale customer segments, and to
achieve healthy growth in profitability, consistent with the bank’s risk appetite. The bank is
committed to maintain the highest level of ethical standards, professional integrity, corporate
governance and regulatory compliance. HDFC Bank’s business philosophy is based on five core
values: Operational Excellence, Customer Focus, Product Leadership, People and Sustainability.

312
6.4.2.4 Merger Highlights:
The deal was a stock for stock deal. The share swap ratio stood at 1:29 that is every
shareholder of Centurion Bank of Punjab got one share of HDFC Bank for every 29 shares
of Centurion Bank of Punjab.
The merger was meaningful for HDFC Bank as the deal provided an opportunity to extend
scale and geography in the northern and southern Indian states. The merger provided huge
possibility of business synergy in terms of massive economies of scale and enhanced
distribution channel.
The merger created an apt cultural fit between the two organizations which in turn enhanced
management efficiency. HDFC bank capitalized on the joint human resources strength that
the merger brought so as to exploit the underutilized branch network of Centurion Bank of
Punjab.
Centurion Bank of Punjab had an extended presence of 170 branches in northern India and
140 branches in southern states of India with large presence in Punjab and Kerala. These
bank branches had the requisite expertise in retail liabilities, transaction banking and third
party distribution. The combined entity improved productivity levels of Centurion Bank of
Punjab’s branches by leveraging HDFC Bank’s brand name.
There were significant cross-selling opportunities for HDFC. Besides, Centurion Bank of
Punjab’s Management had appropriate experience of working with larger banks which
automatically meant that managing business of the size commensurate with HDFC Bank
was uncomplicated.
The merger seemed a win-win situation for HDFC Bank as it added around 400 branches to
its already existing network of 750 branches along with an efficient team of skilled
personnel, whilst creating a bank with an asset size such that it became the seventh largest
bank in India that provided improved distribution with almost 1200 branches and 2400
ATMs, making it the largest in terms of branches in the private sector.
313
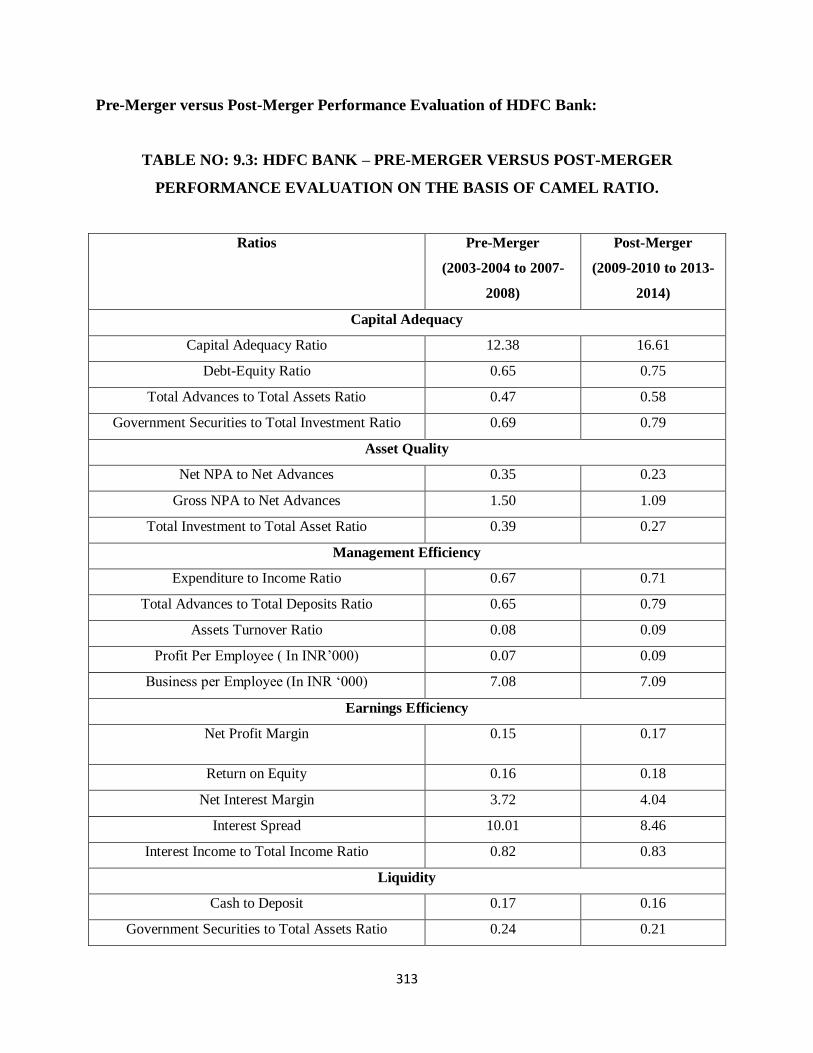
Pre-Merger versus Post-Merger Performance Evaluation of HDFC Bank:
TABLE NO: 9.3: HDFC BANK – PRE-MERGER VERSUS POST-MERGER
PERFORMANCE EVALUATION ON THE BASIS OF CAMEL RATIO.
Ratios Pre-Merger
(2003-2004 to 2007-
2008)
Post-Merger
(2009-2010 to 2013-
2014)
Capital Adequacy
Capital Adequacy Ratio 12.38 16.61
Debt-Equity Ratio 0.65 0.75
Total Advances to Total Assets Ratio 0.47 0.58
Government Securities to Total Investment Ratio 0.69 0.79
Asset Quality
Net NPA to Net Advances 0.35 0.23
Gross NPA to Net Advances 1.50 1.09
Total Investment to Total Asset Ratio 0.39 0.27
Management Efficiency
Expenditure to Income Ratio 0.67 0.71
Total Advances to Total Deposits Ratio 0.65 0.79
Assets Turnover Ratio 0.08 0.09
Profit Per Employee ( In INR’000) 0.07 0.09
Business per Employee (In INR ‘000) 7.08 7.09
Earnings Efficiency
Net Profit Margin 0.15 0.17
Return on Equity 0.16 0.18
Net Interest Margin 3.72 4.04
Interest Spread 10.01 8.46
Interest Income to Total Income Ratio 0.82 0.83
Liquidity
Cash to Deposit 0.17 0.16
Government Securities to Total Assets Ratio 0.24 0.21
314
Investment to Deposit ratio 0.52 0.36
Interest Expended to Interest Earned 0.46 0.52
All the ratios that analyze Capital Adequacy in HDFC Bank show an increasing trend in the post-
merger period as compared to the pre-merger period. Capital Adequacy Ratio evaluates the
financial health and solvency of the bank and comprises the most important variable for
evaluating the soundness and solvency of the banks. Capital Adequacy Ratio as per Basel norms
specifies that higher value of this ratio indicates better solvency and financial strength of the
banks. TABLE NO: 9.3 indicates Capital Adequacy Ratio in pre-merger period (2003-2004 to
2007-2008) was 12.38 percent which increased to 16.61 percent in the post-merger period (2009-
2010 to 2013-2014). This indicates that CAR as per Basel norms improved in post-merger period
as compared to pre-merger period. It is observed that Average CAR as per Basel norms for 5
years both pre-merger and post-merger was clearly higher than RBI norms of 9 percent. There
was also an increase in the Total Advances to Total Assets Ratio in the post-merger period which
increased from 0.47 in the pre-merger period (2003-2004 to 2007-2008) to 0.58 in the post-
merger period (2009-2010 to 2013-2014), which could show HDFC bank’s aggressiveness in
lending. The Debt-Equity Ratio showed an increase in the post-merger period (2009-2010 to
2013-2014) to 0.75 from 0.65 in the pre-merger period (2003-2004 to 2007-2008), which seems
to illustrate an increase in the debt proportion in the post-merger period in HDFC Bank’s capital
structure. An increase in the Government securities to Total Investment Ratio from 0.69 in the
pre-merger period (2003-2004 to 2007-2008) to 0.79 in the post-merger period (2009-2010 to
2013-2014) clearly indicates an increase in the proportion of investment in government securities
in the post-merger period. The Asset Quality parameters have also shown a positive performance
in post-merger period (2009-2010 to 2013-2014) with a decrease in the Net NPA to Net
Advances Ratio from 0.35 in the pre-merger period (2003-2004 to 2007-2008) to 0.29 in the
post-merger period (2009-2010 to 2013-2014) and a corresponding decline in the Gross NPA to
Net Advances Ratio from 1.50 in the pre-merger (2003-2004 to 2007-2008) period to 1.09 in the
post-merger period (2009-2010 to 2013-2014).
In case of HDFC Bank the substantial decline in Gross NPA’s and Net NPA’s seems to imply
that the bank may not be adding a fresh stock of bad loans. It could also signify that the bank is

315
exercising enough prudence when offering loans or is probably inflexible in terms of following
up with borrowers on timely repayments. A low level of NPAs could also suggests low
probability of a large number of credit defaults which could affect the profitability and net-worth
of banks and also could wear down the value of the asset.
A look at all the Management Efficiency Parameters also shows a positive increase in the post-
merger performance except with the Total Expenditure to Total Income Ratio which has
increased from 0.67 in the pre-merger period (2003-2004 to 2007-2008) to 0.71 in the post-
merger period (2009-2010 to 2013-2014), which could indicate that this increase is due to the
increase in the staff expenses and other employee costs. In TABLE NO: 9.3, all the other
parameters also showed an increasing trend which demonstrated that HDFC bank has shown
significant betterment in their Management efficiency in the post-merger period (2009-2010 to
2013-2014), especially the Advances to Deposit ratio that has shown a substantial increase from
0.65 in pre-merger period (2003-2004 to 2007-2008) to 0.79 in the post-merger period (2009-
2010 to 2013-2014). Higher ratio reflects ability of the bank to make optimal use of the available
resources. The ratio has increased for HDFC post-merger which seems to imply ability of the
banks management in converting the deposits available with the banks (excluding other funds
like equity capital, etc.) into high earning advances.
The Earnings Quality has also shown a positive increase with Net Profit Margin Ratio increasing
from 0.15 in the pre-merger period (2003-2004 to 2007-2008) to 0.17 in the post-merger period
(2009-2010 to 2013-2014), this increase has been seen despite an increase in the total
expenditure which could indicate that the bank’s proportionate increase in sales in the post-
merger period is much higher than the banks increase in total expenditure, this is due to the
sound management efficiency in the post-merger period. This increase is may have also reflected
in the Return on Equity Ratio that has improved from 0.16 in the pre-merger period (2003-2004
to 2007-2008) to 0.18 in the post-merger period (2009-2010 to 2013-2014). The Liquidity
Parameters signal that there has not been any change in the Cash to Deposit Ratio in the pre-
merger (2003-2004 to 2007-2008) versus the post-merger period (2009-2010 to 2013-2014).
However although the proportion of Government Securities in the proportion of Total Investment
has increased, its proportion to Total Asset has decreased from 0.24 in the pre-merger period

316
(2003-2004 to 2007-2008) to 0.21 in the post-merger period (2009-2010 to 2013-2014), which
seems to indicate that the Bank is now seeking for high return seeking channels of investment so
as to increase its non-interest income. The positive effect of this ratio could also been seen in the
Net Profit Margin Ratio and Return on Equity that has improved in the post-merger period
despite an increase in total expenditure due to the presence of higher return generating sources of
investment. There has been a significant decline in the Investment to Deposit Ratio from 0.52 in
the pre-merger period (2003-2004 to 2007-2008) to 0.36 in the post-merger period (2009-2010 to
2013-2014) which seems to demonstrate that HDFC bank has may have been stringent in
converting its Deposits into low interest seeking investments and is converting those deposits
into high interest seeking Advances.
In conclusion the performance of HDFC Bank seems to have clearly improved in post-merger
period in almost all parameters of CAMEL Model that is Capital Adequacy, Asset Quality,
Management Efficiency, Earning Quality and Liquidity. Merger has a significant positive impact
on the financial performance of HDFC Bank. Various ratios calculated under CAMEL Model
indicate improved performance and enhanced position of HDFC Bank after merger with
Centurion Bank of Punjab. Merger of Centurion Bank of Punjab and HDFC Bank highlights the
fact that two banks can merge successfully to combine to form a strong entity that could match
Public sector banks in size, scale and strength.
9.3 IDBI BANK ACQUIRES UNITED WESTERN BANK:
Type of merger: Restructuring of weak banks.
Year of merger: 2006-2007.
Brief Details of the acquirer bank- Industrial Development Bank of India (IDBI Bank):
IDBI Bank was incepted as an apex Development Financial Institution in India. It successfully
played the role of a chief nation-building organization in its capacity of a Development Financial
Institution for over forty years of its existence until October 2004 and thereafter as a full-service
commercial Bank from October 2004 onwards. During its existence as a Development Financial

317
Institution, the bank extended its services beyond just providing project financing, to cover a
range of services that contributed towards evenhanded geographical stretch of industries,
development of select backward areas, surfacing of a new spirit of enterprise and evolution of a
vivacious capital market.
As a banking institution, IDBI provided the entire range of banking services while continuing to
play its role as a Development Financial Institutions. The bank merged with IDBI Ltd. its parent
company in April 2005, to incept one of the largest tech-savvy, new generation bank with
majority Government shareholding that touched the lives of millions of Indian customers through
a gamut of corporate, retail, small and medium enterprises and agricultural products and services.
With its merger with United Western Bank in 2006, the bank further extended its services and
came to be recognized as a bank that played a dual role of a Development Financial Institution as
well as an all-encompassing Indian bank.
Headquartered in Mumbai, IDBI Bank currently has built for itself a vigorous business strategy,
a highly knowledgeable, experienced and dedicated workforce and a state-of-the-art information
technology platform to structure and deliver personalized and innovative banking services and
customized financial solutions to its clients across various delivery channels.
Today, IDBI Bank is imaged itself as a bank that is strongly committed to work towards
emerging as the 'Bank of choice' and 'the most valued financial conglomerate', apart from
enhancing and generating wealth and value to all its stakeholders.
Merger Highlights:
The Government of India issued a moratorium on United Western Bank Limited one of the
largest private sector commercial banks in India in order to protect the interest of the
depositors. RBI issued the moratorium citing reasons as poor financials and mismanagement
at United Western Bank Limited for issue of the moratorium. The moratorium required the
bank to seize all its banking operations and was permitted to make some specific payments as
mentioned in the order and depositors were allowed to withdraw only up to a certain limit

318
from their savings account and current account or any other deposit account through any of
the branches of the bank.
United Western Bank Limited was imaged as a bank with poor asset quality and deteriorating
financials. This automatically meant the bank had a depressing future. IDBI, with enough
capital at its disposal, to absorb the business of United Western Bank Limited, was certain
enough to lend comfort and relief to the ailing bank.
IDBI offered to pay INR 28 per share to the United Western Bank Limited’s shareholders.
This implied a total consideration of INR 150 crore, which although seemed to be little
expensive for the markets, however knowing that Western Bank Limited had positive net
worth and no further slippage in the asset quality, the acquisition was a value proposition for
IDBI.
The deal had huge synergies to both the combining banks; this deal brought positive value
for old private sector banks as the deal added value to IDBI over the long term. The deal
helped IDBI expand its retail presence, though its size did not increase considerably.
The most significant benefit of the deal to IDBI bank was access to the 230-branch network
of The United Western Bank Limited. IDBI had a balance-sheet size of more than INR80,000
crore, a network of 181 branches at the time of the deal, which made it rankconsiderably
poorly on this parameter compared to like-size peers. This merger gave IDBI immediate
access to all the 200 plus branches of The United Western bank Limited, thereby broadening
its deposit franchise.
IDBI Bank was growing at 25 per cent over the last two years of the merger deal, hence the
addition of 230 branches of The United Western Bank Limited facilitated IDBI Bank to
sustain this growth impetus. The deal led to an increase in asset base of IDBI bank by 10
percent and deposits by over 20 per cent. With the RBI laying stringent licensing standards
that restricted easy opening of new branches in the country the merger automatically gave
IDBI access to a ready physical infrastructure, enabling it to mobilize low-cost funds.
The merger of IDBI with United Western Bank Limited assisted IDBI to broaden and expand
its credit profile. IDBI Bank was dominant in industrial financing whilst United Western
Bank Limited had exposure to agriculture credit, therefore the deal gave IDBI access to
United Western Bank Limited’s branches in semi-urban and rural areas.

319
The deposit mix for IDBI also improved, with 60 percent of its liabilities in the form of long-
term borrowings out of which low-cost deposit was a very small proportion of the total
borrowings. The access to United Western Bank Limited's low-cost deposit base proved
advantageous for IDBI in the long run as it would assist IDBI Bank to improve its Net
Interest Margin which was as low as 0.5 per cent versus industry average of 3.00 percent as
well as improve the high cost of funds of 6.5 per cent versus the industry average of 5
percent.

320
Pre-Merger versus Post-Merger Performance Evaluation of IDBI Bank:
TABLE NO: 9.4: IDBI BANK – PRE-MERGER VERSUS POST-MERGER
PERFORMANCE EVALUATION ON THE BASIS OF CAMEL RATIO.
Ratios Pre-Merger
(2001-2002 to
2005-2006)
Post-Merger
(2007-2008 to
2011-2012)
Capital Adequacy
Capital Adequacy Ratio 11.97 12.64
Debt-Equity Ratio 4.76 4.13
Total Advances to Total Assets Ratio 0.55 0.61
Government Securities to Total Investment Ratio 0.42 0.58
Asset Quality
Net NPA to Net Advances 1.39 1.18
Total Investment to Total Asset Ratio 0.31 0.28
Management Efficiency
Expenditure to Income Ratio 0.82 0.83
Total Advances to Total Deposits Ratio 1.41 0.92
Profit Per Employee 0.07 0.10
Business per Employee 11.10 21.97
Earnings Efficiency
Net Profit Margin 0.10 0.09
Return on Equity 0.13 0.17
Net Interest Margin 1.68 1.12
Interest Spread 6.09 4.90
Interest Income to Total Income Ratio 0.80 0.88
Liquidity
Cash to Deposit 0.10 0.09
Government Securities to Total Assets Ratio 0.14 0.28
Investment to Deposit ratio 0.78 0.42
Interest Expended to Interest Earned 0.76 0.85

321
The ratios that analyze Capital Adequacy in IDBI Bank show an improved performance in the
post-merger period as compared to the pre-merger period. TABLE No: 9.4, indicates Capital
Adequacy Ratio in pre-merger period (2001-2002 to 2005-2006) was 11.97 percent which
increased to 12.64 percent in the post-merger period (2007-2008 to 2011-2012). This indicates
that CAR as per Basel norms improved in post-merger period as compared to pre-merger period.
However Average CAR as per Basel norms, both in pre-merger and post-merger period was
clearly higher than RBI norms of 9 percent for Capital Adequacy Ratio which implies that the
bank has a sound capital base that strengthens confidence of depositors. There was also a marked
increase in the Total Advances to Total Assets Ratio in the post-merger period which increased
from 0.55 in the pre-merger period (2001-2002 to 2005-2006) to 0.61 in the post-merger period
(2007-2008 to 2011-2012), which shows IDBI Bank’s aggressiveness in lending and efficiency
in converting the deposits available with the bank into high earning advances. The Debt-Equity
Ratio showed a decrease in the post-merger period (2007-2008 to 2011-2012) to 4.13 from 4.76
in the pre-merger period (2001-2002 to 2005-2006), which illustrates a decrease in the debt
proportion in the post-merger period in IDBI Bank’s capital structure that could demonstrate
that the creditors have a declining proportion of claims against the bank’s assets. This could
indicate a favorable scenario as it could enhance the margin of safety for creditors. An increase
in the Government Securities to Total Investment Ratio from 0.42 in the pre-merger period
(2001-2002 to 2005-2006) to 0.58 in the post-merger period (2007-2008 to 2011-2012) clearly
indicates an increase in the proportion of investments in government securities in the post-
merger period for IDBI Bank which indicates that the bank has increased its investment in safe
investing instruments where returns although low are secured.
The Asset Quality parameters have also shown a remarkable positive performance in post-
merger period (2007-2008 to 2011-2012) with a decrease in the Net NPA to Net Advances Ratio
from 1.39 in the pre-merger (2001-2002 to 2005-2006) period to 1.18 in the post-merger period
(2007-2008 to 2011-2012), which could imply that the bank has not added a fresh stock of bad
loans. It could also imply that the bank is exercising enough caution when offering loans or is too
rigorous in terms of following up with borrowers on timely repayments. It could also suggest a
low possibility of a large number of credit defaults that affect the profitability and net-worth of
banks and also wears down the value of the asset.
322
A look at all the Management Efficiency Parameters also show a positive increase in the post-
merger performance with remarkable improvement in the Business per Employee which has
increased from 11.10 in the pre-merger period (2001-2002 to 2005-2006) to 21.97 in the post-
merger period (2007-2008 to 2011-2012), which could indicate that this increase is due to the
increase in the staff and employees of United Western bank and the addition of their branch
network in the western and southern regions of the country along with an increase in the rural
banking customers and agricultural credit for IDBI which complimented IDBI Bank’s industrial
lending’s and further increased revenues for IDBI. It indicates high productivity for banks
employees.
In TABLE NO: 9.4 above, all the other parameters also showed an increasing trend which
demonstrated that IDBI Bank has shown significant betterment in their Management Efficiency
in the post-merger period (2007-2008 to 2011-2012), except the Advances to Deposit ratio that
has shown a decline from 1.41 in pre-merger period (2001-2002 to 2005-2006) to 0.92 in the
post-merger period (2007-2008 to 2011-2012).The ratio has declined for IDBI Bank post-merger
which could imply ability of IDBI banks management in converting the deposits available with
the banks (excluding other funds like equity capital, etc.) into high earning advances. There has
not been any substantial changes in the Total Expenditure to Total Income Ratio from 0.82 in the
pre-merger period (2001-2002 to 2005-2006) to 0.83 in the post-merger period (2007-2008 to
2011-2012) which could illustrate that the bank has been successful in managing its expenditure
which has increased with the addition of expenditure of United Western Bank Limited, however
despite this increase there has not been any substantial changes in the Total Expenditure to Total
Income Ratio, which could imply that the combined bank has been able to maintain a high
standard of Management Efficiency and capability.
With respect to Earnings Quality, Net Profit Margin Ratio has not shown any substantial changes
from 0.10 in the pre-merger period to 0.09 in the post-merger period, which could signal that the
bank has been very efficient in managing its revenues and expenses in the post-merger period,
the effect of the Net Profit Margin is also reflected in its Return to Equity Ratio which has

323
increased remarkably to 0.17 in the post-merger (2007-2008 to 2011-2012) period from 0.13 in
the pre-merger period (2001-2002 to 2005-2006). Equity shareholders are the real owners of the
company. They assume the highest risk in the company. Thus they are more interested in the
profitability of the company. For IDBI Bank since the ratio has increased post-merger could
imply a higher payment of dividend and a larger share in the residual profits thus increasing the
attractiveness of investments for the present and the prospective shareholders. A look at the Net
Interest Margin and Interest Spread show a decline in the post-merger period. It can be assumed
due to declining Net Interest Margin that the bank may come under pressure from offering
preferential rates to its customers. It is also observed that the bank needs to improve its Net
Interest margin as a low ratio indicates inefficient management of assets that are non-earning or
low-yielding.
The Liquidity Parameters signal that there has not been any change in the Cash to Deposit Ratio
in the pre-merger (2001-2002 to 2005-2006) versus the post-merger period (2007-2008 to 2011-
2012). The Government Securities to Total Asset Ratio has increased from 0.14 in the pre-
merger period (2001-2002 to 2005-2006) to 0.28 in the post-merger period (2007-2008 to 2011-
2012), which could indicate that the bank is now seeking safe and secured channels of
investment so as to protect the interest of the depositors by being liquid so that the bank can
enhance its ability to meet the financial obligations as and when demanded. The positive effect
of this ratio is also seen in the Net Profit Margin Ratio and Return on Equity that has improved
in the post-merger period. There has been a significant decline in the Investment to Deposit
Ratio from 0.78 in the pre-merger period (2001-2002 to 2005-2006) to 0.42 in the post-merger
period (2007-2008 to 2011-2012).
In conclusion the performance of IDBI Bank has clearly improved in post-merger period on
almost all parameters of CAMEL Model that is Capital Adequacy, Asset Quality, Management
Efficiency, Earning Quality and Liquidity. Merger has a significant positive impact on the
financial performance of IDBI Bank. Although the merger of United Western bank Limited with

324
IDBI bank was more due to regulatory intervention, it was interesting to note that the deal added
huge synergies to both the combining banks as this brought positive value for old private sector
banks as well as added value to IDBI over the long term. The deal helped IDBI expand its retail
presence, though its size did not increase considerably.
In conclusion IDBI Bank has been positively affected by the event of acquisitions of United
Western Bank. The merger was a move towards consolidation in the Indian Banking industry.
The markets did react positively to the merger as it was a win-win situation to both the merging
entities especially IDBI Bank.
9.4 INDIAN OVERSEAS BANK ACQUIRES BHARAT OVERSEAS BANK LIMITED:
Type of merger: Restructuring of weak banks- Forced acquisitions
Year of merger: 2006-2007.
Brief Details of the acquirer bank- Indian Overseas Bank (IOB)
Indian Overseas Bank (IOB) was founded in February 1937,by an entrepreneur to fund trade
between southern Tamil Naidu and Rangoon in Myanmar, with a twin objective of specializing
in foreign exchange business and overseas banking. It started out with three branches located at
Karaikudi and Chennai in India and Rangoon in Burma (presently Myanmar). It served the
Chettiars who were the rich mercantile class who at that time had spread their operations all over
Tamil Naidu and several places out of the country. As a result, from the beginning IOB
specialized in foreign exchange and overseas banking. In the 1960s, the banking sector in India
was consolidating through the merger of weak private sector banks with stronger ones. IOB
acquired a number of local banks in order to strengthen its presence further. In 1969,
Government of India nationalized IOB, at that time it had twenty of its eighty branches out of the
325
country that is at overseas places. After nationalization IOB laid emphasis on opening branches
in rural India.
In early 2000, when international expansion started picking pace IOB acquired Bharat Overseas
Bank. Within a period of three years of this acquisition Malaysian banking authorities awarded
commercial banking license to a locally incorporated bank to be jointly owned by Bank Of
Baroda, Indian Overseas Bank and Andhra Bank. The new bank that was set up as a result of this
license had large population of Indians. As at December 2014, IOB had about 3500 domestic
branches, including 1150 branches only in Tamil Naidu, three extension counters, and eight
branches and offices overseas.IOB also has a network of about 3300 ATMs all over India. Indian
Overseas Bank has an ISO certified in-house Information Technology department, which has
developed the software that its branches use to provide online banking to customers; the bank
has achieved 100 percent networking status as well as 100 percent Core Banking Solution status
for its branches.
Merger Highlights:
This was the first acquisition after the then Finance Minister of the country Hon. Mr. P
Chidambaram made a demand for Indian banks to acquire size and scale so that they could
be as competitive as banks the world over. This deal would also be one of the land mark deal
as it was the first deal in the banking acquisition history that a public sector bank and a
private sector bank had a smooth completion of an acquisition deal and this deal was
considered to be accepted by the regulatory authorities because it was in the larger interest of
the banking system.
The acquisition helped IOB to add 91 branches of Bharat Overseas Bank to its already
existing branch network of more than 1500 branches. This came as a blessing to IOB since
retail lending was rapidly growing and branch network was strategic. The most significant
benefit to IOB that integration challenges would be minimal since both the banks were south
based and Bharat Overseas Bank was considerably smaller than IOB.

326
For Bharat Overseas that had net bad loans of about 1.6 per cent of total assets, whose
profitability was under pressure since 2004 due to rise in interest rates and had its return on
assets significantly below 1 percent, this merger with a bank as big in size and scale like IOB
came as a boon to the bank. Besides Bharat Overseas bank was owned by seven banks
including IOB, therefore this merger deal was inescapable due to RBI’s norm that bans any
single individual from holding more than 5 percent stake in any bank.
IOB had future plans to expand rapidly overseas, therefore this acquisitions very well fitted
in its plans to expand abroad since Bharat Overseas Bank had a profit making branch in
Bangkok.
327
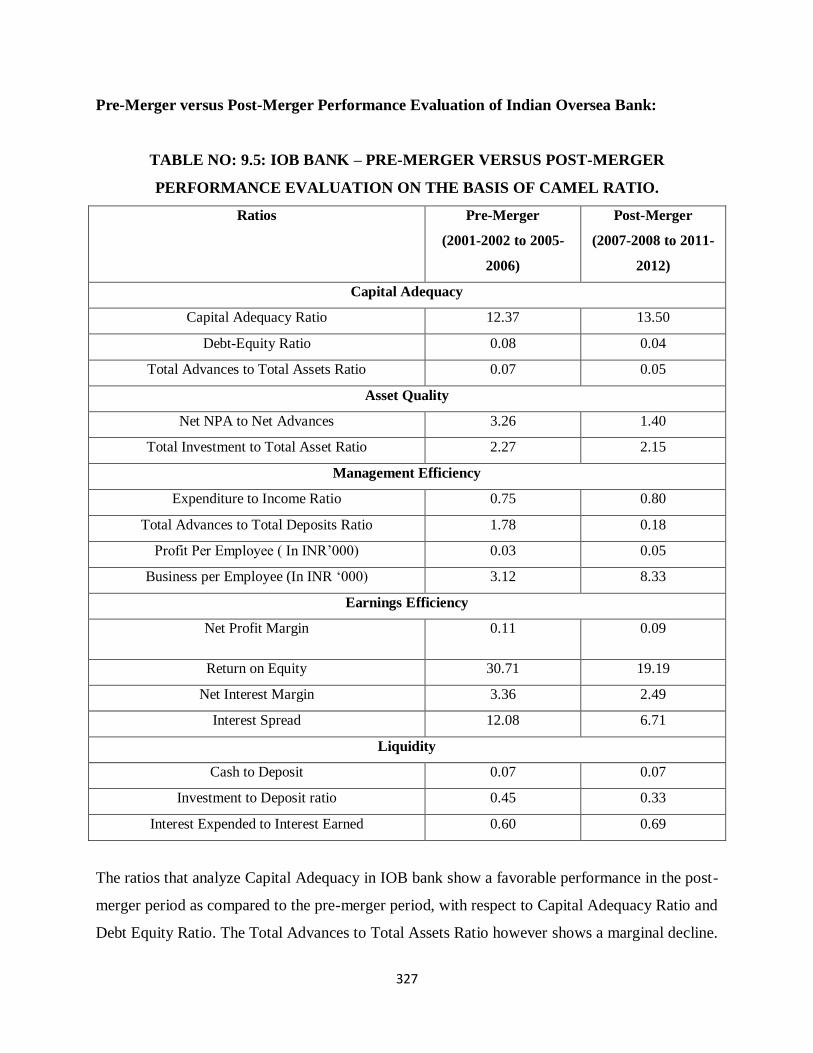
Pre-Merger versus Post-Merger Performance Evaluation of Indian Oversea Bank:
TABLE NO: 9.5: IOB BANK – PRE-MERGER VERSUS POST-MERGER
PERFORMANCE EVALUATION ON THE BASIS OF CAMEL RATIO.
Ratios Pre-Merger
(2001-2002 to 2005-
2006)
Post-Merger
(2007-2008 to 2011-
2012)
Capital Adequacy
Capital Adequacy Ratio 12.37 13.50
Debt-Equity Ratio 0.08 0.04
Total Advances to Total Assets Ratio 0.07 0.05
Asset Quality
Net NPA to Net Advances 3.26 1.40
Total Investment to Total Asset Ratio 2.27 2.15
Management Efficiency
Expenditure to Income Ratio 0.75 0.80
Total Advances to Total Deposits Ratio 1.78 0.18
Profit Per Employee ( In INR’000) 0.03 0.05
Business per Employee (In INR ‘000) 3.12 8.33
Earnings Efficiency
Net Profit Margin 0.11 0.09
Return on Equity 30.71 19.19
Net Interest Margin 3.36 2.49
Interest Spread 12.08 6.71
Liquidity
Cash to Deposit 0.07 0.07
Investment to Deposit ratio 0.45 0.33
Interest Expended to Interest Earned 0.60 0.69
The ratios that analyze Capital Adequacy in IOB bank show a favorable performance in the post-
merger period as compared to the pre-merger period, with respect to Capital Adequacy Ratio and
Debt Equity Ratio. The Total Advances to Total Assets Ratio however shows a marginal decline.

328
TABLE NO: 9.5, indicate Capital Adequacy Ratio (CAR) in pre-merger period (2001-2002 to
2005-2006) was 12.37 percent which increased to 13.50 percent in the post-merger period (2007-
2008 to 2011-2012). This indicates that CAR as per Basel norms improved in post-merger period
as compared to pre-merger period. It is observed that Average of CAR as per Basel both in the
pre-merger as well as post-merger period was clearly higher than RBI norms of 9 percent for
Capital Adequacy Ratio which implies that the bank has a sound capital base that strengthens
confidence of depositors. There was also a slight decline in the Total Advances to Total Assets
Ratio in the post-merger period which decreased from 0.07 in the pre-merger period (2001-2002
to 2005-2006) to 0.05 in the post-merger period (2007-2012), which could show Indian Overseas
Bank’s slow aggressiveness in lending. The Debt-Equity Ratio showed a decline in the post-
merger period (2007-2008 to 2011-2012) to 0.04 from 0.08 in the pre-merger period (2001-2002
to 2005-2006), which could illustrate a decrease in the debt proportion in the post-merger period
in Indian Overseas Bank’s capital structure that shows that the creditors could have a declining
proportion of claims against the bank’s assets. The Asset Quality parameters have also shown a
positive performance in post-merger period (2007-2008 to 2011-2012) with a decrease in the Net
NPA to Net Advances Ratio from 3.26 in the pre-merger period (2001-2002 to 2005-2006) to
1.40 in the post-merger period (2007-2008 to 2011-2012), which implies that the bank may have
not added a fresh stock of bad loans. It also could imply that the bank is exercising enough
caution when offering loans or is too rigorous in terms of following up with borrowers on timely
repayments. It could also suggest a low probability of a large number of credit defaults that
affect the profitability and net-worth of banks and also wear down the value of the asset.
A look at all the Management Efficiency Parameters also show positive increase in the post-
merger performance especially with the Business per Employee which has increased from 3.12
in the pre-merger period (2001-2002 to 2005-2006) to 8.33 in the post-merger period ((2007-
2008 to 2011-2012). As observed in TABLE-9.5, the Profit per Employee ratio has also shown a
positive increase in the post-merger period. In TABLE-9.5, above, all the other parameters have
shown an increasing trend which demonstrated that Indian Overseas Bank has shown significant
betterment in their Management Efficiency in the post-merger period (2007-2008 to 2011-2012),
except the Advances to Deposit Ratio that has shown a substantial decline from 1.78 in pre-
merger period (2001-2002 to 2005-2006) to 0.18 in the post-merger period (2007-2008 to 2011-

329
2012). The low ratio could reflect the in ability of the bank to make optimal use of the available
resources. The increase in the Total Expenditure to Total Income Ratio from 0.75 in the pre-
merger period (2001-2002 to 2005-2006) to 0.80 in the post-merger period (2007-2008 to 2011-
2012) could illustrate that the bank has been trying to manage its expenditure which has
increased with the addition of expenditure of Bharat Overseas Bank Ltd. Overall the combined
bank has been able to maintain a high standard of Management Efficiency and capability.
The Earnings Quality has shown a decline in almost all the parameters of earnings efficiency.
Net Profit Margin Ratio has shown a steep decline from 0.11 in the pre-merger period to 0.09 in
the post-merger period (2007-2008 to 2011-2012), which signals that the bank seems to not have
been very efficient in managing its revenues and expenses in the post-merger period, the decline
in Net Profit Margin is also reflected in its Return to Equity Ratio which has also declined to
0.19 in the post-merger period (2007-2008 to 2011-2012). A look at the Net Interest Margin and
Interest Spread also show a decline in the post-merger period (2007-2008 to 2011-2012). A low
ratio could indicate that the bank may need to manage its assets that are employed for earnings.
The Liquidity Parameters signal that there has not been any change in the Cash to Deposit Ratio
in the pre-merger (2001-2002 to 2005-2006) versus the post-merger period (2007-2008 to 2011-
2012) as well as in the Total Investment to Total Deposit Ratio, which has in fact slightly
decreased from 0.45 in the pre-merger period (2001-2002 to 2005-2006) to 0.33 in the post-
merger period (2007-2008 to 2011-2012), which demonstrates that the bank may need to
manage payment of short term obligations of its depositors so as to safeguard the interest of the
depositors.
In conclusion the performance of Indian Overseas Bank has clearly improved in post-merger
period in almost all parameters of CAMEL Model that is Capital Adequacy, Asset Quality,
Management Efficiency and Liquidity except the earnings efficiency that has shown a slight
decline in the post-merger period.

330
9.5 CONCLUSION:
Consolidation in the banking sector is expected to gain momentum with the issue of new banking
licenses by the banking regulator- Reserve bank of India as well as the implementation of
BASEL III. This consolidation is to ensure market share for banks. A discussion research paper
by Reserve Bank of India on ‘Banking structure in India- The way forward’ clearly promotes
consolidation in the banking sector. The report evidently points out that consolidation in the
banking industry is gaining pace and has assumed importance, considering the need for a few
numbers of large-sized banks to cater to the increasing corporate and infrastructure financing.
Private sector banks have a clear advantage over public sector banks to grow in size using the
inorganic growth path. The recent Kotak-ING Vyasa deal justifies that mergers do lead to
enhancing the value for all players in the industry and is a right step towards the vision of having
at least four to five banks that are as large as State bank of India, so that our Indian banks can
complement globally and compete domestically. This deal has once again recaptured the focus
on consolidation in the Indian banking industry. Due to the large asset base, larger banks are
considered to be less risky as compared to the smaller ones and their failure does not result in
severe implications on the sector as they are not unified as large sized banks. Besides, it is
evident that as the economy continues to grow banks need to grow in proportion to the economy
to finance the growth of the economy. An economy needs all sizes of banks both small and
large. Whilst both types of banks are needed, there is an immediate need for creating bigger
banks and the swiftest manner to do this is through consolidation. In the last few years there must
have been only about a dozen deals in the banking industry Inspite of the urgent need of creating
large sized banks in India. The reason why acquisition in the bank industry are so far and in
between is due to the restrictions imposed by Reserve Bank of India on acquisitions and the fact
that the banking system is dominated by public sector banks. This is also one of the reasons why
none of the Indian banks have attained global size.
The largest Indian bank is State Bank of India and the second largest Indian bank and the largest
private sector bank ICICI Bank is only one third the asset size of State Bank of India. This
indicates Indian banks need to consolidate to bring in size, scale and customer focus.

331
Indian banking sector have a lot of expectations from the present government in power that
under the direction of our Hon. Prime Minister Shri Narendra Modi that banking consolidation
will gather pace.