chapter 8: structure determination - rsc education
TRANSCRIPT

Chapter 8: Structure determination
Structure Determination 8.
8.1. Simple chemical tests
8.2. Functional group test match up
8.3 1H NMR spectroscopy
8.4 Fragmentation in the mass spectrometer
8.5 13C NMR spectroscopy
8.6 Molecular true or false
8.7 Thin layer chromatography
8.8 Gas chromatography-Mass spectrometry
Answers

8.1. Simple chemical tests
Structure Determination 8.1.
On the shelf above is a selection of reagents that can be used in simple tests to identify particular functional groups. Identify the regent(s) that can be used to distinguish between the pairs of organic compounds shown below.
H2O
NaHCO3(aq) Blue litmuspaper
conc.H2SO4
K2Cr2O7 Tollens'Ag(NH3)2+
NaOH(aq) CuSO4(aq) Br2(aq) AgNO3/H+
8.2. Functional group test match up
Structure Determination 8.2.
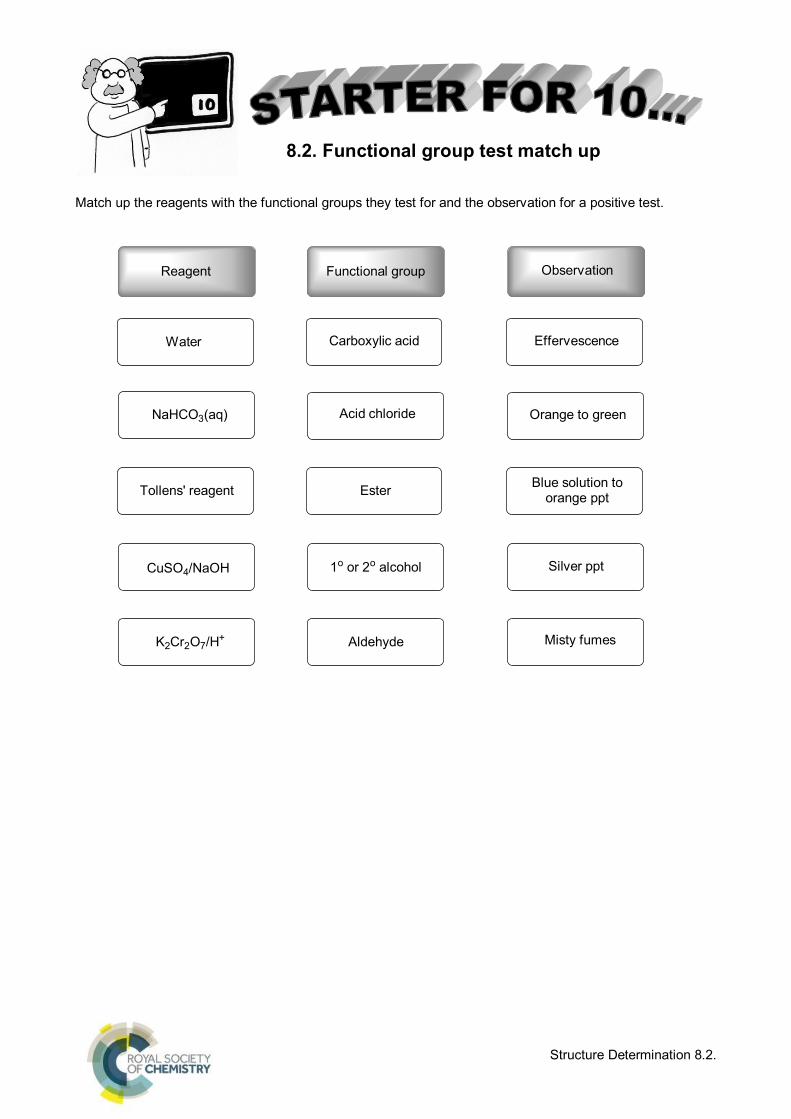
Match up the reagents with the functional groups they test for and the observation for a positive test.
Reagent Functional group Observation
Water Carboxylic acid Effervescence
NaHCO3(aq) Acid chloride Orange to green
Tollens' reagent Ester Blue solution toorange ppt
CuSO4/NaOH 1o or 2o alcohol Silver ppt
Misty fumesAldehydeK2Cr2O7/H+

8.3. 1H NMR spectra
Structure Determination 8.3.
1H NMR spectroscopy tells us about the environment of the hydrogen atoms in organic molecules.
1. Outline how you would prepare a sample of an organic substance for analysis in an NMR spectrometer. (5 marks)
2. The axes below show the 1H NMR spectrum for 2-aminopropane. Label the features of the spectrum shown by the arrows and boxes. (4 marks)
3. On the structure of 2-aminopropane, indicate which proton(s) give rise to the peak labelled a. (1 mark)

8.4. Fragmentation in the mass spectrometer
Structure Determination 8.4.
1. The table below shows the m/z values of fragmentation ions formed from fragmentation of an ester, methyl butanoate in a mass spectrometer. Complete the table to show the structural formula of the ions that correspond to the m/z given.
2. α cleavage is the primary mode of fragmentation of compounds containing carbonyl groups in the mass spectrometer. This is when the R groups attached to the carbonyl group break off. Which 2 peaks from those labelled A to G are formed as a result of α cleavage?
3. Write an equation to show how fragment F is formed from the molecular ion.
m/z Fragment ion
A 15
B 29
C 31
D 43
E 59
F 71
G 87

8.5. 13C NMR spectroscopy
Structure Determination 8.5.
Sort the molecules below into the number of peaks that would be displayed in its 13C NMR spectrum (1 mark each).

8.6. Molecular true or false
Structure Determination 8.6.
Look at the structure of molecule A and indicate whether the statements 1 to 10 are true or false (1 mark each).
1. It has a major fragment in its mass spectrum at m/z = 105. 2. It decolourises bromine water. 3. There are 5 distinct peaks in its 13C NMR spectrum. 4. There are only 2 unique proton environments in the molecule. 5. One of the peaks in the 1H NMR spectrum will disappear when a little D
2O (deuterated water) is added
to the tube and it is reanalysed. 6. Its molecular ion appears at m/z = 121 in the mass spectrum. 7. When reacted with Tollens’ reagent, a silver mirror forms. 8. The molecule will turn blue litmus paper red. 9. Its IR spectrum will contain a broad peak at 2800-3500cm-1. 10. A sample of A will be immiscible with water.

8.7. Thin layer chromatography
Structure Determination 8.7.
Thin layer chromatography can be used to separate mixtures. Look at the chromatogram shown below.
1. Fill in the features indicated by arrows on the chromatogram. (3 marks) 2. Label the stationary phase and mobile phase on the diagram. (2 marks) 3. Calculate Rf for the sample shown, show your working. (3 marks) 4. Not all samples are visible after a chromatogram has been run. Give 2 ways in which the sample can
be visualised on the silica gel plate. (2 marks)
Silica gel tlc plateSolvent: CH2Br2

8.8. Gas Chromatography-Mass Spectrometry
Structure Determination 8.8.
1. How does the liquid stationary phase separate organic compounds? (1 mark) 2. What is the mobile phase when in GC-MS? (1 mark) 3. What kind of mixtures is GC-MS useful for separating? (1 mark) 4. A mixture of ethyl ethanoate, propyl ethanoate, ethanol and hexane is analysed by GC-MS. Suggest
the order in which the substances would be eluted and indicate what the output from the GC-MS would be. (7 marks)

8. Answers
Structure Determination answers.
8.1 Simple chemical tests
A and B – NaHCO3(aq)
C and D – Water and blue litmus paper
E and F – K2Cr
2O
7 and H
2SO
4
G and H – AgNO3/H
+
I and J – Br2(aq)
K and L – Tollens and CuSO4/NaOH
One mark for each correct reagent. This starter provides a good opportunity to discuss what the results of these tests would be.
8.2 Functional group test match up
Reagent Functional group Observation
Water Carboxylic acid Effervescence
NaHCO3(aq) Acid chloride Orange to green
Tollens' reagent Ester Blue solution toorange ppt
CuSO4/NaOH 1o or 2o alcohol Silver ppt
Misty fumesAldehydeK2Cr2O7/H+
10 marks, 1 mark for each line

8. Answers
Structure Determination answers.
8.3 1H NMR spectroscopy
Dissolve between 10-20mg /a small quantity of the substance (2 marks, QoL for dissolve, plus quantity)
In a small volume/1-2cm3 of CDCl
3 (one mark for suitable deuterated solvent)
Add one drop of TMS reference solution (one mark for TMS)
Transfer to a clean, dry NMR tube using a Pasteur pipette (one mark for NMR tube)
Total = 5

8. Answers
Structure Determination answers.
8.4 Fragmentation in the mass spectrometer
(6 marks)
2. C and D (1 mark for both)
3.
m/z Fragment ion
A 15
B 29
C 31
D 43
E 59
F 71
G 87
8. Answers
Structure Determination answers.
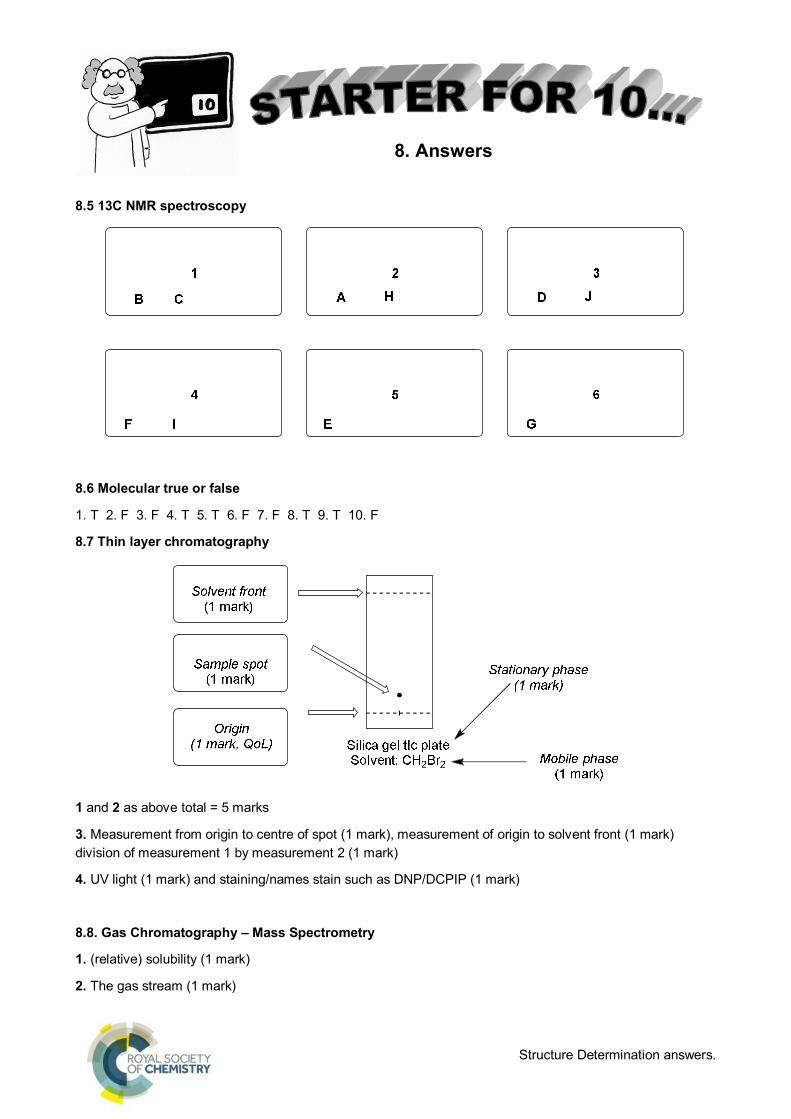
8.5 13C NMR spectroscopy
8.6 Molecular true or false
1. T 2. F 3. F 4. T 5. T 6. F 7. F 8. T 9. T 10. F
8.7 Thin layer chromatography
1 and 2 as above total = 5 marks
3. Measurement from origin to centre of spot (1 mark), measurement of origin to solvent front (1 mark) division of measurement 1 by measurement 2 (1 mark)
4. UV light (1 mark) and staining/names stain such as DNP/DCPIP (1 mark)
8.8. Gas Chromatography – Mass Spectrometry
1. (relative) solubility (1 mark)
2. The gas stream (1 mark)
8. Answers
Structure Determination answers.
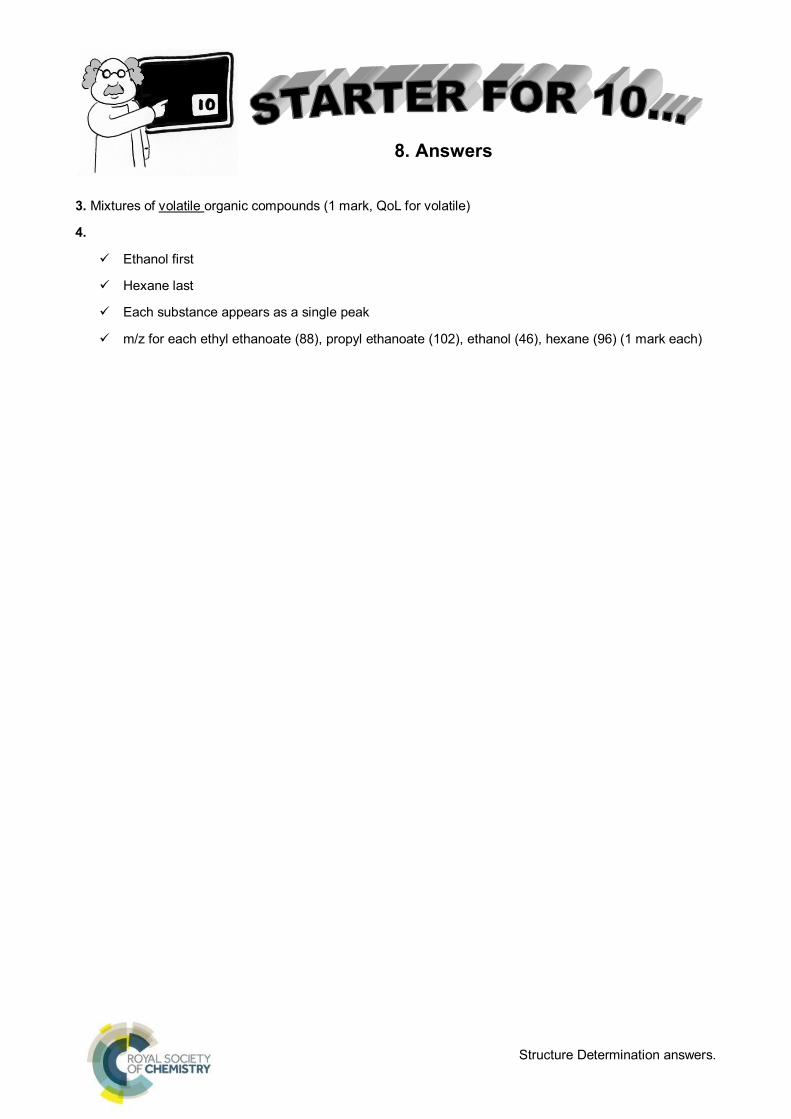
3. Mixtures of volatile organic compounds (1 mark, QoL for volatile)
4.
Ethanol first
Hexane last
Each substance appears as a single peak
m/z for each ethyl ethanoate (88), propyl ethanoate (102), ethanol (46), hexane (96) (1 mark each)