chapter-8 status of tourism in study area (sample …
TRANSCRIPT

‘A Study of Tourism in Gujarat: A Geographical Perspective”
CHAPTER-8
STATUS OF TOURISM IN STUDY AREA
(SAMPLE SURVEY LOCATIONS)
‘A Study of Tourism in Gujarat: A Geographical Perspective’
236
8.1 CONCEPTUAL FRAMEWORK AND METHODOLOGY
The earlier chapters incorporated the facts related about Tourism history of
Gujarat, literature, basic information, typology, components & systematized
secondary data composed from various organizations from national and state level
statistical reports. Accordingly, the diagrams, maps and graphs prepared and
analyzed. Now this chapter includes my original work and the real contribution to
existing knowledge & facts. It became possible only with the help of pursuing of truth
with the help of study, observation, interviews, surveys, comparison and analysis. The
research is based of systematic method of generalizing, enunciating the problems,
formulating a hypothesis, collecting the facts or data, analyzing the facts and reaching
certain conclusions either in the form of solutions towards the concerned problem or
certain generalizations for some theoretical formulations. The real objective of my
study will be fulfilled in this chapter. To carry out efficiently my work because of
huge number of tourist arrivals I have used random sampling method and prepared
Questionnaires and for each parameter I have selected 10 number of tourists from all
backgrounds by their origin such as schedule for local tourists, outside Gujarat
tourists, International tourists. The acquainted sample tourists were only those who
stayed at least for 24 hours at that particular place. The survey was done by going to
that particular tourist location and also to those who have gone earlier on the basis of
that experience. To know about the physical, social and economic problems the
schedules for shopkeepers is prepared. Sometimes it is not easy to collect information
according to schedule so personal interviews was conducted. The electronic media
such as phones & cameras was also used to record important information.
8.2 GEOGRAPHICAL SIGNIFICANCE OF SAMPLE
SURVEYED TOURIST PLACES
In the present topic the researcher would like to introduce the touristic & the
geographical significance of the samples locations which has been taken into Study.
They are as follows:
1) Narayan Sarovar / Koteshwar
Narayan Sarovar is located at the coordinate system of latitude, i.e. 23° 40'
22.8” N and Longitude of 68° 32' 20.4” E. Relatively situated in the western part of

‘A Study of Tourism in Gujarat: A Geographical Perspective’
237
Lakhpat taluka of Kutch district of Gujarat. Koteshwar is located just 3 km NW from
the Narayan Sarovar Lake.
Narayan Sarovar Lake is a sweet water lake on the mouth of Aranian Sea.
According to legends, one of the holy rivers of India, Sarasvati River had an outlet
into sea near present day Narayan Sarovar and waters of lake were filled with holy
waters of river Saraswati (Wikipedia). One another history behind could find a place
that it was until the Indus shifted course, changing the geography of this region.
Lakhpat was a prosperous port near its mouth. However, due to an earthquake in 1819
AD, the area became barren and crops withered away due to lack of water as river
disappeared after the earthquake. The Ghost town in Lakhpat tells story of that serious
earthquake. Koteshwar temple is another mark in the pilgrim’s trail and recognized
for ancient Shiva temple. Kotehswar temple overlooks Kori Creek, which is
practically a shallow sea due to tidal difference. It is also referred as contested
coastline due to ongoing confliction between India and Pakistan.
Narayan Sarovar is one the most sacred pilgrimage site for Hindus. According
to Hindu theology, there are five sacred lakes water filled up collectively called
Panchsarovar, namely Mansarovar, Bindu Sarovar, Narayan Sarovar, Pampa Sarovar
and Pushkar Sarovar. Koteshwar Mahadev temple looks quite gloomy. Generally this
type of side sea location of temple is hardly gets to sea anywhere in the country. This
tourist location is well maintained by the Government of Gujarat. However, it lacks
the basic public utilities services. According to locals the foreign are not allowed to
stay a night so least interested in visiting this place. This situation might be arising
due to international security reasons. The other places nearby expected to visit are the
Nayaran Sarovar Sanctuary also popularly known as Narayan Sarovar wildlife
Sanctuary or Narayan Sarovar Chinkara Sanctuary. The desert forest in this
sanctuary is said to be the only one of its kind in India. Mata no Madh highly
respected temple of Maa Ashapura.
2) Dwarka
Dwarka is located at the coordinate system of Latitude i.e., 22° 13' 48" N and
Longitude at 68° 58' E. In relative sense it is situated at the western most tip of
Jamnagar district of Kathiawad peninsula of Gujarat, which looks like a Lion’s lower
most jaw.
‘A Study of Tourism in Gujarat: A Geographical Perspective’
238
Dwarka, a city that was known as Dwarawati in Sanskrit literature is one of
the seven most ancient cites of India. The name is derived from the word ‘dwar’ that
means ‘door’ in Sanskrit and significance of the word is the door to Brahma. This is
city was the abode of Lord Shri Krishna. Geographically, Dwarka is small coastal
town situated on tip of the Kathiawad peninsula. It is one of the most sacred sites for
Vaishnavite Hindus. It has the unique distinction of being one of Hinduism’s four
‘Holy Abodes’ as well one of its seven ‘Holy places’, Together with Badrinath in
Uttaranchal, Puri in Orissa and Rameshwaram in Tamil Nadu and also one of the
seven holy Hindu cities. The beaches of Dwarka are good but without any palms for
shade. It sites at the mouth of the river Gomti on the Arabian Sea.
Marine research in early 2002 revealed evidence of a substantial city off the
coast over 100m below current seal level, reviving the debate about the origins of
Dwarka’s off shore archaeological site. The present town is largely 19th century when
the Gaekwad princes developed the town as popular pilgrimage centre. Dwarka is also
the ancient kingdom of Krishna and is believed to have been the first capital of
Gujarat celebrated as Krishna capital after his flight from Mathura, thousands come to
observe Krishna’s birthday and also Holy and Diwali.
Dwarka is famous for the Dwarkadheesh (Krishna) Temple among other
significant historical and religious sites in the area. It is splendidly set on the sea
coast. The exterior of main temple is more interesting. The soaring five exterior of
main temple is more interesting. The soaring five storey shikhara tower is supported
by 60 columns.
Other important sites are the Rukmini temple which is a fine example of 12th
13th century Hindu architecture of Gujarat. It has beautifully carved mandapa
columns, but much else is badly weathered. A Krishna pilgrimage to Dwarka can be
combined with Harshad mata temple, Sudama temple at Porbander, Muldwarka and
Madhavpur temple south of Porbander.
Jagat Mandir or “temple of the Temple” marks the place where the great
grandson of Krishna supposedly built a temple more than 2500 year ago. The present
temple dates from the 15th 16th C and contains a group of several smaller temples. The
Moksha dwara (Gate of the salvation) is the main entrance, while Swarga Dwara
(Gate of Heaven) is the south gate leading to the Gomit River. It is believed that
Mirabai, Krishna’s devote follower, merged with his idol in this temple (Gujarat,
‘A Study of Tourism in Gujarat: A Geographical Perspective’
239
India Tour Guide2011). Janmashtami, the birth anniversary of Krishna is a major
event and thousands of devotees come from all over India and abroad to celebrate.
Sharda Peeth is the first among four Peeths (religious seats) established by
Adi_Shankaracharya (686-718AD) who spent his life reforming Hindu beliefs and
different school of Vedic philosophy around India.
Gomti Ghat, is situated at the mouth of the River. A bath in these waters is
believed to purge the soul. Decorated camels, tea stands and bearded men selling
seashell jewellery by the water add to the ambience. The banks are dotted with
innumerable shrines dedicated to Saraswati, Lakshmi and Samudra (God of the sea).
There are plenty of places to stay around town, including a number of Dharmshalas.
However, the water in this area has a strong undercurrent so it is not safe to swim.
Bet Dwarka is considered the original abode of Krishna. The island was a full
fledged port before Okha developed nearby. With luck you may see dolphins from the
island. There are long stretches of coastline for picnicking and wading.
There are numerous holy shrines in and around Dwarka and Beyt Dwarka
attracts tourists every year. The Dwarkadheesh Temple, Nageshvara Jyotirlinga
Temple, Shrine of Meerabai, Shri Krishna Temple & Hanuman Templein Bet
Dwarka are some of the important religious places of Dwarka. With all the religious
backgrounds, Dwarka has always remained and continues to remain one of the most
visited places of Gujarat.
3) Somnath (Prabhas Patan)
Somnath is located at the coordinate system of longitude i.e, 20° 53' 17" N and
Longitude of 70° 24' 5" E. It is located in the Prabhas Kshetra near Veraval in
Junagadh district of Saurashtra region of west Gujarat.
Geographically, Somnath is a coastal city, situated at the lower tip of the
peninsula of Saurashtra. It has Arabian Sea at one side. The climate in Somnath is
moderate as it is close to the Arabian Sea. The summers are slightly hot, whereas the
winters are mild. Monsoon is always windy and experiences heavy rainfall. The best
season to visit Somnath is from October to March. It is believe that the main temple
was built in gold by the Moon God, Soma, then in silver by the Sun God, Ravi and
after wards in wood by Sri Krishna, later on in 11th century the Solanki Rajputs made
a new temple made of stone. (www.nativeplanet.com/somnath/). The Somnath Temple is
known as "the Shrine Eternal", having been destroyed many times by Islamic kings

‘A Study of Tourism in Gujarat: A Geographical Perspective’
240
and rulers. Somnath has recently becomes a hot spot for pilgrimage tourism. Its beach
is another tourists spot. But this beach is not meant for swimming because the waves
here are quite violent but the beach definitely provides a good experience of being
close to nature and entertainment like camel ride and foods are also available here.
One can definitely enjoy the blend of Portuguese and Saurashtra cuisine and culture in
this place. It was invaded six times and the present temple is the seventh
reconstruction of the original temple.
The main temple Somnath Mahadev Temple, preserves the mythological and
religious heritage of India. People here are very religious and follow all traditions
faithfully. All festivals are celebrated with great enthusiasm. It is the It the first among
the twelve Jyotirlingas shrines of the God Shiva. The temple is considered sacred due
to the various legends connected to it. It is illuminated every evening and the sound
and light show.
Besides, Somnath has other temples like the Sun Temple, which was built in
14th century and has idols of Sun God and his two attendants. Bhalka Tirtha is the
place where Sri Krishna was erroneously shot by Jara, a Bhil hunter and Dehotsarg
Tirtha is the site where Lord Sri Krishna was cremated. Other places to visit are the
Buddhist Sana Cave, Mai Puri Masjid, Veraval and more.
4) Palitana
Palitana is located at the coordinate system of latitude i.e., 21° 28' 8" N and
Longitude of 71° 47' 38" E. Palitana is the place of temples of Jainism which are
located on Shetrunjaya in Bhavnagar district, Gujarat.
Geographically, the Palitana has spectacular location that is the Gulf of
Khambhat is to the south of Shetrunjaya Hills, and Bhavnagar town is to the north of
the hills with the Shetrunji River flowing in between. The Palitana temples are
situated at the twin summits and the saddle linking them. The summit is situated at an
elevation of 2,221 m AMSL. Reaching it involves climbing over 3,750 stone steps.
However during the monsoon season the temples are closed for devotees.
Bhavnager is also home to the Jain temple complexes at Palitana, associated
with the first Tirthankar Adinath, who is believed to have attained enlightenment
here. Some of the temples dated from the 11th C., but due to frequent renovations
hardly anything you see is older than the 16th C. This is the principal pilgrimage
‘A Study of Tourism in Gujarat: A Geographical Perspective’
241
centre for Jains, who come in lacs every month. It has accumulated about 900 temples
in about the same number of years & new temples are still continues to be built.
Palitana was a princely state until independence. Its location on Shetrunjaya
hill has protected it from repeated invasions by Muslims and Rajputs alike. Pilgrims
and tourists must climb more than 3000 steps to the top, where the nine most
important Toonks (clusters of shrines) are located. A few hundred meters short of the
entrance to the main Toonk the path splits. Most people take left bifurcate the shorter
route, but the right path goes to past little visited shrine of Hengar Pir. This is tomb of
the Muslims saint reputed to have protected the site against invasion by other
Muslims. It is now associated with fertility miracles and many childless couples visit
here. For in depth information visit the Shri Vishal Jain Museumat the foot hill before
you climb. It exhibits palm leaf manuscripts, excavated idols, history of Jainism and
important incidents in the life of Lord Mahavira, the founder of Jainism. Some of the
documentation is in English. The nearby Jambudweep Temple presents the Jain
cosmic view. It explains that the earth is not round, that Apollo never went to the
moon and that the sun, moon and stars revolve around the earth. This is called ‘Jain
Mathematics’
The Accommodation facility is well furnished here in the form of
Dharmshalas. However it is mostly reserved for Jains only. It has more than 120
Dharmshalas for Jain pilgrimage purpose. Each of Dharmshalas looks not less than 4-
5 star hotels. There are hotels near the bus stand where other than Jain community can
stay. Food and water is available at the bottom of the hill.
5) Kutch / Bhuj / Mandavi
Bhuj is located between the coordinated system of Latitude i.e., 23° 15' 0" N
and Longitude of 69° 40' 12" E. Mandvi is located at the coordinate system of latitude
i.e., 22° 51' 36" N and Longitude of 69° 23' 24" E. This is a location where river
Rukmavati meets the Gulf of Kutch. It was once major port of the region and summer
retreat for the King of the Kutch.
Kutch is region of environment extremes. It extends from the salty marshes in
the north and east through the grassland of Banni and the central highlands down to
the luxuriant coast along the Gulf of Kutch. During the summer time the sea water
recede back leaving behind a broad swath of saline swamps, otherwise known as the
Rann of Ktuch. When the rain submerged the Rann, the land becomes the virtual

‘A Study of Tourism in Gujarat: A Geographical Perspective’
242
Islands resembling the back of the turtle, which is also called Katcho in local
language and gives the region its name. The coasts and marshlands attract many
migratory and domestic birds including giant flocks of flamingos.
Mandvi, largely a barren land with an elevation of just 15m AMSL, is among
the chief towns of Kutch district. It has nice stretch of blue water. This is a zone up to
100m intertidal zone, sandy beach occupied by fishing settlement. The beaches front
with scrub forest, wasteland and agricultural land. Mandvi beach is also known as
Wind-farm beach due to its frontage with wind farms. Mandvi beach has been
untouched by industries, with exception of wind-farms. It is four centuries old
shipbuilding centre and fortified town with disappeared walls. It also makes for a
good base to explore the southern stretch of Kutch. The beach is the closest to town,
located across the bridge over the river and along the road beyond Salaya near the
Sashi Vishwanath temple. The beach is within the walking distance of the temple.
Further Ravalpir beach about 6km is a serene stretch completely undisturbed by the
development. Mandvi, is home to aournd 300 temples found in various parts of this
town. Most of temples are centered on deities Lord Shiva and the Goddess Kali. Some
major temples to visits include Swami Narayan Temple, Triloknath Temple and
Bhootnath Temple among others. These temples are also monuments under the
protection of the Indian Government.
Bhuj is a beautiful little town with at elevation of 100m above MSL, located
in Kutch district, Gujarat. It was founded in the year 1510 by local ruler, called
Maharao Hamir. Some of parts of Bhuj ruined during the course of time due to
earthquake. The town actually had a rich and vibrant history. Since it was a walled
city, at its prime in history, there were 35 ft high walls and towers that surrounded the
city. Bhuj has got its name from the fortress called Bhuia that overlooks the city from
this nearby hill. Bhuj has witnessed many calamities over a period of time.
Vijay Vilas Palace is the royal summer retreat, was built about 8 km from
main Mandvi beach in 1929 by Vijayrajji. Constructed of red sandstone in the Rajput
style, its rooftop balconies offer a striking view of the surrounding area. Just before
the palace a cottage accommodation constructed between the scrub natural forests
where most of the foreign tourists arrives. For a prominent port and fortress town of
the past, Mandvi’s main tour attraction is the majestic Vijay Vilas Palace, set amidst
the beautiful landscape of manicured gardens with their own water channels and

‘A Study of Tourism in Gujarat: A Geographical Perspective’
243
lavish marble fountains. The surrounding lush gardens are just an appetizer to the
visual treat awaiting visitors to the magnificent palace.
Ramkund is traditional square tank with short flights of steps waltzing down
to the water. It is tucked away inside a narrow alley behind the Ram Dhun temple and
an ideal place for reflection. The walls of the kund have a narrow band of beautifully
carved miniature idols depicting the ten incarnations of Lord Vishnu along with other
deities of the Hindu pantheon.
Kalyaneshwar and Bhimnath Mahadev Temples are dedicated to Lord Shiva.
A small glimpse of Bhuj’s heritage in a series of Shiva temples, a memorial and sati
stones, is curiously nestled between modern development of the city.
The Kutch Museum is Gujarat’s oldest museum, which was renovated after
the earthquake. The Kutch museum depicts the real picture of Kutch traditional
cultural milieu.
The majestic Hamirsar Lake with Rajendrabagh garden jutting in the middle
of it, located in the centre of the Bhuj. In the morning locals come to feed the fish and
birds. The surrounding grove of trees provides refuge from mid-day heat and in the
evening it is thronged by locals of all ages.
Mohammad Pannah Jama Masjid was built in the memory of Saint
Mohammad Pannah who, migrated from Baghdad to Kutch to spread the teachings of
Islam. This original mosque built in the 18th C is now closed due to damage during
earthquake.
Aaina Mahal, also known as palace of mirror was built in 1761 under
Maharao Lakhpatji, a great patron art and culture. He envisioned the mahal as
pleasure retreat. Decorated with resplendent chandeliers, fountains and doors in laid
with ivory and gold, the palace cost 8 million kori to build.
Pragmahal Palace, situated at the same complex as the Aaina Mahal. On the
first floor of this Italian-Gothic masterpiece is the large Darbar hall, ornate with
carved columns and statues. The palace 45 tower stands tall over the Bhuj skyline and
is an architectural marvel.
Old Swaminarayan Temple, represent one of the intricate wooden carvings
coated with vibrant colours characterize this temple, built in 1823. The temple is one
of the original six built during the time of Swami Shahajanand, the founder of the
Swaminarayan region.
‘A Study of Tourism in Gujarat: A Geographical Perspective’
244
Ashapura Temple Built sometime in the mid 16th C the temple honors
Ashapura, the family goddess of the erstwhile royal family.
Naniba Pathshala Maharao Lakhpatji, a patron of poetry founded this
institute in 1749 and welcomed scholars from across India to study the literary form.
Sharadbagh Palace remained the king’s residence until Madan Singh, the last
ruler of Kutch died in 1991. Upon his demise the palace dining hall was converted
into a museum displaying a royal collection of china, stuffed game, handcrafted
showpiece, ivory and coins. Palace is off limits due to damage caused by earthquake.
Bharatiya Sanskariti Darshan Museum, founded by forest service officer,
Ramsinhji Rathod, who had a passion for Kutchi folk are and handicrafts the museum
features an array of artifacts from remote regions of Kutch collected while Rathod
travelled.
6) Ambaji
Ambaji is located at the coordinate system of latitude i.e., 24° 19' 48" N and
longitude at 72° 51' E. In relative sense Ambaji is situated at the Gujarat and Abu road
of Rajasthan border, north of Banaskantha district, Gujarat.
Ambaji is situated on Arasur Hill at an altitude of 480 m, towards the south-
western end of the Aravali Range (meaning ‘line of peaks’), the Ambaji Temple of
flocked by millions of religious tourists every year, especially on full moon night of
Bhadarva. The holy temple of ‘Arasuri Ambaji’, there is no image or statue of
goddess, the holy ‘Shri Visa Yantra’ is worshiped which no one can see with naked
eye. The town is known for its marble quarries and artisans chiseling. Local sells fresh
honey, wax and other forest products. The climate of Ambaji is pleasant throughout
the year. The Kailash Hill is famous for sunset point and for its scenic beauty.
The Ambaji Temple is one of the major Shaktipeethas of 51 in India.
According the mythology the heart of Devi Sati’s body fell at the top of hill of Gabbar
which is the original seat of Amba Mata. The Shrine built of marble has no idol but a
niche with matrix of geometric shapes called vishvoyantra. During Dipawali the
whole Ambaji temple is decorated with lights. It is also mentioned in Mahabharata too
in terms of Pandavas worshiping the Goddess during their exile.
The Gabbar Hill is located near the noted Vedic river Saraswati, on one of the
hills of Arasur, which is located at the hight of 1,600 feet from AMSL. It is a dome
shape steep hill and is very difficult to climb. The Pilgrims have to climb up
circulatory path of 300 stone steps to reach at the top.

‘A Study of Tourism in Gujarat: A Geographical Perspective’
245
The other places of touristic importance are Kamakshi Mandir, Koteshwar,
Kumbharia and Mansarovar
7) Saputara
Saputara is located at the coordinate system of longitude i.e., 20° 34' 47" N
and Longitude of 73° 44' 5" E. It is situated in The Dangs district at the border of
Gujarat and Maharashtra in the south.
Saputara, the only hill station is located on a plateau at an altitude of 1000 m
AMSL, in the Dangs district of the Gujarat. The district is one of the densest forested
areas of the Sahyadri Mountains. The plateau overlooks the green valley stretched
over a length of about 24 km. Saputara helps in the restoration of youthful features to
fluvial landscape amidst the green woods. Its climate is free from city disturbance and
remains constantly pleasant. The summers are also not very hot that is the temperature
does not exceed 28°C. Saputara means the ‘Abode of Serpents’ and a snake image on
the banks of the river Sarpganga which is worshiped by the Adivasis on the festival of
Holi.
Saputara, has been developed as planned hill resort with all required
amenities like parks, hotels, swimming pools, boats, ropeway and a tribal museum to
ensure an enjoyable holiday in Saputara. Although there are only few places of real
interest in town, it is a good base to explore the district and a relaxing stopover for
people travelling by road from Gujarat to Maharashtra. Excursions from Saputara can
be made to the wild life sanctuary in Mahal Bardipara forest.
Gira Waterfalls is breathtakingly beautiful around monsoon, are among the
most picturesque sights in the district. The other places of touristic importance,
includes Gira waterfalls which is 52 km away from saputara.
Girmal water fall is one of the highest waterfalls in Gujarat. It extends to a
height of up to 100 feet. This site is popular among visitors and people of the regions
alike. The water swiftly falls from a great height, creating a fog like condition that’s
eye catching.
The Saputara Museum contains interesting information about the topography
and anthropology of the Dangs. The collection includes stuffed birds, tribal
ornaments, jewelry and musical instruments which represents the basic introduction
of local tribal culture.

‘A Study of Tourism in Gujarat: A Geographical Perspective’
246
Sarpganga Lake is the centre of attraction of the Saputara. One can hire boats
between 8.30 to 18.30 hours.
Artist Village is situated in Gandharvpur on the main road from Saputara to
Nashik. This small marketplace sells local made crafts mostly bamboo-based. One
can also learn warli painting and see live demonstrations of bamboo production. It is
run by Chandrakant Parmar and Surya Goswami.
Other places of Interest includes, the ropeway, which takes around minutes to
cross and offers an aerial view of Saputara & valley below. Besides, Sunrise point,
Eco point, Sunset points offers breath-taking views of the valley. Local community
worships the serpent shrine, Nageshwar Mahadev, on the southern bank of the
Saputara.
8) Ahmedpur Mandvi Beach
Ahmedpur Mandvi is located between the Latitude of 21° 31’ N to Longitude
of 70° 36’ E. Relatively the district is located at the southern most part of the
Junagadh district at the border of Diu Island.
Ahmedpur Mandvi has one of the finest & best coastal stretch unexplored
beaches in Gujarat. It faces the island of Diu across a creek and, continues onward as
Ghogha Beach into the adjoining part of mainland Diu. The place can be visited round
the year, but winter is the best time to venture in this area. One can have Alcohol
drinking excursion next door at Diu. Ideal months are October to March. The climate
is never harsh here. The beach is white and firm, dotted with fishing hamlets, ideal
for long walks and the water perfect for swimming diving etc. A variety of water
sports options are on offer- water scooting, skiing, surfing, parasailing and speed
boating. Private beaches- some of the cottage resorts provide private beaches for
guests. Other facilities include air-conditioned rooms, pleasant lawns, and palm
grooves.
9) Sasan Gir
Sasan Gir (National Park) is located at the coordinate system of latitude i.e.,
21° 8' 8" N and Longitude of 70° 47' 48" E. this is located in Junagadh district, at the
southern most central part of the peninsula. It is spread around 1,412 sq km.
‘A Study of Tourism in Gujarat: A Geographical Perspective’
247
The seven major perennial rivers of the Gir region are Hiren, Shetrunji,
Datardi, Shinghoda, machhundri, Godavari and Raval. The four reservoirs of the area
are at four dams, one each on Hiren, Machhundri, Raval and Shinghoda, including the
biggest reservoir in the area the Kamleshwar Dam, Dubbed ‘the lifeline of Gir’.
During peak summer, surface water for wild animals is available at about 300 water
points. When drought hits the area following a poor rainfall, surface water is not
available at a majority of these points, and water scarcity becomes a serious problem
(mainly in the eastern part of the sanctuary). Ensuring the availability of water during
peak summer is one the major tasks of the forest department staff. Sasan Gir is the
entry point to the sanctuary. The forest has extremely rugged and hilly terrain, which
is of volcanic origin. It is considered the largest dry deciduous forest in western India.
In addition to the Lion there is the jungle cat, hyena, jackal and leopards. There is also
Nilgai, spotted deer, sambar, blackbuck, porcupine and the rarely seen Pangolin.
Gir National Park, a natural habitat for Asiatic lion is the major attraction for
most visitors to Junagadh and the Gir forest its abode. As a result of excessive
hunting, poaching and forest depletion, the lion population was in dramatic decline
before 1965 and the government setup the sanctuary across 1153 sq. km to protect it.
A decade later 258 sq.km inside the sanctuary was declared national park. Currently
the Asiatic lion population in Gujarat numbers about 411 (2011).
Gir Interpretation Zone, Devalia, an Interpretaiton Zone ha been created
within the sanctuary. This is designed to reduce the tourism hazard to the wildlife and
to promote nature education. Within its chained fences, it covers all habitat types and
wildlife of Gir with its feeding-cum-living cages for the carnivores and double-gate
entry system.
10) Dumas Beach
Dumas is located at the coordinate system of latitude i.e., 21° 4' 45" N and
Longitude of 72° 42' 55" E. Relatively positioned along the Arabian Sea at south west
of Surat city.
Dumas beach is an urban beach along the Arabian Sea located 21 km
southwest of Surat City in Indian state of Gujarat. This beach is famous for its black
sand. It is a popular tourist destination in south Gujarat.
Apart from the beach, places of interest at Dumas including the Dariya
Ganesh Temple locate adjacent to the main beach. The promenade has several shops

‘A Study of Tourism in Gujarat: A Geographical Perspective’
248
selling Indian snacks. Dumas beach is a popular beach destination in Surat which is
calm and scenic beach attracts attention of tourists. Tourists coming from outside
Gujarat can take accommodation and unwind themselves there. Many local tourists
visit this charming beach on the weekend to enjoy the sparkling surroundings of the
seashore and get the fresh air. Due to its fresh air, it is known as best place for the
cure of tuberculosis. Dumas beach is among ten most haunted beaches in India.
The other places near Dumas which are also equally important are Tithal
beach, Ubharat beach & Suvali beach.
Map-53- Map Showing Surveyed Sample Tourist Places
8.3 STATUS OF TOURISM AT SURVEYED DESTINATIONS
This part includes the analysis of the available data for surveyed destinations
collected from secondary sources. For the study purpose I have chosen ten most
important tourist locations for sample study & collected required data personally from
the field. The figures which presented here are surveyed by GITCO. The organization
has surveyed many more places but as for research purpose I have selected ten
destinations for sample study. It will be better to analyze first the available
organization secondary data before going for sample surveyed figures and facts. In
‘A Study of Tourism in Gujarat: A Geographical Perspective’
249
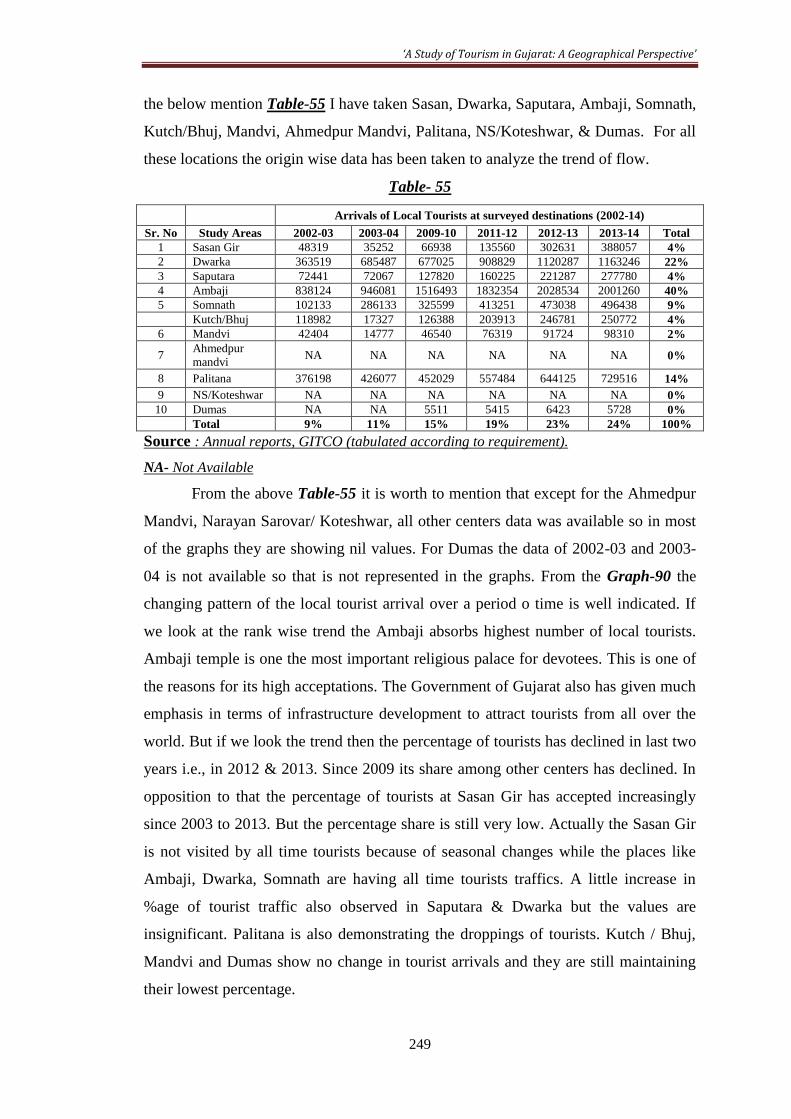
the below mention Table-55 I have taken Sasan, Dwarka, Saputara, Ambaji, Somnath,
Kutch/Bhuj, Mandvi, Ahmedpur Mandvi, Palitana, NS/Koteshwar, & Dumas. For all
these locations the origin wise data has been taken to analyze the trend of flow.
Table- 55
Arrivals of Local Tourists at surveyed destinations (2002-14)
Sr. No Study Areas 2002-03 2003-04 2009-10 2011-12 2012-13 2013-14 Total
1 Sasan Gir 48319 35252 66938 135560 302631 388057 4%
2 Dwarka 363519 685487 677025 908829 1120287 1163246 22%
3 Saputara 72441 72067 127820 160225 221287 277780 4%
4 Ambaji 838124 946081 1516493 1832354 2028534 2001260 40%
5 Somnath 102133 286133 325599 413251 473038 496438 9%
Kutch/Bhuj 118982 17327 126388 203913 246781 250772 4%
6 Mandvi 42404 14777 46540 76319 91724 98310 2%
7 Ahmedpur
mandvi NA NA NA NA NA NA 0%
8 Palitana 376198 426077 452029 557484 644125 729516 14%
9 NS/Koteshwar NA NA NA NA NA NA 0%
10 Dumas NA NA 5511 5415 6423 5728 0%
Total 9% 11% 15% 19% 23% 24% 100%
Source : Annual reports, GITCO (tabulated according to requirement).
NA- Not Available
From the above Table-55 it is worth to mention that except for the Ahmedpur
Mandvi, Narayan Sarovar/ Koteshwar, all other centers data was available so in most
of the graphs they are showing nil values. For Dumas the data of 2002-03 and 2003-
04 is not available so that is not represented in the graphs. From the Graph-90 the
changing pattern of the local tourist arrival over a period o time is well indicated. If
we look at the rank wise trend the Ambaji absorbs highest number of local tourists.
Ambaji temple is one the most important religious palace for devotees. This is one of
the reasons for its high acceptations. The Government of Gujarat also has given much
emphasis in terms of infrastructure development to attract tourists from all over the
world. But if we look the trend then the percentage of tourists has declined in last two
years i.e., in 2012 & 2013. Since 2009 its share among other centers has declined. In
opposition to that the percentage of tourists at Sasan Gir has accepted increasingly
since 2003 to 2013. But the percentage share is still very low. Actually the Sasan Gir
is not visited by all time tourists because of seasonal changes while the places like
Ambaji, Dwarka, Somnath are having all time tourists traffics. A little increase in
%age of tourist traffic also observed in Saputara & Dwarka but the values are
insignificant. Palitana is also demonstrating the droppings of tourists. Kutch / Bhuj,
Mandvi and Dumas show no change in tourist arrivals and they are still maintaining
their lowest percentage.

‘A Study of Tourism in Gujarat: A Geographical Perspective’
250
Graph -90
Table- 56
Arrivals of OIS Tourists at surveyed destinations (2002-14)
Sr. No Study Areas 2002-03 2003-04 2009-10 2011-12 2012-13 2013-14 Total
1 Sasan Gir 9322 8479 13686 31660 83741 88615 3%
2 Dwarka 169721 386916 370217 523833 647201 675846 35%
3 Saputara 27390 24922 40382 43436 77298 104721 4%
4 Ambaji 29121 33210 209085 189853 187527 275832 12%
5 Somnath 21746 63746 52689 83083 113123 113014 6%
Kutch/Bhuj 31165 16873 62716 68434 109896 131236 30%
6 Mandvi 37872 20199 22157 21156 27893 24150 2%
7 Ahmedpur
Mandvi 0 0 0 0 0 0 0%
8 Palitana 49916 70219 84909 137404 147111 149279 8%
9 NS/Koteshwar 0 0 0 0 0 0 0%
10 Dumas 0 0 133 206 292 161 0%
Total 5% 8% 11% 14% 18% 20% 100%
Source : Annual report, GITCO (tabulated according to requirement).
NA- Not Available
The above Table-56 represents the annual change in the number of tourist
arrivals from other Indian states for all ten influential locations. From the Graph-91 it
is clear that Dwarka is the most favourable tourist place for the tourists from other
Indian states. The temple of Dwarka has an international significance and one of the
paramount centres for tourism. As compare to local tourist the outside state tourist are
well flourished there. If we look at the year wise change (from 2002-13) of tourists
then it maintains its percentage share among all others. Other than Dwarka places like
Sasan Gir, Saputara, Ambaji, Kutch / Bhuj and Somnath also has shown some
increase in OIS tourists in the state. Mandvi & Palitana has shown marginal
declination in terms of OIS tourists. Over and all we can say that still so many tourists
places are not well known or marketed outside to Gujarat. Besides Dwarka, Ambaji &
Palitana is the second & Third favourable place for the OIS tourists.

‘A Study of Tourism in Gujarat: A Geographical Perspective’
251
Graph -91
Table- 57
Arrivals of NRI’s Tourists at surveyed destinations (2002-14) Sr. No Study Areas 2002-03 2003-04 2009-10 2011-12 2012-13 2013-14 Total
1 Sasan Gir 720 1009 2000 3534 8157 9417 16%
2 Dwarka 845 422 292 1428 146 2647 4%
3 Saputara 39 0 327 675 600 31 1%
4 Ambaji 3829 0 9735 10103 10385 9808 29%
5 Somnath 145 2206 3188 3553 4295 4049 12%
Kutch/Bhuj 260 2 556 2856 3002 4899 8%
6 Mandvi 147 NA 0 436 304 419 1%
7 Ahmedpur
mandvi 0 0 0 0 0 0
0%
8 Palitana 1803 2753 8633 13513 12809 11566 29%
9 NS/Koteshwar 0 0 0 0 0 0 0%
10 Dumas 0 0 0 0 60 0 0%
Total 5% 4% 16% 24% 26% 28% 100% Source : Annual reports, GITCO (tabulated according to requirement).
NA- Not Available
The Table-57 is drawn to show annual change in arrival of NRI tourists at ten
influential destinations. Accordingly the comparative multiple bar graphs are
prepared to show the figures at a glance. From the Graph-92 it can be said that the
most preferable place for NRI’s are Ambaji, Palitana and Sasan Gir. But except Sasan
Gir no other tourists places are showing increasing trend in NRI tourists. If we look at
the graph it is clear that Sasan Gir has shown high increase in 2012-14 as compare to
2002-03. Ambaji is representing a declining trend in NRI growth since 2009. The
growth of NRI tourists are also observed in Kutch / Bhuj. The main reason for this
glorious inflow might be credited to the ‘Rannotsav’ at White Rann organized by
Gujarat Tourism Department. The fluctuating Arrival of NRI’s are observed at
Somnath which since 2011 shows minor decline in 2013. Dwarka also shows alternate
change in tourist arrivals. Palitana is the only place where the boom of NRI’s are
seen. This might be because of Jain’s who are mostly living out of the country and

‘A Study of Tourism in Gujarat: A Geographical Perspective’
252
visiting Palitana every year so high growth becomes obvious. The cleanliness and
well organized services for Jain’s make this place more attractive.
Graph -92
Table- 58
Arrivals of Foreign Tourists at surveyed destinations (2002-14)
Sr. No Study Areas 2002-03 2003-04 2009-10 2011-12 2012-13 2013-
14 Total
1 Sasan Gir 614 558 762 1777 3474 3020 9%
2 Dwarka 2840 2996 1384 2398 2804 2141 13%
3 Saputara 13 12 48 30 0 0 0%
4 Ambaji 0 0 0 0 0 0 0%
5 Somnath 6 7 378 675 270 220 1%
Kutch/Bhuj 1995 452 8606 17108 11928 17106 49%
6 Mandvi 718 703 1245 1764 827 539 5%
7 Ahmedpur
mandvi 0 0 0 0 0 0
0%
8 Palitana 3986 6267 3575 3679 5008 4159 23%
9 NS/Koteshwar 0 0 0 0 0 0 0%
10 Dumas 0 0 0 0 0 0 0%
Total 9% 9% 14% 24% 21% 23% 100%
Source : Annual Report, GITCO (tabulated according to requirement).
NA- Not Available
The above Table-58 represents annual change in foreign tourist arrivals at pre-
identified ten destinations. The table, itself indicates that most of the tourist locations
are blank of foreign tourists. From the Graph-93 it can be said that Kutch/ Bhuj are
the most appreciable location where foreigners would prefer to visit. Since 2009 there
is a record of high growth of foreigners which is a good sign of future prosperity.
Besides, Sasan Gir also has shown a considerable rise from 2002 to 2012, which also
declined according to data of 2013. Rest, other centers are showing recessive growth
in terms of foreign tourist. A seesaw scene is observed at Palitana tourist centre over a
period of time. Except 2003-04 none of the period shows high increase of foreigners.
Mandvi and Somnath also indicate sharp recession. Dwarka shows a considerabler

‘A Study of Tourism in Gujarat: A Geographical Perspective’
253
rise in 2002-04 and in 2012 but recently again declined. One of the worst status
observed in Ambaji, Saputara, Ahmedpur Mandvi, NS Sarovar/Koteshwar and Dumas
which are looking nowhere in the picture. If they are then are pointless.
Graph -93
Graph -94
Graph-94 (Pie Chart) represents the total tourist arrival at sample locations in
Gujarat. If we look at the total percentage figure then only Ambaji shows highest
percentage (32%) of tourist arrivals. From the above discussions it can be inferred that
this situation arise because of arrivals of local and NRI’s tourists at Ambaji which are
greater in their numbers. The second positioned centre is Dwarka which accounts for
24% of total tourist arrivals. Palitana, Kutch & Somnath are the third, fourth & fifth
positioned powerful centers for tourists. Besides, NS/Koteshwar, Saputara and
Mandvi are sharing less than 5% of overall tourists. Dumas is nowhere in the scene.
Over and all going through all above discussions it can be said that the religions
purpose tourism is more dominant than any other purpose in these sample locations.
4%
24%
4%
32%
8%
10%
2%
12%4%
0%
TOTAL TOURIST ARRIVALS AT SAMPLE LOCATIONSSasan Gir
Dwarka
Saputara
Ambaji
Somnath
Kutch/Bhuj
Mandvi
Palitana
NS/Koteshwar
Dumas
GUJARAT
(2002-14)
‘A Study of Tourism in Gujarat: A Geographical Perspective’
254
This might be because of over dominance of local (within Gujarat) tourist arrivals in
the state.
8.4 GEOGRAPHICAL PERSPECTIVE: FOREIGN TOURISTS
This part of the chapter includes the tabulation and graphical representations
of the collected data during field survey. Since my study area incorporate the whole
Gujarat, it was not possible to survey all destinations. So looking to the time & area
constraints I have selected ten most determined tourist locations in Gujarat as for my
sample study. As per chapter-5, Table-15, I have given a systematic classification of
forms of tourism in Gujarat. Four main forms has been taken into considerations i.e.,
Hill, Coastal, Plain and Miscellaneous tourism. Under main headings various sub
headings are notified i.e., Hill Stations, Religious sites, Nature based tourism,
Heritage, coastal sites, village base and wildlife tourism. To know the role of
geographical components, problems and prospects of tourism in Gujarat I have
assorted one target from each sub headings. Under this sub chapter I have surveyed
foreign tourist by questionnaire method at each of ten locations during my field visits.
Since the questionnaire was too long so not all the questions are answered. Various
attributes has been taken to find out the main factors of tourism attraction for that
particular places. Some of the questions are pertaining to general views and some are
on particular. Later for the final outcome the data was tabulated on the basis of
frequency of tourists favouring particular attributes. Total five tourists were surveyed
at each location so total 50 questionnaires were filled up. We will be discussing all
these indicators and their outcomes as per responded by the foreign tourists.
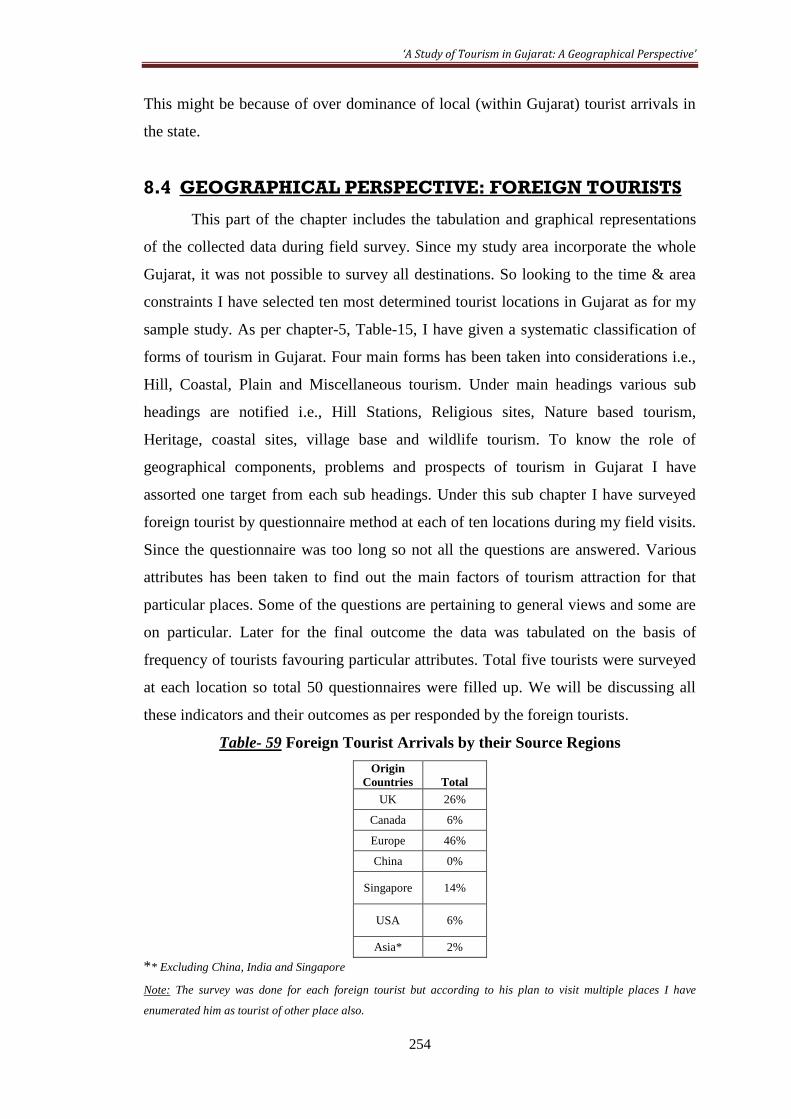
Table- 59 Foreign Tourist Arrivals by their Source Regions
Origin
Countries Total
UK 26%
Canada 6%
Europe 46%
China 0%
Singapore 14%
USA 6%
Asia* 2%
** Excluding China, India and Singapore
Note: The survey was done for each foreign tourist but according to his plan to visit multiple places I have
enumerated him as tourist of other place also.
‘A Study of Tourism in Gujarat: A Geographical Perspective’
255
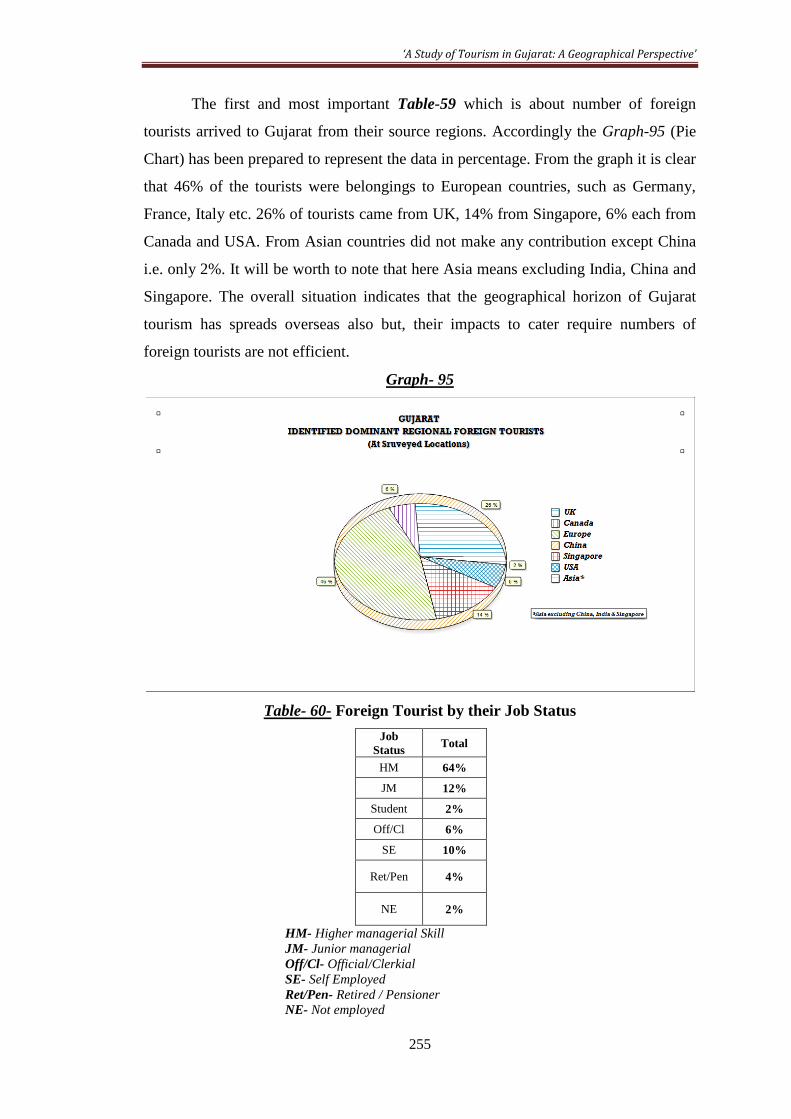
The first and most important Table-59 which is about number of foreign
tourists arrived to Gujarat from their source regions. Accordingly the Graph-95 (Pie
Chart) has been prepared to represent the data in percentage. From the graph it is clear
that 46% of the tourists were belongings to European countries, such as Germany,
France, Italy etc. 26% of tourists came from UK, 14% from Singapore, 6% each from
Canada and USA. From Asian countries did not make any contribution except China
i.e. only 2%. It will be worth to note that here Asia means excluding India, China and
Singapore. The overall situation indicates that the geographical horizon of Gujarat
tourism has spreads overseas also but, their impacts to cater require numbers of
foreign tourists are not efficient.
Graph- 95
Table- 60- Foreign Tourist by their Job Status
Job
Status Total
HM 64%
JM 12%
Student 2%
Off/Cl 6%
SE 10%
Ret/Pen 4%
NE 2%
HM- Higher managerial Skill
JM- Junior managerial
Off/Cl- Official/Clerkial
SE- Self Employed
Ret/Pen- Retired / Pensioner
NE- Not employed
‘A Study of Tourism in Gujarat: A Geographical Perspective’
256
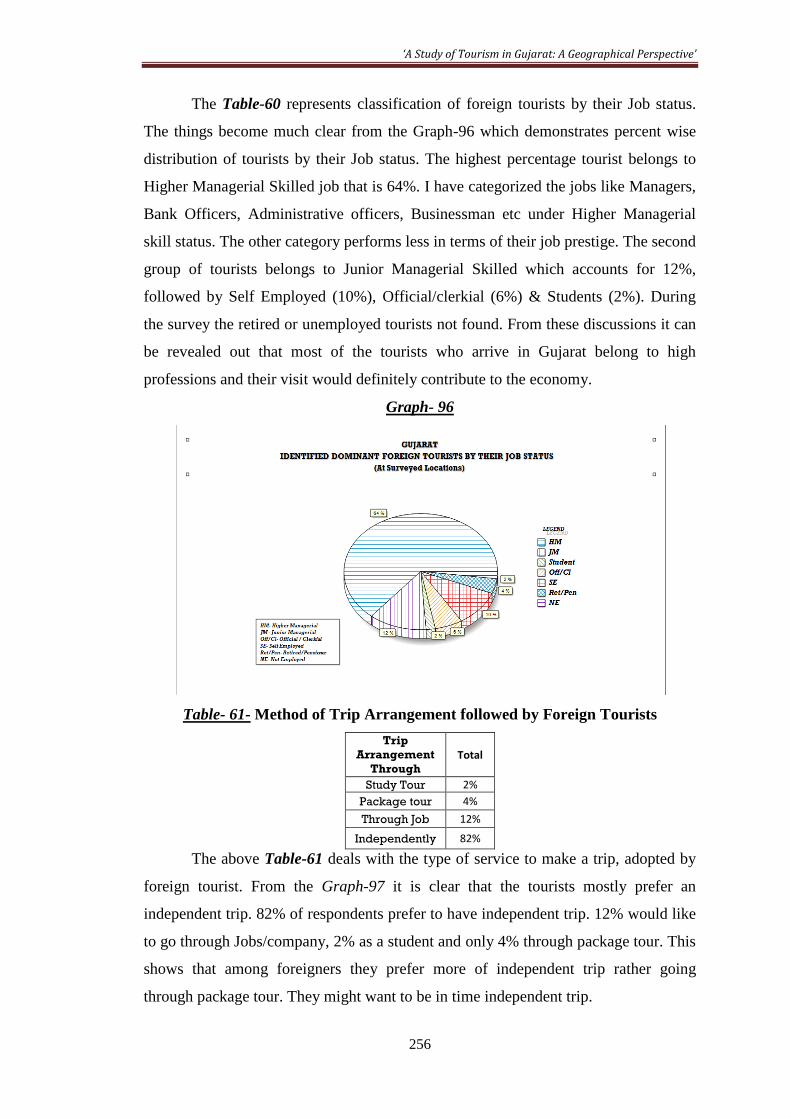
The Table-60 represents classification of foreign tourists by their Job status.
The things become much clear from the Graph-96 which demonstrates percent wise
distribution of tourists by their Job status. The highest percentage tourist belongs to
Higher Managerial Skilled job that is 64%. I have categorized the jobs like Managers,
Bank Officers, Administrative officers, Businessman etc under Higher Managerial
skill status. The other category performs less in terms of their job prestige. The second
group of tourists belongs to Junior Managerial Skilled which accounts for 12%,
followed by Self Employed (10%), Official/clerkial (6%) & Students (2%). During
the survey the retired or unemployed tourists not found. From these discussions it can
be revealed out that most of the tourists who arrive in Gujarat belong to high
professions and their visit would definitely contribute to the economy.
Graph- 96
Table- 61- Method of Trip Arrangement followed by Foreign Tourists
Trip
Arrangement
Through
Total
Study Tour 2%
Package tour 4%
Through Job 12%
Independently 82%
The above Table-61 deals with the type of service to make a trip, adopted by
foreign tourist. From the Graph-97 it is clear that the tourists mostly prefer an
independent trip. 82% of respondents prefer to have independent trip. 12% would like
to go through Jobs/company, 2% as a student and only 4% through package tour. This
shows that among foreigners they prefer more of independent trip rather going
through package tour. They might want to be in time independent trip.

‘A Study of Tourism in Gujarat: A Geographical Perspective’
257
Graph- 97
Table- 62- Type of Tourism Base Preferred By Foreign Tourists
Type of tourism preferred Total
Nature 76%
Urban 10%
Rural 14%
E/S/P- Entertainment / Sport/ Pleasure
C/F/F- Cultural / Festivals/ Fairs
P/M/W etc- Personal / Medical / Wedding etc
Table -62 & Graph-98, depicts their strength of choice to visit Gujarat. 76% of
tourists prefer to have Nature base tourism. One of the tourists visualizes that they
would like to watch more natural and Historical things rather sticking to congested
urban corners. Linking to this 14% of them indicated more of rural tourism while only
10% belongs to urban tourism kind.
Graph- 98

‘A Study of Tourism in Gujarat: A Geographical Perspective’
258
Table- 63- Motivational Factors behind Trip to Gujarat by Foreign Tourist
Main Motives Total
Business 2%
Leisure 6%
E / S / P 20%
C / F / F 30%
Religious 6%
Educational 2%
Conventional 22%
P / M / W 0%
Shopping 0%
Site Seeing 12% E/S/P- Entertainment / Sport/ Pleasure, C/F/F- Cultural / Festivals/ Fairs, P/M/W etc- Personal / Medical /
Wedding etc
Table-63 is been formulated to show the main motivational factor behind
making to trip to Gujarat. Total ten motives were selected according to specialty of
the state. Graph-99 indicates about percentage share of each motivations aspect. 30%
of respondents made a trip for its cultural / festivals and fairs. According to their view
India (Gujarat) is full of colourful life style. People enjoy all cultural / fairs and
festivals at its fullest level which is not found in any part of the world. Gujarat is also
having rich cultural heritage in terms of its variety of culture, fairs and festivals. 22%
tourists are motivated by conventional tourism which represents important markets at
international level. Government is developing essential infrastructures and services
like amphitheatres, Molls, exhibitions, lodgings, restaurants, language translations
services for conventional tourism growth. 20% tourists prefer entertainment, sport and
pleasure services which are now in priority factors outset by the state government.
12% respondents are motivated by site seeing tourism. Besides, leisure & religious
inducted 6% each, business and educational 2% each. Over and all the nature cultural
& conventional based tourism are the main motivational factors which attract large
number of foreign tourists.
Graph- 99
‘A Study of Tourism in Gujarat: A Geographical Perspective’
259
Table- 64- Favourable Time Preferred by Foreign Tourists
Favourable time
of travel Total
Summer 2%
Winter 72%
Post Monsoon 26%
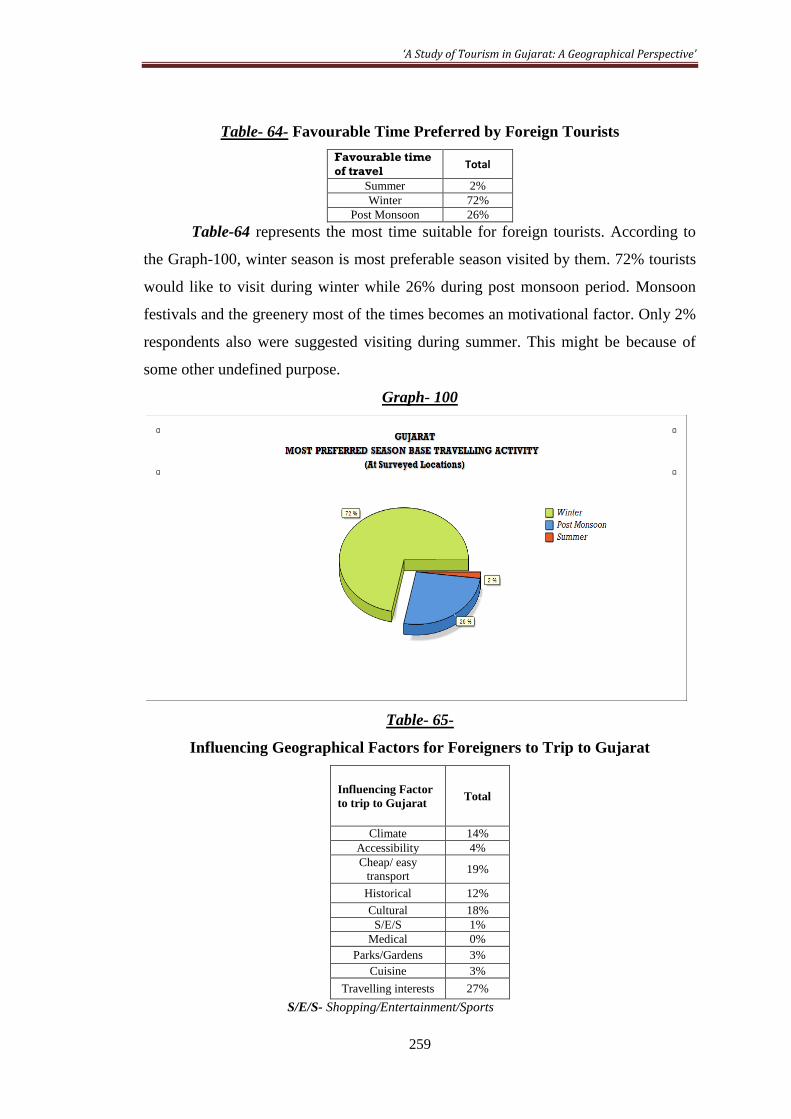
Table-64 represents the most time suitable for foreign tourists. According to
the Graph-100, winter season is most preferable season visited by them. 72% tourists
would like to visit during winter while 26% during post monsoon period. Monsoon
festivals and the greenery most of the times becomes an motivational factor. Only 2%
respondents also were suggested visiting during summer. This might be because of
some other undefined purpose.
Graph- 100
Table- 65-
Influencing Geographical Factors for Foreigners to Trip to Gujarat
Influencing Factor
to trip to Gujarat Total
Climate 14%
Accessibility 4%
Cheap/ easy
transport 19%
Historical 12%
Cultural 18%
S/E/S 1%
Medical 0%
Parks/Gardens 3%
Cuisine 3%
Travelling interests 27%
S/E/S- Shopping/Entertainment/Sports

‘A Study of Tourism in Gujarat: A Geographical Perspective’
260
Table-65 represents the main geographical ingredients which has impulses
him to make a trip to Gujarat. The graphical representation of the data (Graph-101)
reveals that individual travelling interests is the main factor on which 27% of tourists
agreed. 19% of tourists given this credit to cheap & easy availability of transportation
methods, however the quality of transport was not satisfactory. 18% influenced by the
cultural variety of Gujarat. 14% were here to enjoy cool and mild climate of the state.
12% of respondent credited this to the Historical accomplishments of the state. 4%
were saying about easy accessibility, 3% like cuisine, 3% like parks and gardens
while only 1% indicated about entertainment, sports etc. Over and all the Travelling
interest, transport, cultural, climatic and historical accomplishments are the five top
geographical factors which influence tourists a lot.
Graph-101
Table- 66- Frequency of Visit by a Foreign Tourist to Make a Trip to Gujarat
Frequency
of visit Total
First time/ 80%
Earlier too 20%
Table-66 represents frequency of visit by respondents to Gujarat. Graph-102
indicates that 80% of tourists have visited Gujarat first time while 20% have visited
earlier too. This indicates that percentage of satisfaction among tourists visited is very
low. The tourism products which are provided in the state are not much of the
desirable type.

‘A Study of Tourism in Gujarat: A Geographical Perspective’
261
Graph- 102
Table- 67- Rating of Facilities Availed by Foreign Tourists
Rating
of
facilities
Total
Poor 38%
Average 60%
Good 2%
Table-67 shows three point scale rating of facilities / services availed by
foreign tourists. From the Graph-103 it can be said that 60% of tourists has rated
average services which is not up to the mark. 38% has rated it poor facilities / services
provided during their stay. Only 2% of them has rated good services achieved. Most
of them has indicated that facilities are there but now of up to the standard level and
that is because of poor maintenance and wrong management.
Graph- 103
‘A Study of Tourism in Gujarat: A Geographical Perspective’
262
Table- 68- Best Experienced Tourism Product Enjoyed by Foreign Tourists
Best experience
of Trip to
Gujarat
Total
Transport 16%
Accommodation 12%
Hospitality of
locals 58%
Value of your
money 14%
variety 0%
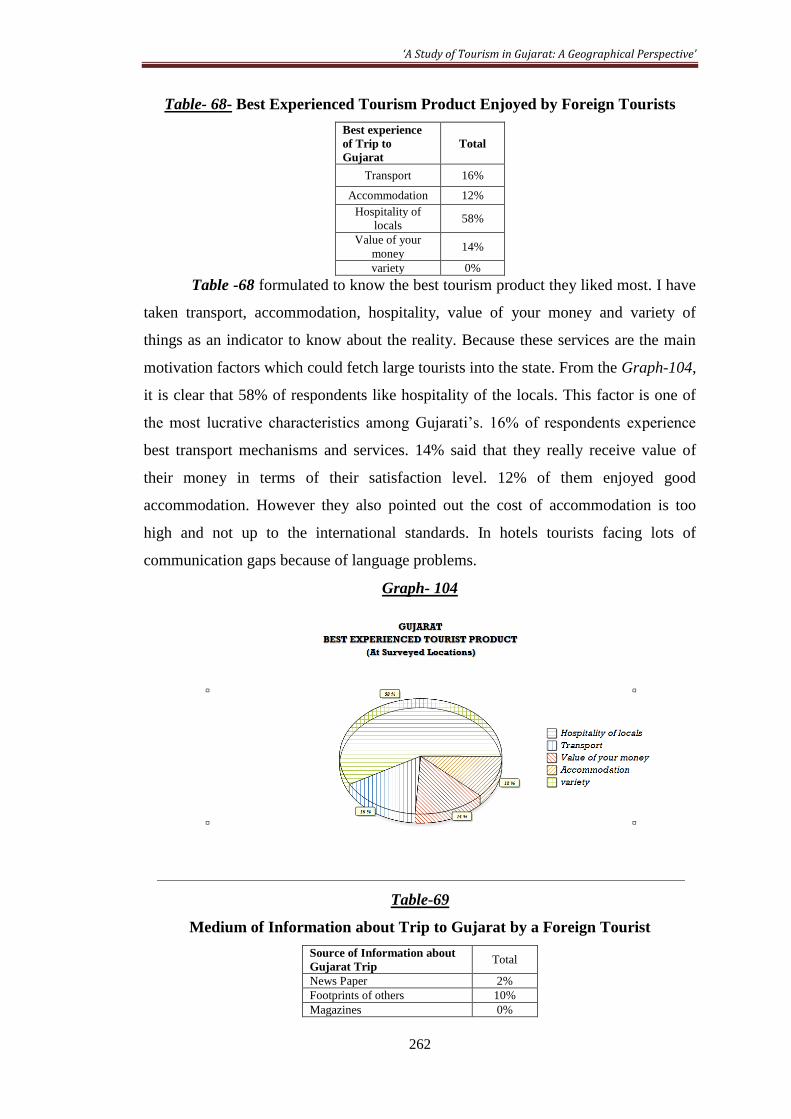
Table -68 formulated to know the best tourism product they liked most. I have
taken transport, accommodation, hospitality, value of your money and variety of
things as an indicator to know about the reality. Because these services are the main
motivation factors which could fetch large tourists into the state. From the Graph-104,
it is clear that 58% of respondents like hospitality of the locals. This factor is one of
the most lucrative characteristics among Gujarati’s. 16% of respondents experience
best transport mechanisms and services. 14% said that they really receive value of
their money in terms of their satisfaction level. 12% of them enjoyed good
accommodation. However they also pointed out the cost of accommodation is too
high and not up to the international standards. In hotels tourists facing lots of
communication gaps because of language problems.
Graph- 104
Table-69
Medium of Information about Trip to Gujarat by a Foreign Tourist
Source of Information about
Gujarat Trip Total
News Paper 2%
Footprints of others 10%
Magazines 0%
‘A Study of Tourism in Gujarat: A Geographical Perspective’
263
TCGL 40%
TV/Adds 20%
IM 24%
GB (if any) 0%
Exhibition 2%
Brochures of TO/Agents 0%
Own Previous Experience 2%
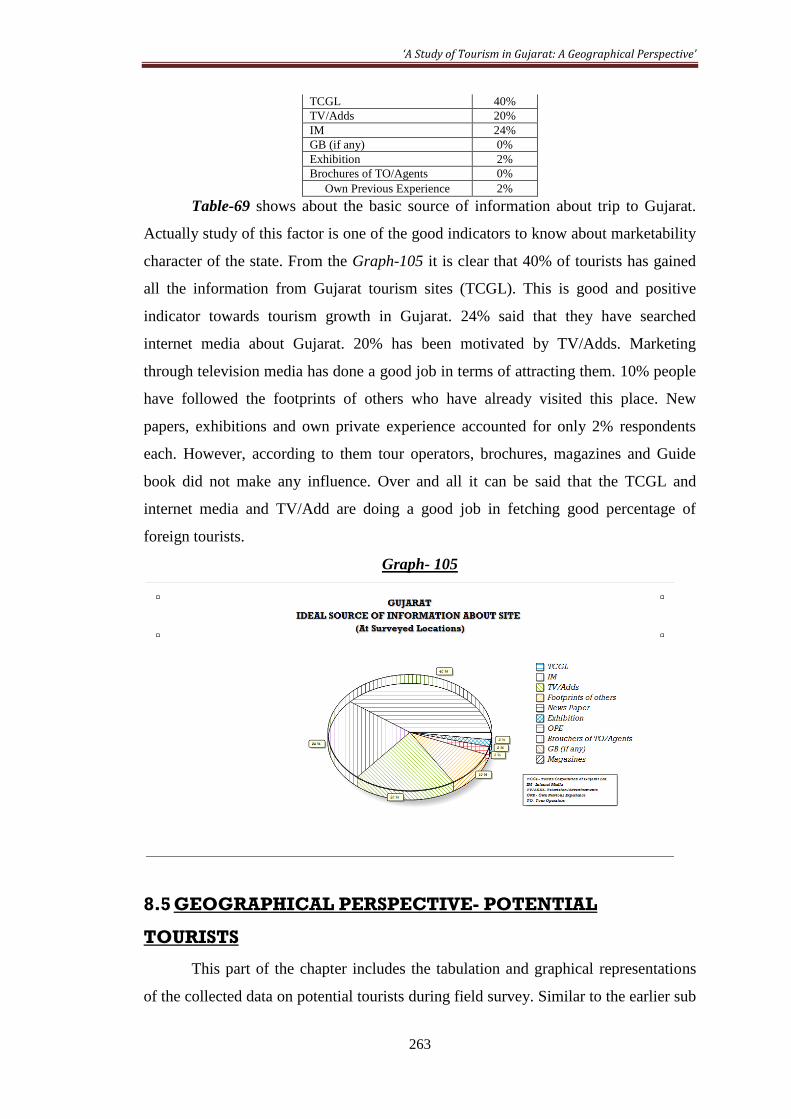
Table-69 shows about the basic source of information about trip to Gujarat.
Actually study of this factor is one of the good indicators to know about marketability
character of the state. From the Graph-105 it is clear that 40% of tourists has gained
all the information from Gujarat tourism sites (TCGL). This is good and positive
indicator towards tourism growth in Gujarat. 24% said that they have searched
internet media about Gujarat. 20% has been motivated by TV/Adds. Marketing
through television media has done a good job in terms of attracting them. 10% people
have followed the footprints of others who have already visited this place. New
papers, exhibitions and own private experience accounted for only 2% respondents
each. However, according to them tour operators, brochures, magazines and Guide
book did not make any influence. Over and all it can be said that the TCGL and
internet media and TV/Add are doing a good job in fetching good percentage of
foreign tourists.
Graph- 105
8.5 GEOGRAPHICAL PERSPECTIVE- POTENTIAL
TOURISTS
This part of the chapter includes the tabulation and graphical representations
of the collected data on potential tourists during field survey. Similar to the earlier sub

‘A Study of Tourism in Gujarat: A Geographical Perspective’
264
chapter 8.3 I have selected ten most determined tourist locations in Gujarat as for my
sample study. Under this I have surveyed potential tourists by questionnaire and
personal interview method at each of ten locations during my field visits. The basic
thing from this study was to find out the frequency of their visit, problems faced and
suggestions to resolve all those problems. Some of the questions are pertaining to
general views and some are on particular. Later for the final outcome was represented
in the form of tables and graphs. Qualitative explanations also done where, the
quantification of the data could not be possible. At each location ten questionnaires
were filled up. Accordingly at ten locations total 100 questionnaires were filled up.
We will be discussing all these outcomes as per responded by a potential tourist. A
potential tourist is that person who does not only visit the destination but also stay
there at least for 24 hours and utilize all services available there and in turn contribute
in economic, social and cultural development of the destination without getting any
kind of monitory benefit.
Table- 70
Surveyed
Tourist
Places
Awareness about
Gujarat’s tourist
places
Yes No
Total 74% 26%
In the Table-70, the awareness level about Gujarat’s tourist places has been tabulated.
Two scale parameters are chosen to find out the awareness. Graph-106 is the direct
representation of the table. 74% of respondents answered yes while 26% said no. We
can say that the level of perception is showing positive result.
Graph- 106
Percentage Share of Tourists by Prior Knowledge about Gujarat as a Tourist Place

‘A Study of Tourism in Gujarat: A Geographical Perspective’
265
Table- 71
Surveyed
Tourist
Places
Preferred Duration of Stay at Sample Locations by Tourists
Less than
24 Hours
1-3
days
4-6
days
7-8
days Longer Undecided
Total 44% 50% 3% 1% 0% 2%
The Table-71 is representing the status of preference to stay number of days at
the destination. From the Graph-107, it is clear that 50% of tourists prefer to stay 1-3
days, which means it is a positive sign of prosperity of that particular place. 44% of
tourists would not like to stay even for 24 hours. They arrive early in the morning and
by evening they depart back. These types of tourists are classified as leisure tourists.
Our potential tourists are those who stay at least 24 hours at the destination. Only 3%
of them are staying 4-6 days, 2% 7-8 days and 2% response was undecided. No
tourists agreed to stay longer duration. Longer the day of stay higher will the level of
potentiality of a tourist. Most of the times during survey I have seen that tourists
would not like to stay at most of the locations, might be because of costly
accommodations or less variety of things available to watch at the place of
destination.
Graph- 107
Table- 72
Surveyed
Tourist
Places
Job Status of Tourists Enumerated During the Survey at Sample Locations
Higher
Managerial,
Adm. or
Professional
Junior
Managerial
Skilled
Worker
Self
Employed Student
Pensioner
/ Not
employed
Total 46% 23% 10% 12% 5% 4%

‘A Study of Tourism in Gujarat: A Geographical Perspective’
266
Table-72 is drawn to show the job status of the potential tourist. The things
become much clear from the Graph-108, which demonstrates percent wise
distribution of potential tourists by their Job status. The highest percentage tourist
belongs to Higher Managerial Skilled job that is 46%. I have categorized the jobs like
Managers, Bank Officers, Administrative officers, Businessman etc under Higher
Managerial skill status. The other category performs less in terms of their job prestige.
The second group of tourists belongs to Junior Managerial Skilled which accounts for
23%, followed by Self Employed (12%), skilled worker (10%), Students (5%) &
retired professionals which accounts for only 4%. From these discussions it can be
revealed out that most of the tourists who arrive in Gujarat belong to high professions
and their visit would definitely contribute to the economy. The percentage of tourist I
have surveyed mostly belongs to higher, Junior managerial skilled. Very little
respondents were belonging to students and retired professionals. From above
discussion it can be concluded that education base tourism is not well developed in
the state.
Graph- 108
Table- 73
Preferred Common Places Visited in India Other than Gujarat
Surve
yed
Places
Rajast
han
Uttara-
khan
d
Goa Diu Mahar
ashtra
Karn
ataka UP
New
Del
hi
Kash
mir MP
Ori
ssa
Kera
la
Nor
th East
Tamil
Nad
u
Andhra
Prade
sh
Total 10% 8% 9% 9% 10% 2% 5% 4% 3% 12% 1% 18% 1% 6% 1%

‘A Study of Tourism in Gujarat: A Geographical Perspective’
267
The Table-73 represents the data for number of tourist places visited by an
individual tourist in his life time within India. On the basis of answers from sample
respondents the data has been represented in the form of graph. From the Graph-109
it is clear that the most preferable tourist point for them in India is Kerala which was
favourable among largest number of respondents. Madhya Pradesh has been placed at
second position in terms of preferred places for tourism. Rajasthan and Maharashtra
has been places and third and fourth positions among them. Goa and Diu are at fifth
position. If we look at the five most admirable tourist places then the states can be
ranks as Kerala, MP, Rajasthan, Maharashtra, Goa and Diu are the six most popular
place among them. Other states like Uttarakhand, Tamil Nadu, UP, New Delhi,
Kashmir, Karnataka places under lower percentage. While the other mentioned places
are least preferred location for tourism.
Graph- 109
Table- 74
Preferred Tourist Places Visited by Tourists in Gujarat
PREFERRED
COMMON TOURIST
PLACES
Gir
Forest/Gi
rnar
Dwarka
Somnath
Saput
ara/A
hwa
Ambaji
Kutch
/Bhuj/wt
rann
NS
Koteshw
ar
Aks
hard
ham
Palitana
Ahm
edab
ad
Patan
Ahmedpu
r
mandvi
pav
aga
dh
Total 57 54 54 43 41 34 32 27 22 18 16 15 14
PREFERRED COMMON
TOURIST
PLACES
man
dvi
BT
dwarka/m
ul
dwar
ka
Vad
odara
Modh
era
Ubh
rat
Lotha
l
Nals
arovar
Dum
as
Tith
al SSD
Unz
ha /
Bahuch
araji
Dak
or
Sur
at vapi
Total 13 12 11 11 9 8 8 8 7 7 6 6 5

‘A Study of Tourism in Gujarat: A Geographical Perspective’
268
PREFERRED
COMMON
TOURIST PLACES
Virp
ur
sidh
pur
Sara
npur
Nares
war/G
alteswar
Kabi
rvad/
bhar
uch
Wilso
n Hill
Porbanda
r
Bag
dana (Bha
vnag
ar)
Rata
nmal
Vadt
al
San
khe
swar
Del
wada
Kan
dla
Total 4 4 4 2 2 2 2 2 1 1 1 1 1
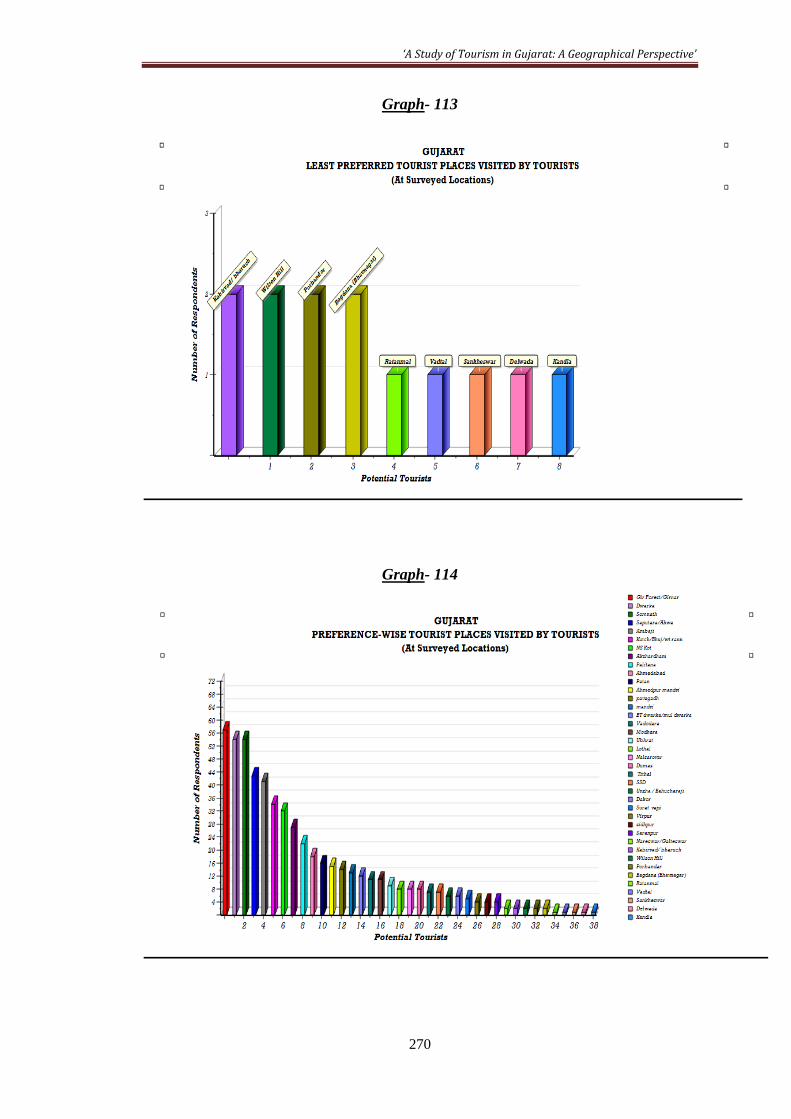
Table-74, deals about the preferred tourists places mentioned by a potential
tourist. Each individual has shown many choices accordingly on the basis of
frequency of choices made by tourist for similar locations the above table has been
prepared. During my field visit I came across total 39 tourist spots in Gujarat which
are arranged according to their frequency of choice. Data has been tabulated in three
rows and each divided into 13 columns. According to the preference made by tourist
the top ten locations in each category are taken into consideration to represent it with
the help of multiple bar Graphs i.e., Graph-110, Graph-111 and Graph-112. Among
all the Sasan Gir / Girnar is the most famous and favoured among them. It is followed
by Dwarka, Somnath, Saputara / Ahwa, Ambaji, Kutch / Bhuj / White Rann, Narayan
Sarovar / Koteshwar, Akhsardham, Palitana & Ahmedadab. These locations are also
the top most location where large number of tourists arrived every year as I have
discussed in the earlier sub chapters. In terms of tourism infrastructural development
and investments they are under the top most priority. The medium favoured tourist
locations. Among them the top one is Patan which is followed by Ahmedpur mandvi,
Pavagadh, Mandvi (Kutch), Bet Dwarka / Mul Dwarka, Vadodara, Modhera, Ubharat,
Lothal and Nalsarovar. Except Vadodara and Ahmedpur mandvi & Mandvi (Kutch)
none of the sites are having proper class facility & services for tourists which can
make them to stay longer. Mostly the day visitors are drawing more attentions. The
less favoured locations with respect to their priority include Dumas, Tithal, SSD,
Unzha / Bechraji, Dakor, Surat / Vapi, Virpur, Sidhpur, Saranpur & Nareshwar /
Galteshwar. These locations also visited mostly by day visitors for leisure purpose.
The fourth least preferred locations includes Kabirvad / Bharuch, Wilson Hill,
Porbandar, Bagdana, Ratanmahal, Vadtal, Sankheshwar, Delwada & Kandla. These
locations are preferred by only two or one tourists during the survey. Here it will be
worth to mention that in all prepared chart shows only top 10 locations in each
category that is High, Medium, Less and Least. The Graph-114 shows the position of
all these venues according to their preference level.

‘A Study of Tourism in Gujarat: A Geographical Perspective’
269
Graph- 110
Graph- 111
Graph- 112
‘A Study of Tourism in Gujarat: A Geographical Perspective’
270
Graph- 113
Graph- 114

‘A Study of Tourism in Gujarat: A Geographical Perspective’
271
8.6 IMPACT OF TOURISM ON MARKET DEVELOPMENT
AND SERVICES
Market development has the direct impact on tourism development. The basic
unit of market is a shop. Higher the variations in the shop, stronger will be the hold of
market on tourism attractions. Market does not only affect the tourists but also the
locals in terms of overall economic and social development. So, it is a threefold
pattern of development where the tourists, locals (service provider) and the
destination itself benefited. This part of survey includes the tabulation and graphical
representations of the collected data on shop keepers during field survey. Similar to
the earlier sub-chapter 8.3, I have selected ten most determined tourist locations in
Gujarat as for my sample study. Under this I have surveyed ten most essentially
needed shops on the basis of the potentiality to serve incoming tourists. the types of
shops included in my study are Tea & Breakfast, Restaurants, General stores,
Artificial ornaments, Photo-shops, Chemist & Druggists, Garments / Laundries, Toy
Shops, Electronics and Handicrafts. The questionnaire and personal interview method
are conducted at each of ten locations during my field visits. This study was made to
find that how much the tourism development in the area has impacted on market
development and help in expansions of services. This part also highlights the problem
and prospects of tourism development at same location and the things can be done to
get rid of from all those problems. Some of the questions are pertaining to general
views and some are on particular. Later for the final outcome was represented in the
form of tables and graphs. Qualitative explanations also done where, the
quantification of the data could not be possible. For this, total 100 questionnaires
were filled up. We will be discussing all these outcomes as per responded by shop
keepers.
Table-75
Workforce Engaged in Tourism
Service Activity
Age Group <20 20 - 40 40>
Total 13% 64% 23%
Table-75 deals with the workforce involve in service providing services. Age
wise classification has been done in table. From the Graph-115 it can be said that
almost 60% of employees belongs to 20-40 age groups which indicates more of young
and mature class populations. They provide the strongest workforce to the economic
development. During the field survey I have seen that this class is more energetic who

‘A Study of Tourism in Gujarat: A Geographical Perspective’
272
are providing more faster and efficient services to tourists. 23% of employees belong
to 40+ age groups while 13% were of below 20 age groups. From the earlier (earlier
chapters) and above discussions it can be said that there is a positive relationship
between number of tourist arrivals and young and mature class workforce engaged in
it.
Graph-115
Table-76
Mode of transport used for transportation of Goods
Type of
Vehicle used BC
Rick-
shaw HC T
Labour/
Lari Truck
Total 0% 17% 0% 56% 0% 28%
BC- Bullock Cart; HC- Horse Cart; T-Tempo.
Table-76 represents the mode of transport used to transport goods for shops.
Most of the employees said that 56% of them used Tempos while 28% use Trucks and
16% uses Rickshaw to transport needed goods. Most of shopkeepers also said that
they don’t use any of transportation services because the goods provider delivers the
goods on time.
Graph-116
‘A Study of Tourism in Gujarat: A Geographical Perspective’
273
Table-77
Length of Services (in years)
Years
since <1 1-2 2-3 3-4 4>
Total 0% 3% 9% 20% 67%
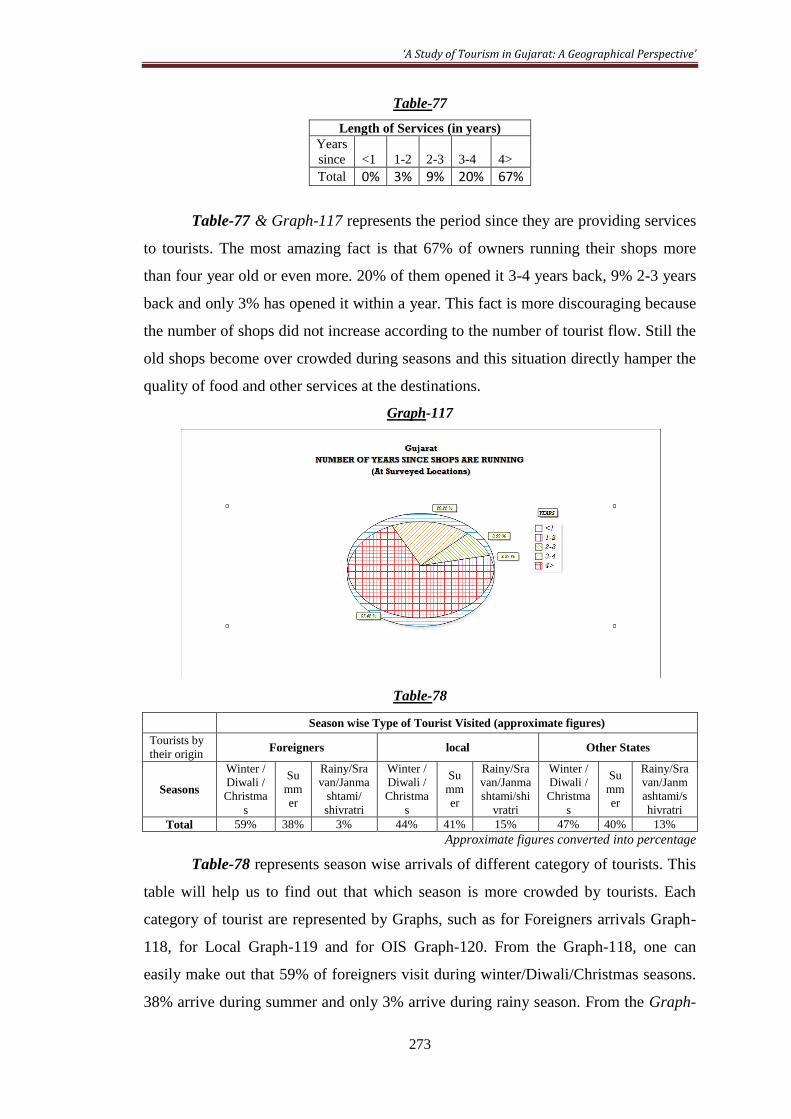
Table-77 & Graph-117 represents the period since they are providing services
to tourists. The most amazing fact is that 67% of owners running their shops more
than four year old or even more. 20% of them opened it 3-4 years back, 9% 2-3 years
back and only 3% has opened it within a year. This fact is more discouraging because
the number of shops did not increase according to the number of tourist flow. Still the
old shops become over crowded during seasons and this situation directly hamper the
quality of food and other services at the destinations.
Graph-117
Table-78
Season wise Type of Tourist Visited (approximate figures)
Tourists by
their origin Foreigners local Other States
Seasons
Winter /
Diwali /
Christma
s
Su
mm
er
Rainy/Sra
van/Janma
shtami/
shivratri
Winter /
Diwali /
Christma
s
Su
mm
er
Rainy/Sra
van/Janma
shtami/shi
vratri
Winter /
Diwali /
Christma
s
Su
mm
er
Rainy/Sra
van/Janm
ashtami/s
hivratri
Total 59% 38% 3% 44% 41% 15% 47% 40% 13%
Approximate figures converted into percentage
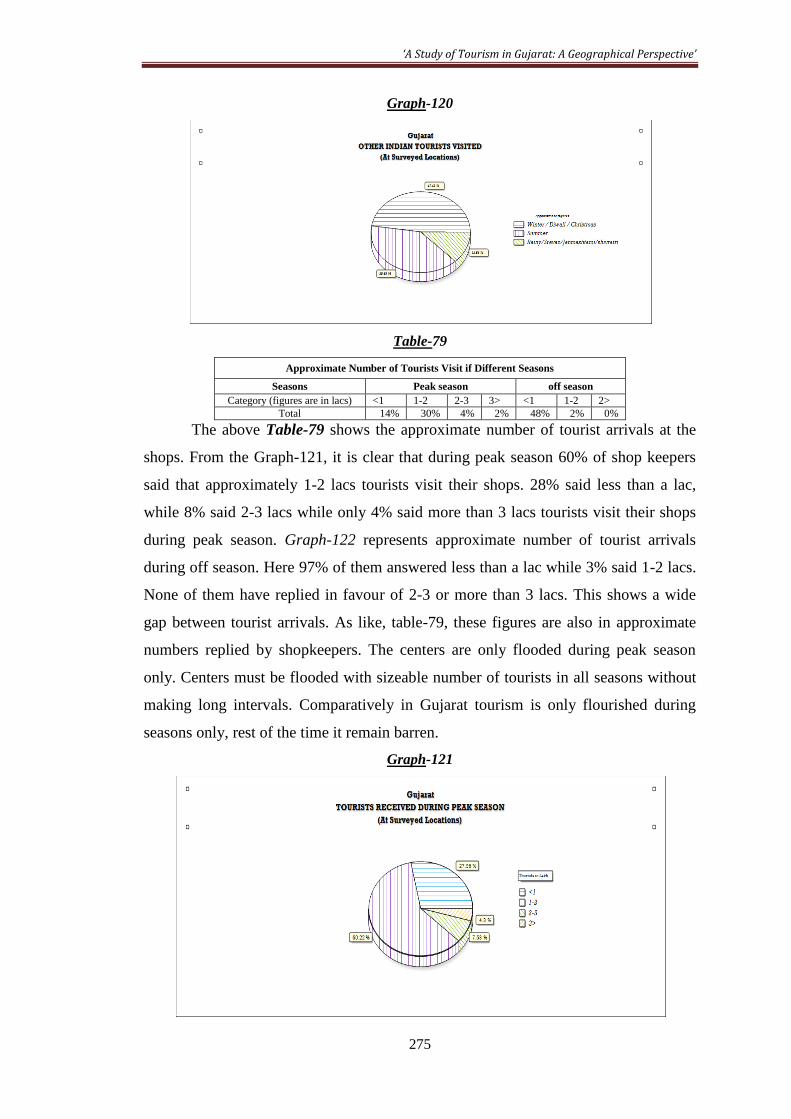
Table-78 represents season wise arrivals of different category of tourists. This
table will help us to find out that which season is more crowded by tourists. Each
category of tourist are represented by Graphs, such as for Foreigners arrivals Graph-
118, for Local Graph-119 and for OIS Graph-120. From the Graph-118, one can
easily make out that 59% of foreigners visit during winter/Diwali/Christmas seasons.
38% arrive during summer and only 3% arrive during rainy season. From the Graph-
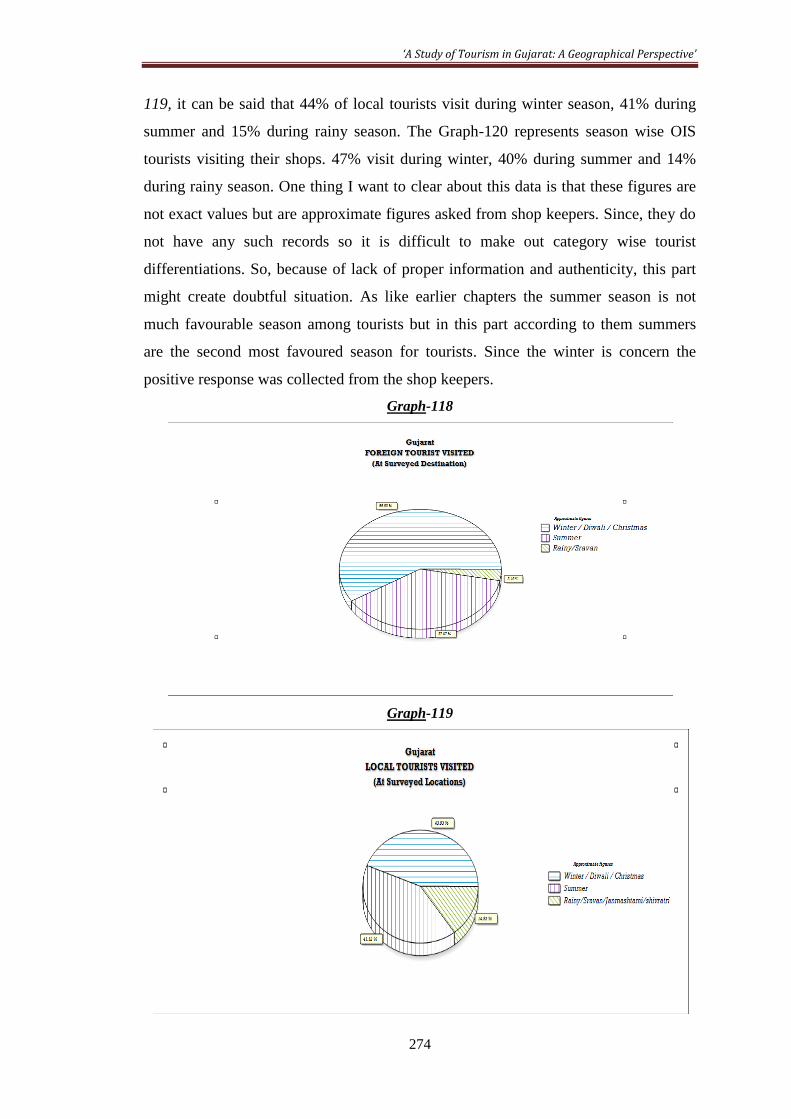
‘A Study of Tourism in Gujarat: A Geographical Perspective’
274
119, it can be said that 44% of local tourists visit during winter season, 41% during
summer and 15% during rainy season. The Graph-120 represents season wise OIS
tourists visiting their shops. 47% visit during winter, 40% during summer and 14%
during rainy season. One thing I want to clear about this data is that these figures are
not exact values but are approximate figures asked from shop keepers. Since, they do
not have any such records so it is difficult to make out category wise tourist
differentiations. So, because of lack of proper information and authenticity, this part
might create doubtful situation. As like earlier chapters the summer season is not
much favourable season among tourists but in this part according to them summers
are the second most favoured season for tourists. Since the winter is concern the
positive response was collected from the shop keepers.
Graph-118
Graph-119
‘A Study of Tourism in Gujarat: A Geographical Perspective’
275
Graph-120
Table-79
Approximate Number of Tourists Visit if Different Seasons
Seasons Peak season off season
Category (figures are in lacs) <1 1-2 2-3 3> <1 1-2 2>
Total 14% 30% 4% 2% 48% 2% 0%
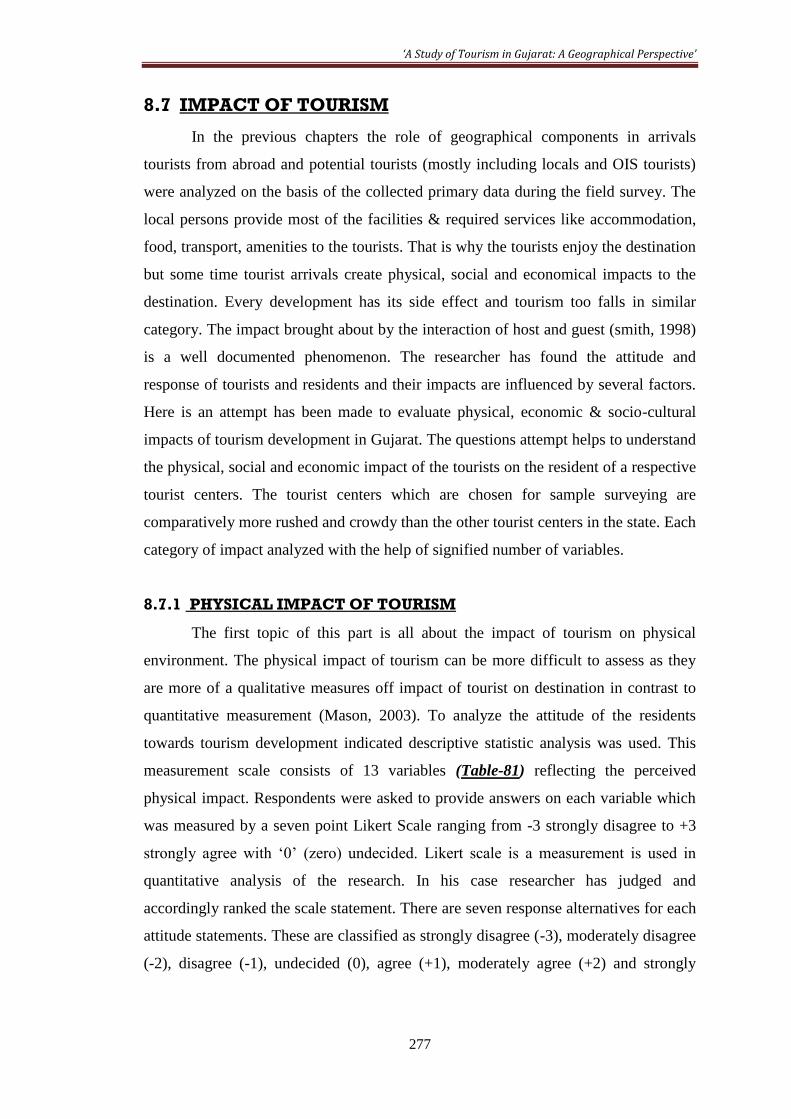
The above Table-79 shows the approximate number of tourist arrivals at the
shops. From the Graph-121, it is clear that during peak season 60% of shop keepers
said that approximately 1-2 lacs tourists visit their shops. 28% said less than a lac,
while 8% said 2-3 lacs while only 4% said more than 3 lacs tourists visit their shops
during peak season. Graph-122 represents approximate number of tourist arrivals
during off season. Here 97% of them answered less than a lac while 3% said 1-2 lacs.
None of them have replied in favour of 2-3 or more than 3 lacs. This shows a wide
gap between tourist arrivals. As like, table-79, these figures are also in approximate
numbers replied by shopkeepers. The centers are only flooded during peak season
only. Centers must be flooded with sizeable number of tourists in all seasons without
making long intervals. Comparatively in Gujarat tourism is only flourished during
seasons only, rest of the time it remain barren.
Graph-121

‘A Study of Tourism in Gujarat: A Geographical Perspective’
276
Graph-122
Table-80
Approx income (Figures are
in (000)/month
Income
Category <5 5-10 10>
Total 10% 65% 25%
Table 80 and the Graph-123, represents the approximate monthly income they
earn from this services. Shopkeepers could not revive their real income so the figures
are taken as approximate income. From the Graph it is clear that 65% of owners
replied Rs. 5000-10,000/ months while only 26% replied more than Rs. 10,000/
months they earn form service they provide. 9% of them also said that on an average
by the end of the months they could make only less than Rs. 5000/-. This indicates
that it is good that large %age of shopkeepers now coming under middle income
category. This is a positive sign towards economic development and vice-versa social
development too.
Graph-123
‘A Study of Tourism in Gujarat: A Geographical Perspective’
277
8.7 IMPACT OF TOURISM
In the previous chapters the role of geographical components in arrivals
tourists from abroad and potential tourists (mostly including locals and OIS tourists)
were analyzed on the basis of the collected primary data during the field survey. The
local persons provide most of the facilities & required services like accommodation,
food, transport, amenities to the tourists. That is why the tourists enjoy the destination
but some time tourist arrivals create physical, social and economical impacts to the
destination. Every development has its side effect and tourism too falls in similar
category. The impact brought about by the interaction of host and guest (smith, 1998)
is a well documented phenomenon. The researcher has found the attitude and
response of tourists and residents and their impacts are influenced by several factors.
Here is an attempt has been made to evaluate physical, economic & socio-cultural
impacts of tourism development in Gujarat. The questions attempt helps to understand
the physical, social and economic impact of the tourists on the resident of a respective
tourist centers. The tourist centers which are chosen for sample surveying are
comparatively more rushed and crowdy than the other tourist centers in the state. Each
category of impact analyzed with the help of signified number of variables.
8.7.1 PHYSICAL IMPACT OF TOURISM
The first topic of this part is all about the impact of tourism on physical
environment. The physical impact of tourism can be more difficult to assess as they
are more of a qualitative measures off impact of tourist on destination in contrast to
quantitative measurement (Mason, 2003). To analyze the attitude of the residents
towards tourism development indicated descriptive statistic analysis was used. This
measurement scale consists of 13 variables (Table-81) reflecting the perceived
physical impact. Respondents were asked to provide answers on each variable which
was measured by a seven point Likert Scale ranging from -3 strongly disagree to +3
strongly agree with ‘0’ (zero) undecided. Likert scale is a measurement is used in
quantitative analysis of the research. In his case researcher has judged and
accordingly ranked the scale statement. There are seven response alternatives for each
attitude statements. These are classified as strongly disagree (-3), moderately disagree
(-2), disagree (-1), undecided (0), agree (+1), moderately agree (+2) and strongly

‘A Study of Tourism in Gujarat: A Geographical Perspective’
278
agree (+3). Following, On the basis of seven point scale the graph is prepared to show
the impact for each variable.
Table-81
Category-wise Seven Point Scale Measurement of Impact of Tourism on Physical Environment
Ser No. Physical Impact
Strongly
Disagree
Moderately
disagree Disagree Undecided Agree
Moderately
agree
Strongly
agree
-3 -2 -1 0 1 2 3
1 Over Crowding and
Congestion 1% 8% 4% 0% 18% 41% 28%
2 Increase Noise and
Air Pollution 0% 0% 24% 0% 41% 29% 5%
3 Increasing Water
Pollution 0% 3% 6% 9% 27% 47% 6%
4
Good Quality of
Sewage and
Garbage Disposal 15% 28% 25% 1% 20% 8% 2%
5 Strain on Public
Utility Services 11% 3% 2% 3% 39% 21% 21%
6 Good Quality of
defecation facility 22% 24% 16% 1% 12% 13% 13%
7 Improved Road
Conditions 6% 6% 19% 0% 29% 17% 22%
8
Increased in The
Number of
Hotels/Dharmshalas 5% 2% 5% 2% 14% 22% 49%
9 Need of Separate
Place for Parking 0% 0% 0% 0% 5% 47% 48%
10
Problem in pure and
Adequate Water
Supply 3% 7% 11% 0% 34% 29% 16%
11 Development in
Basic Infrastructure 16% 17% 29% 0% 22% 9% 6%
12 Cleanliness 11% 23% 32% 0% 22% 9% 3%
13 Good Road
connectivity 0% 1% 11% 0% 57% 28% 3%
Average 7% 10% 14% 1% 26% 25% 17%
Graph-124

‘A Study of Tourism in Gujarat: A Geographical Perspective’
279
Graph-124, indicating the general perception of the residents and tourists
towards the pressure of population in terms of over-crowding & congestive stage of
the tourist place. 41% of tourists are moderately agree and say they don’t feel much
about congestion but as compare to earlier yes population has grown up. 28% are
strongly agreed about haphazard increase of population in last ten years. They find it
now become more congestive and pressure on physical infrastructures, are on rise.
Overall 69% of resident agreed upon population increase and they credit it to tourism
expansion at the center. There is a strong relationship between population and
infrastructure relationship. Increasing population would surely have greater impact on
infrastructure development so quality might be on decline. Very little %age of
resident were in dilemma and did not provide proper answer. Almost 12% were
disagreed upon increase of crowed.
Graph-125
The above Graph-125, prepared to make an attempt to find out perception of
residents towards impact of tourism on increase in noise and air pollution. This data is
fully based on towards perception of the residents there is nothing to do with the
actual level of air / noise pollution prevailed there. 41% of residents were agreed upon
upsurge in noise and air pollution. Increasing number of vehicles create unnecessary
nuisance and sometimes the visibility becomes too low. 29% of them were
moderately agreed upon rise in the level of pollution. Only 5% are strongly accepted
the rise of deterioration. Overall, 75% of the residents agreed upon increase in the
level of noise and air pollution. In terms of water quality none of them conceded with
positive response. Among them 24% were disagreed on rise of pollution level.

‘A Study of Tourism in Gujarat: A Geographical Perspective’
280
Actually these residents were staying outside of the main center of tourist destination.
While above who were surveyed staying at the hub of the centre.
Graph-126
Graph-126 represents the perception of the residents towards increase in water
pollution. 47% of residents were moderately agreed upon increasing water pollution.
During the survey it was found that mostly in coastal areas all residents were
complaining about the salty drinking water which is the biggest problem for tourists
for those who can’t afford the cost of water bottles every day. 6% of residents were
strongly mentioning about deteriorating water quality day by day. Almost, 81% of
tourists were agreed upon rising problem of water pollution. 9% also were found
neutral on water quality. 9% of residents have not admitted on rising water problems.
Graph-127
The above Graph-127, indicates the perception of residents towards good
quality of sewage and garbage disposal. Almost 30% of respondents gave positive
response while 68% were disagreed upon good quality of sewage and waste disposal.
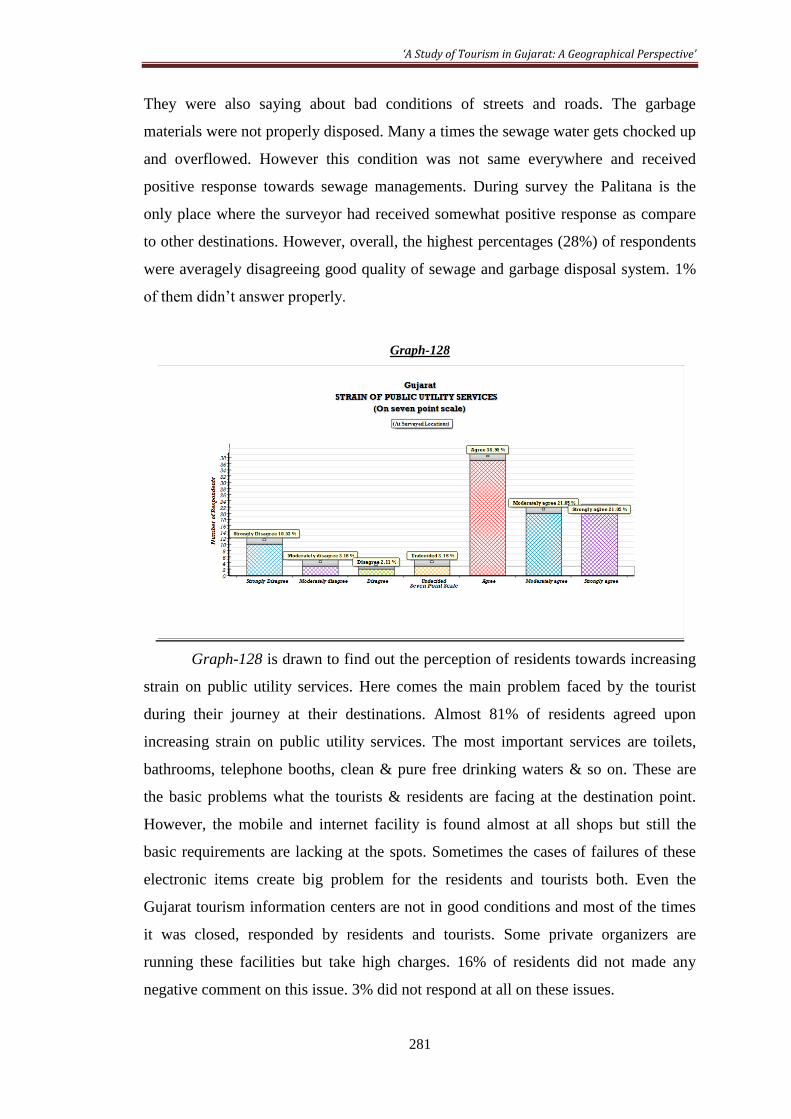
‘A Study of Tourism in Gujarat: A Geographical Perspective’
281
They were also saying about bad conditions of streets and roads. The garbage
materials were not properly disposed. Many a times the sewage water gets chocked up
and overflowed. However this condition was not same everywhere and received
positive response towards sewage managements. During survey the Palitana is the
only place where the surveyor had received somewhat positive response as compare
to other destinations. However, overall, the highest percentages (28%) of respondents
were averagely disagreeing good quality of sewage and garbage disposal system. 1%
of them didn’t answer properly.
Graph-128
Graph-128 is drawn to find out the perception of residents towards increasing
strain on public utility services. Here comes the main problem faced by the tourist
during their journey at their destinations. Almost 81% of residents agreed upon
increasing strain on public utility services. The most important services are toilets,
bathrooms, telephone booths, clean & pure free drinking waters & so on. These are
the basic problems what the tourists & residents are facing at the destination point.
However, the mobile and internet facility is found almost at all shops but still the
basic requirements are lacking at the spots. Sometimes the cases of failures of these
electronic items create big problem for the residents and tourists both. Even the
Gujarat tourism information centers are not in good conditions and most of the times
it was closed, responded by residents and tourists. Some private organizers are
running these facilities but take high charges. 16% of residents did not made any
negative comment on this issue. 3% did not respond at all on these issues.

‘A Study of Tourism in Gujarat: A Geographical Perspective’
282
Graph-129
The Graph-129 illustrates the resident perceptions towards good quality of
defecation facilities. The poor facility of toilets and defecation facilities are one of the
biggest problems faced not only by residents but also tourists surveyed. Few are there
but always stinking and once in a month or 15 days it is cleaned. Lacks of sweepers
are the main problems pointed by the residents. However, if they are appointed
thought government are not working properly. 62% of respondents were strongly
agreed upon stinking of toilets and bathrooms and pointed on immediate need of
defecation facilities. So many times they also made complain but no response in turn
was received. Except Palitana most of the tourist places were full of garbage and bad
conditioned toilets. Some private organizers are running these facilities but take high
charges. 1% of residents did not made any negative comment on this issue. 37% did
not respond negatively at all on these issues. They have given contradictory answers
these problems.
Graph-130

‘A Study of Tourism in Gujarat: A Geographical Perspective’
283
Graph-130 indicates about resident perception towards quality improvements
in road conditions. 22% of residents were strongly agreed upon improvement in road
conditions. Overall 68% of residents were happy in terms of road conditions and its
improvements. Many tourists viewed that they have not seen such good quality of
roads. Good road conditions make easy and efficient transport developments.
However, in terms of broadness there was disagreeness seen among tourists and
transporters. 32% of residents were against this improvement. According to them
these are not all weather roads and during rainy season lot of potholes formed on the
roads. Overcrowding of Lari’s & vendors sometimes closing the paths and tourists
and residents face difficulties through passing thereby.
Graph-131
Graph-131 represents the perceptions towards increasing number of hotels /
resorts / Dharmshalas. This indicates positive growth towards tourism growth of that
particular area. 49% of them strongly agreed upon high growth of means of
accommodations. Except Narayan Sarovar / Koteshwar almost at all places the
researcher has got positive response. Over 80% of residents agreed upon
overwhelming rise in hotel industry. However, most of these are dormitories, motels,
one or two star hotels. The basic problems residents acquainted with high range of
cost of stay that is tenfold rise in peak season as compare to the off season. During of
in-season, sometimes it becomes not affordable for a normal tourist. This can make a
negative impact on tourism growth. 3% of residents were not agreeing on increase of
hotel industry at the tourist centre.
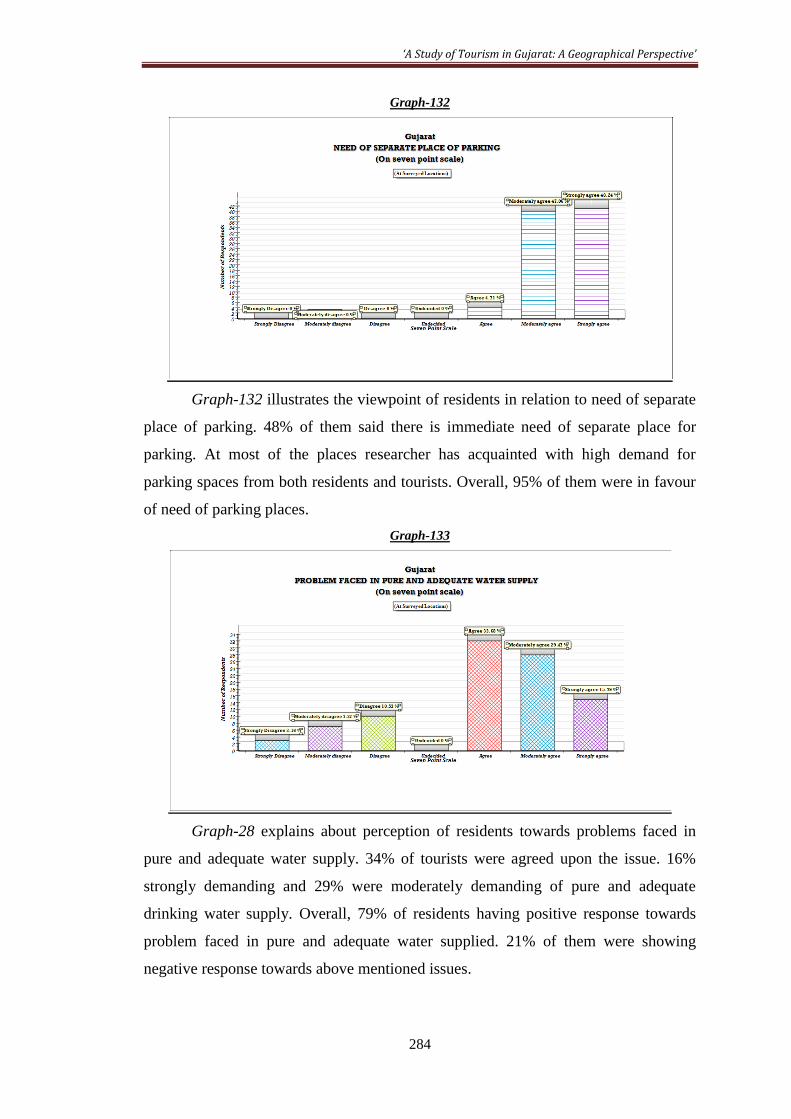
‘A Study of Tourism in Gujarat: A Geographical Perspective’
284
Graph-132
Graph-132 illustrates the viewpoint of residents in relation to need of separate
place of parking. 48% of them said there is immediate need of separate place for
parking. At most of the places researcher has acquainted with high demand for
parking spaces from both residents and tourists. Overall, 95% of them were in favour
of need of parking places.
Graph-133
Graph-28 explains about perception of residents towards problems faced in
pure and adequate water supply. 34% of tourists were agreed upon the issue. 16%
strongly demanding and 29% were moderately demanding of pure and adequate
drinking water supply. Overall, 79% of residents having positive response towards
problem faced in pure and adequate water supplied. 21% of them were showing
negative response towards above mentioned issues.
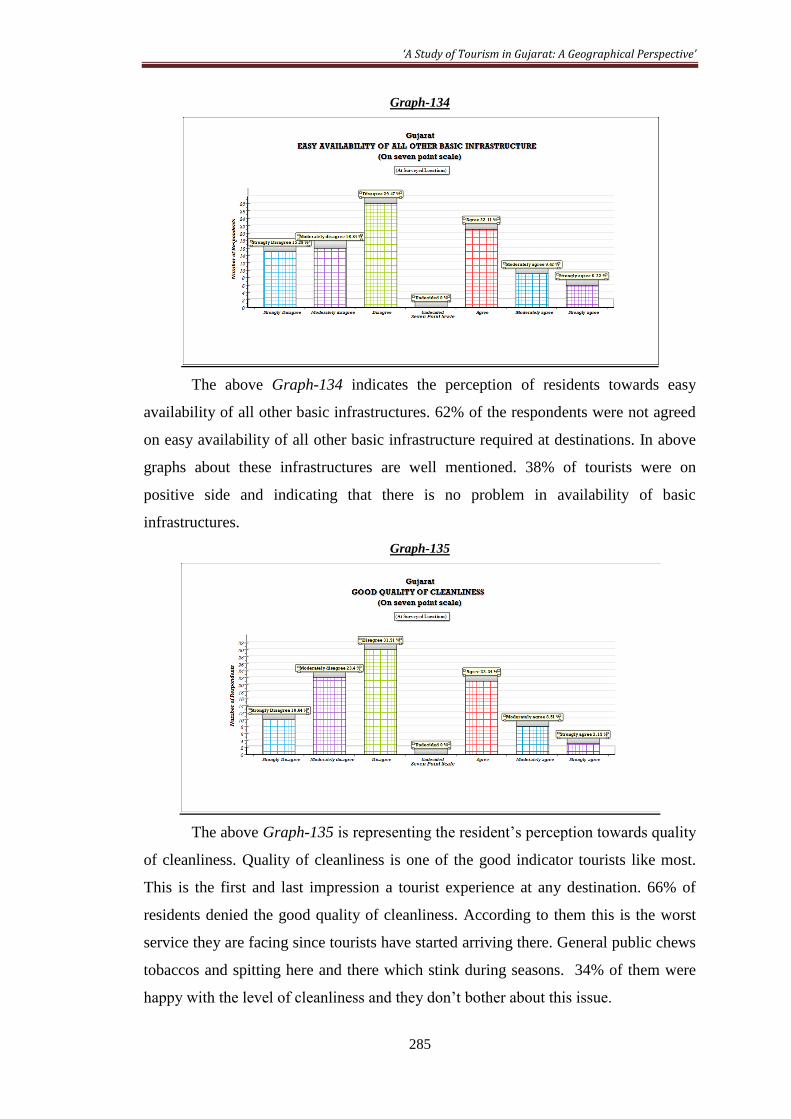
‘A Study of Tourism in Gujarat: A Geographical Perspective’
285
Graph-134
The above Graph-134 indicates the perception of residents towards easy
availability of all other basic infrastructures. 62% of the respondents were not agreed
on easy availability of all other basic infrastructure required at destinations. In above
graphs about these infrastructures are well mentioned. 38% of tourists were on
positive side and indicating that there is no problem in availability of basic
infrastructures.
Graph-135
The above Graph-135 is representing the resident’s perception towards quality
of cleanliness. Quality of cleanliness is one of the good indicator tourists like most.
This is the first and last impression a tourist experience at any destination. 66% of
residents denied the good quality of cleanliness. According to them this is the worst
service they are facing since tourists have started arriving there. General public chews
tobaccos and spitting here and there which stink during seasons. 34% of them were
happy with the level of cleanliness and they don’t bother about this issue.
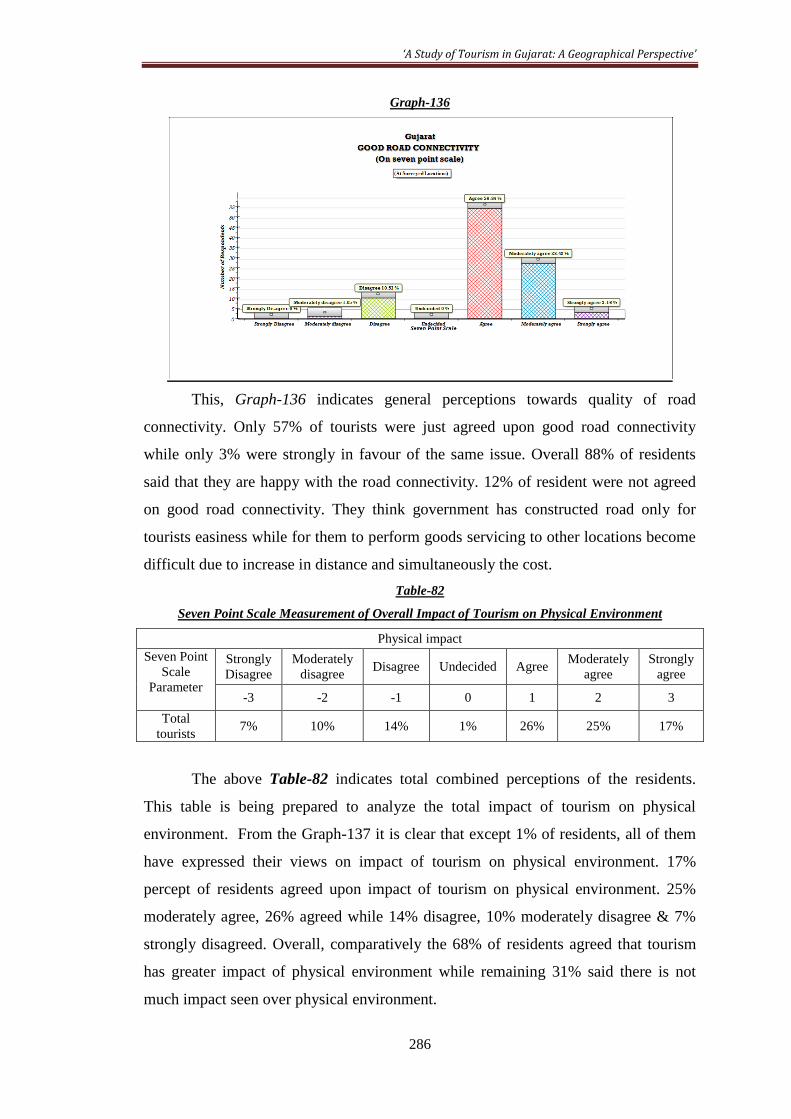
‘A Study of Tourism in Gujarat: A Geographical Perspective’
286
Graph-136
This, Graph-136 indicates general perceptions towards quality of road
connectivity. Only 57% of tourists were just agreed upon good road connectivity
while only 3% were strongly in favour of the same issue. Overall 88% of residents
said that they are happy with the road connectivity. 12% of resident were not agreed
on good road connectivity. They think government has constructed road only for
tourists easiness while for them to perform goods servicing to other locations become
difficult due to increase in distance and simultaneously the cost.
Table-82
Seven Point Scale Measurement of Overall Impact of Tourism on Physical Environment
Physical impact
Seven Point
Scale
Parameter
Strongly
Disagree
Moderately
disagree Disagree Undecided Agree
Moderately
agree
Strongly
agree
-3 -2 -1 0 1 2 3
Total
tourists 7% 10% 14% 1% 26% 25% 17%
The above Table-82 indicates total combined perceptions of the residents.
This table is being prepared to analyze the total impact of tourism on physical
environment. From the Graph-137 it is clear that except 1% of residents, all of them
have expressed their views on impact of tourism on physical environment. 17%
percept of residents agreed upon impact of tourism on physical environment. 25%
moderately agree, 26% agreed while 14% disagree, 10% moderately disagree & 7%
strongly disagreed. Overall, comparatively the 68% of residents agreed that tourism
has greater impact of physical environment while remaining 31% said there is not
much impact seen over physical environment.

‘A Study of Tourism in Gujarat: A Geographical Perspective’
287
Graph-137
Finally, after a study of different perception of the residents it can be said that
physical congestion experienced at the destination. Congestions increase demand for
natural resources and also contributes to source of solid waste residual which creates
the problem of air, water and noise pollution, degradation of environmental factors
(quality of cleanliness), growth and development of hotel accommodation, problem of
parking, pure and adequate water supplies, strain on public utility services,
restaurants, recreation & other required basic infrastructure facilities. . Side by side it
has some positive impact on road & communication infrastructure such as
improvement in road connectivity and efficiency, maintenance of holly places,
beautification of tourist places and overall improvements in general community
residing there. Generally arrivals of mass tourists during in season is a great deal of
waste such as plastic bottles, bags, cups, garbage, food wastage and so on, degrade the
environmental quality. Physical appearances are the first and last impression
experienced by tourists at the destination, so, there is an immediate need to maintain
the quality and quantity of related infrastructure.
8.7.2 ECONOMIC IMPACT OF TOURISM
Tourism is a basic element for the change in economic conditions of the local
people. Tourism as an industry has great economic impacts on the host community.
Here in this study the tourist expenditure data has not been taken into consideration.
To analyze economic impact same 7 scale parameter has been taken into
consideration. Total Ten indicators selected and each of them measured on seven
point scale on the basis of strength of resident’s perception towards economic
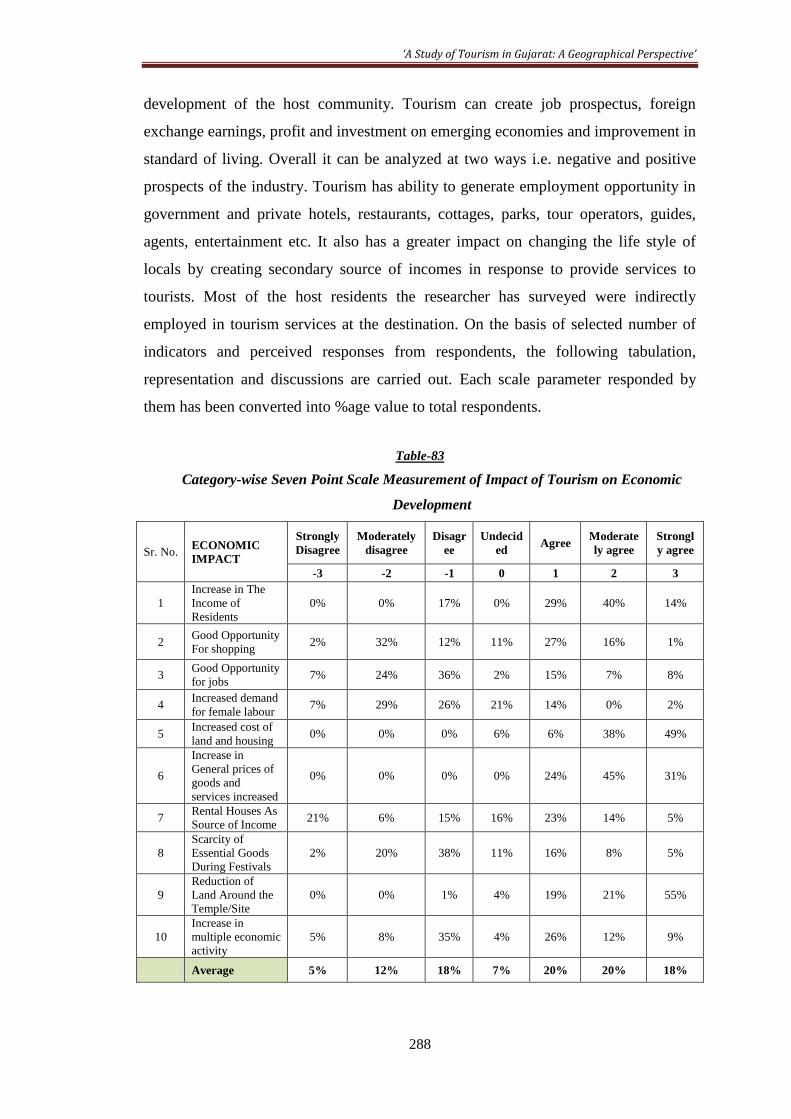
‘A Study of Tourism in Gujarat: A Geographical Perspective’
288
development of the host community. Tourism can create job prospectus, foreign
exchange earnings, profit and investment on emerging economies and improvement in
standard of living. Overall it can be analyzed at two ways i.e. negative and positive
prospects of the industry. Tourism has ability to generate employment opportunity in
government and private hotels, restaurants, cottages, parks, tour operators, guides,
agents, entertainment etc. It also has a greater impact on changing the life style of
locals by creating secondary source of incomes in response to provide services to
tourists. Most of the host residents the researcher has surveyed were indirectly
employed in tourism services at the destination. On the basis of selected number of
indicators and perceived responses from respondents, the following tabulation,
representation and discussions are carried out. Each scale parameter responded by
them has been converted into %age value to total respondents.
Table-83
Category-wise Seven Point Scale Measurement of Impact of Tourism on Economic
Development
Sr. No. ECONOMIC
IMPACT
Strongly
Disagree
Moderately
disagree
Disagr
ee
Undecid
ed Agree
Moderate
ly agree
Strongl
y agree
-3 -2 -1 0 1 2 3
1
Increase in The
Income of
Residents
0% 0% 17% 0% 29% 40% 14%
2 Good Opportunity
For shopping 2% 32% 12% 11% 27% 16% 1%
3 Good Opportunity
for jobs 7% 24% 36% 2% 15% 7% 8%
4 Increased demand
for female labour 7% 29% 26% 21% 14% 0% 2%
5 Increased cost of
land and housing 0% 0% 0% 6% 6% 38% 49%
6
Increase in
General prices of
goods and
services increased
0% 0% 0% 0% 24% 45% 31%
7 Rental Houses As
Source of Income 21% 6% 15% 16% 23% 14% 5%
8
Scarcity of
Essential Goods
During Festivals
2% 20% 38% 11% 16% 8% 5%
9
Reduction of
Land Around the
Temple/Site
0% 0% 1% 4% 19% 21% 55%
10
Increase in
multiple economic
activity
5% 8% 35% 4% 26% 12% 9%
Average 5% 12% 18% 7% 20% 20% 18%

‘A Study of Tourism in Gujarat: A Geographical Perspective’
289
Graph-138
The Graph-138 represents the perception of residents towards increase in the
income of residents on seven point scale. This parameter has a direct impact on
economic development of the hosts. 40% of them moderately responded in favour of
increase in income, 29% just agreed while only 14% has shown strong favourism
towards improvement in income of residents. Overall, 83% of residents said yes, it
helps in economical growth comparatively. 17% of them answered no, means no any
positive growth in income they received yet.
Graph-139
Graph-139 talks about perception of residents towards situation of opportunity
of shopping. This has a direct relation with creation of employment at the host
destination. Locals had great opportunity for buying / renting shops and serving

‘A Study of Tourism in Gujarat: A Geographical Perspective’
290
tourists. However, this opportunity was not established everywhere. So, variations in
responses are received. 27% of the residents agreed and 16% moderately agreed while
very little that is only 1% strongly agreed on good opportunities of shopping. Total
44% of them agreed on good opportunity of shopping complexes available there. 45%
of residents saying that no well furnished shopping malls exist at most of the
destinations. Shopkeepers, sometimes have to put their shops on streets and footpaths
which create lots of inconvenience for the tourists. Most of the economy class tourists
buy the products from these vendors and create disturbance & mismanagement over
entire location. Even if they are, their products are too costly. The cost of food &
drinking water is too high, which sometimes are not affordable by common tourists.
11% responses were neutral, which indicates, not much interest shown in terms of
need of shopping malls.
Graph-140
Graph-140 illustrates about their perception towards opportunity for
employment. Actually, there are two type of employment in the tourism, direct and
indirect & most of the residents might have answered thinking about direct
employment opportunity. That is why there was contradictory answers where
perceived. Direct jobs are actual full-time positions created by business. Indirect jobs
are created by other businesses that come into existence due to the economic growth
of your business. Most of the employees are independent contractors so they won’t
fall under direct employment category. From the graph it can be said that 31% of
residents agreed upon good opportunity of employment while 67% said no direct job
opportunity found at the hot destination. They earn their income independently.
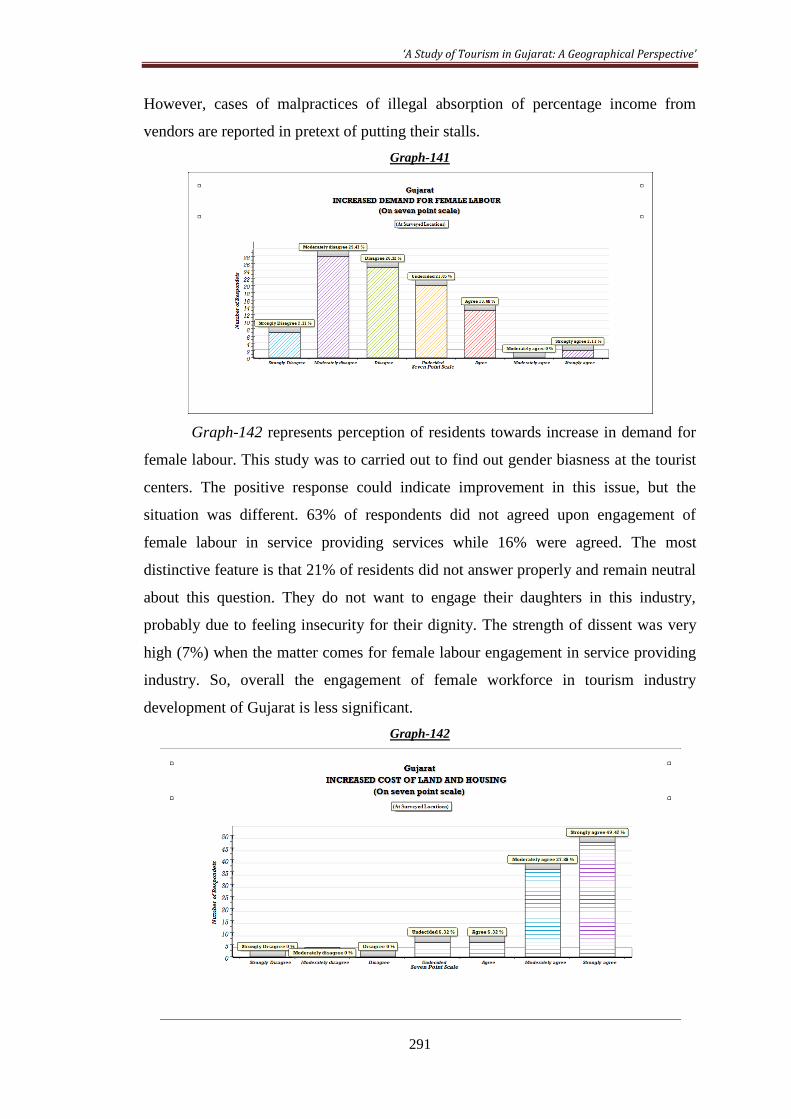
‘A Study of Tourism in Gujarat: A Geographical Perspective’
291
However, cases of malpractices of illegal absorption of percentage income from
vendors are reported in pretext of putting their stalls.
Graph-141
Graph-142 represents perception of residents towards increase in demand for
female labour. This study was to carried out to find out gender biasness at the tourist
centers. The positive response could indicate improvement in this issue, but the
situation was different. 63% of respondents did not agreed upon engagement of
female labour in service providing services while 16% were agreed. The most
distinctive feature is that 21% of residents did not answer properly and remain neutral
about this question. They do not want to engage their daughters in this industry,
probably due to feeling insecurity for their dignity. The strength of dissent was very
high (7%) when the matter comes for female labour engagement in service providing
industry. So, overall the engagement of female workforce in tourism industry
development of Gujarat is less significant.
Graph-142

‘A Study of Tourism in Gujarat: A Geographical Perspective’
292
Graph-142 is about perception towards increased cost of land and housing.
Study of this parameter actually, to find out the economic pressure on the residents.
49% of residents strongly agreed upon high cost of land around site. 38% moderately
agreed. Overall almost 94% of residents faced the problem of buying property near
the core site. This is a universal phenomenon that the cost of land prices increase from
main centre to outside which also becomes true in tourism development.
Graph-143
The above Graph-143 acknowledges the level of perception towards increase
in general prices of goods and services. This is also a universal phenomenon, where
the general prices of goods and services increase rampantly. All the residents were
agreed upon rising prices of goods and services. There are big range of prices of
goods are seen, dependent on class of business activity. High class business leads to
high prices while low class business leads to normal prices. However, quality might
be a question. According to residents there is many fold increase of prices seen at
these tourist centers in comparison to other normal locations.
Graph-144

‘A Study of Tourism in Gujarat: A Geographical Perspective’
293
Graph-144 represents resident’s perceptions towards whether they are
temporarily renting their houses for the extra source of income or not. As per their
responses 16% of them did not know about such things. This might be possible that
these 16% are not revealing truth due to taxation problems. 21% were strongly
disagreed while 5% strongly agreed upon this issue. So the weight of dissent was
higher. Overall, 42% of them said yes they and other provide accommodation to
tourists. 42% said no they don’t provide such facilities. So the half-half situation
arises in terms of overall consent on providing residential accommodation. In
Somnath & Narayan Sarovar & Sasan Gir the researcher has found this type of
provision. In Somnath the research aquainted with such type of hoteliers and they said
that there is no other option remains for them because the government has taken over
all the profitable jobs from these residents.
Graph-145
Table-145 indicates about perception of residents towards scarcity of essential
goods during season. 60% of respondents denied and said there is no scarcity during
needy hours. They did not felt any time scarcity of goods. 29% of them said yes
sometimes when tourists overflowed beyond the limited capacity on festive days then
scarcity prevailed. Overall the situation indicates towards sufficient availability of
goods for tourists at any time. 11% of residents could not decide it in positive or
negative sense.
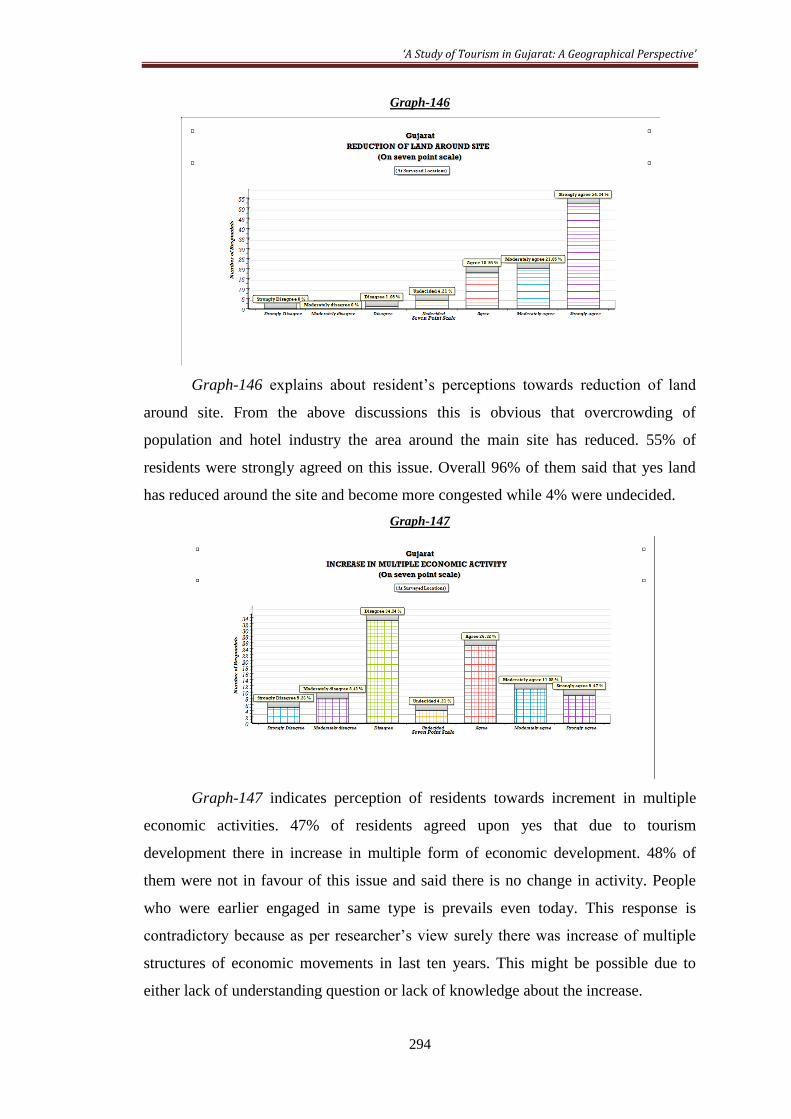
‘A Study of Tourism in Gujarat: A Geographical Perspective’
294
Graph-146
Graph-146 explains about resident’s perceptions towards reduction of land
around site. From the above discussions this is obvious that overcrowding of
population and hotel industry the area around the main site has reduced. 55% of
residents were strongly agreed on this issue. Overall 96% of them said that yes land
has reduced around the site and become more congested while 4% were undecided.
Graph-147
Graph-147 indicates perception of residents towards increment in multiple
economic activities. 47% of residents agreed upon yes that due to tourism
development there in increase in multiple form of economic development. 48% of
them were not in favour of this issue and said there is no change in activity. People
who were earlier engaged in same type is prevails even today. This response is
contradictory because as per researcher’s view surely there was increase of multiple
structures of economic movements in last ten years. This might be possible due to
either lack of understanding question or lack of knowledge about the increase.

‘A Study of Tourism in Gujarat: A Geographical Perspective’
295
Table-84
Seven Point Scale Measurement of Overall Impact of Tourism on Economic Development
ECONOMIC IMPACT
Seven
Point
Scale
Strongly
Disagree
Moderately
disagree Disagree Undecided Agree
Moderately
agree
Strongly
agree
-3 -2 -1 0 1 2 3
Total 5% 12% 18% 7% 20% 20% 18%
Graph 148 is the representation of the Table-84, which is showing the total
combined perceptions of the residents on each measured scale. This table is being
prepared to analyze the total impact of tourism on economic improvement of the
residents. In general 7% of the residents did not respond any answer and remain
undecided, while 18% strongly agree on overall all improvement in economic
conditions of the destinations. Moderately agreed & just agreed comprises 20% each
of the residents. 5% of them strongly oppose in economic development. 12% were
moderately denying while 18% were found disagreed on overall economic
development. Overall if we look at positive side then 58% acknowledges the overall
development while only 35% did not acknowledge any economic improvement in the
region. So, finally we may reach on concluding remark that percentage of resident’s
perception towards economic development is much positive.
Graph-148

‘A Study of Tourism in Gujarat: A Geographical Perspective’
296
8.7.3 SOCIO-CULTURAL IMPACT OF TOURISM
Tourism is a type of industry that has many social and cultural consequences.
Tourism in general has a greater impact both in positive and negative socio cultural
development on the host community. The tourism does not only benefit for the
development of society but also interaction between them promotes socio-cultural
transformations. Tourism brings high level of cultural assimilation and proficiency of
behavior and knowledge. Tourist expenditure becomes a great source of income for
the local residents, such as purchasing food and beverage, transport and
communication, accommodation (rental houses) entertainment services, required
goods from retail shops and travel guides etc. earning through tourism becomes a
great source of social development, it could minimize the crime rate at the host
society. Today, tourists need more fast services, like to experience every bit of time at
the destination while the locals are more of permanent & stay for longer time so they
are better in knowledge about tourist demands and will be more suitable to fulfill the
needs of tourists. In general the impact of tourism on socio-cultural development
refers change the quality of life of residents at the center. In the present topic to
analyze the attitude of the residents towards tourism development indicated
descriptive statistic analysis was used. This measurement scale consists of 12
variables (Table-85) reflecting the perceived socio-cultural impact. Respondents were
asked to provide answers on each variable which was measured on seven point Likert
Scale ranging from -3 strongly disagree to +3 strongly agree with ‘0’ (zero)
undecided. There are seven response alternatives for each attitude statements. These
are classified as strongly disagree (-3), moderately disagree (-2), disagree (-1),
undecided (0), agree (+1), moderately agree (+2) and strongly agree (+3). Following,
On the basis of seven point scale the graph is prepared to show the impact for each
variable.
Table-85
Category-wise Seven Point Scale Measurement of Impact of Tourism on Social Development
Sr.
No.
SOCIO-
CULTURAL
IMPACT
Strongly
Disagree
Moderate
ly
disagree
Disagre
e
Undecid
ed
Agre
e
Moderatel
y agree
Strongl
y agree
-3 -2 -1 0 1 2 3
1
Increased in density
of population in the
town / villages
2% 0% 17% 8% 24% 41% 7%
2 Improved Quality
of police protection 1% 7% 29% 2% 38% 11% 12%
3 Increase in Strain
on police protection 0% 6% 9% 3% 59% 21% 2%

‘A Study of Tourism in Gujarat: A Geographical Perspective’
297
4 Increase in crime
rate 1% 16% 16% 0% 23% 44% 0%
5
Commercialization
of traditions and
customs
16% 27% 16% 6% 19% 14% 2%
6
Increase in
language
proficiency
0% 5% 7% 2% 37% 40% 8%
7 Improvement in
Health condition 12% 1% 16% 33% 19% 11% 9%
8
Improvement in
Education
development
8% 0% 9% 2% 52% 24% 4%
9
Change in
Occupational
Structure
0% 1% 17% 8% 31% 41% 2%
10
Place leads to
maintain its
traditionalize
culture
8% 40% 16% 14% 12% 8% 2%
11
Positive Roll of
GTCL in the
development of this
tourist centre
33% 6% 13% 11% 25% 2% 11%
12 Spreading of
epidemics 3% 17% 13% 54% 7% 6% 0%
Average 7% 11% 15% 12% 29% 22% 5%
Graph-149
The Graph-149 indicates about perceptions of residents towards increase in
the density of population. In the first part I have already discussed about increase of
population and that was in context with the physical impact of pressure of population.
Here in this part density of population is taken as one of the indicator to find out
pressure on social well beings at the destinations. Increasing density of population
sometimes leads to increase in crime rate, such as stealing and pick pocketing like
anti-social activity. From the graph it is clear that 41% of the residents were
moderately agreed upon increase in density of population, while 7% strongly favoured
the issue. Over and all total 73% of them replied in positive sense, while 25%

‘A Study of Tourism in Gujarat: A Geographical Perspective’
298
responded in negative sense. 8% of them did not reply on this issue. According to
them this increase of density is due to tourist arrival not in the local residents.
Graph-150
Graph-150 indicates the perceptions of residents towards improvement in the
quality of police protection. 38% of them agreed that yes the quality has improved.
12% were strongly agreed & 11% indicate moderate acceptance. Overall 60% of the
residents said ‘yes’ while 38% were against the quality of police protection. Looking
to the importance of the tourist place the quality of police protection has been
upgraded. In small location residents were not satisfied. Such as at Mandvi most of
the residents were against this quality improvement while in Dwarka they were in
favour of improvement in quality of police protection. In general we can say that still
lots of emphasis needed to improve the quality of protection by police.
Graph-151
The above Graph-151 indicates the perception of residents towards increase in
strain on police protection. This indicator was used to find out the pressure on police

‘A Study of Tourism in Gujarat: A Geographical Perspective’
299
protection. 82% of the residents were agreed upon increasing strain on police
protection at the destination. Being a well recognized tourist place the complaints are
frequent that leads to lots of strain on their services. Besides, lack of proper
infrastructure, vehicles, constables, well equipped arm forces, some time leads to
disruption in the smooth running of services. 14% of the residents were not in favour
of any strain on police protection while 3% were denied to comment on this issue.
Graph-152
Graph-152 represents the degree of perceptions of residents towards increase
in crime rate. From the above discussions it is clear that high prevalence of density of
population might leads to high strain on police protection which may lead to increase
in crime rate at the destination. 44% of them were moderately agreed upon growth of
crime rate while only 23% were just agreed. Around 33% of the residents said ‘no’,
they did not felt any such situation and in general the situation is same as it was
earlier. If we look at overall figure then total 67% of them accepting increase of crime
rate while 33% disagree.
Graph-153
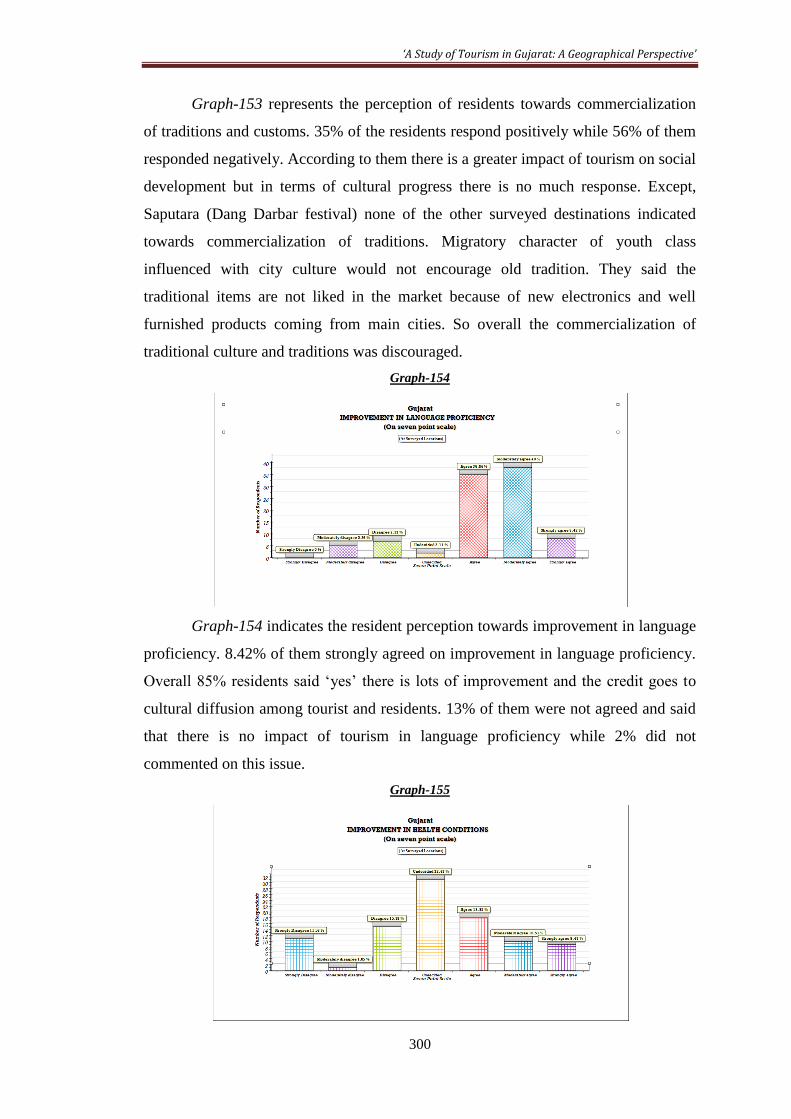
‘A Study of Tourism in Gujarat: A Geographical Perspective’
300
Graph-153 represents the perception of residents towards commercialization
of traditions and customs. 35% of the residents respond positively while 56% of them
responded negatively. According to them there is a greater impact of tourism on social
development but in terms of cultural progress there is no much response. Except,
Saputara (Dang Darbar festival) none of the other surveyed destinations indicated
towards commercialization of traditions. Migratory character of youth class
influenced with city culture would not encourage old tradition. They said the
traditional items are not liked in the market because of new electronics and well
furnished products coming from main cities. So overall the commercialization of
traditional culture and traditions was discouraged.
Graph-154
Graph-154 indicates the resident perception towards improvement in language
proficiency. 8.42% of them strongly agreed on improvement in language proficiency.
Overall 85% residents said ‘yes’ there is lots of improvement and the credit goes to
cultural diffusion among tourist and residents. 13% of them were not agreed and said
that there is no impact of tourism in language proficiency while 2% did not
commented on this issue.
Graph-155
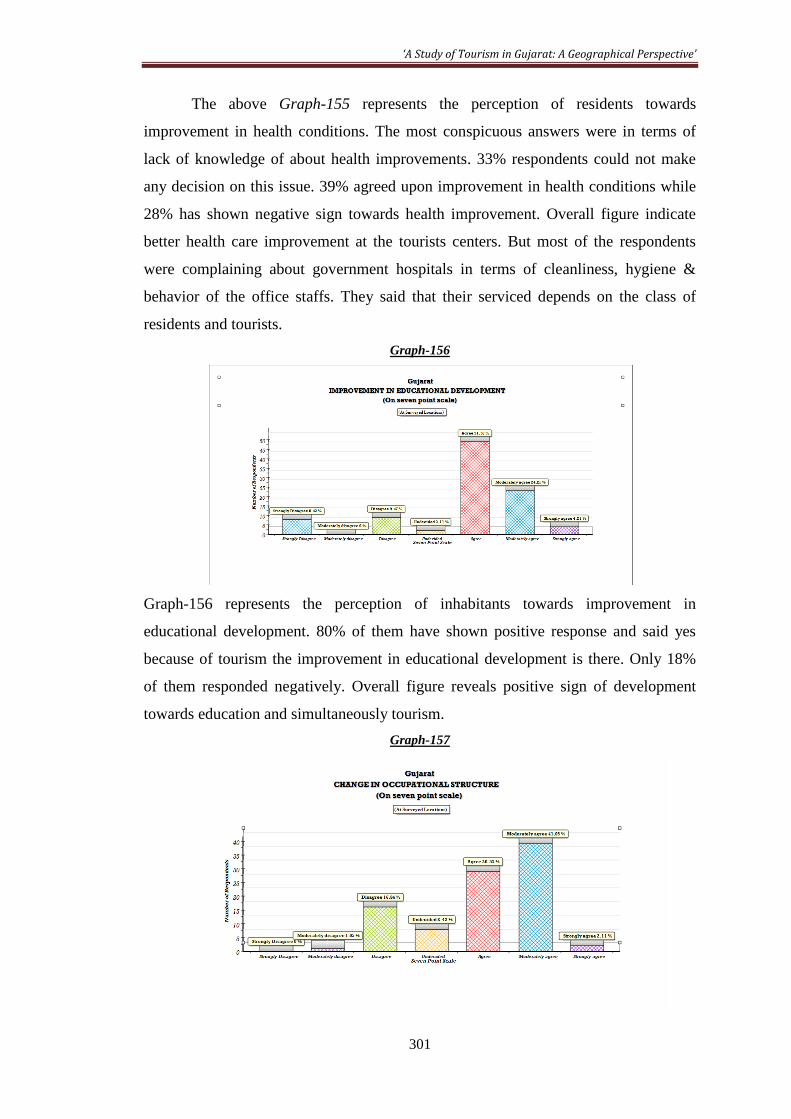
‘A Study of Tourism in Gujarat: A Geographical Perspective’
301
The above Graph-155 represents the perception of residents towards
improvement in health conditions. The most conspicuous answers were in terms of
lack of knowledge of about health improvements. 33% respondents could not make
any decision on this issue. 39% agreed upon improvement in health conditions while
28% has shown negative sign towards health improvement. Overall figure indicate
better health care improvement at the tourists centers. But most of the respondents
were complaining about government hospitals in terms of cleanliness, hygiene &
behavior of the office staffs. They said that their serviced depends on the class of
residents and tourists.
Graph-156
Graph-156 represents the perception of inhabitants towards improvement in
educational development. 80% of them have shown positive response and said yes
because of tourism the improvement in educational development is there. Only 18%
of them responded negatively. Overall figure reveals positive sign of development
towards education and simultaneously tourism.
Graph-157
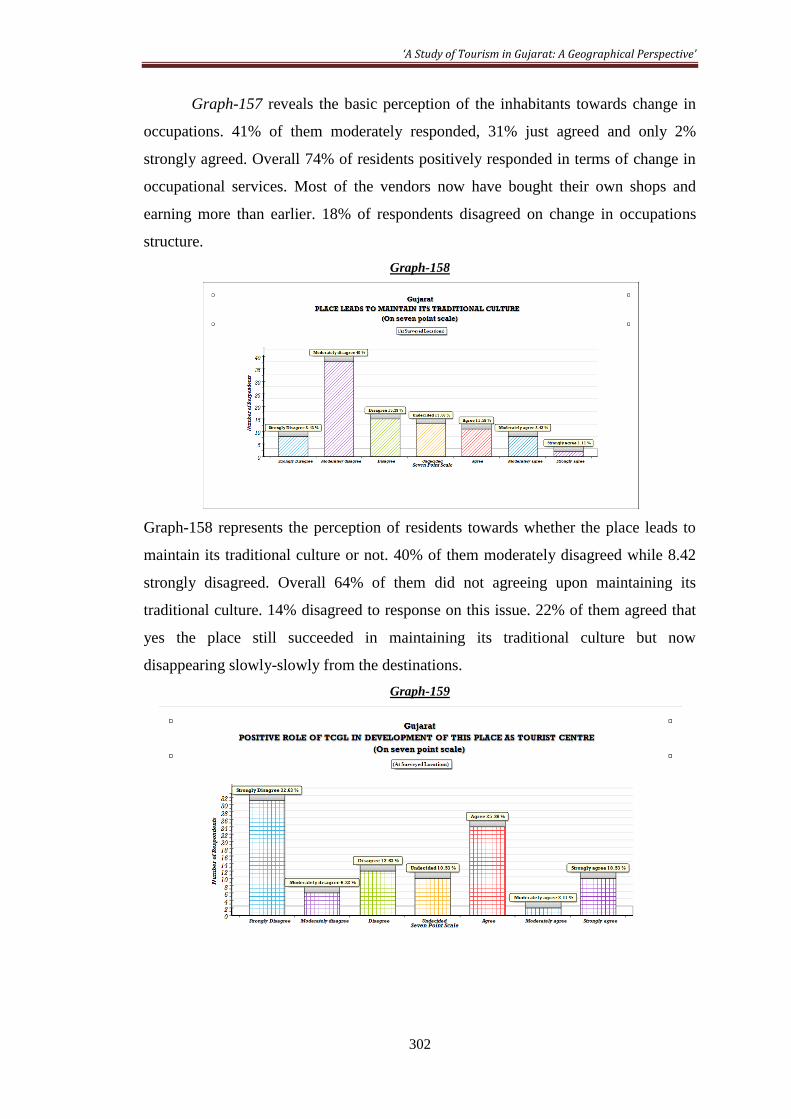
‘A Study of Tourism in Gujarat: A Geographical Perspective’
302
Graph-157 reveals the basic perception of the inhabitants towards change in
occupations. 41% of them moderately responded, 31% just agreed and only 2%
strongly agreed. Overall 74% of residents positively responded in terms of change in
occupational services. Most of the vendors now have bought their own shops and
earning more than earlier. 18% of respondents disagreed on change in occupations
structure.
Graph-158
Graph-158 represents the perception of residents towards whether the place leads to
maintain its traditional culture or not. 40% of them moderately disagreed while 8.42
strongly disagreed. Overall 64% of them did not agreeing upon maintaining its
traditional culture. 14% disagreed to response on this issue. 22% of them agreed that
yes the place still succeeded in maintaining its traditional culture but now
disappearing slowly-slowly from the destinations.
Graph-159

‘A Study of Tourism in Gujarat: A Geographical Perspective’
303
Graph-159 representing the perceptions of residents towards positive role of
TCGL in developing this particular area as a tourist centre. It was shocking to know
that most of them do not know about this organization. They only know this as a
government work. This may be reason that unconsciously gave confusing answers.
From the above formulated graph, 33% of residents showing strong disagreement
towards role of TCGL while 13% just disagreed. In totality 52% of them have shown
negative response. 11% did not commented on this issue. 38% of residents have
shown positive response. In conclusion we can say that the role of government is seen
only on TV/add and news papers. In reality, they have no identity among locals of the
destinations. Some of the residents also raised the questions on their dignity and work.
Graph-160
Graph-160 indicates the basic perception of the inhabitants towards frequency
of spreading epidemics. For this question most of the respondent shown disconcert.
54% of the residents are showing neutral response. Overall only 14% of residents said
‘yes’ sometimes it happens but not every time. 33% of them responded negatively.
This means in terms of health hazard, respondents are well aware and according to
them no big casualties found in their time. In terms of health conditions the situation
is much better.
Table-86
Seven Point Scale Measurement of Overall Impact of Tourism on Social Development
SOCIO-CULTURAL IMPACT
Seven
Point Scale
Strongly
Disagree
Moderately
disagree Disagree Undecided Agree
Moderately
agree
Strongly
agree
-3 -2 -1 0 1 2 3
Total 7% 11% 15% 12% 29% 22% 5%

‘A Study of Tourism in Gujarat: A Geographical Perspective’
304
Graph-161
Graph-161 is the representation of the table-86, which is showing the total
combined perceptions of the residents on each measured seven point scale. This table
is being prepared to analyze the total impact of tourism on socio-cultural
improvement of the residents. In general 12% of the residents did not respond any
answer and remain undecided, while only 5% strongly agreed on overall all
improvement in socio-cultural improvement at the destination. 22% of them
moderately agreed while 29% just agreed showing. In totality 56% of respondents
answered in positive sense. 7% of them showing strong disagreement, 11% shows
moderate disagreement and 15% indicate no agreement. In totality 33% of them have
shown disagreement towards socio-cultural progress of the resident. If we look at the
comparative figures of negative and positive responses then the positive growth in
social and cultural aspects tourism achieved.